Back to Journals » Pharmacogenomics and Personalized Medicine » Volume 14
Influential Factors and Efficacy Analysis of Tacrolimus Concentration After Allogeneic Hematopoietic Stem Cell Transplantation in Children with β-Thalassemia Major
Authors Li C, Lu J, Zhou S, Wei Y, Lv C, Liu T, Wu Y, Wu D, Qi J, Cai R
Received 1 July 2021
Accepted for publication 15 September 2021
Published 24 September 2021 Volume 2021:14 Pages 1221—1237
DOI https://doi.org/10.2147/PGPM.S325103
Checked for plagiarism Yes
Review by Single anonymous peer review
Peer reviewer comments 2
Editor who approved publication: Dr Martin H Bluth
Chengxin Li,* Jiejiu Lu,* Siru Zhou, Yinyi Wei, Chunle Lv, Taotao Liu, Yun Wu, Dongni Wu, Jianying Qi, Rongda Cai
Department of Pharmacy, The First Affiliated Hospital of Guangxi Medical University, Nanning, Guangxi Province, People’s Republic of China
*These authors contributed equally to this work
Correspondence: Taotao Liu
Department of Pharmacy, The First Affiliated Hospital of Guangxi Medical University, No. 6 Shuangyong Road, Nanning, 530021, Guangxi Province, People’s Republic of China
Tel +86 7715356789
Email [email protected]
Purpose: To analyze factors influencing tacrolimus (TAC) trough concentration (C0) in β-thalassemia major (β-TM) pediatric patients after allogeneic hematopoietic stem cell transplantation (Allo-HSCT) and to investigate the effects of genotype polymorphism and drug-drug interactions on TAC trough concentration in children with β-TM. Furthermore, to analyze the correlation between TAC C0 and efficacy and adverse reactions.
Patients and Methods: Prospectively collection of demographic information and details of combined treatment of patients with β-TM receiving HSCT, and genotypes of CYP3A4, CYP3A5, and ABCB1 (rs1045642, rs1128503, rs2032582) were obtained for each patient. Univariate analysis and multiple linear regression analysis were used to investigate influencing factors on TAC C0. The impact of different genotypes and the co-administration of azole antifungal drugs on β-TM patients receiving TAC were evaluated, together with the correlation between acute graft-versus-host disease (aGVHD), infection, and liver injury of TAC C0.
Results: A total of 46 patients with 587 concentration data were included. The multiple linear regression results showed that the patient’s sex, weight, postoperative time, hemoglobin, platelet count, serum cystatin C, and combined voriconazole were independent influencing factors of the infusion trough concentration/daily dose, C0/Div. Age, body surface area, postoperative time, co-administration of voriconazole, and CYP3A4*18B are independent influencing factors of C0/Dpo. Group comparisons showed that voriconazole can affect TAC C0 administered intravenously (IV) and orally in β-TM pediatric patients, while patient genotype can affect TAC C0 during oral administration. TAC C0 does not correlate with aGVHD or liver injury, but infection may be associated with TAC C0.
Conclusion: The concentration of TAC should be closely monitored when co-administered with voriconazole. It is worth considering that the influence of genotype on the trough concentration of oral TAC and individualized drug administration warrant investigation. Finally, this study indicated that C0 is not suitable as an indicator of the efficacy of TAC.
Keywords: β-thalassemia major, allogeneic hematopoietic stem cell transplantation, tacrolimus, trough concentration
Introduction
β-thalassemia major (β-TM) is a recessive genetic disease in which the β-globin gene is mutated or deleted and results in impaired synthesis of the β-globin chain, and eventually, the patient’s red blood cells are severely damaged leading to anemia.1 There is a high incidence of β-TM in southern China, especially in the Guangxi Province, and it is the fourth major birth defect among Guangxi newborns.2–4 At present, hematopoietic stem cell transplantation (HSCT) is the only effective means of curing β-TM and the use of immunosuppressive agents is crucial for patients receiving HSCT. As a new type of calcineurin inhibitor, tacrolimus (TAC) has been widely used clinically to prevent graft-versus-host disease (GVHD) after HSCT in β-TM patients.5 However, TAC has a narrow therapeutic index, and overexposure will significantly increase the risk of infection and TAC-related adverse reactions.6 Conversely, inadequate exposure will lead to acute GVHD (aGVHD), and thus transplant failure.7–9
The absorption of TAC is unstable, and bioavailability varies greatly among different individuals.10 TAC is mainly metabolized by the liver in vivo, and its serum concentration is highly correlated with the activity of metabolic enzymes in the human body, and is excreted via to binding P-glycoprotein (P-gp). CYP3A enzyme and P-gp act as a barrier in enterocytes of the small intestine, and their metabolic activity affects the absorption of TAC. The high degree of variability between and within individuals of TAC can be partly attributed to the genetic variation of metabolic enzymes and transporters. CYP3A5 can be divided into wild type (*1/*1, extensive metabolizing type), heterozygous type (*1/*3, intermediate metabolizing type), and pure mutant type (*3/*3, poor metabolizing type); CYP3A4 also can be divided into wild type (*1/*1, poor metabolizing type), heterozygous type (*1/*18B, intermediate metabolizing type), and pure mutant type (*18B/*18B, extensive metabolizing type). Prasad et al reported that in kidney transplantation, patients with CYP3A5*1/*1 require a higher dose of TAC to achieve the target treatment window, and the presence of the ABCB1 polymorphism (rs2032582) is significantly associated levels of TAC.11 The expression of the multidrug resistance p-glycoprotein (P-gp), encoded by the ABCB1 gene will also influence the activity of the P-gp transporter, which also plays an important role in the transport of TAC inside and outside the cell.12 Azole antifungal drugs, used to prevent and treat invasive fungal disease after HSCT, can inhibit the activity of different CYP450 enzymes and affect drugs metabolized by this enzyme. When TAC is used in combination with azole antifungals, the metabolism of TAC will slow down and will lead to overexposure of TAC.13
In clinical practice, TAC concentration is generally measured as an indicator of its efficacy. Nevertheless, several studies have found that there is not a strong correlation between whole blood concentrations and TAC efficacy in solid organ transplantation.14,15 In addition, studies have reported that TAC concentrations in the whole blood, plasma, or blood cells did not show a significant correlation in adult patients with kidney transplantation and lung transplantation.14,15 However, there have been no studies confirming the correlation between TAC C0 and efficacy in β-TM patients receiving HSCT.
At present, few studies have analyzed the factors influencing TAC C0, and there are no studies focusing on pediatric patients with β-TM. Thus, this paper mainly focused on the identification of factors influencing TAC C0 in β-TM pediatric patients receiving HSCT, and also investigated the effects of CYP3A4, CYP3A5, and ABCB1 gene expression and azole antifungal agents on TAC levels in pediatric patients with β-TM. Finally, we preliminarily investigated the relationship between efficacy and adverse reactions and TAC C0 in β-TM pediatric patients receiving allogeneic HSCT (Allo-HSCT).
Materials and Methods
Patients and Dosage Regimens
Data on pediatric patients with β-TM who received Allo-HSCT from July 2019 to June 2020 were prospectively collected at The First Affiliated Hospital of Guangxi Medical University, Guangxi, China. The inclusion criteria were as follows: (1) Patients aged <18 years, (2) TAC-based immunosuppressive regimens, and treatment of TAC for at least 3 days; (3) Plasma concentration of TAC determined at least once. Exclusion criteria: (1) Patients with severe liver and kidney dysfunction; (2) Use of TAC sustained-release capsules; (3) combination with other organ transplantation; and (4) multiple organ failure. This study complied with the Declaration of Helsinki and national and institutional standards and was approved by the Ethics Committee of The First Affiliated Hospital of Guangxi Medical University (2021-KY-E-122). Before the pediatric patients underwent HSCT, the clinician presented the study to the legal guardian of the patient and obtained signed informed consent for surgery. All patients received a standard immunosuppressive GVHD treatment regimen consisting of TAC, mycophenolate mofetil, methotrexate, and methylprednisolone: mycophenolate mofetil (250 mg/day) 1 day before transplantation to 30 days after transplantation; intravenous methotrexate (10 mg/m2) on days 3, 6, and 12 after transplantation; Methylprednisolone (1 mg/kg) for the treatment of GVHD; If the patient was resistant to methylprednisolone, the drug was converted to basiliximab. All patients received intravenous TAC, 2 days prior to transplantation. The initial dosage of TAC was 0.015 mg/kg, twice daily, with intravenous infusion for over 2 h. Subsequent dosages were adjusted based on the patients’ condition and the plasma concentrations achieved. For patients tolerating oral administration, intravenous TAC was switched to oral TAC.
Sampling and Laboratory Analysis
A 2–3 mL sample of venous blood was collected to measure concentrations before each dose, on days 3, 5, 7, 9, 12, and 14 after transplantation. Sampling concentrations were determined by chemiluminescence microparticle immunoassay (ARCHITECTi1000SR System, Abbott Laboratories, USA). The detection limit of the instrument was 0.3–30.0 ng/mL, precision of TAC determination was <10%, with an average recovery rate within 100%±10% of the theoretical value.
Genotyping Analysis
A 2–3 mL sample of peripheral venous blood was collected in EDTA tubes for DNA genotyping. DNA was extracted using a nucleic acid extraction and purification kit (Baiao Technology Co., Ltd., Shanghai, China), in strict adherence to the manufacturer’s instructions. The primers for CYP3A4, CYP3A5, and ABCB1 (rs1045642, rs1128503, and rs2032582) were designed by Primer3 software according to data from the National Center for Biotechnology Information (NCBI), and primers were synthesized by Shenzhen BGI Technology Co., Ltd. Multiplex PCR reactions and were run in the GeneAMP® PCR System 9700, while product purification, DNA library preparation, and PE100 sequencing were completed by Shenzhen BGI Technology Co., Ltd.
Definition of Efficacy and Adverse Reactions
The primary endpoints of this study included efficacy and adverse reactions. Efficacy was determined by the occurrence of aGVHD, and the adverse reactions included infection and hepatotoxicity. The diagnostic criteria for aGVHD were in accordance with the consensus diagnosis published in 1994.16 TAC-related hepatotoxicity was diagnosed according to the diagnostic criteria for drug-induced liver injury issued by the Council of International Medical Organizations (CIOMS) in 2014.17,18
Statistical Analysis
Categorical values were represented by frequency and proportion, and normality of continuous variables was evaluated by the Shapiro–Wilk test. If the variable satisfied a normal distribution, the mean and standard deviation (SD) were used to express for the descriptive statistics; otherwise the median and interquartile were used.
Comparison between groups of dichotomous variables was performed using the Chi-square test or Fisher’s exact test. Multi-categorical variables between groups were evaluated using ANOVA or Wilcoxon tests. Continuous variables were compared using t-test or the Mann–Whitney U-test.
Multiple linear regression was used to determine the influencing factors of TAC C0/D. Univariate analysis was used to initially screen variables, Binary variables were compared using the Mann–Whitney U-test, and continuous variables were subjected to simple linear regression. Variables with a P-value <0.1 were included in the multiple linear regression. A P-value <0.05 was considered statistically significant. All statistical analyses were performed with SPSS software (version 19.0, SPSS, Inc. Chicago, IL, USA).
Results
Data Collection
A total 46 pediatric β-TM patients receiving Allo-HSCT, including 27 males and 19 females were enrolled in this study; participants had a median age of 8.5 years and a median bodyweight of 24.0 kg. Patient information was collected from the hospital’s electronic medical records system, including demographic data, laboratory test results, and medication information. Physiological indicators: age, weight, height, sex. Laboratory examination indicators: hematocrit, hemoglobin, platelet count, total bilirubin, gamma glutamyl transferase, aspartate aminotransferase, alanine aminotransferase, alkaline phosphatase, serum creatinine, serum cystatin C, and co-treatment with multiple agents. The average intravenous TAC treatment duration was 9 days, and 27 days for oral administration. All the β-TM patients in this study received omeprazole to reduce gastrointestinal reactions and all patient received at least one antibiotic to treat bacterial infections after HSCT. A total of 43 patients received azole antifungals (23 fluconazole, 7 voriconazole, and 13 posaconazole) for the prevention or treatment of fungal infections. In this study none of patients received combination treatment with fluconazole during intravenous TAC. The detailed patient information is displayed in Table 1.
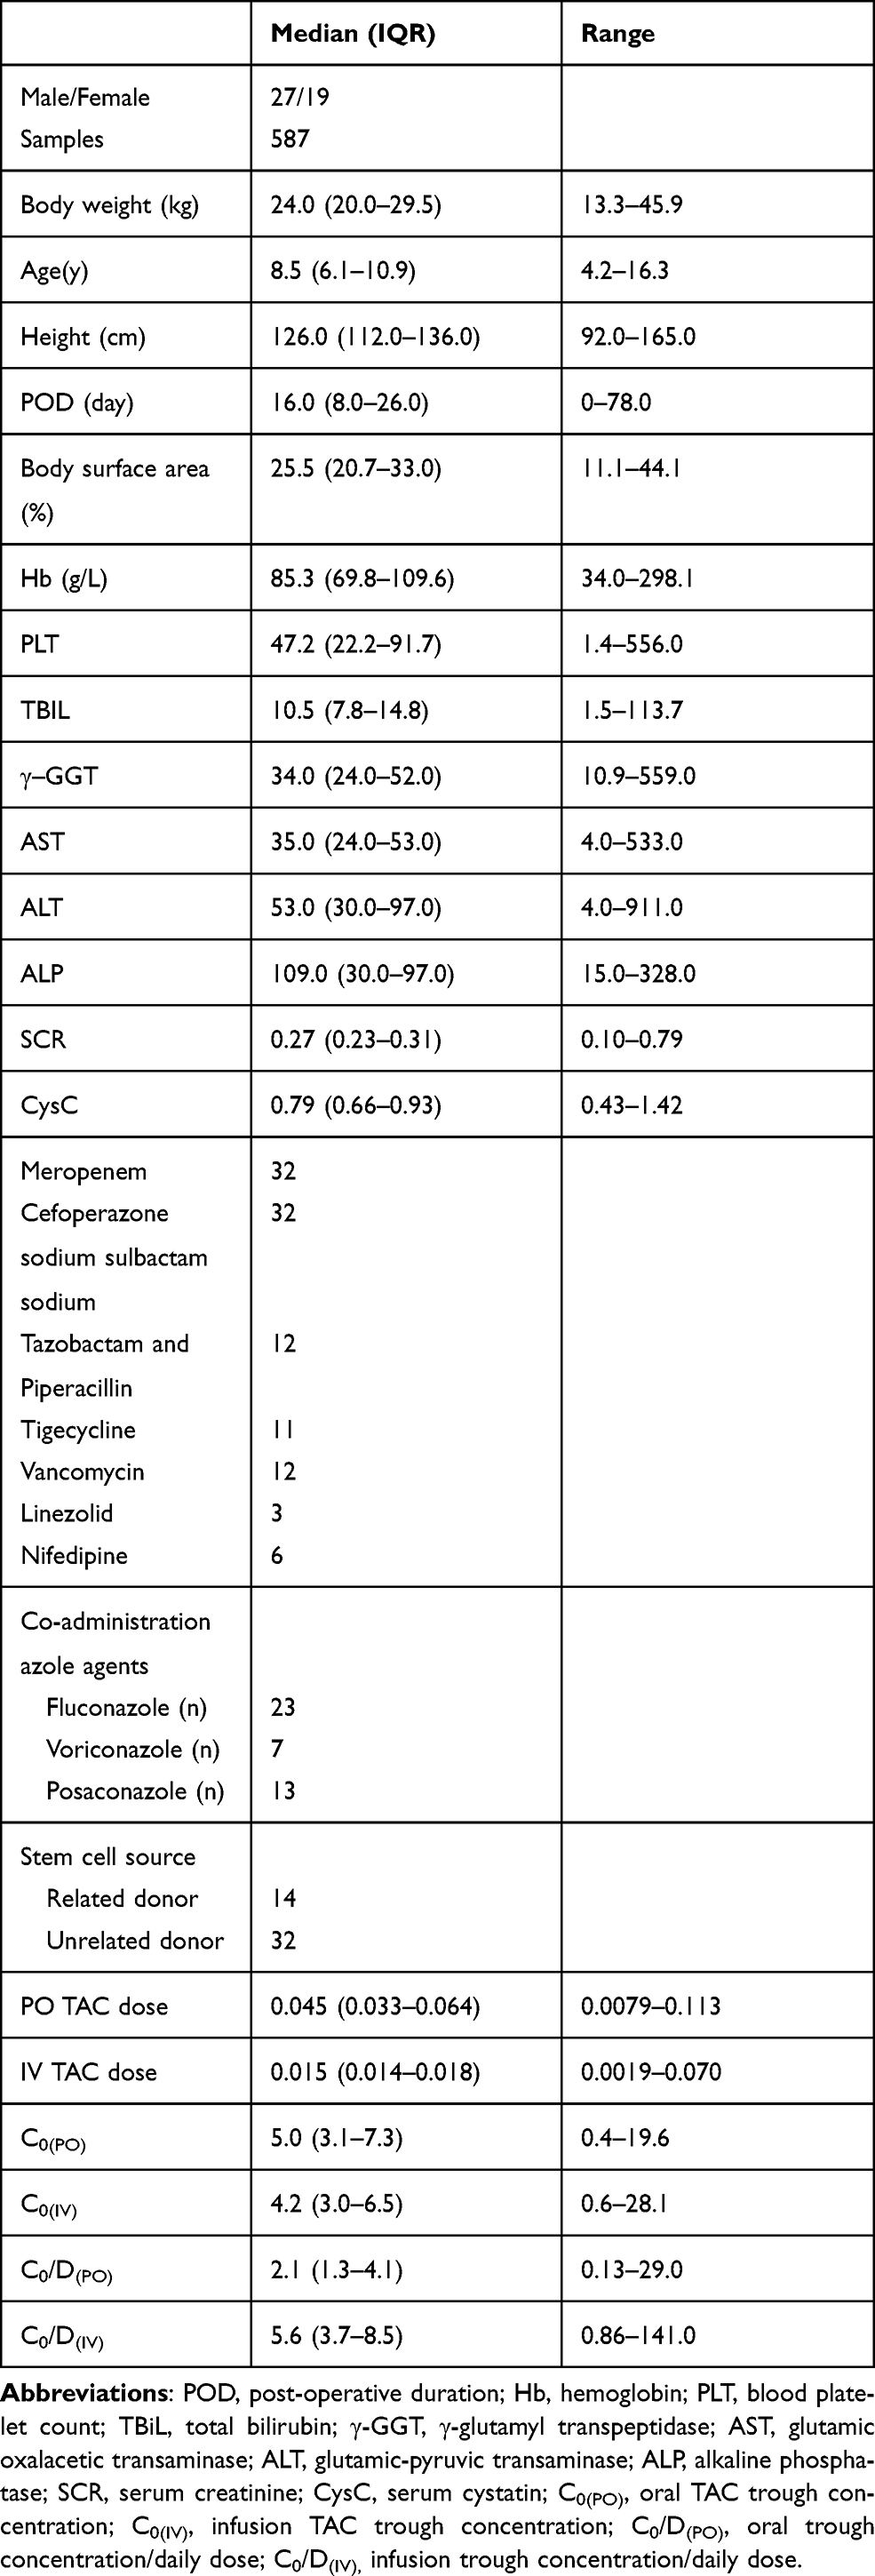 |
Table 1 Patient Information |
The CYP3A4*1/*1 genotypes were detect in 16 cases (34.8%), CYP3A4*1/*18B was observed in 24 cases (52.2%), and CYP3A4*18B/*18B was observed in 6 cases (28.3%). Similarly, the frequencies of the CYP3A5 *1/*1 genotypes were 8.7%, and were 63.0% for CYP3A5 *1/*3 and 28.3% for CYP3A5 *3/*3. All gene frequencies conformed to the Hardy-Weinberg genetic equilibrium, indicating that the patients included in this study were representative of the population. The genotype distribution is displayed in Table 2.
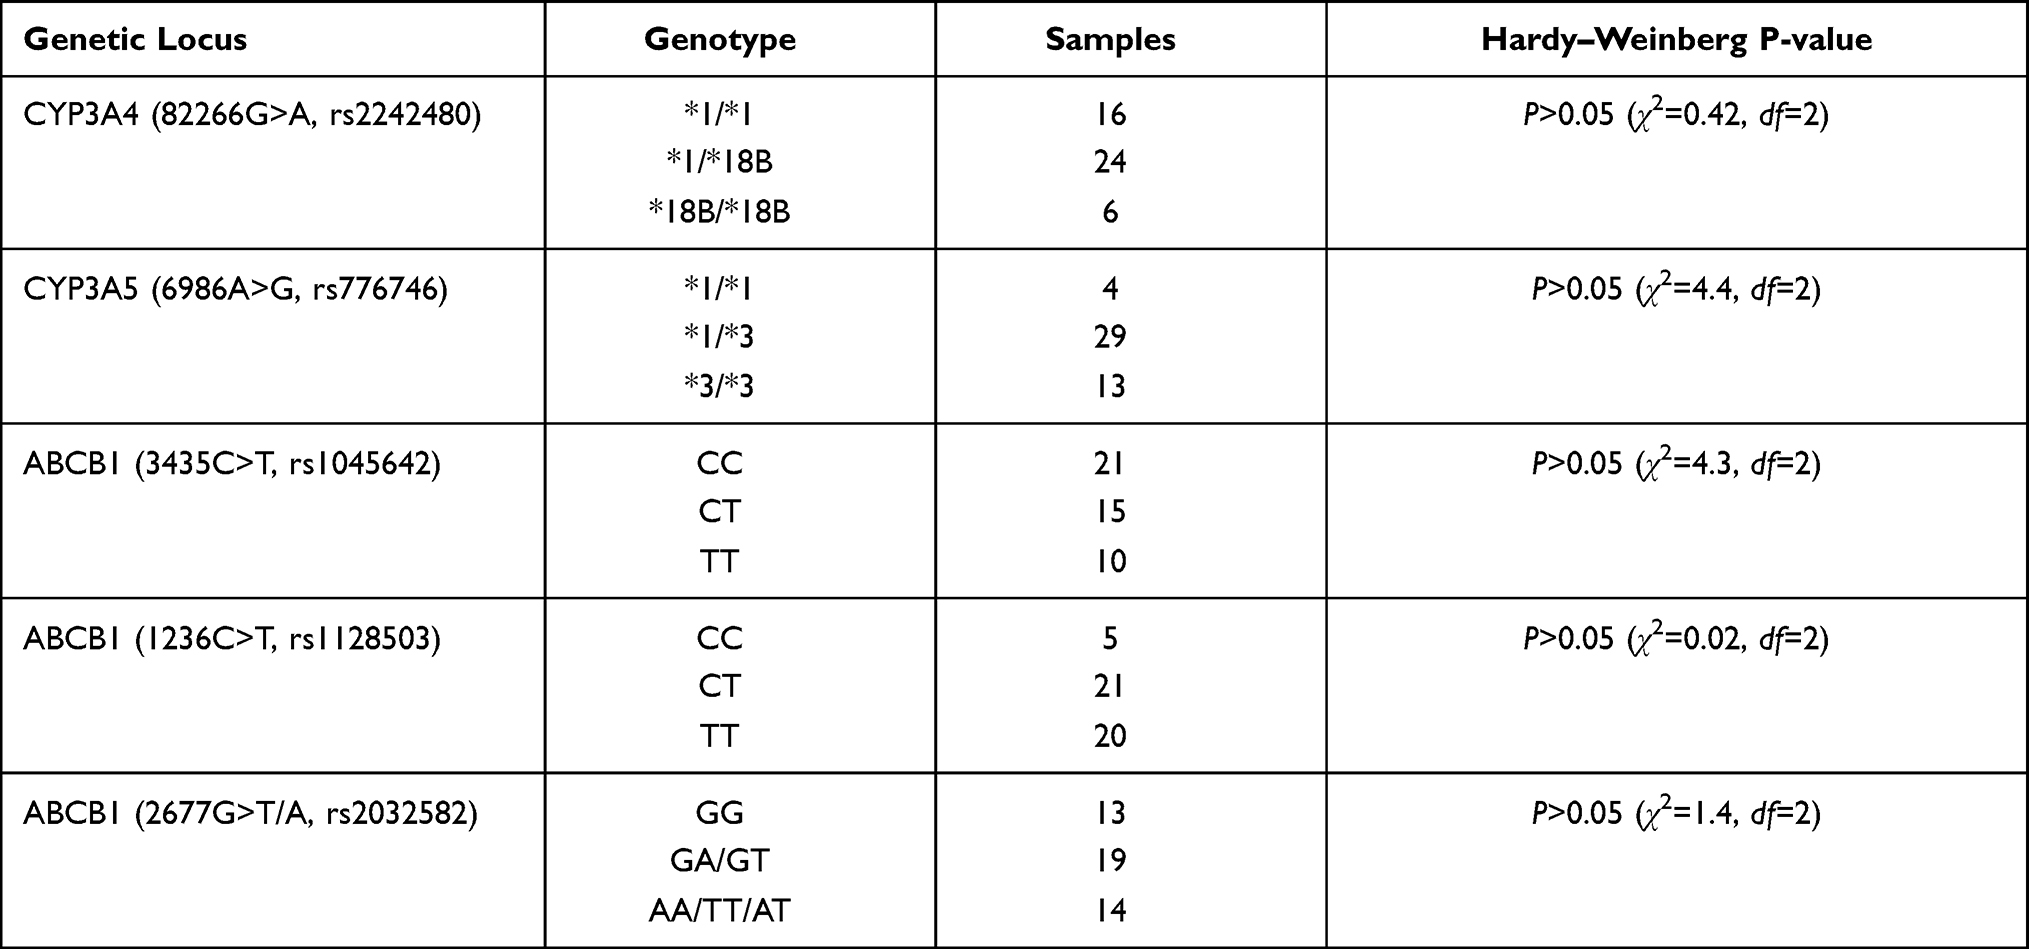 |
Table 2 Genotype Distribution |
A total of 14 patients were diagnosed with aGVHD, 32 patients were diagnosed with infection, and 23 patients were diagnosed with liver injury. Infections were distributed as follows: 32 patients were diagnosed with infection; 13 patients had viral infections (3 EB virus infections, 10 cytomegalovirus infections), 5 patients had sepsis, and 26 patients presented pulmonary infection and upper respiratory tract infection. Among all patients diagnosed with infection, 17 patients had two or more combined infections. The myeloablative treatment before transplantation seriously impairs the immune system of pediatric patients and greatly increases the risk of infection. Thus, clinicians will empirically use different antibiotics for prevention or treatment. Our center generally selects azole drugs for fungal infection and β-lactam antibiotics used for bacterial infection. If the disease process remains uncontrollable, doctors will add aminoglycosides, glycopeptides, or other intensive treatment according to individual patient conditions situation and laboratory examination results.
Whole Blood TAC Trough Concentrations
Data relative to 587 TAC trough concentrations were collected (Table 1). The median whole blood trough concentration during intravenous administration was 4.2 ng/mL, and the median whole blood trough concentration during oral administration was 5 ng/mL. Approximately 55.0% of the whole blood trough concentration was less than 5 ng/mL, 36.1% (212/587) was in the range of 5–10 ng/mL, and 8.8% (52/587) was >10 ng/mL.
Factors Influencing TAC Infusion Trough Concentration/Daily Dose, C0/Div
Analysis of C0/Div
The results of the simple linear regression showed that C0/Div was significantly correlated with factors such as sex, age, weight, height, body surface area, postoperative time, hematocrit, hemoglobin, platelet count, total bilirubin, serum creatinine, and the combined use of voriconazole (P<0.05). In the multiple linear regression analysis, the patient’s sex, weight, postoperative time, hemoglobin, platelet count, serum cystatin C, combined use of voriconazole, and other factors were independent influencing factors of C0/Div. For male patients, heavier body weight, and higher serum cystatin C levels resulted in lower C0/Div. Longer postoperative times, higher hemoglobin and platelet counts, and co-administration of voriconazole led to an increase in the C0/Div (Table 3).
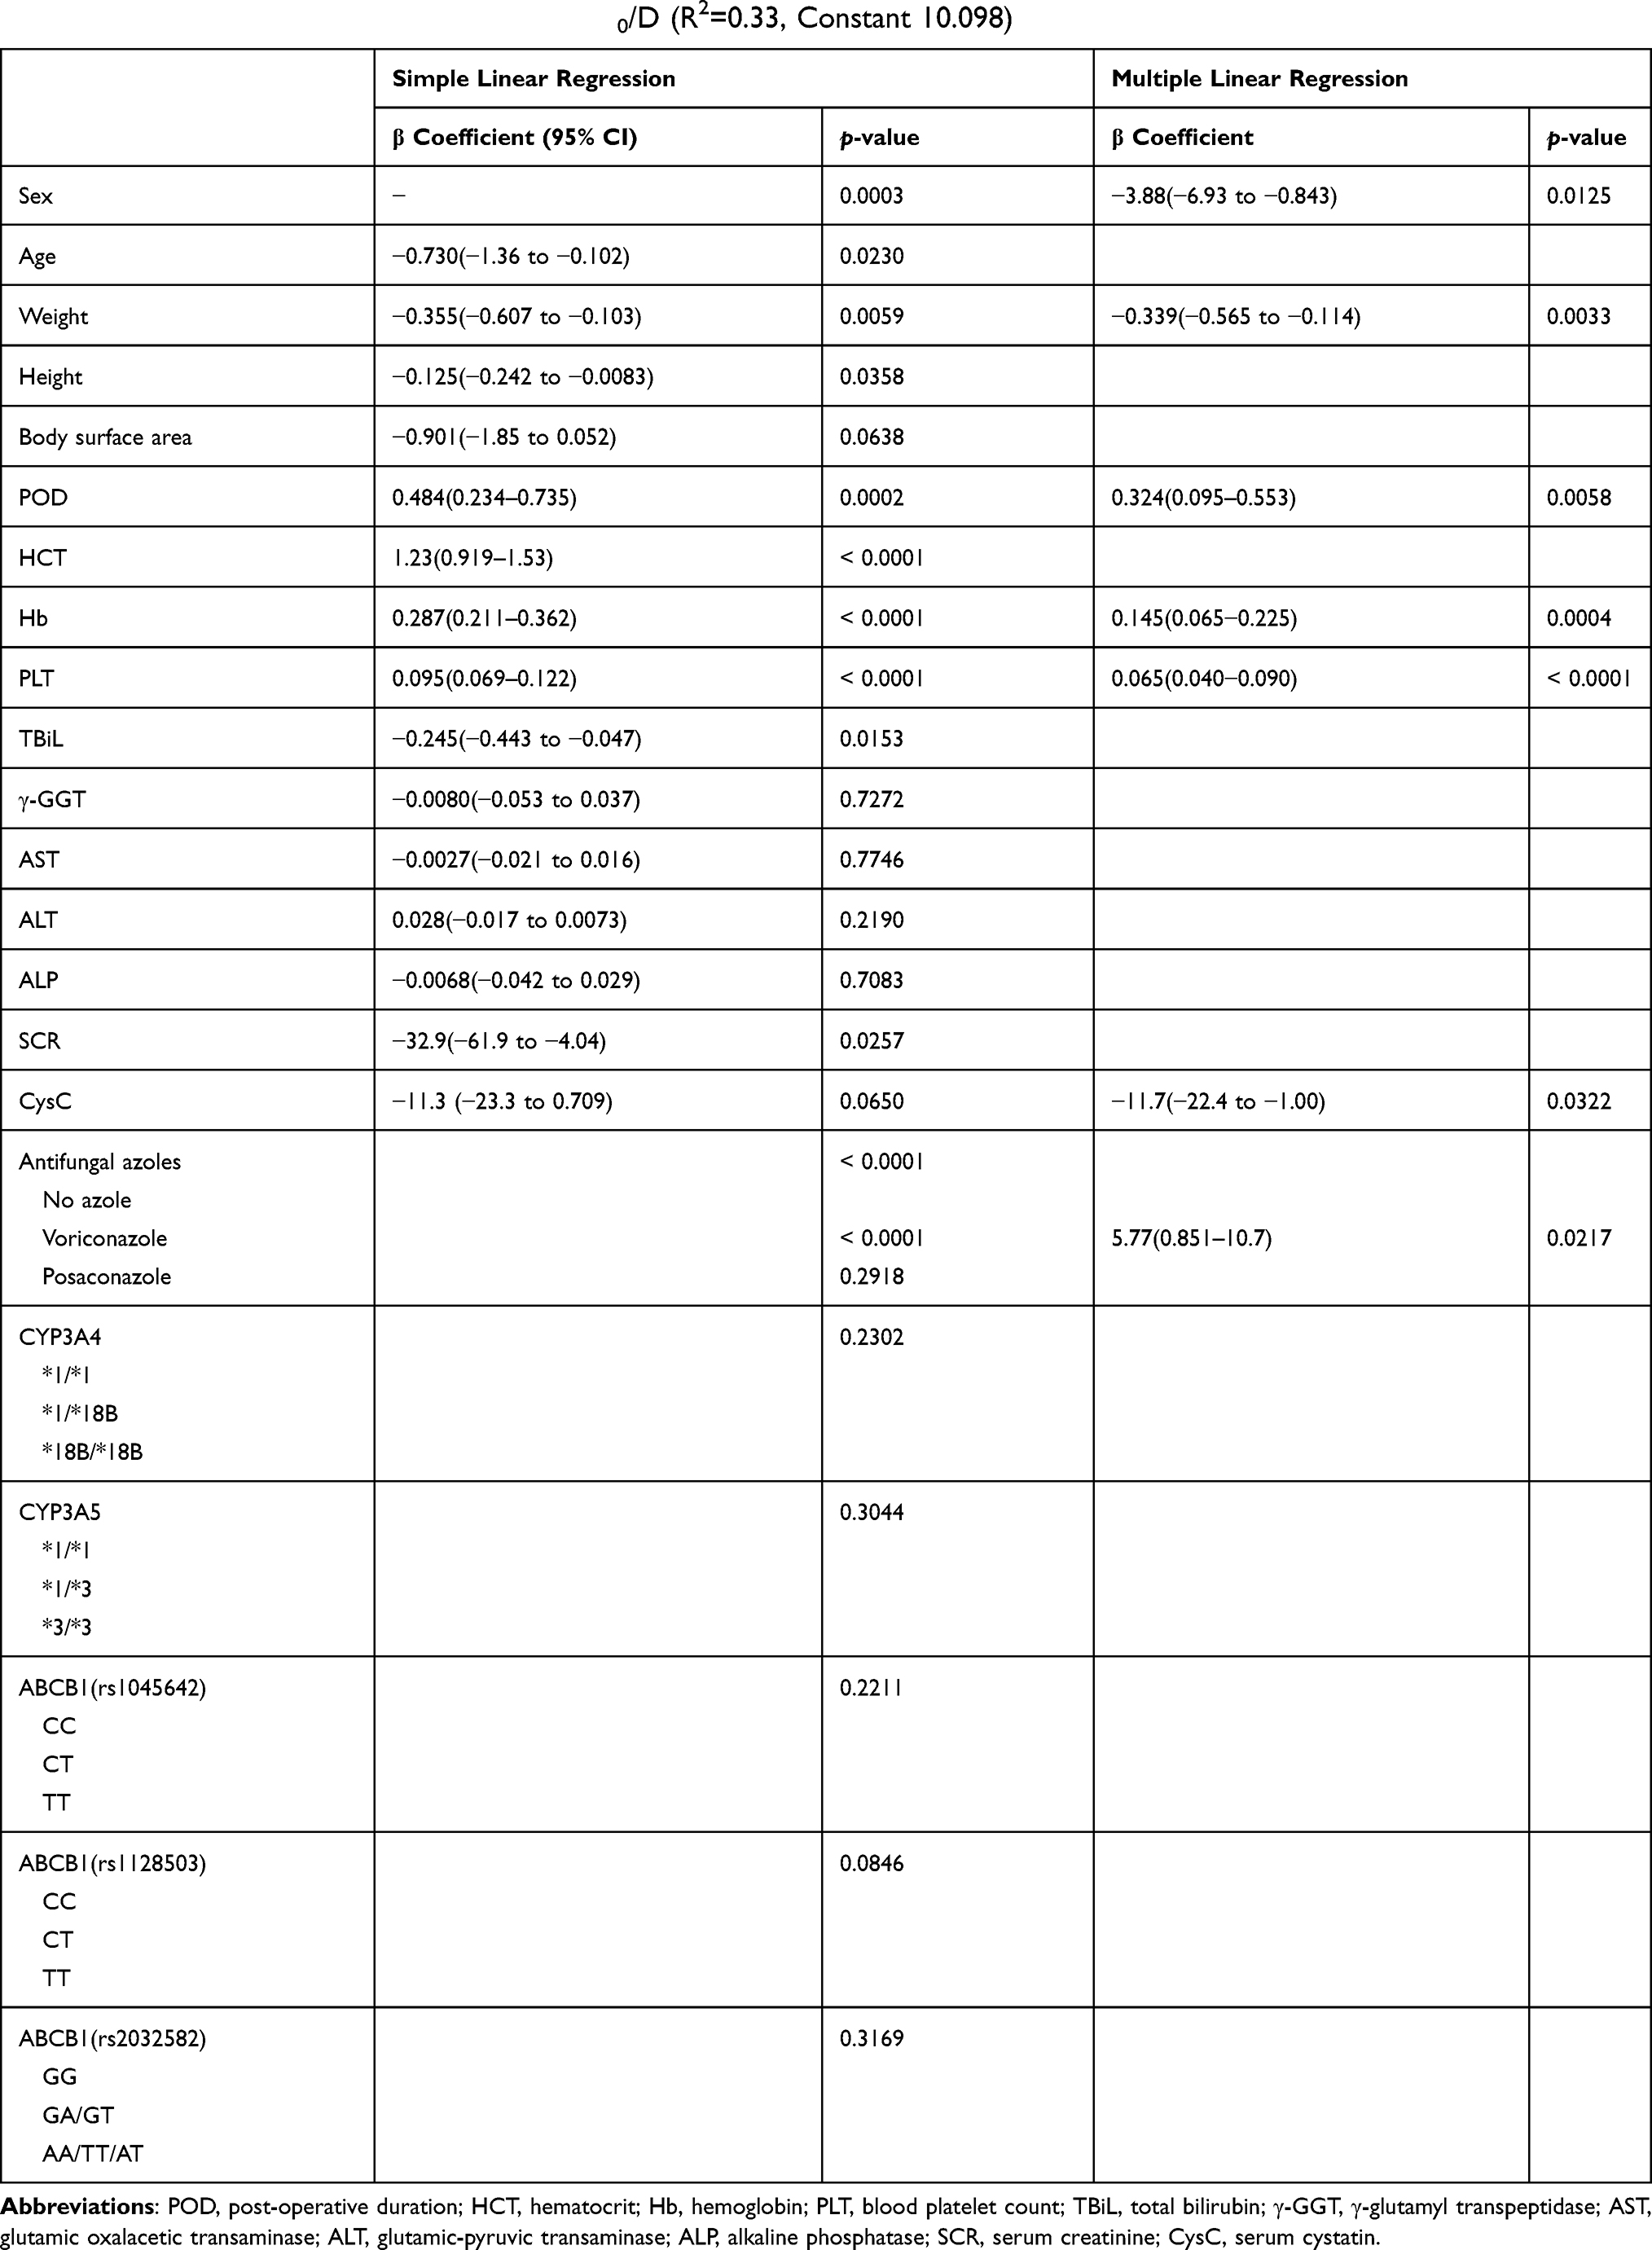 |
Table 3 Multiple Linear Regression of Infusion C0/D (R2=0.33, Constant 10.098) |
Analysis of C0/Dpo
According to the simple linear regression results, C0/Dpo were significantly correlated with the patient’s sex, age, weight, body surface area, postoperative time, total bilirubin, serum cystatin C, combined voriconazole, and CYP3A4*18B, ABCB1 (rs1128503), and ABCB1 (rs2032582) genotypes (for all, P<0.05). The results of the multiple linear regression showed that the patient’s age, body surface area, postoperative time, co-administration of voriconazole, CYP3A4*18B genotype, and other factors were independent influencing factors of C0/Dpo. The C0/Dpo of TAC was reduced in male patients with older age, larger body surface areas, and pure mutant CYP3A4 genotype. Conversely, the C0/Dpo of TAC was increased in patients with longer postoperative time and co-treatment with voriconazole. Details are displayed in Table 4.
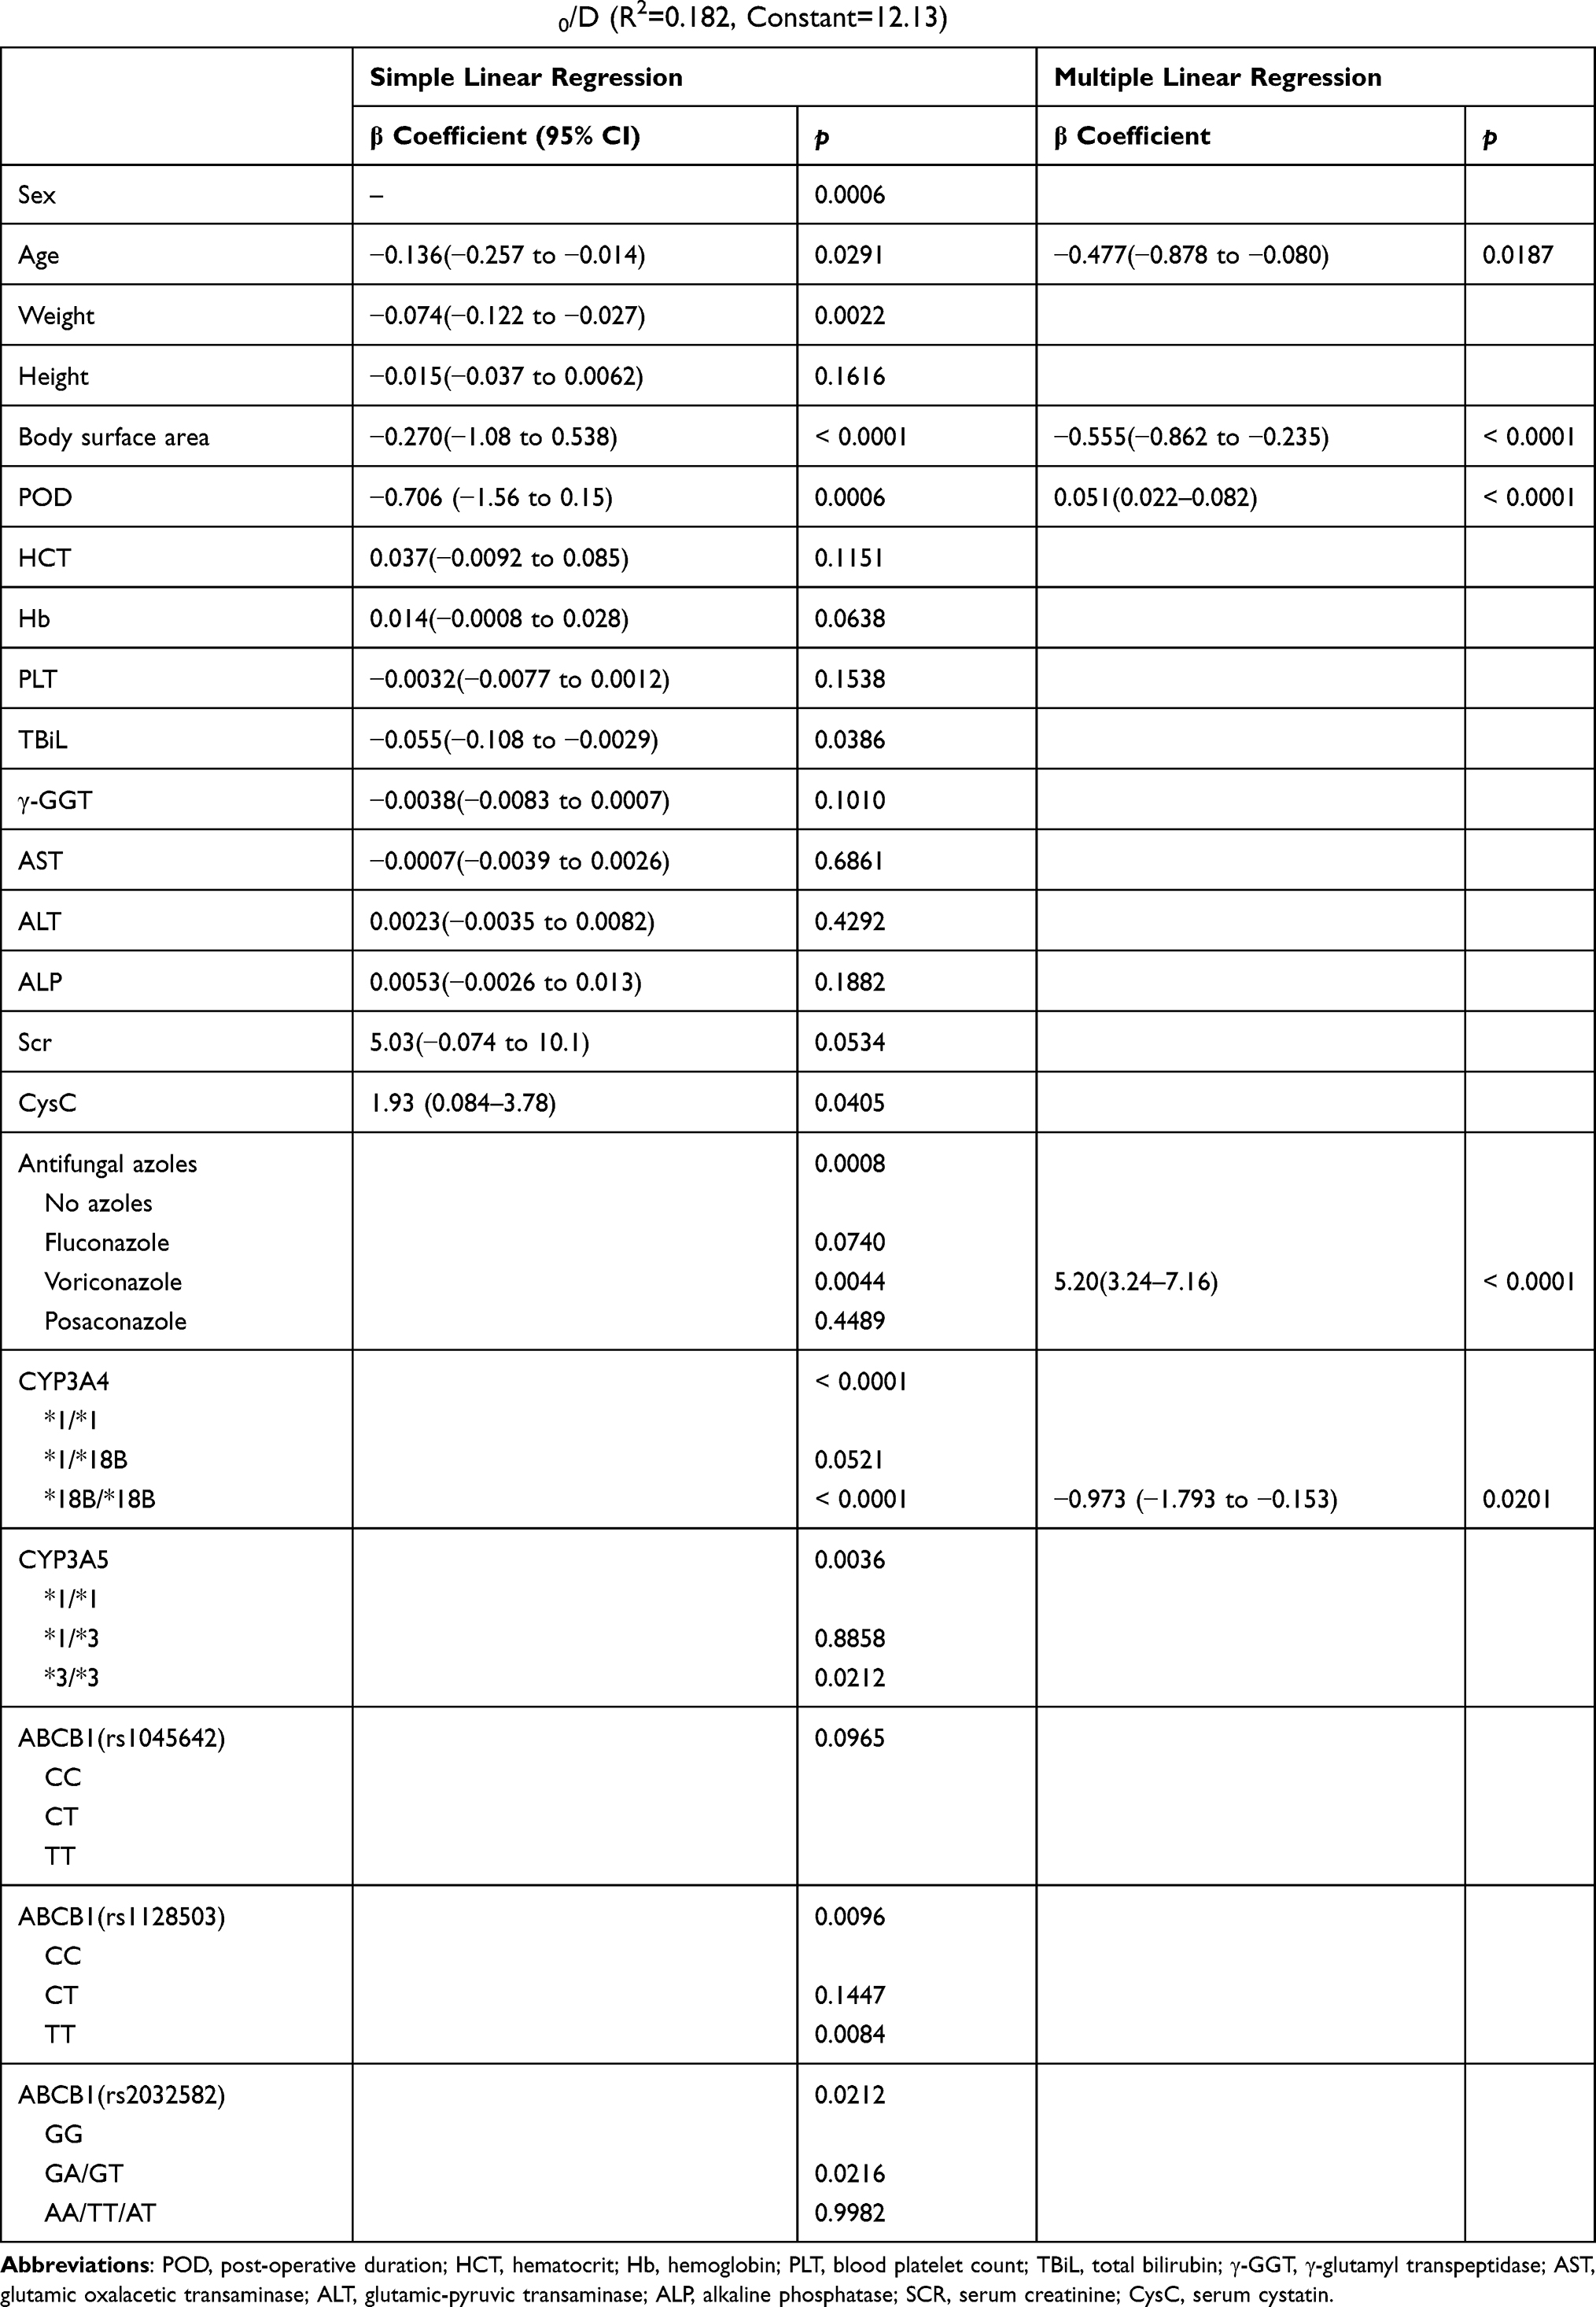 |
Table 4 Multiple Linear Regression of Oral C0/D (R2=0.182, Constant=12.13) |
Relationship Between Genotype and TAC Concentration
CYP3A4
Based on the CYP3A4 genotype, there were no significant differences in C0 (iv) or C0/Div between the three alleles of CYP3A4, but the median C0/Div of the CYP3A4*1/*1 genotype was 1.6 times higher than the CYP3A4*18B/*18B genotypes. A comparison of the oral TAC concentrations across different alleles of CYP3A4, revealed a statistically significant difference in C0 (po) for the CYP3A4*18B/*18B genotype over the other two genotypes, but there was no significant difference in C0(po) between CYP3A4*1/*1 and *1/*18B genotypes. Differences in C0/Dpo between CYP3A4*1/*1, *1/*18B, and *18B/*18B were statistically significant and the median C0/Dpo of CYP3A4*1/*1 was 2.2-fold higher than CYP3A4*18B/*18B (Tables 5 and 6, and Figure 1).
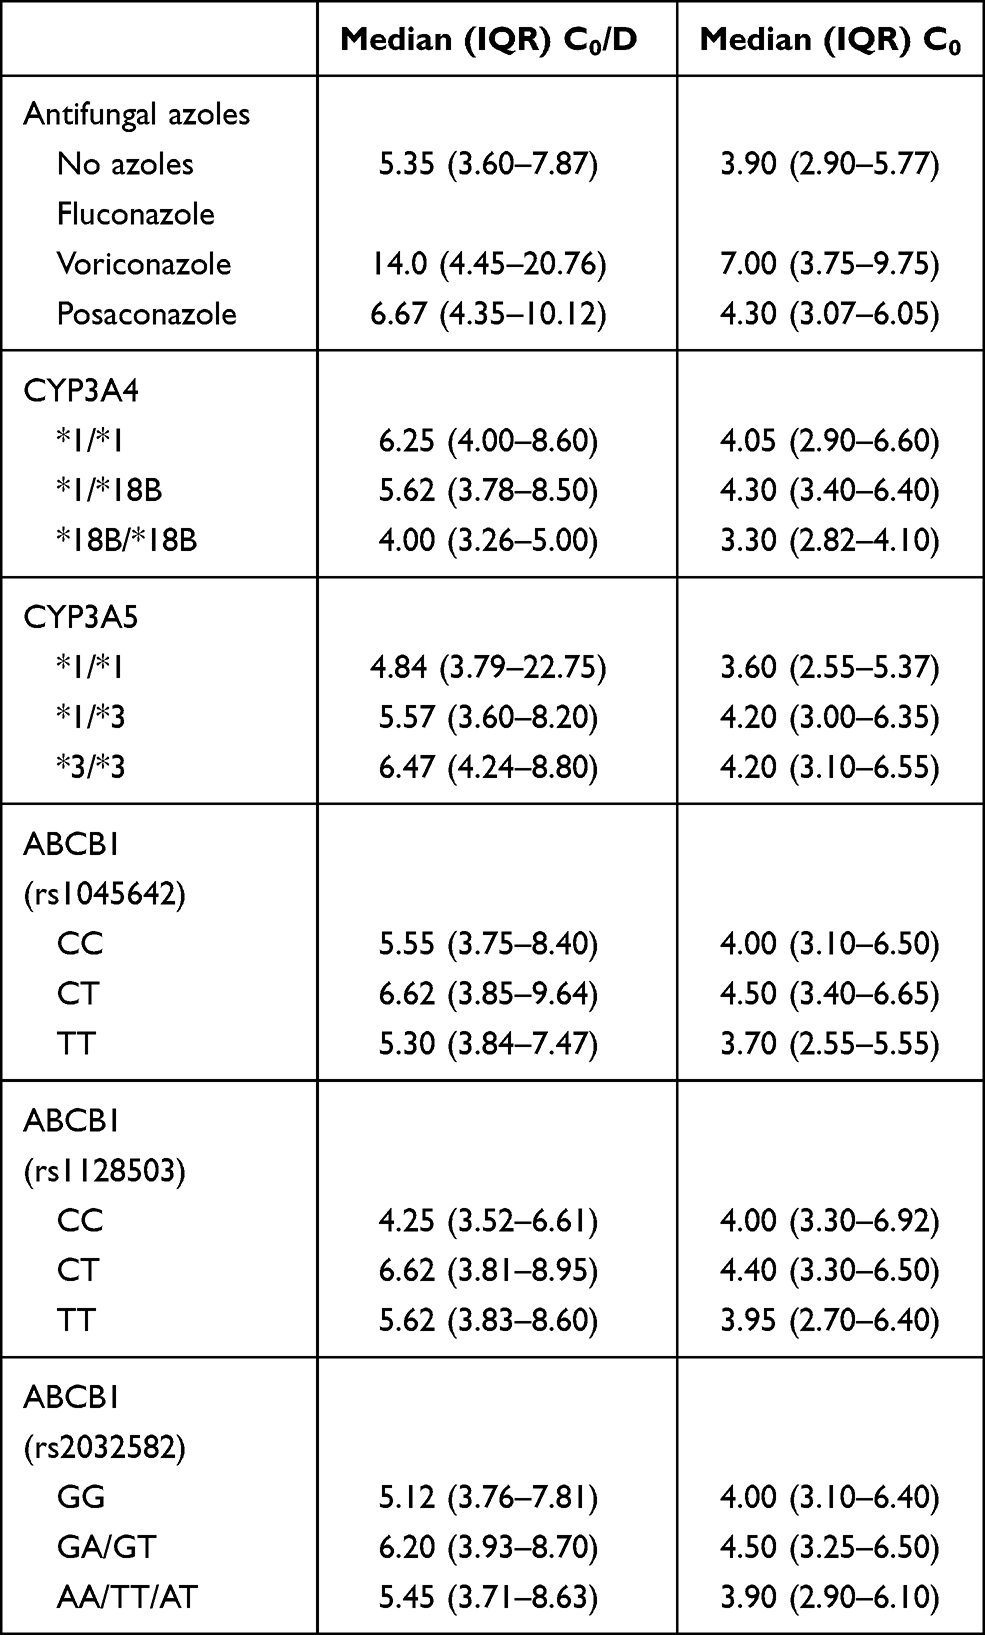 |
Table 5 Infusion TAC Concentration |
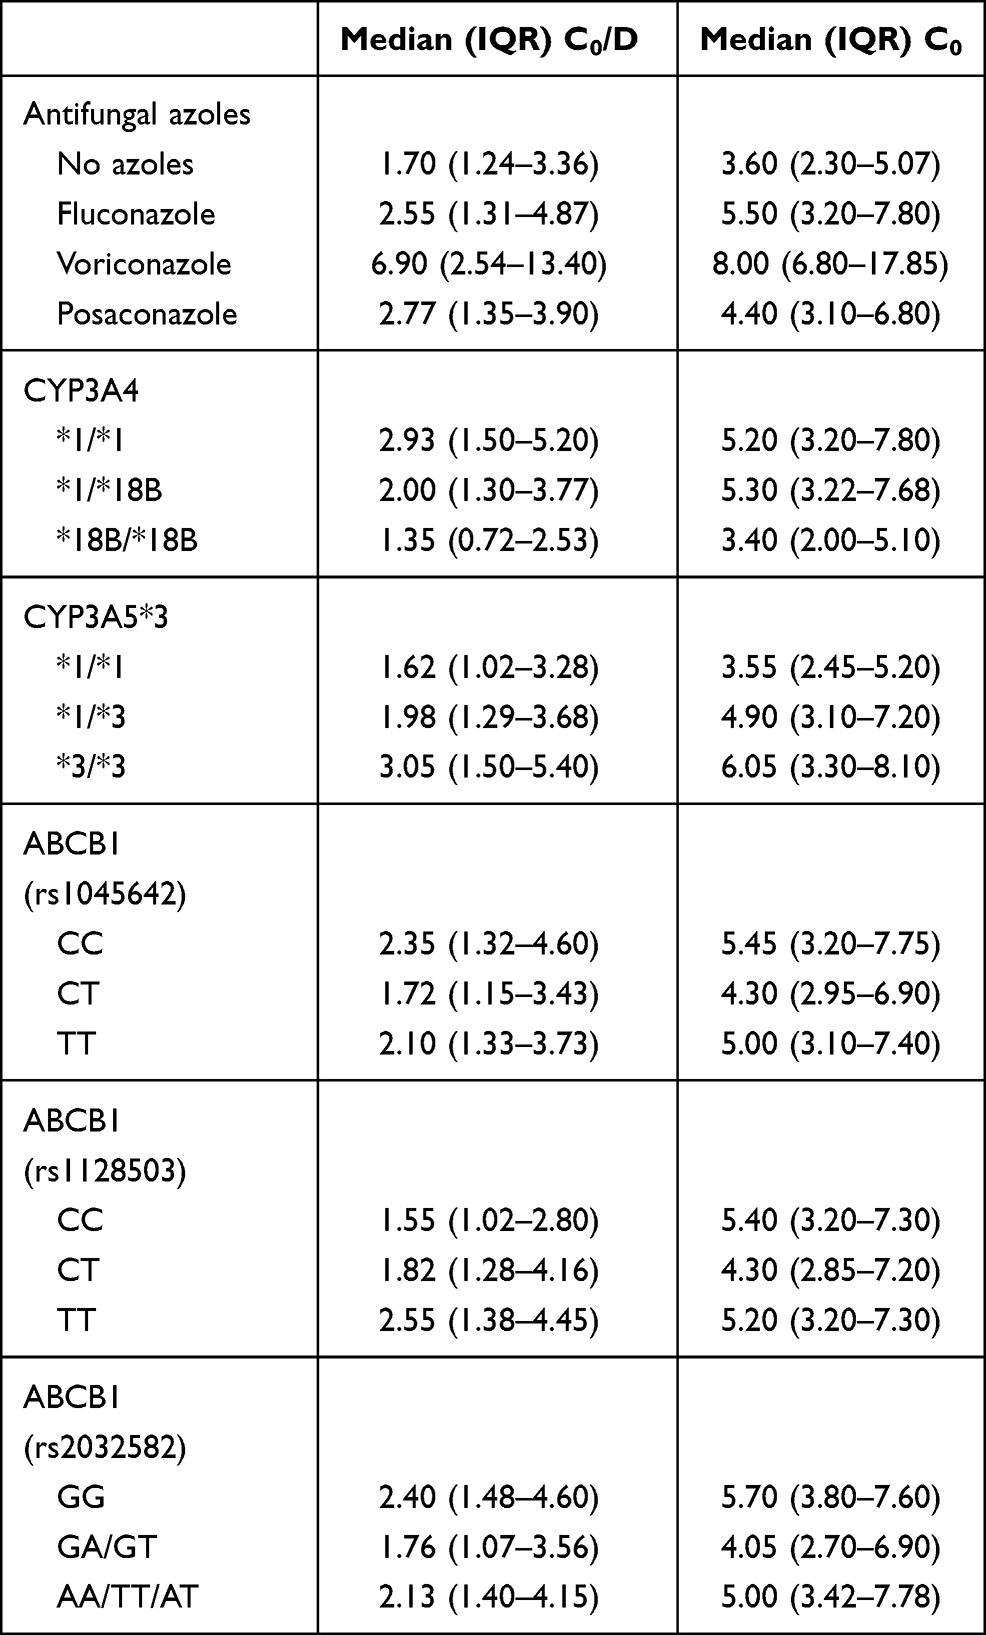 |
Table 6 Oral TAC Concentration |
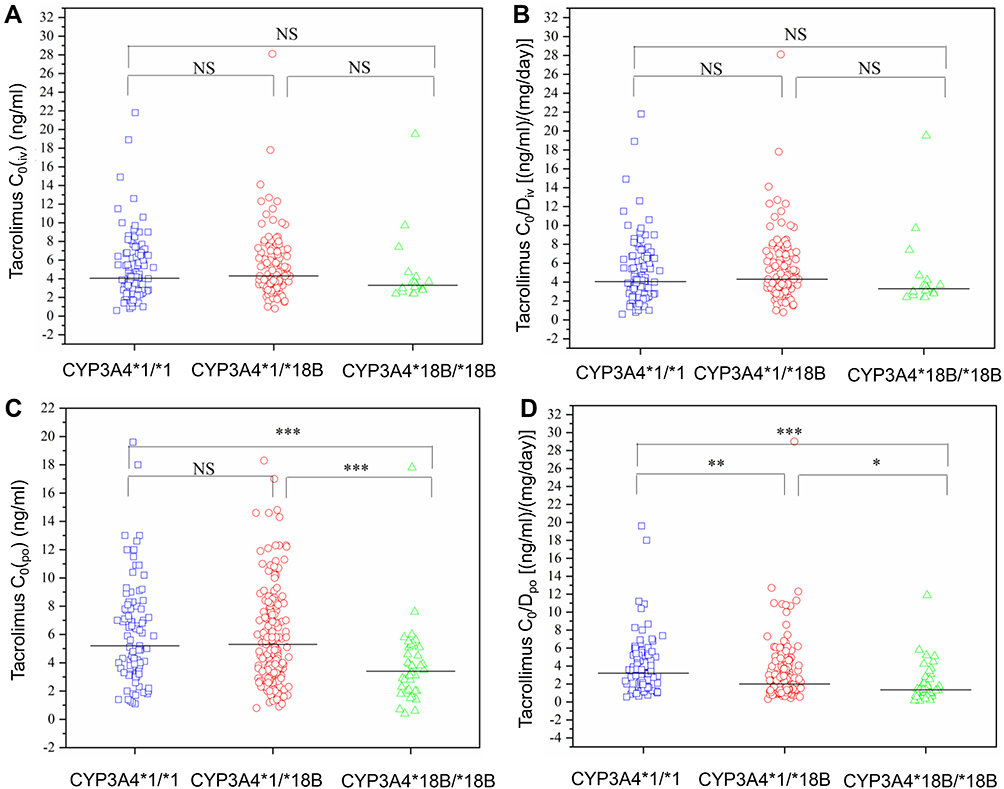 |
Figure 1 Comparison of tacrolimus C0 and C0/D between CYP3A4 groups. (A) Comparison of tacrolimus C0(iv); (B) Comparison of tacrolimus C0/Div; (C) Comparison of tacrolimus C0(po); (D) Comparison of tacrolimus C0/Dpo. *P <0.05, **P <0.01, ***P <0.001. Abbreviation: NS, no significant. |
CYP3A5
With regard to CYP3A5, no significant differences were observed in C0 (iv) or C0/Div between CYP3A5*1/*1, *1/*3, and *3/*3 genotypes. The median C0/Div of CYP3A5*3/*3 was 1.3-fold higher than the CYP3A5*1/*1 genotype. The C0 (po) showed significant differences between CYP3A5*1/*1 and the other two alleles, and the C0/Dpo indicated there were significant differences between CYP3A5*3/*3 and the other two genotypes. The median C0/Dpo of CYP3A5*3/*3 was 1.9-fold higher than CYP3A5*1/*1 (Tables 5 and 6, and Figure 2).
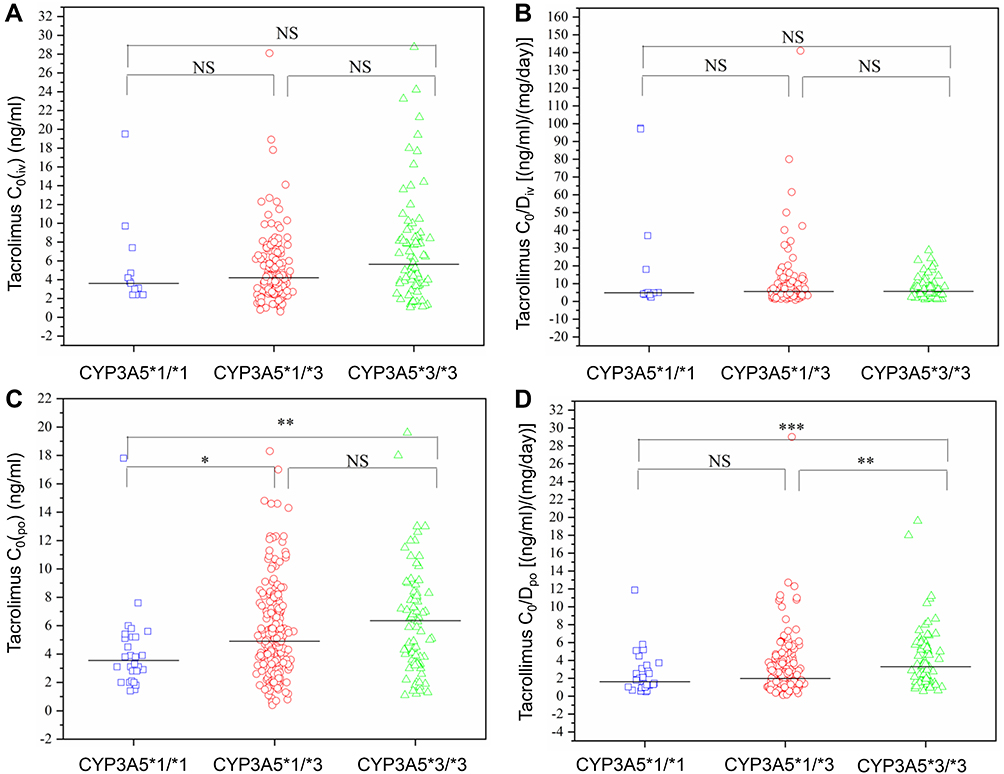 |
Figure 2 Comparison of tacrolimus C0 and C0/D between CYP3A5 groups. (A) Comparison of tacrolimus C0(iv); (B) Comparison of tacrolimus C0/Div; (C) Comparison of tacrolimus C0(po); (D) Comparison of tacrolimus C0/Dpo. *P <0.05, **P <0.01, ***P <0.001. Abbreviation: NS, no significant. |
ABCB1
There were no significant differences in C0 (iv) and C0/Div among the three alleles of ABCB1 (rs1045642) wild type CC, heterozygous type CT, and pure mutant type TT.
With respect to ABCB1 (rs1128503), statistical differences were detected only in C0/Dpo between wild type CC and the pure mutant type TT, and the median C0/Dpo of the pure mutant was 1.6-fold higher than wild type. For the ABCB1 (rs2032582) variant, statistical differences were found in C0 (po) and C0/Dpo between the wild type GG and heterozygous type GA, the median C0/Dpo of wild type was 1.4-fold higher than the heterozygous type (Tables 5 and 6, Figures 3–5).
 |
Figure 3 Comparison of tacrolimus C0 and C0/D between ABCB1 (rs1045642) groups. (A) Comparison of tacrolimus C0(iv); (B) Comparison of tacrolimus C0/Div; (C) Comparison of tacrolimus C0(po); (D) Comparison of tacrolimus C0/Dpo. Abbreviation: NS, no significant. |
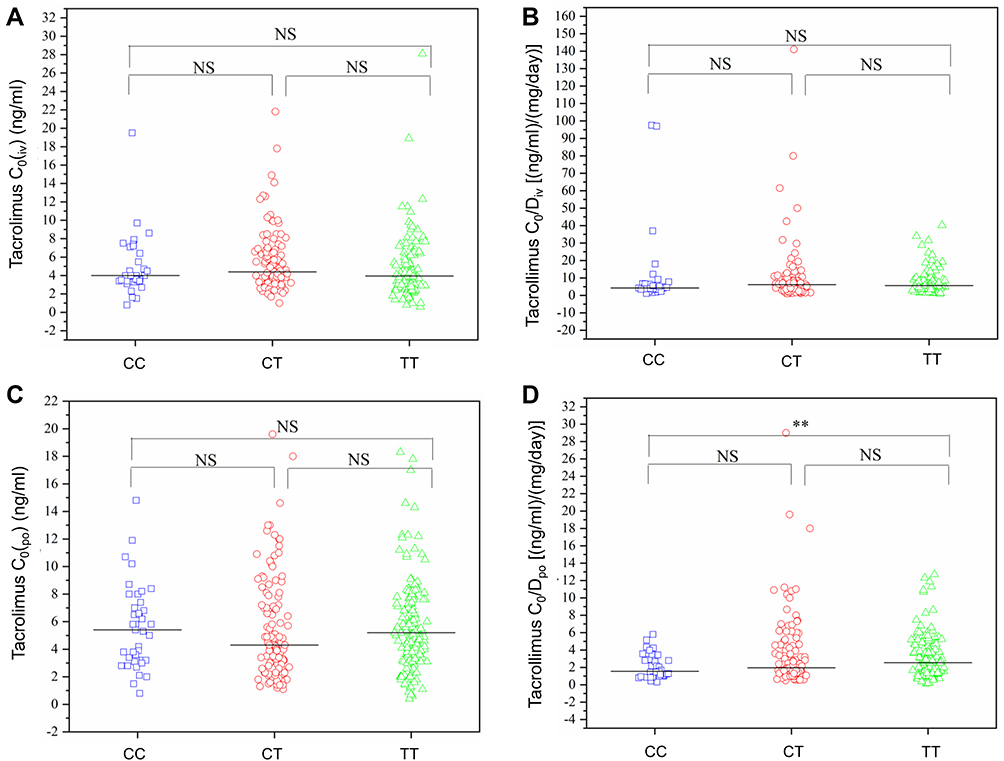 |
Figure 4 Comparison of tacrolimus C0 and C0/D between ABCB1 (rs1128503) groups. (A) Comparison of tacrolimus C0(iv); (B) Comparison of tacrolimus C0/Div; (C) Comparison of tacrolimus C0(po); (D) Comparison of tacrolimus C0/Dpo. **P <0.01. Abbreviation: NS, no significant. |
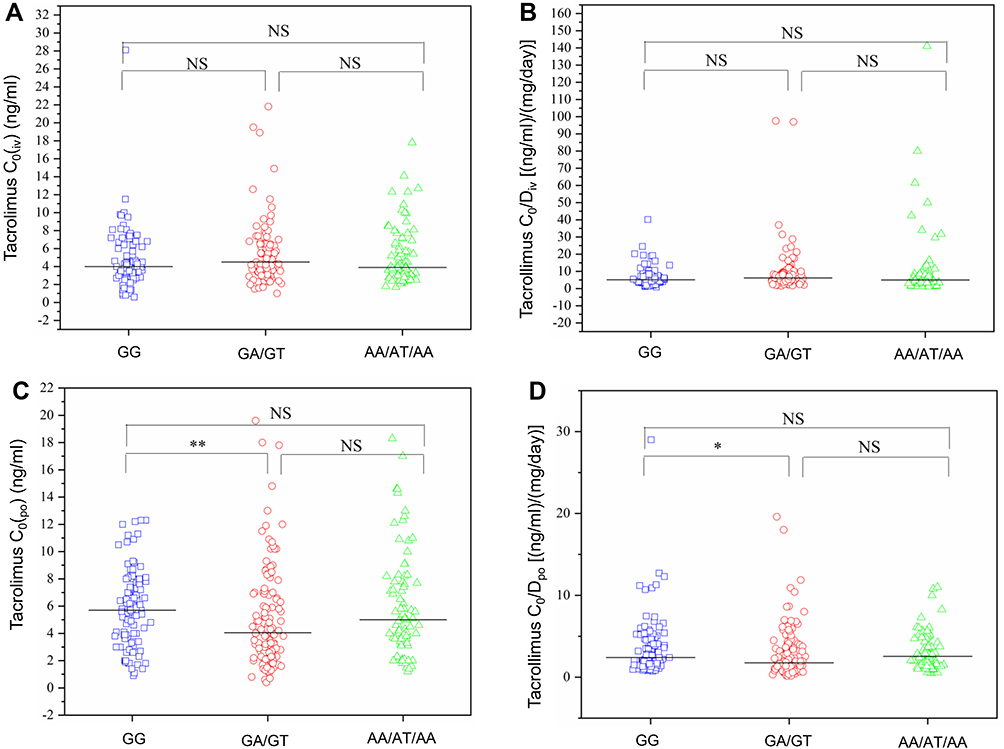 |
Figure 5 Comparison of tacrolimus C0 and C0/D between ABCB1 (rs2032582) groups. (A) Comparison of tacrolimus C0(iv); (B) Comparison of tacrolimus C0/Div; (C) Comparison of tacrolimus C0(po); (D) Comparison of tacrolimus C0/Dpo. *P <0.05, **P <0.01. Abbreviation: NS, no significant. |
Relationship Between Azole Antifungal Agents and TAC Concentration
Comparison of Intravenous TAC Concentration
The differences in C0 (iv) and C0/Div between treatment with and without voriconazole were statistically significant, the median C0/Div of the combined administration was 2.6-fold higher than TAC alone. Further, there was no significant difference with regards to treatment of TAC with and without posaconazole or between the TAC and voriconazole combination and the TAC and posaconazole combination group (Table 5 and Figure 6).
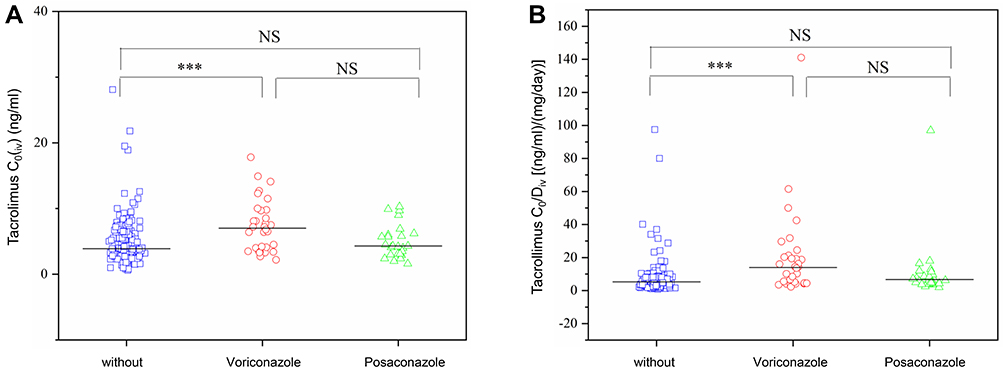 |
Figure 6 Comparison of intravenous C0 (iv) and C0/Div between groups of azole antifungal agents. (A) Comparison of tacrolimus C0(iv); (B) Comparison of tacrolimus C0/Div. ***P <0.001. Abbreviation: NS, no significant. |
Comparison of Oral TAC Concentrations
We analyzed the effects of co-administration of an azole agent on oral TAC concentration, we only observed significant differences in C0 (po) and C0/Dpo between the TAC combination with voriconazole and TAC not co-administered with voriconazole. The median C0/Dpo of the TAC combination with voriconazole was 4-fold higher than TAC alone, and was 2.7-fold higher than the combination with fluconazole, and 2.5-fold higher than the combination with posaconazole (Table 6 and Figure 7).
 |
Figure 7 Comparison of C0 (po) and C0/Dpo between the azole antifungals groups. (A) Comparison of tacrolimus C0(po); (B) Comparison of tacrolimus C0/Dpo. *P <0.05, **P <0.01. Abbreviation: NS, no significant. |
Relationship Between aGVHD and TAC Concentration
The average C0 of TAC in the aGVHD group and in patients not experiencing aGVHD was 5.6 ng/mL and 5.2 ng/mL, respectively. There were no significant differences in C0 between the aGVHD group and the non-aGVHD group, at the first and second weeks after post-transplantation, respectively.
Relationship Between Adverse Reactions and TAC Concentration
Infection
The average C0 of TAC in patients with infections and in those without infections was 5.5 and 4.9 ng/mL, respectively, which indicated a significant differences of C0 was observed.
Hepatotoxicity
The average C0 of TAC in the hepatotoxic group and non-hepatotoxic group was 5.1 ng/mL and 5.6 ng/mL, respectively, which was a statistically significant difference.
Discussion
In this study, we investigated the influence of different genotypes at different loci of CYP3A4*18B, CYP3A5*3, ABCB1 (rs1045642, rs1128503, rs2032582) and their combination with azole antifungal drugs on the serum concentrations of TAC in β-TM pediatric patients receiving Allo-HSCT. Furthermore, the relationship between the efficacy and adverse reactions of TAC and trough concentration was evaluated. We observed CYP3A4 and azole antifungals agents exerted a significant influence on oral TAC concentrations. CYP3A4/5 is expressed in the liver and the small intestine and plays an important role in the first pass clearance effect of TAC.19 CYP3A4 and CYP3A5 are the most important enzymes responsible for TAC metabolism, and in particular CYP3A5 enzyme activity will influences the metabolism of TAC, thereby affecting the concentration of TAC. When orally administered TAC passes through the small intestine and liver, the expression of specific genes can mediate its metabolism, and thereby influence the concentration of TAC in the whole blood. But when TAC was administered by intravenously, it is no longer affected by the first-pass effect, so the effect of genotype on TAC will be reduced. In the present study, the median C0/D of CYP3A4*1/*1 was higher than that of CYP3A4*18B/*18B, and the median C0/D of CYP3A5*1/*1 was lower than that of CYP3A5*3/*3, which is consistent with the results of solid organ transplant patients.20 A previous study also reported that the C0/D of CYP3A4*1/*1 was higher than the pure mutant, in adult Allo-HSCT patients.21 Thus, it is very meaningful to consider genotypes when guiding clinical administration. Under necessary conditions, TAC treatment can be guided according to the CYP3A4/CYP3A5 genotype. The synergistic effects of P glycoprotein and CYP450 enzymes influences the pharmacokinetics of TAC. Herein, we showed that the ABCB1 gene variant did exert any significant effects on the concentration of intravenous TAC. In the ABCB1 (rs1128503) group, the C0/Dpo of the wild type and the pure mutant showed statistical differences. In the ABCB1 (rs2032582) group, the C0/Dpo and C0(po) of the wild type and the heterozygous type were significantly different. This study indicated that it would be more meaningful to guide clinical administration based on the patient’s genotype, especially for patients who take TAC orally.
In this study, we found that azole antifungal drugs have a significant impact on the C0/D of TAC regardless of intravenous or oral administration, especially co-administration with voriconazole. It is well-known that azole antifungal drugs are CYP450 inhibitors, which reduce the activity of CYP450, and lead to metabolic interactions between TAC and azole antifungal drugs. A previous study reported that voriconazole and fluconazole could increase TAC concentrations.22 According to the result of our study, cotreatment with voriconazole significantly increased TAC concentration in β-TM pediatric patients receiving Allo-HSCT, while fluconazole and posaconazole had limited effect. In addition, an in vitro study showed that voriconazole had a stronger inhibitory effect on TAC oxidative metabolism than fluconazole.23 Therefore, patients with Allo-HSCT should be given reduced TAC doses when combined with voriconazole, and TAC plasma concentrations should be closely monitored.
In the multivariate analysis, sex, weight, postoperative time, hemoglobin level, platelet counts, serum cystatin C levels, and the co-administration of voriconazole were independent influencing factors of C0/Div. Further, age, body surface area, postoperative time, co-administration of voriconazole, and CYP3A4 genotype are independent influencing factors of C0/Dpo. This means that when pediatric patients undergoing Allo-HSCT switch from intravenous to oral administration, the influence of blood parameters and renal function is weakened, while the influence of age and genotype is strengthened. Regardless of the method of administration, postoperative time, body weight, and combined use of voriconazole are important factors affecting the TAC concentration in pediatric patients receiving early Allo-HSCT. Thus, our findings are in accordance with previous studies reporting co-administration of voriconazole as an important factor influencing the conversion of intravenous to oral administration, not only in adults but also in pediatric patients receiving Allo-HSCT.23,24
In this study, we observed that prolonged postoperative time increased C0/D of TAC in the early period after transplantation. This phenomenon may be due to the gradual increase in hematocrit and albumin levels after transplantation over time, and the decreased activity of metabolic enzymes that leading to an increased TAC concentration.25 Similarly, previous pharmacokinetic studies indicated that the clearance rate of TAC decreases with prolonged postoperative time.26,27 Further, in patients receiving kidney transplantation, the concentration of TAC among obese patients (BMI>30 kg/m2) was higher than that in non-obese patients, and obese patients were also subject to the risk of overexposure when the same dose of 0.15 mg/kg/day was administered.28
Flabouris et al found that patients with higher BMI were more likely to develop acute nephrotoxicity and infection, and these adverse reactions may be related to the high concentration of TAC in kidney transplant patients.29 However, body weight was negatively correlated with C0/D in this study. This may due to the lack of obese patients (BMI>12.5–23.1 kg/m2) included in this study, and the clearance rate of TAC in children with normal weight may increase with increasing body weight, but further research is needed for confirmation of this effect.
In most medical institutions and transplant centers, trough concentration is an indicator for TAC therapeutic drug monitoring (TDM). C0 is a clinical indicator that is easy to obtain and is widely accepted, but it appears to be far from being an ideal biomarker for efficacy, as previous studies have shown that even if C0 was within the recommended treatment window, rejection and toxic reactions may still occur.6,30 Both solid organ transplantation and HSCT consensus and guidelines recommend monitoring TAC C0 as an indicator for judging efficacy.31 Nonetheless, the relationship between C0 and efficacy is very controversial. Studies in solid organ transplantation have reported that C0 is related to aGVHD, and there are also studies showing that there is no direct relationship.6,31–35 The results of this study indicate that TAC C0 is a poor indicator for the prevention and treatment of aGVHD.
This is the first study to report on the relationship between C0 and efficacy in allo-HSCT patients. After a patient undergoes chemotherapy, the immune system is weak and long-term immune remodeling greatly increases the risk of infection. Bonong et al found that the use of antithymocyte globulin in HSCT patients is an important risk factor for herpes infection after transplantation.36 Beswick et al reported that chronic GVHD and cytomegaloviremia were significantly associated with nontuberculous mycobacterial diseases.37 Likewise, we found that C0 can be used to monitor the occurrence of adverse reactions as the level of C0 significantly increases at the time of infection. It is worth noting that infections in transplant patients may not only be attributable to high concentration of TAC unilaterally, but also should be considered a comprehensive evaluation of the patient’s treatment status.
In this study, there was no significant differences in TAC concentration between patients experiencing hepatotoxicity and those with no evidence of hepatotoxicity. Most reports of hepatotoxicity caused by TAC are associated with patients with liver transplantation or liver disease.38,39 This indicates that patients with liver disease may be at increased risk of liver toxicity after receiving TAC treatment. Cyclophosphamide is also a hepatotoxic drug used in myeloablative therapy and patients included in this study all used cyclophosphamide as a pretreatment regimen. Most liver damage caused by drugs is reversible after stopping the drug. Therefore, the treatment of drug-induced liver toxicity should be detected and treated early.
Our study confirmed that TAC C0 was not highly correlated with efficacy in pediatric patients with thalassemia who received HSCT. It is known the drug AUC is another important indicator for monitoring levels of therapeutic drugs, and may better reflect the drug distribution in vivo than trough concentrations.40 According to an expert consensus,31 the guidelines for monitoring of TAC levels in solid organ transplantation recipients suggest that the AUC for TAC should be monitored when clinically indicated. However, given the current evidence it is still difficult to adopt the monitoring of the AUC for TAC, and further studies are needed to optimize this in the future.
Owning to the small sample size, this study did not analyze factors related to efficacy or risk factors associated with adverse reactions associated with TAC treatment combinations and genotypes. In addition, due to the small number of other types of adverse reactions, a correlative analysis could not be performed. For allo-HSCT pediatric patients, even larger sample sizes are required prior to definitively evaluating efficacy and adverse effects after transplantation.
Conclusions
Voriconazole significantly increase TAC trough concentration, thereby the dose of TAC should be adjusted during co-administration. When treated with oral TAC, the influence of different genotypes on TAC concentration should be considered, and individualized drug administration based on genotype can be carried out. Our multiple regression analysis indicated that the TAC trough concentration was affected by many factors; thus, it is necessary to closely monitor TAC concentrations during treatment period.
Acknowledgment
Chengxin Li and Jiejiu Lu made equal contributions as first authors of the paper.
Funding
The authors received no financial support for the research, authorship, and publication of this article.
Disclosure
The authors report no conflicts of interest for this work and declared no potential conflicts of interest with respect to the research, authorship, and publication of this article.
References
1. Taher AT, Musallam KM, Cappellini MD. Β-thalassemias. N Engl J Med. 2021;384(8):727–743. doi:10.1056/NEJMra2021838
2. Huang B, Lin X, Zhang Z, et al. Comparison of tacrolimus and cyclosporine combined with methotrexate for graft versus host disease prophylaxis after allogeneic hematopoietic cell transplantation. Transplantation. 2020;104(2):428–436. doi:10.1097/TP.0000000000002836
3. El-Hamamsy M, Montasser IF, Mansy AE, et al. Effect of cyclosporine a versus tacrolimus on the response to antiviral therapy after hepatitis c genotype-4 recurrence post-liver transplantation: a prospective cohort trial. J Clin Pharm Ther. 2019;44(3):447–453. doi:10.1111/jcpt.12807
4. Miano TA, Flesch JD, Feng R, et al. Early tacrolimus concentrations after lung transplant are predicted by combined clinical and genetic factors and associated with acute kidney injury. Clin Pharmacol Ther. 2020;107(2):462–470. doi:10.1002/cpt.1629
5. Hart A, Smith JM, Skeans MA, et al. Optn/srtr 2017 annual data report: kidney. Am J Transplant. 2019;19(Suppl 2):19–123. doi:10.1111/ajt.15274
6. Yu M, Liu M, Zhang W, et al. Pharmacokinetics, pharmacodynamics and pharmacogenetics of tacrolimus in kidney transplantation. Curr Drug Metab. 2018;19(6):513–522. doi:10.2174/1389200219666180129151948
7. Ling Q, Huang H, Han Y, et al. The tacrolimus-induced glucose homeostasis imbalance in terms of the liver: from bench to bedside. Am J Transplant. 2020;20:701–713.
8. Lue A, Martinez E, Navarro M, et al. Donor age predicts calcineurin inhibitor induced neurotoxicity after liver transplantation. Transplantation. 2019;103(8):e211–e215. doi:10.1097/TP.0000000000002750
9. Tholking G, Schutte-Nutgen K, Schmitz J, et al. A low tacrolimus concentration/dose ratio increases the risk for the development of acute calcineurin inhibitor-induced nephrotoxicity. J Clin Med. 2019;8(10):1586. doi:10.3390/jcm8101586
10. Venkataramanan R, Swaminathan A, Prasad T, et al. Clinical pharmacokinetics of tacrolimus. Clin Pharmacokinet. 1995;29(6):404–430. doi:10.2165/00003088-199529060-00003
11. Prasad N, Jaiswal A, Behera MR, et al. Melding pharmacogenomic effect of mdr1 and cyp3a5 gene polymorphism on tacrolimus dosing in renal transplant recipients in northern India. Kidney Int Rep. 2020;5(1):28–38. doi:10.1016/j.ekir.2019.09.013
12. Vanhove T, Annaert P, Kuypers DR. Clinical determinants of calcineurin inhibitor disposition: a mechanistic review. Drug Metab Rev. 2016;48(1):88–112. doi:10.3109/03602532.2016.1151037
13. Venkataramanan R, Zang S, Gayowski T, Singh N. Voriconazole inhibition of the metabolism of tacrolimus in a liver transplant recipient and in human liver microsomes. Antimicrob Agents Chemother. 2002;46(9):3091–3093. doi:10.1128/AAC.46.9.3091-3093.2002
14. Tron C, Woillard JB, Houssel-Debry P, et al. Pharmacogenetic-whole blood and intracellular pharmacokinetic-pharmacodynamic (pg-pk2-pd) relationship of tacrolimus in liver transplant recipients. PLoS One. 2020;15(3):e0230195. doi:10.1371/journal.pone.0230195
15. Lemaitre F, Antignac M, Fernandez C. Monitoring of tacrolimus concentrations in peripheral blood mononuclear cells: application to cardiac transplant recipients. Clin Biochem. 2013;46(15):1538–1541. doi:10.1016/j.clinbiochem.2013.02.011
16. Przepiorka D, Weisdorf D, Martin P, et al. 1994 consensus conference on acute gvhd grading. Bone Marrow Transplant. 1995;15(6):825–828.
17. Chalasani NP, Hayashi PH, Bonkovsky HL, et al. Acg clinical guideline: the diagnosis and management of idiosyncratic drug-induced liver injury. Am J Gastroenterol. 2014;109(7):950–966. doi:10.1038/ajg.2014.131
18. Hayashi PH, Fontana RJ. Clinical features, diagnosis, and natural history of drug-induced liver injury. Semin Liver Dis. 2014;34(2):134–144. doi:10.1055/s-0034-1375955
19. Möller A, Iwasaki K, Kawamura A, et al. The disposition of 14c-labeled tacrolimus after intravenous and oral administration in healthy human subjects. Drug Metab Dispos. 1999;27(6):633–636.
20. Hendijani F, Azarpira N, Kaviani M. Effect of cyp3a5*1 expression on tacrolimus required dose for transplant pediatrics: a systematic review and meta-analysis. Pediatr Transplant. 2018;22(6):e13248. doi:10.1111/petr.13248
21. Hamadeh IS, Zhang Q, Steuerwald N, et al. Effect of cyp3a4, cyp3a5, and abcb1 polymorphisms on intravenous tacrolimus exposure and adverse events in adult allogeneic stem cell transplant patients. Biol Blood Marrow Transplant. 2019;25(4):656–663. doi:10.1016/j.bbmt.2018.12.766
22. Peksa GD, Schultz K, Fung HC. Dosing algorithm for concomitant administration of sirolimus, tacrolimus, and an azole after allogeneic hematopoietic stem cell transplantation. J Oncol Pharm Pract. 2015;21(6):409–415. doi:10.1177/1078155214539825
23. Kanamitsu K, Yorifuji T, Ishida H, et al. Clinical factors affecting the dose conversion ratio from intravenous to oral tacrolimus formulation among pediatric hematopoietic stem cell transplantation recipients. Ther Drug Monit. 2020;42(6):803–810. doi:10.1097/FTD.0000000000000793
24. Suetsugu K, Ikesue H, Miyamoto T, et al. Analysis of the variable factors influencing tacrolimus blood concentration during the switch from continuous intravenous to oral administration after allogeneic hematopoietic stem cell transplantation. Int J Hematol. 2017;105(3):361–368. doi:10.1007/s12185-016-2135-7
25. de Jonge H, Vanhove T, de Loor H, et al. Progressive decline in tacrolimus clearance after renal transplantation is partially explained by decreasing cyp3a4 activity and increasing haematocrit. Br J Clin Pharmacol. 2015;80(3):548–559. doi:10.1111/bcp.12703
26. Ji E, Kim MG, Oh JM. Cyp3a5 genotype-based model to predict tacrolimus dosage in the early postoperative period after living donor liver transplantation. Ther Clin Risk Manag. 2018;14:2119–2126. doi:10.2147/TCRM.S184376
27. Zhang HJ, Li DY, Zhu HJ, et al. Tacrolimus population pharmacokinetics according to cyp3a5 genotype and clinical factors in Chinese adult kidney transplant recipients. J Clin Pharm Ther. 2017;42(4):425–432. doi:10.1111/jcpt.12523
28. Chinnadurai R, Ibrahim ST, Tay T, et al. Body weight-based initial dosing of tacrolimus in renal transplantation: is this an ideal approach? J Ren Care. 2021;47(1):51–57. doi:10.1111/jorc.12339
29. Flabouris K, Chadban S, Ladhani M, et al. Body mass index, weight-adjusted immunosuppression and the risk of acute rejection and infection after kidney transplantation: a cohort study. Nephrol Dial Transplant. 2019;34(12):2132–2143. doi:10.1093/ndt/gfz095
30. Wallemacq P, Armstrong VW, Brunet M, et al. Opportunities to optimize tacrolimus therapy in solid organ transplantation: report of the European consensus conference. Ther Drug Monit. 2009;31(2):139–152. doi:10.1097/FTD.0b013e318198d092
31. Brunet M, van Gelder T, Asberg A, et al. Therapeutic drug monitoring of tacrolimus-personalized therapy: second consensus report. Ther Drug Monit. 2019;41(3):261–307.
32. Winkler M, Ringe B, Baumann J, et al. Plasma vs whole blood for therapeutic drug monitoring of patients receiving fk 506 for immunosuppression. Clin Chem. 1994;40(12):2247–2253. doi:10.1093/clinchem/40.12.2247
33. Kershner RP, Fitzsimmons WE. Relationship of FK506 whole blood concentrations and efficacy and toxicity after liver and kidney transplantation. Transplantation. 1996;62(7):920–926. doi:10.1097/00007890-199610150-00009
34. Erden E, Warty V, Magnone M, et al. Plasma FK506 levels in patients with histopathologically documented renal allograft rejection. Transplantation. 1994;58(3):397–398. doi:10.1097/00007890-199408000-00031
35. Japanese FK 506 Study Group. Morphological characteristics of renal allografts showing renal dysfunction under fk 506 therapy: is graft biopsy available to reveal the morphological findings corresponding with fk 506 nephropathy? Transplant Proc. 1993;25(1 Pt 1):624–627.
36. Bonong PR, Zahreddine M, Buteau C, et al. Factors associated with post-transplant active Epstein-Barr virus infection and lymphoproliferative disease in hematopoietic stem cell transplant recipients: a systematic review and meta-analysis. Vaccines. 2021;9(3):288.
37. Beswick J, Shin E, Michelis FV, et al. Incidence and risk factors for nontuberculous mycobacterial infection after allogeneic hematopoietic cell transplantation. Biol Blood Marrow Transplant. 2018;24(2):366–372. doi:10.1016/j.bbmt.2017.09.015
38. Deng R, Liao Y, Li Y, et al. Association of cyp3a5, cyp2c8, and abcb1 polymorphisms with early renal injury in Chinese liver transplant recipients receiving tacrolimus. Transplant Proc. 2018;50(10):3258–3265. doi:10.1016/j.transproceed.2018.06.040
39. Taniai N, Akimaru K, Ishikawa Y, et al. Hepatotoxicity caused by both tacrolimus and cyclosporine after living donor liver transplantation. J Nippon Med Sch. 2008;75(3):187–191. doi:10.1272/jnms.75.187
40. Marquet P, Destère A, Monchaud C, et al. Clinical pharmacokinetics and bayesian estimators for the individual dose adjustment of a generic formulation of tacrolimus in adult kidney transplant recipients. Clin Pharmacokinet. 2020;60(5):611–622. doi:10.1007/s40262-020-00959-y
 © 2021 The Author(s). This work is published and licensed by Dove Medical Press Limited. The
full terms of this license are available at https://www.dovepress.com/terms
and incorporate the Creative Commons Attribution
- Non Commercial (unported, 3.0) License.
By accessing the work you hereby accept the Terms. Non-commercial uses of the work are permitted
without any further permission from Dove Medical Press Limited, provided the work is properly
attributed. For permission for commercial use of this work, please see paragraphs 4.2 and 5 of our Terms.
© 2021 The Author(s). This work is published and licensed by Dove Medical Press Limited. The
full terms of this license are available at https://www.dovepress.com/terms
and incorporate the Creative Commons Attribution
- Non Commercial (unported, 3.0) License.
By accessing the work you hereby accept the Terms. Non-commercial uses of the work are permitted
without any further permission from Dove Medical Press Limited, provided the work is properly
attributed. For permission for commercial use of this work, please see paragraphs 4.2 and 5 of our Terms.