")
Back to Journals » International Journal of Nephrology and Renovascular Disease » Volume 15
Influences of Financial Strains Over the Life Course Before Initiating Hemodialysis on Health Outcomes Among Older Japanese Patients: A Retrospective Study in Japan
Authors Sugisawa H , Shimizu Y, Kumagai T, Shishido K, Shinoda T
Received 14 December 2021
Accepted for publication 29 January 2022
Published 27 February 2022 Volume 2022:15 Pages 63—75
DOI https://doi.org/10.2147/IJNRD.S352174
Checked for plagiarism Yes
Review by Single anonymous peer review
Peer reviewer comments 2
Editor who approved publication: Professor Pravin Singhal
Hidehiro Sugisawa,1 Yumiko Shimizu,2 Tamaki Kumagai,3 Kanji Shishido,4 Toshio Shinoda5
1International Graduate School for Advanced Studies, J. F. Oberlin University, Machida-city, Tokyo, Japan; 2The Jikei University School of Nursing, Chofu-city, Tokyo, Japan; 3Graduate School of Health Sciences at Odawara, International University of Health and Welfare, Odawara-city, Kanagawa, Japan; 4Kawasaki Clinic, Kawasaki-city, Kanagawa, Japan; 5Faculty of Medical and Health Sciences, Tsukuba International University, Tsuchiura-city, Ibaraki, Japan
Correspondence: Hidehiro Sugisawa, International Graduate School for Advanced Studies, J. F. Oberlin University, 3758, Machida-city, Tokyo, 194-0294, Japan, Tel/Fax +81(0)02-797-9847, Email [email protected]
Purpose: This study analyzed the influence of financial strains over the life course before initiating hemodialysis on the health outcomes of older Japanese patients. This study was limited to financial strains over the life course before initiating hemodialysis to eliminate the influence of financial strains resulting from resignation from paid jobs. We examined which of the four life course models—pathway, latent, social mobility, and accumulation—were appropriate to describe the influences of financial strains over the life course on older patients’ health.
Patients and Methods: Data were obtained from a cross-sectional survey of 6,644 outpatients in dialysis facilities across Japan. We selected participants aged 60 years and older at the time of the survey. Numbers of dialysis complications, activities of daily living (ADL) disability, and depressive symptoms were selected as health outcomes. Benchmark periods over the life course were constructed in three parts: less than 18 years (childhood), 18– 35 years (young adults), and 35– 50 years (middle-aged). We retrospectively measured financial strains over the life course.
Results: Pathway models best described the influence of financial strains over the life course on the three types of health outcomes. Experiences of financial strains as young adults had a direct influence on ADL disability of older patients. This result supports latent models. Social mobility models (upward and downward mobility) and accumulation models explained the number of dialysis complications, ADL disability, and depressive symptoms in older patients.
Conclusion: These results suggest that socioeconomic disadvantages over the life course before initiating hemodialysis were significantly associated with health outcomes in older patients.
Keywords: socioeconomic status over the life course, latent models, social mobility models, accumulation models, pathway models
Introduction
Chronic kidney disease (CKD) is an important cause of morbidity and mortality from non-infectious diseases.1 In 2017, the number of patients of all-stage CKD was estimated at 697.5 million, with a global prevalence of 9.1% in 2010, and the number of patients with end-stage kidney disease (ESKD) who required renal replacement therapy were predicted to be between 4.9 and 9.7 million.2 In the future, the number of deaths due to CKD and the number of patients with ESKD are projected to increase rapidly.1,2 Patients with ESKD have various health problems, such as frailty,3,4 malnutrition,5 cognitive impairment,6 and depression,7 as well as daily-life problems, such as impaired quality of life,8 low levels of recreational and work activities,9,10 and poor dietary habits.11 Furthermore, CKD brings a serious financial burden on the society. More than 2–3% of the annual health-care budget is typically spent on ESKD in high-income countries, even though persons receiving ESKD treatment occupy less than 0.03% of the entire population.12
Exploring psychological and social factors related to the onset and deterioration of all-stage CKD is important to specify targets for interventions, useful to prevent and reduce serious negative impacts on individuals and society. Existing literature on the topic includes studies predominantly focusing on socioeconomic status (SES) as a social factor. It has been found that SES influences all-stage CKD from the incidence of CKD to mortality related to ESKD. For example, meta-analyses indicate that the incidence and prevalence of CKD and ESKD significantly differ by SES at the individual or area levels.13,14 Studies also reveal that the SES of patients with CKD and ESKD affects several health outcomes in terms of complications,15 activities of daily living (ADL),16,17 depressive symptoms,15,18,19 quality of life,20–26 and mortality.27
However, there are several lacunae in previous studies regarding the relationship between SES and incidence and deterioration of CKD. First, only a few studies have focused on the influence of SES over the life course on the incidence or deterioration of CKD. Studies of the effects of SES differences on health in the general population indicate that not only current SES but also SES over the life course influences health.28 Four types of models related to influences of SES over the life course on health have been established: latent, pathway, social morbidity, and accumulation models.29 According to the latent models, adverse exposure to SES disadvantage at a given time adversely has a negative impact on health after a relatively longer time has passed since this exposure. The pathway models indicate that early SES disadvantages influences health in later life through a subsequent chain of exposure to disadvantage. Regarding the social mobility models, downward or upward socioeconomic mobility influences health in later life. According to the accumulation models, exposure to SES disadvantage at various points throughout a person’s life course has a cumulative effect on health in later life. Two models of the pathway and accumulation models appear to be similar. However, these two models have different timings of exposure to SES disadvantages. The accumulation models assume that health in later life is indirectly or interactively influenced by each SES disadvantage over the life course, whereas the pathway models assume that only SES disadvantage in later life directly influences health in later life and SES disadvantage earlier only has an indirect influence.30 Two studies based on the latent models found that earlier SES over the life course, such as SES in childhood and 30s, influenced the incidence of CKD in later life.31,32 Two other studies have reported results that support the accumulation models for the prevalence and incidence of CKD.33,34 However, no studies have elucidated which model can explain the influence of SES over the life course on health related to CKD and ESKD using multiple models at the same time in one study.
Second, older adults have been the subject of only a few studies. Although one study found that SES influenced prevalence of CKD in older adults,35 two other studies showed that older adults’ SES did not have an influence on the prevalence and progress of CKD.36,37 In previous studies that examined differences in the influence of SES on health outcomes in patients with ESKD by age, SES had a weaker influence on health in older patients than in younger patients.15,38,39 There are two explanations for the decrease in SES health differences at higher ages.40 One explanation attributes it to factors such as governmental support for older adults. Another explanation relies on mortality selection. Frail individuals are considered to die earlier than robust ones, so that a given age cohort is gradually selected toward robustness, thereby causing the convergence of the high and low mortality groups. However, whether SES over the life course has an influence on the health of older patients undergoing dialysis remains unclear because empirical studies are lacking.
Third, only a few studies have been conducted in countries other than the US and European countries. The influence of SES at the geographical area or individual level on the incidence and prevalence of CKD/ESKD has been examined in Australia,41–43 Taiwan,44 and Thailand.43 The relationships among SES, depression, and quality of life in patients with CKD/ESKD have been examined in Brazil,23,24,45 Ethiopia,22 India,46,47 Japan,15 and Taiwan.21 Japan had achieved high sustained economic growth for a long period after the Second World War.48 It was assumed that the equitable distribution of the benefits of that economic growth contributed to maintaining low levels of inequality,49 although according to one report, Japan is ranked at 11th out of 34 countries in terms of the Gini coefficient of inequality in recent times.50 Meanwhile, Japan has an Eastern culture with ideas and attitudes that emphasize cooperation among individuals and do not highlight the independence of each individual and autonomy of the self as Western cultures.51 As it is possible that Eastern and Western cultures have different characteristics of social relationships that can moderate the influence of SES on health,52 a specific analysis of the Japanese population might shed light on the influence of SES over the life course on health in later life.
We examined the influence of financial strains over the life course before initiating hemodialysis on health outcomes among older patients. Patients undergoing dialysis have a high likelihood of financial strains as a result of resignation from paid work when initiating dialysis.10 By considering financial strains over the life course before initiating dialysis, it is possible to eliminate the influence of financial strains associated with initiating dialysis as much as possible. We evaluated which of the four types of models (latent, pathway, social mobility, and accumulation) best describe the influences of financial strains over the life course.
In Japan, patients who need hemodialysis can undergo their treatment for a small out-of-pocket cost at any dialysis facility across Japan. Specifically, for those patients whose annual income is less than 6 million yen (about 53,000 dollars) after tax, the limit of the monthly cost is 10,000 yen (about 90 dollars), and for those with a higher income the limit is 20,000 yen (about 180 dollars).
Methods
Data
Cross-sectional data for analyses were collected in 2016 from all outpatients and their physicians across 118 dialysis facilities. The physicians were members of the Japan Association of Dialysis Physicians. There were five steps to the survey. First, facilities where all 923 members of the Association worked for were requested to participate in the survey and 118 dialysis facilities agreed. Second, self-administered questionnaires were sent to these facilities. Third, the questionnaires were distributed to all the outpatients by the medical staff. Fourth, the questionnaires were completed and then sealed in an envelope by the patients so that the physicians could not see patients’ responses. Afterwards, the patients handed over the completed questionnaires to the physicians. Lastly, physicians answered questionnaires regarding their patients and both sets of questionnaires were sent to the survey secretariat. The total number of outpatients in dialysis facilities that agreed to participate was 12,367. The number of paired sets of questionnaires responded to by both patients and their physicians was 7191, of which 2936 participants who started hemodialysis at 60 years of age or later were selected as subjects for analyses.
Measures
Financial Strains Over the Life Course
Financial strains were measured as a proxy for disadvantageous SES over the life course. Three benchmark periods were set over the life course: <18 years old (childhood), 18–35 years old (young adults), and 35–50 years old (middle-aged). Financial strains in each period were evaluated retrospectively. Kahn and Pearlin developed questions to evaluate financial strains over the life course.53 The validity of retrospective self-reported financial strains was supported in studies by Kahn et al53 and Sugisawa et al.28 They indicated that variables derived from retrospectively self-reported answers regarding financial strains over the life course significantly influence older adults’ health. High reliability of recalled information about social circumstances over the life course in older adults has also been demonstrated by a previous study.54 This indicates relatively high reliability of such retrospective financial strain data. We evaluated financial strains in the period younger than 18 years by asking participants the following question: “Did your family have trouble covering expenditures for necessities, such as food, clothes, and housing?” with the response options of “a lot of trouble,” “some trouble,” “a little trouble,” and “no trouble.” For groups aged 18–35 and 35–50 years, “your family” in the question was changed to “you.” In addition, we measured the level of current financial strains by asking, “How do you rate your family’s household finances?” with the response options of “very difficult,” “somewhat difficult,” “neither,” “a little difficult,” and “not at all difficult.”
For data analysis using the latent and pathway models, the response options were rated as 1 (no trouble), 2 (a little trouble), 3 (some trouble), and 4 (a lot of trouble) for the questions on financial strains for the age of <18, 18–35, and 35–50 years. Similarly, response options for current financial strains were rated as 1 (not at all difficult), 1.6 (a little difficult), 2.4 (neither), 3.2 (somewhat difficult), and 4 (very difficult) to equalize the maximum score with that of the financial strains for the remaining three age ranges. For data analysis using the social mobility and accumulation models, participants were categorized into two groups based on their responses: 1) exposure to financial strain group—those who chose “a lot of trouble” or “some trouble” (“very difficult” or “somewhat difficult” for current age) and 2) without exposure to financial strains group—those who chose “a little trouble” or “no trouble” (“neither,” “a little difficult,” or “not at all difficult” for current age).
Health Outcomes
The number of dialysis complications and ADL disability were used as a measure of physical health. These data were collected from dialysis physicians. They were asked about the presence of infection and complications related to dialysis among the patients in each of the eight organ systems: circulatory, digestive, neural/mental, articular/muscular, infection, ophthalmologic, blood, and dermatologic because dysfunction in several organ systems can be induced by hemodialysis.55 Accordingly, dialysis physicians determined whether these symptoms and diseases were complications of dialysis. We also assessed intradialytic complications, as the adverse symptoms and events that occurred during dialysis, including increased or decreased hypertension, arrhythmia, muscle spasms, bellyache, itch, shunt puncture difficulties, and blood failure. While improvements in hemodialysis technology have prevented most incidences of intradialytic complications, it is known that patients’ SES strongly influences their motivation and education that emphasizes the need to restrict dietary sodium intake for reducing intradialytic complications such as hypertension.56 Participants with at least one of the abovementioned symptoms were considered patients with intradialytic complications. An indicator of dialysis-related complications was created by counting the number of organ systems with complications. We also added an extra point if respondents had intradialytic complications.
We evaluated the levels of ADL disability by asking participants how much aid was needed for each five ADL: taking a bath, putting on/taking off clothes, eating, moving in the room, and using the toilet. Choices were scored on a 5-point scale from “can do without difficulty” to “need total assistance always.” Participants with one or more items rated below “can do without difficulty” were categorized as having ADL disability. We used depressive symptoms as the mental health indicator. Depressive symptoms in patients undergoing dialysis is linked to an increased risk of mortality and hospitalization.57 K6 has been widely used to evaluate depressive symptoms.58,59 The clinical cutoff point for K6 was 4/5, which was used to screen persons with a possibility of depression.60
Participants with missing values less than or equal to 20% of the items that composed each individual scale were added for analyses by substituting individual mean scores for all responded items into items with missing values. The total score of participants was calculated by multiplying the individual mean score of all items by the number of all items. This method has been proven to be effective to deal with missing values in surveys using scales composed of multiple items.61,62
Control Variables
Control variables included age, sex, educational attainment, causative diseases of undergoing hemodialysis, and duration of hemodialysis. In terms of educational attainments, participants were asked to select one of the following educational attainments as a last graduated school: “junior high school,” “high school,” “vocational school,” “junior college,” “university,” or “graduate school.” To qualify their responses, numbers 9, 12, 13, 14, 16, and 18 were assigned to each category. These figures represent the number of years of education in Japan’s educational system. Causative diseases of undergoing hemodialysis included four types: chronic glomerulonephritis, diabetes, nephrosclerosis, and others.
Statistical Methods
The analytic model based on the latent and pathway models in this study was based on Sugisawa et al.28 This model is described in Figure 1. Each symbol of e, f, and g means the latent effects at each of the three periods and a–d means the pathway effects from financial strains at <18 years of age on current financial strains. Whether or not the pathway models were valid was assessed by examining indirect influences on health outcomes of financial strains in the earlier periods by mediating financial strains in later periods. Validity of the latent models was assessed by examining whether or not any significant influence of financial strains in each period on health remained even after controlling for the direct and indirect influence of financial strains in other periods. Indirect influences in the multiple-factor model were examined by using multiple mediation analysis proposed by Preacher and Hayes.63
 |
Figure 1 Analytic model based on the latent period effects model and the pathways model. Notes: The symbols e, f, and g indicate the latent period effects, whereas a–d indicate the pathway effects. |
Whether or not the social mobility models were valid was tested by comparing six patterns of social mobility. We divided participants into two groups based on whether or not they experienced financial strains when they were 18 years old. First group included participants who did not face financial strains at <18 years of age. This group served to examine the influence of downward mobility on health in later life. By using no financial strains over the life course as the reference pattern, the influence of “downward mobility” and “upward mobility after downward mobility” on health outcomes was examined. Second group included participants who had financial strains at <18 years of age. This group was used to examine the influence of upward mobility on health in later life. Specifically, by using continuous financial strains over the life course as the reference pattern, the influence of “upward mobility” and “downward mobility after upward mobility” on health outcomes was examined. In terms of the validity of the accumulated model, the influences of one, two, and three exposure frequencies on financial strains over the life course without current financial strains on health outcomes were examined by comparing with no financial strains over the life course as the reference.
We added control variables to all analytic models to examine the unique influence of financial strains over the life course when we examined the influence of financial strains over the life course on health. In addition, the influence of each indicator of financial strains over the life course was examined by entering variables regarding the latent models and pathway models, the social mobility models, and the accumulation models in the statistical model separately, because correlations between the indicators of financial strains over the life course were strong. We used the ordinary regression to examine comorbidity as a dependent variable. A multivariate logistic regression method was used with ADL disability and depressive symptoms as dependent variables. Cases that did not have any missing values occupied 76.4% of the total analyzed participants (N = 2,244). Table 1 shows that frequency of financial strains over the life course and patterns of social morbidity were variables with the highest missing values (each 14.7%) and the frequency of financial strains over the course of life was also a variable with a relatively high missing value rate (12.3%). Missing value rates of other items or scales were less than 10%. Participants who were excluded from the analysis because of missing values in the variables had the following characteristics: older, higher rate of female patients, lower educational attainment, longer period of dialysis, larger number of complications, and higher levels of financial strains in every period of the life course. We employed a full information maximum likelihood approach to handling missing data in the analysis.64 The root mean square error of approximation (RMSEA) and comparative fit index (CFI) were used for the overall model fit. A standard of good model fit RMSEA was a value below 0.05,65 and that of CFI was a value above 0.90.66 Mplus Version 8.1 software64 was used for the analysis.
 |
Table 1 Distribution of Financial Strains, Control Variables, and Health Variables of Participants |
Ethical Considerations
We conducted this study in accordance with the Helsinki Declaration guidelines, and the Research Ethics Board of J. F. Oberlin University approved all procedures of this study (Approval Number:16015, Approval date: August 8, 2016). The self-administered anonymous questionnaire with the invitation letter explaining the study content was distributed to each potential survey participant. The letter explained study outline, participants’ rights, privacy protection, and similar issues. We asked participants to hand the completed questionnaires to physicians only if they agreed to participate in the survey. Completed questionnaires were sealed in an envelope and were handed to their physicians by participants. The seal was to prevent the physicians from seeing the patients’ responses. The responses were voluntary, and confidentiality was guaranteed.
Results
Participants’ Characteristics
The participants’ characteristics are listed in Table 1. The participants’ mean age was 74.8 years. Men occupied 33.2% of participants. Diabetes and chronic glomerulonephritis were diagnosed as causal diseases in 38.9% and 25.8% of participants, respectively. Among the four time periods (<18, 18–35, 35–50, and the current age), relatively high levels of participants experienced financial strains at <18 years and the current age. We ensured equalized comparison between the financial strain responses for current time and the other three time periods, by converting the 5-point responses for the former into a 4-point scale by multiplying 2, 3, 4, and 5 with 0.8. The percentages of participants who were divided into three patterns regarding social mobility—no financial strains over the life course, upward mobility, and downward mobility—were 31.5%, 32.5%, and 9.0%, respectively. The number of experiences of financial strains over the life course was 36.7% (none) and 24.0% (one).
Analysis Using the Latent and Pathway Models
The results of the analyses using the latent and pathway models are shown in Table 2. Experience of financial strains at <18 years was significantly and indirectly linked to worse levels of all three health outcomes by mediating the appearance of financial strains in later periods. Accordingly, it is suggested that the pathway models are useful for describing the influence of financial strains over the life course on all health outcomes in later life. Experience of financial strains at 18–35 years significantly influenced ADL disability in later life, even after the direct and indirect influences of financial strains in other periods were controlled. Contrary to our hypotheses, experience of financial strains at <18 years was significantly associated with better ADL ability in later life. Experience of financial strains at 35–50 years was significantly related to higher depressive symptoms after the direct and indirect influences of financial strains in other periods were controlled. The latent models are partly supported by these results.
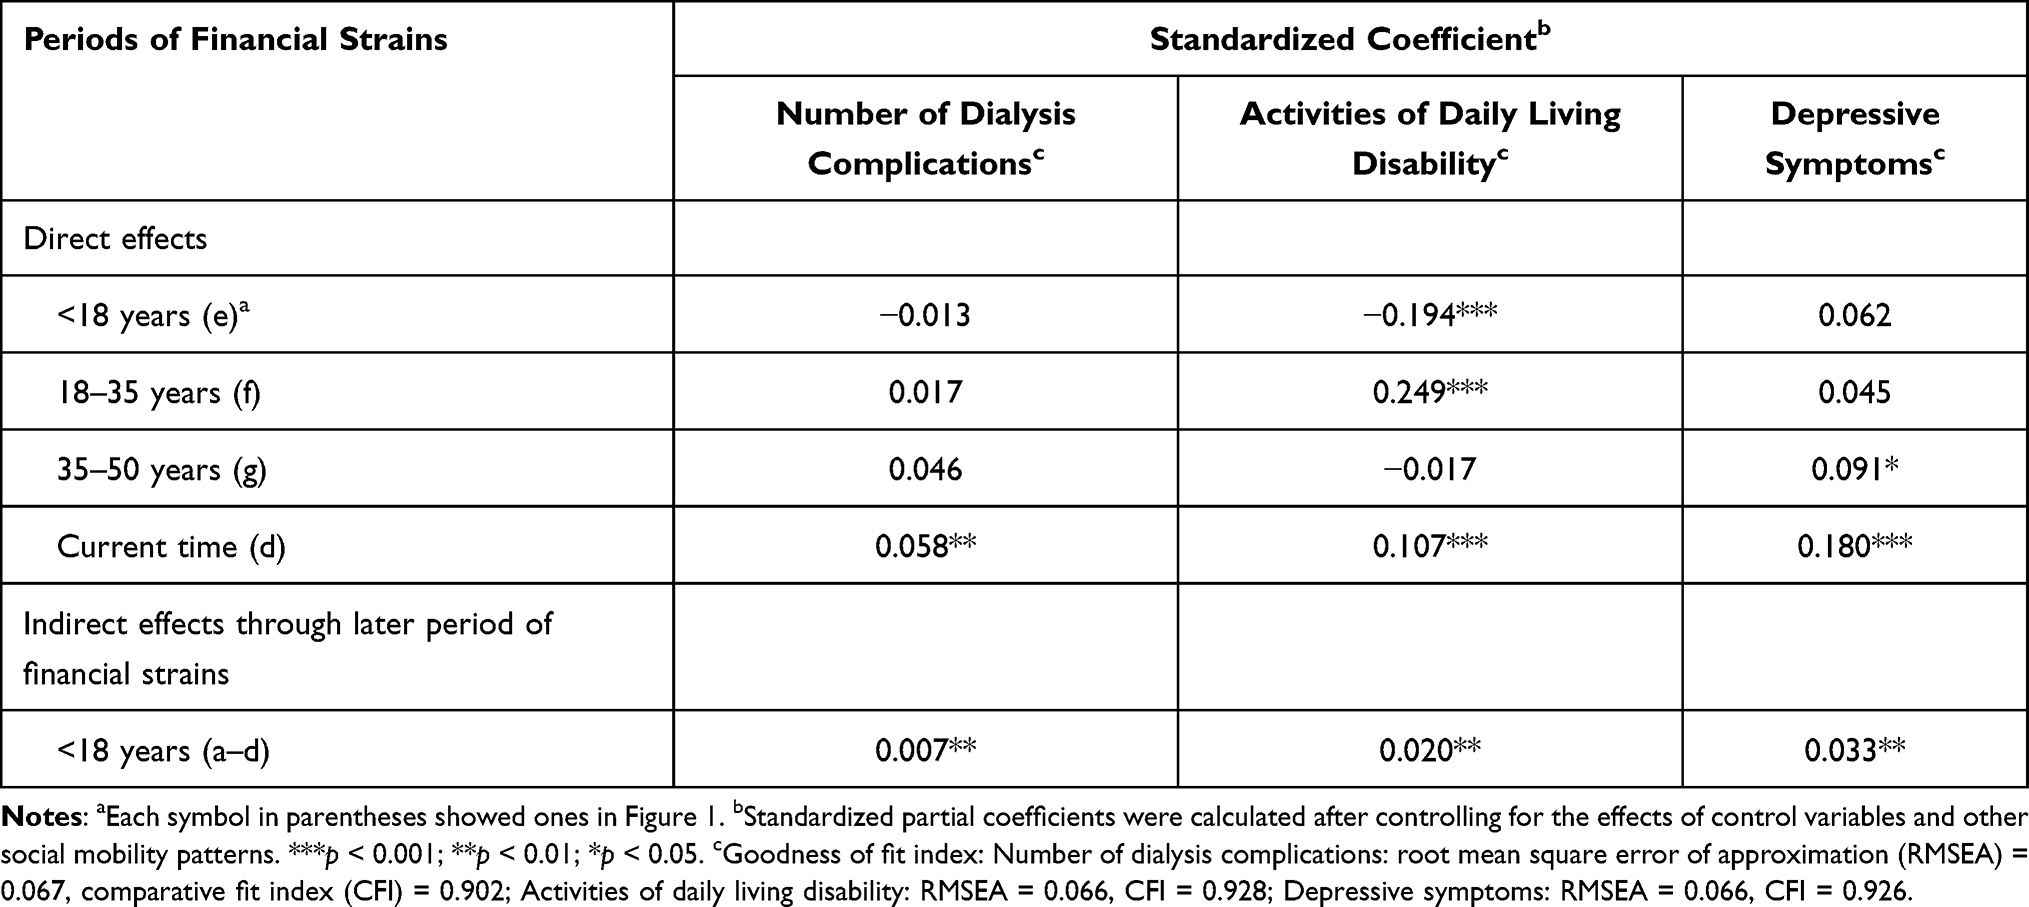 |
Table 2 Analysis Based on the Latent Period Effects Model and the Pathways Model |
Analysis Using the Social Mobility Models
Table 3 shows that participants who experienced upward mobility had significantly better conditions for the three health outcomes than those who had continuous financial strains over the life course. In addition, participants who had downward mobility after upward mobility had significantly better conditions for both ADL disability and depressive symptoms than those who had continuous financial strains over the life course. Participants who had downward mobility had significantly higher rates of ADL disability and depressive symptoms than did participants who never had such financial strains over the life course. There were no significant differences in the three health indicators between participants who had upward mobility after downward mobility and those who had never experienced financial strains. These results reflect the validity of social mobility models.
 |
Table 3 Effects of Social Mobility Patterns on Health Outcomes |
Analysis Using the Accumulation Models
Table 4 shows that participants who had a greater number of experiences of financial strains over the life course had a significantly higher rate of depressive symptoms. Only participants who had experienced all three periods of financial strains had higher numbers or rates than those without financial strains in terms of the number of dialysis complications and ADL disability.
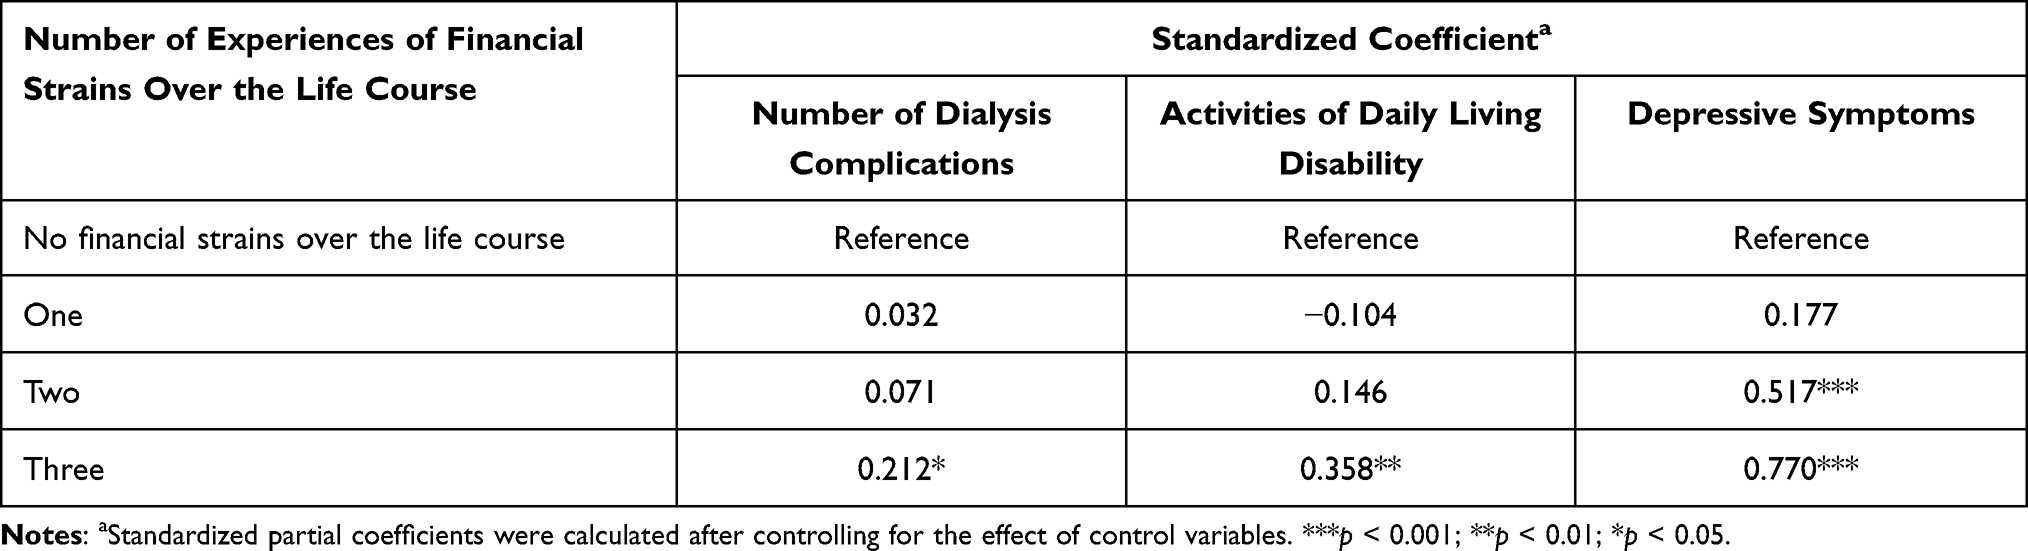 |
Table 4 Effects of the Accumulation of Financial Strains on Health Outcomes |
Discussion
The influence of SES over the life course on the health status of older adults has been examined by surveys of the general population in both Western and East Asian countries.28 However, the types of models that properly describe the influence of SES over the life course on health status in older adults with diseases remain unclear. This study examined whether each of the four models significantly described health outcomes of older Japanese patients undergoing hemodialysis. Table 5 summarizes the results of this study. For the variables based on the latent models, both periods—18–35 years and 35–50 years of age—significantly influenced ADL disability and depressive symptoms separately. The variables regarding the pathway models significantly influenced all three health outcomes. Three patterns of social mobility—upward, downward after upward, and downward—had a significant influence on ADL disability and depressive symptoms. Only upward mobility significantly influenced the number of dialysis complications. Regarding the accumulation models, more the experiences of financial strains over the life course, higher the rate of depressive symptoms. In addition, only participants who experienced continuous financial strains at all periods over the life course had a significant higher number of dialysis complications and a higher rate of ADL disability than those who had no financial strain experience.
 |
Table 5 Summary of the Results of This Study |
Although our analyses indicated that the current time of financial strains significantly influenced all three health outcomes, these influences not only appeared by experience of financial strains in later life but were also contributed to by earlier periods of experience of financial strains from childhood to middle age. Accordingly, these results support the utility of pathway models for describing the influence of SES over the life course on health outcomes in older patients undergoing hemodialysis. A study by Sugisawa et al28 on participants from representative samples of older adults in Japan indicates that the influence of SES over the life course on comorbidity, ADL disability, and depressive symptoms in Japanese older adults is explained by pathway models. It is suggested that even in older patients undergoing hemodialysis, chains of disadvantages over the life course before initiating hemodialysis continue to have an adverse effect on health even after initiating dialysis, and as a result, deteriorate health outcomes.
In addition, participants who experienced financial strains at <18 years of age had lower ADL disability than those who did not, even after controlling for the influence of financial strains in other periods, which suggests a result opposite to the hypothesis: An experience of poor childhood SES leads to worse conditions of CKD at later life.67 Although a review article indicates that poorer childhood SES is related to lower physical function in adulthood,68 some studies found that childhood SES did not seem to significantly affect the prevalence of physical function impairment in middle-aged and older adults.28,53,69,70 Such selection bias, which leaves a predominance of older patients with physical robustness, may contribute to the observed significant influence of financial strains during childhood on the low prevalence of ADL disability in older patients. Meanwhile, the 18–35 age range was observed as a latent period for the extent of ADL disability in older patients undergoing hemodialysis. In terms of change in function over the life course, the peak of function is reached at late adolescence, and it appears that SES at early adulthood is a strong determinant of the rate of decline after this peak.71 In addition, one study suggested that 30 years of age is a critical period of appearance of adults’ CKD.31 Due to rapid decline in function and increasing risk of CKD due to experience of financial strains in early adulthood, it is possible that the age range of 18–35 years is a critical period for the level of ADL disability in older patients undergoing dialysis.
In terms of accumulation models, two health outcomes, the number of dialysis complications and ADL disability, were significantly worse in participants who experienced three instances of financial strains over their life course than in those who did not experience financial strains. A study indicated that the risk for diabetes and stroke is likely to increase in participants aged ≥18 years,72 when they undergo four or more adverse experiences during childhood compared to those reporting fewer exposures, but no such criteria were found for the risk of depression. Appearance of chronic diseases and physical and cognitive disabilities require longer periods of exposure to low level of SES than emotional distress.73 Our results suggest that a threshold of frequency of financial strains over the course of life is present for these two health outcomes.
In this study, the financial strains experienced during upward mobility before initiating hemodialysis had a significant influence on the three outcomes, even in older patients. This is consistent with results of previous studies of late middle-aged and older general population.28,69,74–78 This study also indicated that positive influences of upward mobility on ADL disability and depressive symptoms appeared even if downward mobility after upward occurred in later life. The negative influence of continuous financial strains over the life course on health may disappear due to experiencing upward mobility after childhood. The influence of downward mobility on health was associated with worse level of ADL disability and depressive symptoms. In older patients undergoing hemodialysis as well as the general population,28,69,75,77,79 negative influences of downward morbidity over the life course on health in later life were observed. However, this study indicated that the negative influence of downward mobility on ADL disability and depressive symptoms did not disappear even if upward mobility after downward in later life occurred. The negative influence of downward mobility on health may not disappear in older patients undergoing hemodialysis if upward mobility follows downward mobility.
When interpreting the results, some limitations of the study must be considered. First, although this study selected participants who began their hemodialysis at the age of 60 or later, deterioration of CKD occurs over time and may lead to discontinuation of paid work, affecting job conditions and economic status. Therefore, it is possible that some participants experienced financial strains over the life course due to the worsening CKD rather than initiating hemodialysis, which may have biased the current study findings. Second, we used cross-sectional data for the analysis. Longitudinal surveys that follow up with the same participants from childhood to old age are required to examine the influence of SES over the life course on health in later life. Such survey data can allow specifying a causal linkage between SES over the life course and health in later life in terms of time difference between cause and effect and eliminate recall bias, which is a concern for retrospective methods of SES over the life course. However, because long-term longitudinal data are almost unavailable at present, cross-sectional or short-term longitudinal data had to be used in previous studies, leaving problems regarding specification of the causal linkage and recall bias. In this study, recall bias errors in childhood SES measures for assessing SES over the life course may be related with underestimation of the true impact of SES during childhood on health in later life.29,80 In addition, according to a study by Lynch, Kaplan, and Shema, the influence of SES over the life course on functional levels is evident even though people who had more sustained financial strains had a higher possibility to have died before the follow-up survey, and therefore their analysis excluded the dead people.81 The increased risk of death is a confounding factor that is likely to reduce the influence of the sustained financial strains on functioning in those who remained in the follow-up survey. Therefore, it can be said that the significant influence of financial strains over the life course and health outcomes described in this study have relatively high reliability. Third, poor health in childhood was not controlled in this study because information about this factor was not included in the data available. It is possible that poor health in childhood significantly confounds the influence of financial strains over the life course on health in later life.82
Conclusion
The influence of financial strains over the life course before initiating hemodialysis on the health outcomes of older Japanese patients was examined in this study. We examined which of the four life course models—latent, social mobility, accumulation, and pathway—were appropriate to describe the influences of financial strains over the life course on health in later life. The results indicate that pathway models best described the influence of financial strains over the life course on the three types of health outcomes. Experiences of financial strains as young adults had a direct influence on ADL disability in older patients. This result supports latent models. Social mobility models (upward and downward mobility) and accumulation models explained the number of dialysis complications, ADL disability, and depressive symptoms in older patients.
Acknowledgments
We would like to thank the dialysis physicians from the Japan Association of Dialysis Physicians, who collaborated with us on this study.
Funding
This work was supported by The Japanese Association of Dialysis Physicians and the Japan Association of Kidney Disease Patients.
Disclosure
The authors have no conflicts of interest in this work.
References
1. Bikbov B, Purcell CA, Levey AS; GBD Chronic Kidney Disease Collaboration. Global, regional, and national burden of chronic kidney disease, 1990–2017: a systematic analysis for the Global Burden of Disease Study 2017. Lancet. 2020;395:709–733. doi:10.1016/S0140-6736(20)30045-3
2. Liyanage T, Ninomiya T, Jha V, et al. Worldwide access to treatment for end-stage kidney disease: a systematic review. Lancet. 2015;385:1975–1982. doi:10.1016/S0140-6736(14)61601-9
3. Chowdhury R, Peel NM, Krosch M, et al. Frailty and chronic kidney disease: a systematic review. Arch Gerontol Geriatr. 2017;68:135–142. doi:10.1016/j.archger.2016.10.007
4. Kojima G. Prevalence of frailty in end-stage renal disease: a systematic review and meta-analysis. Int Urol Nephrol. 2017;49:1989–1997. doi:10.1007/s11255-017-1547-5
5. Carrero J, Thomas F, Nagy K, et al. Global prevalence of protein-energy wasting in kidney disease: a meta-analysis of contemporary observational studies from the International Society of Renal Nutrition and Metabolism. J Ren Nutr. 2018;28:380–392. doi:10.1053/j.jrn.2018.08.006
6. Brodski J, Rossell SL, Castle DJ, et al. A systematic review of cognitive impairments associated with kidney failure in adults before natural age-related changes. J Int Neuropsychol Soc. 2019;25:101–114. doi:10.1017/S1355617718000917
7. Palmer S, Vecchio M, Craig JC, et al. Prevalence of depression in chronic kidney disease: systematic review and meta-analysis of observational studies. Kidney Int. 2013;84:79–191. doi:10.1038/ki.2013.77
8. Arceo E, Dizon G, Salunga MA, et al. A review of the quality of life of hemodialysis, breast cancer, and type 2 diabetes mellitus patients. SN Compr Clin Med. 2020;2:149–157. doi:10.1007/s42399-020-00222-2
9. Purnell TS, Auguste P, Crews DC, et al. Comparison of life participation activities among adults treated by hemodialysis, peritoneal dialysis, and kidney transplantation: a systematic review. Am J Kidney Dis. 2013;62:953–973. doi:10.1053/j.ajkd.2013.03.022
10. van Manen JG, Korevaar JC, Dekker FW, et al. Changes in employment status in end-stage renal disease patients during their first year of dialysis. Perit Dial Int. 2001;21:595–601. doi:10.1177/089686080102100610
11. Sugisawa H, Shinoda T, Shimizu Y, et al. Psychosocial mediators between socioeconomic status and dietary restrictions among patients receiving hemodialysis in Japan. Int J Nephrol. 2019;2019:Article ID 7647356. doi:10.1155/2019/7647356
12. Couser WG, Remuzzi G, Mendis S, et al. The contribution of chronic kidney disease to the global burden of major noncommunicable diseases. Kidney Int. 2011;80:1258–1270. doi:10.1038/ki.2011.368
13. Vart P, Gansevoort RT, Joosten MM, et al. Socioeconomic disparities in chronic kidney disease: a systematic review and meta-analysis. Am J Prev Med. 2015;48:580–592. doi:10.1016/j.amepre.2014.11.004
14. Zeng X, Liu J, Tao S, et al. Associations between socioeconomic status and chronic kidney disease: a meta-analysis. J Epidemiol Community Health. 2018;72:270–279. doi:10.1136/jech-2017-209815
15. Sugisawa H, Shimizu Y, Kumagai T, et al. Effects of socioeconomic status on physical and mental health of hemodialysis patients in Japan: differences by age, period, and cohort. Int J Nephrol Renovasc Dis. 2016;9:171–182. doi:10.2147/IJNRD.S107031
16. Cook WL, Jassal SV. Functional dependencies among the elderly on hemodialysis. Kidney Int. 2008;73:1289–1295. doi:10.1038/ki.2008.62
17. Plantinga L, Johansen KL, Schillinger D, et al. Lower socioeconomic status and disability among US adults with chronic kidney disease, 1999–2008. Prev Chronic Dis. 2012;9:E12.
18. Fischer MJ, Kimmel PL, Greene T, et al. Sociodemographic factors contribute to the depressive affect among African Americans with chronic kidney disease. Kidney Int. 2010;77:1010–1019. doi:10.1038/ki.2010.38
19. Theofilou P. Depression and anxiety in patients with chronic renal failure: the effect of sociodemographic characteristics. Int J Nephrol. 2011;2011:Article ID 514070. doi:10.4061/2011/514070
20. Ikonomou M, Skapinakis P, Balafa O, et al. The impact of socioeconomic factors on quality of life of patients with chronic kidney disease in Greece. J Ren Care. 2015;41:239–246. doi:10.1111/jorc.12132
21. Kao TW, Lai MS, Tsai TJ, et al. Economic, social, and psychological factors associated with health‐related quality of life of chronic hemodialysis patients in Northern Taiwan: a multicenter study. Artif Organs. 2009;33:61–68. doi:10.1111/j.1525-1594.2008.00675.x
22. Kefale B, Alebachew M, Tadesse Y, et al. Quality of life and its predictors among patients with chronic kidney disease: a hospital-based cross sectional study. PLoS One. 2019;14:e0212184. doi:10.1371/journal.pone.0212184
23. Lemos CF, Rodrigues MP, Veiga JRP. Family income is associated with quality of life in patients with chronic kidney disease in the pre-dialysis phase: a cross sectional study. Health Qual Life Outcomes. 2015;13:202. doi:10.1186/s12955-015-0390-6
24. Lopes AA, Bragg-Gresham JL, Goodkin DA, et al. Factors associated with health-related quality of life among hemodialysis patients in the DOPPS. Qual Life Res. 2007;16:545. doi:10.1007/s11136-006-9143-7
25. Molsted S, Wendelboe S, Flege MM, et al. The impact of marital and socioeconomic status on quality of life and physical activity in patients with chronic kidney disease. Int Urol Nephrol. 2021;53:2577–2582. doi:10.1007/s11255-021-02826-6
26. Sesso R, Rodrigues-Neto JF, Ferraz MB. Impact of socioeconomic status on the quality of life of ESRD patients. Am J Kidney Dis. 2003;41:186–195. doi:10.1053/ajkd.2003.50003
27. Tao S, Zeng X, Liu J, et al. Socioeconomic status and mortality among dialysis patients: a systematic review and meta-analysis. Int Urol Nephrol. 2019;51:509–518. doi:10.1007/s11255-019-02078-5
28. Sugisawa H, Sugihara Y, Kobayashi E, et al. The influence of lifecourse financial strains on the later-life health of the Japanese as assessed by four models based on different health indicators. Ageing Soc. 2019;39:2631–2652. doi:10.1017/S0144686X18000673
29. Pollitt RA, Rose KM, Kaufman JS. Evaluating the evidence for models of life course socioeconomic factors and cardiovascular outcomes: a systematic review. BMC Public Health. 2005;5:7. doi:10.1186/1471-2458-5-7
30. Glymour MM, Ertel KA, Berkman LF. What can life-course epidemiology tell us about health inequalities in old age? Annu Rev Gerontol Geriatr. 2009;29:27–56. doi:10.1891/0198-8794.29.27
31. Shoham DA, Vupputuri S, Diez Roux AVD, et al. Kidney disease in life-course socioeconomic context: the Atherosclerosis Risk in Communities (ARIC) Study. Am J Kidney Dis. 2007;49:217–226. doi:10.1053/j.ajkd.2006.11.031
32. Surachman A, Daw J, Bray BC, et al. Childhood socioeconomic status, comorbidity of chronic kidney disease risk factors, and kidney function among adults in the midlife in the United States (MIDUS) study. BMC Nephrol. 2020;21:188. doi:10.1186/s12882-020-01846-1
33. Lunyera J, Stanifer JW, Davenport CA, et al. Life course socioeconomic status, allostatic load, and kidney health in Black Americans. Clin J Am Soc Nephrol. 2020;15:341–348. doi:10.2215/CJN.08430719
34. Shoham DA, Vupputuri S, Kaufman JS, et al. Kidney disease and the cumulative burden of life course socioeconomic conditions: the Atherosclerosis Risk in Communities (ARIC) study. Soc Sci Med. 2008;67:1311–1320. doi:10.1016/j.socscimed.2008.06.007
35. Peralta CA, Ziv E, Katz R, et al. African ancestry, socioeconomic status, and kidney function in elderly African Americans: a genetic admixture analysis. J Am Soc Nephrol. 2006;17:3491–3496. doi:10.1681/ASN.2006050493
36. Merkin SS, Diez Roux AV, Coresh J, et al. Individual and neighborhood socioeconomic status and progressive chronic kidney disease in an elderly population: the Cardiovascular Health Study. Soc Sci Med. 2007;65:809–821. doi:10.1016/j.socscimed.2007.04.011
37. Vart P, Gansevoort RT, Coresh J, et al. Socioeconomic measures and CKD in the United States and The Netherlands. Clin J Am Soc Nephrol. 2013;8:685–693. doi:10.2215/CJN.12521212
38. Caskey FJ, Roderick P, Steenkamp R, et al. Social deprivation and survival on renal replacement therapy in England and Wales. Kidney Int. 2006;70:2134–2140. doi:10.1038/sj.ki.5001999
39. Krishnasamy R, Gray NA. Low socioeconomic status adversely effects dialysis survival in Australia. Nephrol. 2018;23:453–460. doi:10.1111/nep.13053
40. Zarulli V. Unobserved heterogeneity of frailty in the analysis of socioeconomic differences in health and mortality. Eur J Popul. 2016;32:55–72. doi:10.1007/s10680-015-9361-1
41. Cass A, Cunningham J, Wang Z, et al. Social disadvantage and variation in the incidence of end-stage renal disease in Australian capital cities. Aust N Z J Public Health. 2001;25:322–326. doi:10.1111/j.1467-842X.2001.tb00587.x
42. Grace BS, Clayton P, Cass A, et al. Socio-economic status and incidence of renal replacement therapy: a registry study of Australian patients. Nephrol Dial Transplant. 2012;27:4173–4180. doi:10.1093/ndt/gfs361
43. White SL, McGeechan K, Jones M, et al. Socioeconomic disadvantage and kidney disease in the United States, Australia, and Thailand. Am J Public Health. 2008;98:1306–1313. doi:10.2105/AJPH.2007.116020
44. Tsai SY, Tseng HF, Tan HF, et al. End-stage renal disease in Taiwan: a case-control study. J Epidemiol. 2009;19:169–176. doi:10.2188/jea.JE20080099
45. Cruz MC, Andrade C, Urrutia M, et al. Quality of life in patients with chronic kidney disease. Clinics. 2011;66:991–995. doi:10.1590/S1807-59322011000600012
46. Nelson V, Gopalakrishnan S, Rakesh PS, et al. Depression among dialysis patients. J Nephrol Soc Work. 2016;40:34–37.
47. Sanathan SR, Menonb VB, Allab P, et al. Depressive symptoms in chronic kidney disease patients on maintenance hemodialysis. World J Pharm Pharm Sci. 2014;3:535–548.
48. Valdés B. An application of convergence theory to Japan’s post-WWII economic “miracle”. J Econ Educ. 2003;34:61–81. doi:10.1080/00220480309595202
49. Wilkinson RG. The Impact of Inequality: How to Make Sick Societies Healthier. New York: New Press; 2005.
50. Organization for Economic Co-operation and Development. Divided We Stand: Why Inequality Keeps Rising. Paris: OECD Publishing; 2011.
51. Takahashi K, Ohara N, Antonucci TC, et al. Commonalities and differences in close relationships among the Americans and Japanese: a comparison by the individualism/collectivism concept. Int J Behav Dev. 2002;26:453–465. doi:10.1080/01650250143000418
52. Gallo LC, de Los Monteros KE, Shivpuri S. Socioeconomic status and health: what is the role of reserve capacity? Curr Dir Psychol Sci. 2009;18:269–274. doi:10.1111/j.1467-8721.2009.01650.x
53. Kahn JR, Pearlin LI. Financial strain over the life course and health among older adults. J Health Soc Behav. 2006;47:17–31. doi:10.1177/002214650604700102
54. Berney LR, Blane DB. Collecting retrospective data: accuracy of recall after 50 years judged against historical records. Soc Sci Med. 1997;45:1519–1525. doi:10.1016/S0277-9536(97)00088-9
55. Himmelfarb J. Hemodialysis complications. Am J Kidney Dis. 2005;45:1122–1131. doi:10.1053/j.ajkd.2005.02.031
56. Devenport A. Can advances in hemodialysis machine technology prevent intradialytic hypertension? Semin Dial. 2009;22:231–236. doi:10.1111/j.1525-139X.2009.00614.x
57. Lopes AA, Bragg J, Young E, et al. Depression as a predictor of mortality and hospitalization among hemodialysis patients in the United States and Europe. Kidney Int. 2002;62:199–207. doi:10.1046/j.1523-1755.2002.00411.x
58. Kessler RC, Andrews G, Colpe LJ, et al. Short screening scales to monitor population prevalence and trends in non-specific psychological distress. Psychol Med. 2002;32:959–976. doi:10.1017/S0033291702006074
59. Furukawa TA, Kawakami N, Saitoh M, et al. The performance of the Japanese version of the K6 and K10 in the World Mental Health Survey Japan. Int J Methods Psychiatr Res. 2008;17:152–158. doi:10.1002/mpr.257
60. Sakurai K, Nishi A, Kondo K, et al. Screening performance of K6/K10 and other screening instruments for mood and anxiety disorders in Japan. Psychiatr Clin Neurosci. 2011;65:434–444. doi:10.1111/j.1440-1819.2011.02236.x
61. Bono C, Ried LD, Kimberlin C, et al. Missing data on the Center for Epidemiologic Studies Depression Scale: a comparison of 4 imputation techniques. Res Soc Admin Pharm. 2007;3:1–27. doi:10.1016/j.sapharm.2006.04.001
62. ShriveF M, Stuart H, Quan H, et al. Dealing with missing data in a multi-question depression scale: a comparison of imputation method. BMC Med Res Methodol. 2006;6:57. doi:10.1186/1471-2288-6-57
63. Preacher KJ, Hayes AF. Asymptotic and resampling strategies for assessing and comparing indirect effects in multiple mediator models. Behav Res Methods. 2008;40:879–891. doi:10.3758/BRM.40.3.879
64. Muthén LK, Muthén BO. Mplus User’s Guide.
65. Browne MW, Cudeck R. Alternative ways of assessing model fit. Soc Methods Res. 1992;21:230–258. doi:10.1177/0049124192021002005
66. Bentler PM. Comparative fit indexes in structural models. Psychol Bull. 1990;107:238–246. doi:10.1037/0033-2909.107.2.238
67. Brophy PD, Shoham DA, Charlton JR, et al.; CKD Life Course Group. Early-life course socioeconomic factors and chronic kidney disease. Adv Chronic Kidney Dis. 22;2015:16–23. doi:10.1053/j.ackd.2014.06.006
68. Birnie K, Cooper R, Martin RM. Childhood socioeconomic position and objectively measured physical capability levels in adulthood: a systematic review and meta-analysis. PLoS One. 2011;6:e15564. doi:10.1371/journal.pone.0015564
69. Hallqvist J, Lynch J, Bartley M, et al. Can we disentangle life course processes of accumulation, critical period and social mobility? An analysis of disadvantaged socio-economic positions and myocardial infarction in the Stockholm Heart Epidemiology Program. Soc Sci Med. 2004;58:1555–1562. doi:10.1016/S0277-9536(03)00344-7
70. Szanton SL, Thorpe RJ, Whitfield K. Life-course financial strain and health in African-Americans. Soc Sci Med. 2010;71:259–265. doi:10.1016/j.socscimed.2010.04.001
71. Vineis P, Kelly-Irving M, Rappaport S, et al. The biological embedding of social differences in ageing trajectories. J Epidemiol Community Health. 2016;70:111–113. doi:10.1136/jech-2015-206089
72. Downey JC, Gudmunson CG, Pang YC, et al. Adverse childhood experiences affect health risk behaviors and chronic health of Iowans. J Fam Violence. 2017;32:557–564. doi:10.1007/s10896-017-9909-4
73. Matthews KA, Gallo LC, Taylor SE. Are psychosocial factors mediators of socioeconomic status and health connections? A progress report and blueprint for the future. Ann N Y Acad Sci. 2010;1186:146–173. doi:10.1111/j.1749-6632.2009.05332.x
74. Johnson-Lawrence V, Kaplan G, Galea S. Socioeconomic mobility in adulthood and cardiovascular disease mortality. Ann Epidemiol. 2013;23:167–171. doi:10.1016/j.annepidem.2013.02.004
75. Luo Y, Waite LJ. The impact of childhood and adult SES on physical, mental, and cognitive well-being in later life. J Gerontol Soc Sci. 2005;60B:S93–S101. doi:10.1093/geronb/60.2.S93
76. Marden JR, Tchetgen EJ, Kawachi I, et al. Contribution of socioeconomic status at 3 life-course periods to late-life memory function and decline: early and late predictors of dementia risk. Am J Epidemiol. 2017;186:805–814. doi:10.1093/aje/kwx155
77. Nagamine Y, Fujiwara T, Tani Y, et al. Gender difference in the association between subjective socioeconomic mobility across life course and mortality at older ages: results from the JAGES longitudinal study. J Epidemiol. 2020;30:497–502. doi:10.2188/jea.JE20190083
78. Turrell G, Lynch JW, Kaplan GA, et al. Socioeconomic position across the lifecourse and cognitive function in late middle age. J Gerontol Soc Sci. 2002;57B:S43–51. doi:10.1093/geronb/57.1.S43
79. Na-Ek N, Demakakos P. Social mobility and inflammatory and metabolic markers at older ages: the English Longitudinal Study of Ageing. J Epidemiol Community Health. 2017;71:253–260. doi:10.1136/jech-2016-207394
80. Kauhanen L, Lakka HM, Lynch JW, et al. Social disadvantages in childhood and risk of all-cause death and cardiovascular disease in later life: a comparison of historical and retrospective childhood information. Int J Epidemiol. 2006;35:962–968. doi:10.1093/ije/dyl046
81. Lynch JW, Kaplan GA, Shema SJ. Cumulative impact of sustained economic hardship on physical, cognitive, psychological, and social functioning. N Engl J Med. 1997;337:1889–1895. doi:10.1056/NEJM199712253372606
82. O’Rand AM, Hamil-Luker J. Processes of cumulative adversity: childhood disadvantage and increased risk of heart attack across the life course. J Gerontol Psychol Sci Soc Sci. 2005;60B:S117–S124. doi:10.1093/geronb/60.Special_Issue_2.S117
 © 2022 The Author(s). This work is published and licensed by Dove Medical Press Limited. The full terms of this license are available at https://www.dovepress.com/terms.php and incorporate the Creative Commons Attribution - Non Commercial (unported, v3.0) License.
By accessing the work you hereby accept the Terms. Non-commercial uses of the work are permitted without any further permission from Dove Medical Press Limited, provided the work is properly attributed. For permission for commercial use of this work, please see paragraphs 4.2 and 5 of our Terms.
© 2022 The Author(s). This work is published and licensed by Dove Medical Press Limited. The full terms of this license are available at https://www.dovepress.com/terms.php and incorporate the Creative Commons Attribution - Non Commercial (unported, v3.0) License.
By accessing the work you hereby accept the Terms. Non-commercial uses of the work are permitted without any further permission from Dove Medical Press Limited, provided the work is properly attributed. For permission for commercial use of this work, please see paragraphs 4.2 and 5 of our Terms.