Back to Journals » Clinical, Cosmetic and Investigational Dentistry » Volume 15
Influence of Tucupi on Enamel Surface Roughness, Microhardness, Ultramorphology and Mass Variation
Authors Loretto SC ![]() , Sousa NWA, Ribeiro MES
, Sousa NWA, Ribeiro MES ![]() , Carneiro RVTSM
, Carneiro RVTSM ![]() , Chisté R, Souza Júnior MHDSE
, Chisté R, Souza Júnior MHDSE
Received 3 November 2022
Accepted for publication 1 February 2023
Published 17 April 2023 Volume 2023:15 Pages 63—70
DOI https://doi.org/10.2147/CCIDE.S394661
Checked for plagiarism Yes
Review by Single anonymous peer review
Peer reviewer comments 2
Editor who approved publication: Professor Christopher E. Okunseri
Sandro Cordeiro Loretto,1 Naama Waléria Alves Sousa,1 Mara Eliane Soares Ribeiro,2 Reginna Vyctória da Trindade Souza de Melo Carneiro,1 Renan Chisté,3 Mário Honorato da Silva e Souza Júnior1
1Multifunctional Laboratory, Postgraduate Program in Dentistry, University Center of Pará, Belém, Pará, Brazil; 2Laboratory of Biomaterials, Postgraduate Program in Dentistry, Institute of Health Sciences, Federal University of Pará, Belém, Pará, Brazil; 3Faculty of Food Engineering, Institute of Technology, Federal University of Pará, Belém, Pará, Brazil
Correspondence: Sandro Cordeiro Loretto, Multifunctional Laboratory, Postgraduate Program in Dentistry, University Center of Pará, 1500 Dom Romualdo de Seixas Street. ap 602, Torre Umari, Umarizal, Belém, Pará, 66.055-200, Brazil, Tel +559198122-3477, Email [email protected]
Aim: The study evaluated the influence of tucupi on enamel surface roughness, microhardness, ultramorphology, and mass variation.
Materials and Methods: Ninety healthy bovine incisors were divided into three experimental groups, according to the acidic challenge adopted, being: G1- tucupi, G2- cola-based soft drink, G3-distilled water. The enamel properties (surface roughness, microhardness, ultramorphology and mass variation) of all specimens were evaluated at times T0 (before any intervention), T10 (10 days after the proposed treatments), T20 (20 days after the proposed treatments) and T30 (30 days after the proposed treatments). After confirming the normality of the data (Shapiro–Wilk test), a two-way ANOVA (α = 5%) was performed, followed by Sidak post-test, with results described as mean and standard deviation.
Results: The roughness means increased for all tested groups, with no statistical difference only in G3 for all evaluated times. Microhardness of all groups showed a significant decrease over the time, with the lowest average observed in G1 in T30. Considering enamel mass variation, the lowest average was in G2 at time T3, with no statistical difference only in G3 (distilled water) over the time. Regarding ultramorphology (scanning electron microscopy – SEM), only groups G1 and G2, that were exposed to acidic challenges, showed disorganization of the enamel surface layer.
Conclusion: It was possible to conclude that tucupi has low pH and high titratable total acidity, being able to gradually decrease enamel microhardness, increasing surface roughness and causing loss of dental enamel.
Keywords: Manihot esculenta, erosion, dental enamel, microhardness, acidity, surface properties
Introduction
The term dental biocorrosion or erosion, according to Grippo et al,1 characterizes the demineralization of dental hard tissues by a phenomenon of dissolution, which occurs through exogenous and/or endogenous chemical products of an acidic nature, without including bacterial natural acids. However, other biological and/or behavioral factors are multifactorial determinants for the development of erosive tooth wear.2 When layer-by-layer dissolution of enamel occurs until exposure of underlying dentin, the loss is no longer reversible,3 seen as the initial erosion begins with an early-stage softening of the surface, but the prolonged exposure to acids can dissolve the outer layer of enamel and promote permanent loss of structure.4
There has been considerable growth in the prevalence of dental erosion,5 and that seems to be strongly related to the large consumption of acid foods and drinks worldwide, specially carbonated and non-carbonated beverages.6 However, it is necessary to identify whether some possible constituents of regional foods consumed on a large scale can explain the occurrence of erosive tooth wear in certain groups of patients, as there is insufficient data in the literature on dental erosion in these populations.
In Northern and Northeastern Brazil, stands out the consumption of cassava (Manihot esculenta Crantz). In a more recent survey, it is estimated that the amount of cassava produced in Brazil was 24.4 million tons, and Pará was the main producer state.7 Cassava occupies a prominent place in the population’s diet, being consumed mainly in the form of flour, but also being used as a raw material for the preparation of various typical dishes.8
During the flour manufacturing process, the cassava roots are crushed and pressed to remove its liquid; the pressed mass goes through a roasting process, and the liquid residue, called manipueira, is either discarded or transformed into tucupi.8 To use the tucupi, it suffers a decanting process and starch removal, followed by a boil, adding spices, thus obtaining the tucupi ready to drink, which is packaged in polyethylene terephthalate (PET) plastic bottles.9
Information in the scientific literature regarding tucupi is still scarce, although the consumption of this delicacy may have consequences for dental structures, since it is a food with a pH below the critical level (5.5) for the occurrence of demineralization of tooth enamel. Based on authors’ research there is just one study about this material.10 Martins et al (2016) verified the influence of tucupi on tooth enamel microhardness, noting that it, as well as a cola-based soft drink, significantly reduced enamel microhardness.10
Thus, the objective of this study is to characterize the acidity of a commercial tucupi and evaluate its influence on enamel surface roughness, microhardness, ultramorphology and mass variation.
Methodology
Sample Characterization
Acidity Characterization of Tucupi
To characterize the acidity of the Tucupi used in the present study (Vovó da Floresta, Agroindustria São Francisco do Itá Ltda, Santa Isabel, Pará, Brasil), pH and total titratable acidity measurements were performed.
Determination of pH
Eleven (11) evaluations of pH were performed, with a 3-day interval between. All evaluations were made in triplicate and the value determined by direct reading in a potentiometer (Tecnal, TEC-51, China), duly calibrated with pH 7.0 and 4.0 buffer solutions at 20 °C, according to method no. 981.12 of the AOAC (Association of Analytical Chemists, 1997).11 Twenty (20) mL of tucupi were used at room temperature, inserted in the Erlenmeyer flask, followed by the recording of the pH in each analysis, totaling 33 days of pH analysis.
Determination of Total Titratable Acidity
Total titratable acidity was determined through sample titration with NaOH 0,1 N, and the solution’s pH being monitored by a potentiometer, according to method no 942.15 of the AOAC.11 The result was expressed in g/100 mL.
To determine the total titratable acidity, 50 mL of tucupi were used, which were initially submitted to a boiling process. After this step, and with the tucupi already at room temperature, the triplicate process was carried out. Five (5) mL of tucupi were pipetted, diluted with 50 mL of distilled water in an Erlenmeyer flask, and 3 drops of phenolphthalein were added to each flask. After that, a burette was loaded with 0.1M NaOH solution to start the titration of the samples until reaching a light pink color (for at least 30 seconds), and the spent volume of NaOH is noted.
After the titration procedures, the measured data were tabulated and applied in the formula  , and in that way, the results of each titration are obtained in g/100 mL.
Collection, Characterization of the Sample and Ethical Aspects
The study was submitted to the Ethics Committee on the Use of Animals of the Federal University of Pará (CEUA-UFPA) and approved under the number 5,529,120,918. Ninety healthy bovine incisors of the Bos taurus indicus species (age average of 24 months) were used, donated from animals slaughtered at the Agricultural Industry Cooperative of Pará (SOCIPE - Belém, Pará, Brazil). The study included bovine teeth that had erupted in the oral cavity, with healthy crowns and complete root formation.
The teeth were initially immersed in a 0.1% thymol solution (A Fórmula, Belém, PA, Brasil) for one week for disinfection, followed by removal of adhered periodontal tissue and prophylaxis with pumice paste. Afterwards, the teeth were analyzed with a stereoscopic magnifying glass with 40x magnification (Olympus – SZ, São Paulo, SP, Brazil) to evaluate the vestibular enamel of the middle coronal portion, and teeth with cracks on the enamel surface were discarded. During the entire sample preparation phase, the teeth were stored in distilled water at 4°C, which was renewed daily.
Obtainment of Tooth Fragments
The dental crowns went through two cross sections. The first cut was made at a 15mm distance, measured with a digital caliper (DIN 862; Mitutoyo, São Paulo, SP, Brazil), from the cementoenamel junction and parallel to the incisal edge. The second cut was made 5mm from the cementoenamel junction, thus obtaining samples of the middle portion of the dental crown with a height of 10 mm.
Preparation of Specimens for Microhardness and Surface Roughness Analysis
For the microhardness and surface roughness tests, each dental fragment had its vestibular face inserted in wax no. 7, and then were embedded in chemically activated acrylic resin (JET, Classico, Campo Limpo Paulista, SP, Brazil), using 1cm high tube dies in clear acrylic. After 24 hours, the specimens’ vestibular surface was flattened using silicon carbide sandpaper with decreasing grain: #320 for 15 seconds; #600 for 30 seconds; #1200 for 60 seconds and #2000 for 90 seconds,10 in a horizontal polishing machine (Aropol-E – Arotec, Cotia, SP, Brazil), under constant refrigeration, washing in an ultrasonic bathtub (TD30 Plus, Bio-Art, São Carlos, SP, Brazil) with distilled water for 3 minutes at every change of sandpaper, and at every 10 specimens the sandpapers were replaced. This procedure was performed to obtain specimens with a regular, flat and glassy vestibular surface. Afterwards, the verification of a possible accidental exposure of the dentinal tissue was carried out using a stereoscopic magnifying glass (40X), discarding the teeth that showed cracks on the enamel surface, followed by washing in an ultrasonic bath (TD30 Plus, Bio-Art, São Carlos, SP, Brazil) with distilled water for 20 minutes.
Preparation of Specimens for Analysis of Mass Variation and Ultramorphology in Scanning Electron Microscopy (SEM)
To measure the mass variation and analyze the ultramorphology in SEM, the middle portion of the crown received an additional longitudinal section in the mesiodistal direction, to separate the buccal and lingual portions of the dental crown. The lingual portions were discarded, and the vestibular dentin layer removed with the aid of cone-shaped diamond tips no. 4138 (KG Sorensen - Cotia, SP, Brazil) in high rotation and under constant refrigeration, being replaced every 10 specimens, leaving only the buccal dental enamel.12 Ultimately, all specimens were taken to an ultrasonic bath with distilled water for 20 minutes. Each enamel specimen was placed individually in numbered bottles. Division group in Table 1.
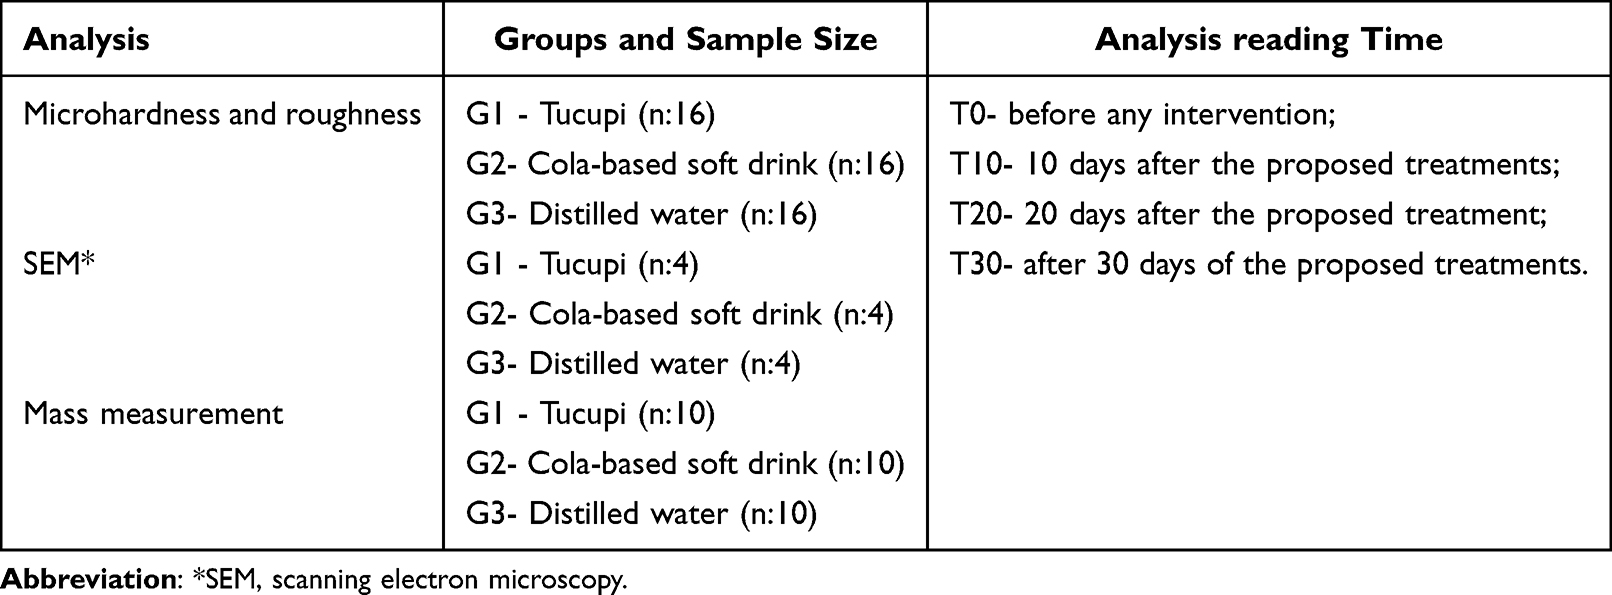 |
Table 1 Groups Division |
A total of 90 specimens were divided into 3 groups (n=30) according to the solution which they were exposed: tucupi, cola-based soft drink and distilled water.
Exposure to the Testing Solutions
After 24 hours of the specimen’s preparation, they were immersed in 30 mL of cola-based soft drink (positive control), 30mL of tucupi and 30mL of distilled water (negative control), at room temperature in sterile Becker flasks, obtaining the pH with pH meter (Digimed, São Paulo, Brazil) with a glass electrode and digital display before the immersions. The immersion cycles took place under light agitation for 20 minutes, so the solutions did not decant, and this process was made for 30 days. After each immersion cycle, the specimens were washed with distilled water for 1 minute in a triple syringe at an approximately 5 cm distance, dried with soft absorbent paper, immersed in 15 mL of artificial saliva (composition in Table 2), and kept in an oven at 37°C for 24 hours until the next immersion cycle. Daily exchange of artificial saliva was performed in all groups. Description of materials in Table 2.
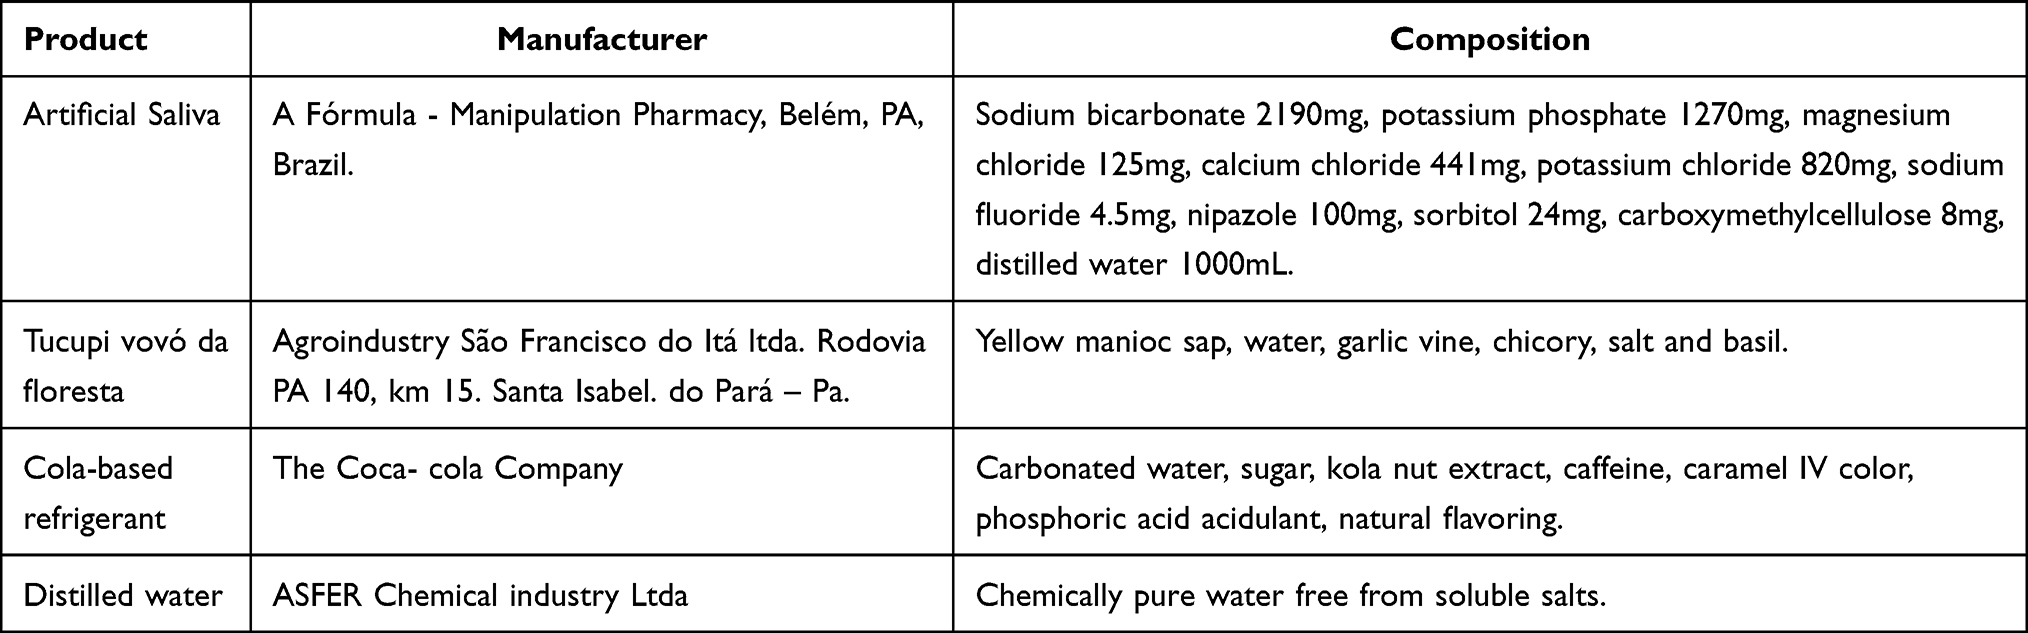 |
Table 2 Description of Materials According to Manufacturer and Composition |
Microhardness Evaluation
For the evaluation of Knoop (KHN) microhardness, an FM 700 microhardness tester (FutureTech, Kanagawa, Japan) was used. The specimen surface was divided into 2 halves, one used for microhardness assessment, and the other for the surface roughness readings. The half of the specimen intended for microhardness readings was subdivided into four equal parts. A load of 50 grams was applied for 5 seconds,10 at times zero (T0- no exposure to the tested solutions), at the end of the 10th day of the immersion cycle (T10), at the end of the 20th day of the immersion cycle (T20) and at the end of the 30th day of the immersion cycle (T30). Three indentations were made with 100µm of distance between them in the quadrant defined for each reading time (T0, T10, T20 and T30) arranged side by side from the center of the specimen. Then, an average Knoop hardness was obtained for each sample from the application of the values obtained with the indentations.
Surface Roughness Evaluation
Surface roughness (Ra) evaluation was performed by a contact roughness tester (SJ-301; Mitutoyo, Los Angeles, CA, United States of America). The parameter to achieve the surface roughness was the arithmetic roughness (Ra) determined by the average of 3 readings, with a trace limit (Lt) of 5mm and a sampling length or cut-off (La) of 0.25mm. Readings were also performed at T0, T10, T20 and T30.
Measurement of Mass Variation
To weigh the specimens, they were first dried with a Philco Titanium Travel dryer (Philco - Joinville, SC, Brazil) for two minutes, the necessary time so that there was no further change in the specimens’ weight. The verification of the mass of the specimens was performed by weighing before the interventions (T0) and at the end of T10, T20 and T30, using an electronic analytical balance (Quimis-AS 210, Diadema-SP-Brasil), with a 0.0001 precision, which shows the values in grams.13,14 The specimens, after each immersion cycle, were placed in their respective containers, with the storage environment renewed (artificial saliva), being kept in a biological oven (37°C) for 24h until the next immersion cycle.
Ultramorphology Analysis in Scanning Electron Microscopy (SEM)
The specimens were previously dried on silica for 24 hours, and then received the metallic coating application in a Denton metallizer, model DESK II (DentonVaccum – Tokyo, Japan), to allow visualization under an electron microscope JSM – 6360 (Tokyo, Japan), up to 11,000 times magnification. For the analysis, 1 specimen was used for each time, in which it was evaluated: before the immersions (T0), end of the 10th day of the immersion cycle (T10), end of the 20th day of the immersion cycle (T20) and the 30th day of the immersion cycle (T30).
Statistical Analysis
Statistical calculations were performed using the SPSS Software, version 17.0 (SPSS Inc, Chicago, IL, USA). The results obtained in the microhardness, surface roughness and mass variation analysis, after checking data normality (Shapiro–Wilk test), were submitted to two-way ANOVA for repeated samples, followed by Sidak post-test, and the results were described in average and standard deviation. The α level of significance of 5% (p≤0.05) was adopted for these analyses. The ultramorphology images were analyzed descriptively.
Results
Table 3 shows the results of microhardness of specimens immersed in the liquid environment compared to the different times evaluated. For tucupi, the lowest microhardness mean was observed at T30 (109.67 KHN), and the comparison between times T0 (without treatment) and T10 (10 days) was the only one that did not show statistical difference (p = 0.06). In the cola-based soft drink group, the lowest mean was in T2 (107.53 KHN), with statistical difference between T0 (no treatment) and T20 (20 days) (p = 0.03). For the distilled water group, there was only statistical difference between T0 (no treatment) and T10 (10 days) (p = 0.04), with the lowest mean seen in T10 (10 days) (242.47 KHN).
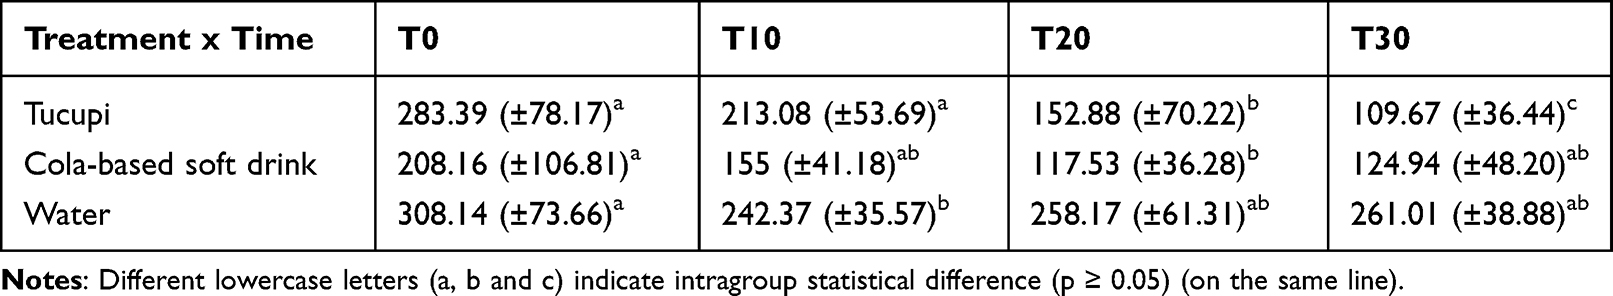 |
Table 3 Mean (Standard Deviation) of Knoop Microhardness as a Function of Exposure Times for the Tested Groups |
Table 4 shows the results of surface roughness (Ra) of specimens immersed in the liquid environments at the different evaluated times. For tucupi, the highest mean of surface roughness was observed at T30 (30 days) (0.1625 Ra), with a statistical difference only between times T0 (without treatment) and T30 (30 days) (p = 0.02). Regarding the cola-based soft drink group, the highest mean for surface roughness was observed at T30 (30 days) (Ra=0.2862), with statistical difference only in the comparisons between T0 (no treatment) and T30 (30 days) (p = 0.008), and for T10 (10 days) and T30 (30 days) (p = 0.01). For the distilled water group there was no statistical difference between all evaluated times (p > 0.05).
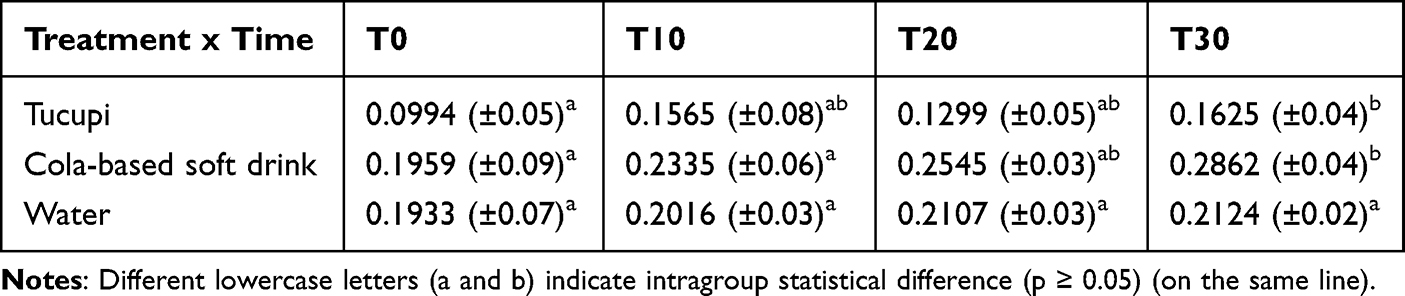 |
Table 4 Means (Standard Deviation) of Surface Roughness (Ra) According to Exposure Times for the Tested Groups |
Table 5 shows the results of mass variation of specimens immersed in the liquid environments at the different times evaluated. For the tucupi group (G1), the mean mass variation at time T0 (without treatment) was statistically different (p < 0.05) in relation to the other times. Comparisons between times T10 (10 days) and T20 (20 days) (p = 0.40), and T10 (10 days) and T30 (30 days) (p = 0.09) showed no significant differences. For G2 (cola-based soda) there was a statistical difference between all the compared times, except between T10 (10 days) and T20 (20 days) (p = 0.23), with the highest mean observed in T0 (without treatment) (0.3524g) and the lowest observed in T30 (30 days) (0.3449g). In G3 (distilled water) there was no statistical difference between the means tested (p > 0.05).
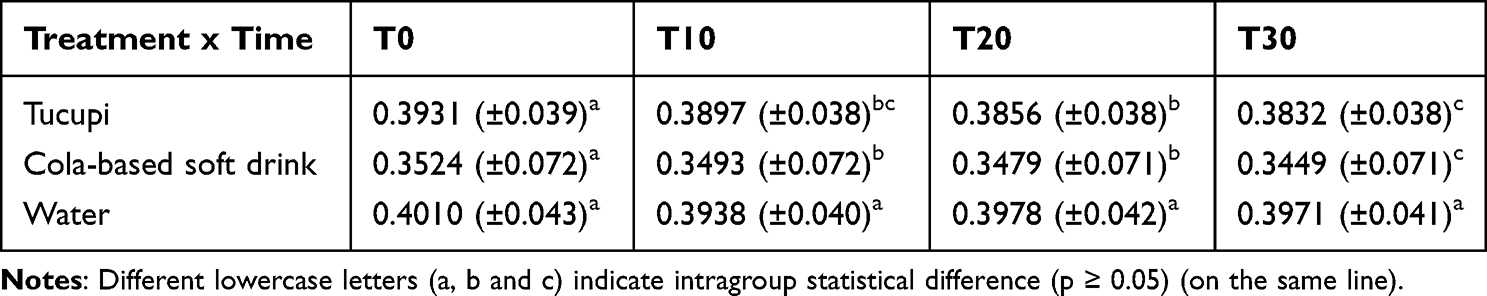 |
Table 5 Means (Standard Deviation) of Mass Variation According to Exposure Times for the Tested Groups |
Figure 1 shows photomicrographs with magnification of 1.000x, where the image at T0 (untreated) is a characterization of tooth enamel without exposure to the types of treatments proposed in the groups. Horizontally, we can observe the groups evaluated at different times. In G1 (tucupi) the greatest visible changes occurred at T30 (30 days), where the exposure of the underlying layer to aprismatic can be observed. In G2 (cola-based soda) a porous surface can be seen since T10 (10 days) and this feature increases over time. In G3 (distilled water), the original features are maintained throughout the analysis, observing only the grooves caused by the polishing of the specimens.
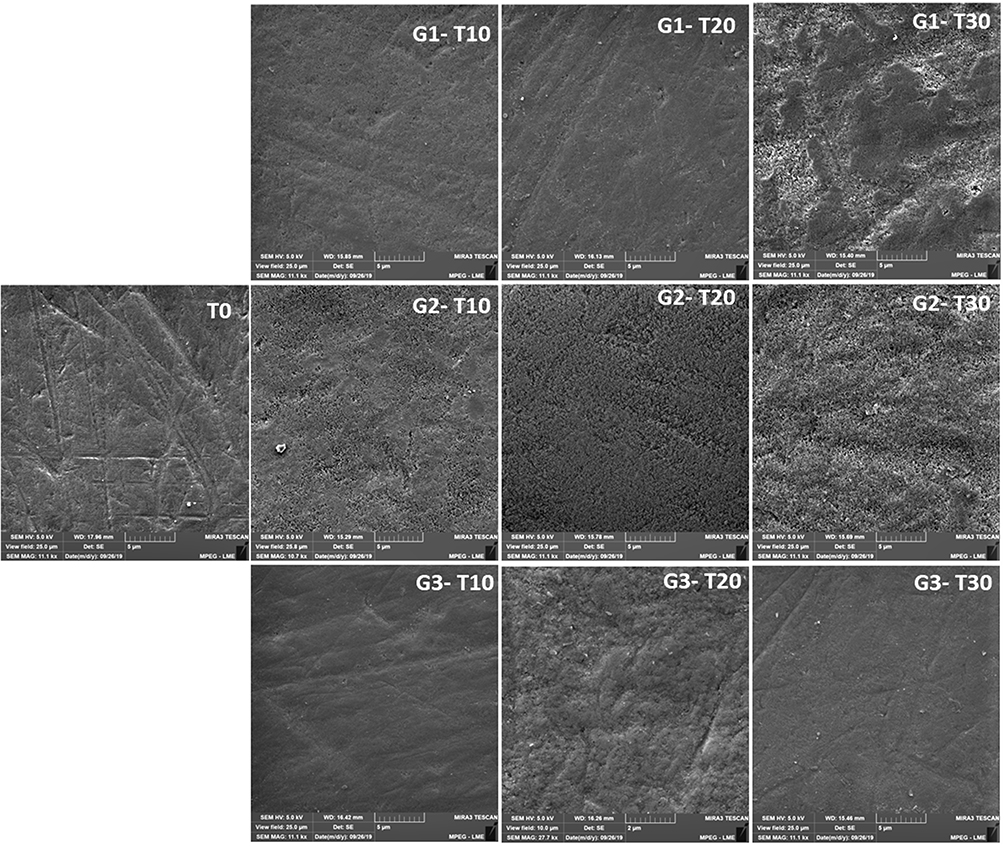 |
Figure 1 Representative images of treated enamel surfaces according to groups. |
Discussion
The findings of the present study showed that the tucupi drink and cola-based soft drinks similarly influenced the surface roughness of enamel, while for microhardness, tucupi was more harmful to enamel when compared to cola-based soft drinks. However, the soda showed the most mass variation (greater loss) over time. Scanning electron microscopy showed a disorganization of the aprismatic enamel in G1 (tucupi) and G2 (cola-based soft drink), and no change in the surface in G3 (distilled water).
According to Lussi et al, the greater the titratable acidity of the drink, the longer the saliva takes to neutralize the acid, thus the acid has a longer action on the tooth.15 Therefore, we associate the greater hardness loss of the group exposed to tucupi due to its higher total titratable acidity value (≅0.80), when compared to the soft drink group used in this study (≅0.57).16
There is a direct correlation between the prevalence of erosion and the consumption of carbonated beverages (soft drinks),15 so that can justify the use of a cola-based soft drink in this model for the positive control of the present study. However, as much as the cola-based drink has a lower pH than tucupi, it did not show greater erosive power, and that can be associated with its lower titratable acidity when compared to tucupi.
A study claims that an acid attack leads to demineralization of tooth enamel, causing a “softening” of the tooth surface, and its decrease in surface wear resistance.17 In this sense, the SEM analysis showed a progressive damage over time to the surface enamel exposed to acidic environments, showing a more porous enamel with shallow cavities, evidencing loss of this “softened” layer by the acidic environment. Also, as the SEM is a visual inspection of enamel damage, the microhardness test was performed because it is well documented and accepted to evaluate small changes in the surface of the tooth enamel.10
Dental erosion occurs when there is an imbalance between the consumption of the beverage (acidic in nature) and the body’s protective capacity, such as the buffering capacity of acids by saliva.18 In this sense, the artificial saliva saturated environment containing chemical elements such as calcium, phosphate and fluorine,19 used as a storage environment in the present study for all the tested drinks (tucupi, cola-based soft drink and distilled water), may have collaborated so that lower microhardness values were not observed.
Another important element is the agitation of the solution during the immersion of specimens, as it has been shown that immersion under agitation can increase the degree of erosion produced by acidic beverages on primary and permanent tooth enamel.20 The agitation becomes necessary because it is closer clinical situation, stage which was followed by the present study, since the drink tested (Tucupi) is consumed in liquid form in sauces and broths.
Although all experimental steps in this study were carefully conducted, the in vitro studies have limitations and therefore their results must be extrapolated to clinical conditions with care. It is known that in clinical conditions we have toothbrushing and natural saliva. Brushing is absent in this study design because this is the first study on dental hard tissue developed in this line of research (in vitro erosion model with tucupi), so it became necessary to see the isolated influence of tucupi on dental enamel.
In this sense, the roughness of the enamels of all tested groups had a statistical difference when compared from T0 to T30, including the distilled water group. We associated this finding with the incorporation of minerals during exposure to the storage medium (artificial saliva), since the toothbrush was not present.
Dental erosion associated with the consumption of tucupi is a potential oral health problem for the population in regions that have cassava, as it is present in several typical dishes and sauces consumed daily. 10 Tucupi, as demonstrated in this study, is a risk factor for dental erosion, where mass verification in G1 shows loss with a statistical difference between T0 and T30. Therefore, more research must be carried out to expand the scope and knowledge in this field of research.
Conclusion
It is concluded that the tucupi used has low pH and high titratable total acidity, being able to gradually decrease enamel microhardness, increase surface roughness, and allow loss of substrate mass over the time, demonstrating partial loss of the enamel surface as well.
Disclosure
The authors report no conflicts of interest in this work.
References
1. Grippo JO, Simring M, Coleman TA. Abfraction, abrasion, biocorrosion, and the enigma of non carious cervical lesions: a 20-year perspective. J Esthet Restor Dent. 2012;24:10–23. doi:10.1111/j.1708-8240.2011.00487.x
2. Lussi A. Dental erosion: from diagnosis to therapy. Community Dent Oral Epidemiol. 2006;34:398–399. doi:10.1111/j.1600-0528.2006.00340.x
3. Lussi A, Schlueter N, Rakhmatullina E, Ganss C. Dental erosion–an overview with emphasis on chemical and histopathological aspects. Caries Res. 2011;45:2–12. doi:10.1159/000325915
4. Cheng ZJ, Wang XM, Cui FZ, Ge F, Yan JX. The enamel softening and loss during early erosion studied by AFM, SEM and nanoindentation. Biomed Mater. 2009;4:1–7. doi:10.1088/1748-6041/4/1/015020
5. Kreulen CM, Spijker VT, Rodriguez A. Systematic review of the prevalence of tooth wear in children and adolescents. Caries Res. 2010;44:151–159. doi:10.1159/000308567
6. Gonçalves GK, Guglielmi CA, Corrêa FN, Raggio DP, Corrêa MS. Erosive potential of different types of grape juices. Braz Oral Res. 2012;26:457–463. doi:10.1590/S1806-83242012005000015
7. Instituto Brasileiro de Geografia e Estatística – IBGE. Culturas temporárias e permanentes. Produção Agrícola Municipal. 2009;36:1–90.
8. Chisté RC, Cohen KO, Oliveira SS. Study of tucupi physicochemical properties. Food Sci Technol. 2007;3:437–440. doi:10.1590/S0101-20612007000300002
9. Chisté RC, Cohen KO. Total and free cyanide contents determination during the processing steps for preparing tucupi. Adolfo Lutz Institute J. 2011;1:41–46.
10. Martins LM, Francisconi-dos-rios LF, Meira GDF, Bertocco VPL, Silva LM, Rebelo MAB. Amazonian delicacy tucupi is as erosive as a cola-based soft drink. Arch Oral Biol. 2016;61:84–88. doi:10.1016/j.archoralbio.2015.10.021
11. AOAC. Official Methods of Analysis of the Association of Official Analytical Chemists: Edited Ig W. Horwitz 16th Ed, Vol. 2. Washington (DC); 1997:850
12. Vilhena KFB, Nogueira BCL, Fagundes NCF, Loretto SC, Angelica RS, Lima RR. Dental enamel bleached for a prolonged and excessive time: morphological changes. PLoS One. 2019;14:e0214948. doi:10.1371/journal.pone.0214948
13. Zimmer S, Kirchner G, Bizhang M, Benedix M. Influence of Various acidic beverages on tooth erosion. evaluation by a new method. PLoS One. 2015;10(6):e0129462. doi:10.1371/journal.pone.0129462
14. Ribeiro MES, Santos HSB, Baia JCP, Oliveira RP, Souza Júnior MHS, Loretto SC. Influence of prolonged tooth bleaching on enamel mass variation. Int J Odontostomat. 2019;13:305–309. doi:10.4067/S0718-381X2019000300305
15. Lussi A, Jaeggi T, Zero D. The Role of Diet in the Aetiology of Dental Erosion. Caries Res. 2004;38(suppl 1):34–44. doi:10.1159/000074360
16. Tenuta LMA, Fernández CE, Brandão ACS, Cury JA. Titratable acidity of beverages influences salivary pH recovery. Braz Oral Res. 2015;29:1–6. doi:10.1590/1807-3107BOR-2015.vol29.0032
17. Scaramucci T, Hara AT, Zero DT, Ferreira SS, Aoki IV, Sobral MA. Development of an Orange Juice Surrogate for the Study of Dental Erosion. Braz Dent J. 2011;22:473–478. doi:10.1590/S0103-64402011000600006
18. Devlin H, Bassiouny MA, Boston D. Hardness of enamel exposed to Coca-Cola and artificial saliva. J Oral Rehabil. 2006;33:26–30. doi:10.1111/j.1365-2842.2006.01533.x
19. Rios D, Honório HM, Magalhães AC, et al. Scannig eléctron microscopic study of the in situ effect of salivary stimulation on erosion and abrasion in human and bovine enamel. Braz Oral Res. 2008;22:132–138. doi:10.1590/S1806-83242008000200007
20. Maupomé G, Aguilar-avila M, Medrano-ugalde H, Borges-yanez A. In vitro quantitative microhardness assessment of enamel with early salivary pellicles after exposure to an eroding cola-type soft drink. Caries Res. 1999;33:140–147. doi:10.1159/000016508
 © 2023 The Author(s). This work is published and licensed by Dove Medical Press Limited. The
full terms of this license are available at https://www.dovepress.com/terms
and incorporate the Creative Commons Attribution
- Non Commercial (unported, 3.0) License.
By accessing the work you hereby accept the Terms. Non-commercial uses of the work are permitted
without any further permission from Dove Medical Press Limited, provided the work is properly
attributed. For permission for commercial use of this work, please see paragraphs 4.2 and 5 of our Terms.
© 2023 The Author(s). This work is published and licensed by Dove Medical Press Limited. The
full terms of this license are available at https://www.dovepress.com/terms
and incorporate the Creative Commons Attribution
- Non Commercial (unported, 3.0) License.
By accessing the work you hereby accept the Terms. Non-commercial uses of the work are permitted
without any further permission from Dove Medical Press Limited, provided the work is properly
attributed. For permission for commercial use of this work, please see paragraphs 4.2 and 5 of our Terms.