")
Back to Journals » Psychology Research and Behavior Management » Volume 16
Influence of Thai Street Food Quality, Price, and Involvement on Traveler Behavioral Intention: Exploring Cultural Difference (Eastern versus Western)
Authors Jeaheng Y , Al-Ansi A, Chua BL, Ngah AH, Ryu HB , Ariza-Montes A , Han H
Received 4 May 2022
Accepted for publication 31 August 2022
Published 26 January 2023 Volume 2023:16 Pages 223—240
DOI https://doi.org/10.2147/PRBM.S371806
Checked for plagiarism Yes
Review by Single anonymous peer review
Peer reviewer comments 2
Editor who approved publication: Dr Igor Elman
Yoksamon Jeaheng,1 Amr Al-Ansi,2 Bee-Lia Chua,3 Abdul Hafaz Ngah,4 Hyungseo Bobby Ryu,5 Antonio Ariza-Montes,6 Heesup Han7
1International School of Tourism, Suratthani Rajabhat University, Muang Surat Thani, 84100, Thailand; 2Faculty of Hospitality and Tourism Management, Macau University of Science and Technology, Taipa, 999078, Macau; 3Department of Food Service and Management, Faculty of Food Science and Technology, Universiti Putra Malaysia, Serdang, Selangor, 43400, Malaysia; 4Faculty of Business, Economy and Social Development, Universiti Malaysia Terengganu, Kuala Nerus, Terengganu, 21030, Malaysia; 5College of Health Sciences, Food Franchise Department, Kyungnam University, Changwon-si, Gyeongsangnam-do, 51767, South Korea; 6Social Matters Research Group, Universidad Loyola Andalucía, Córdoba, 14004, Spain; 7College of Hospitality and Tourism Management, Sejong University, Seoul, 143-747, Korea
Correspondence: Hyungseo Bobby Ryu; Heesup Han, Email [email protected]; [email protected]
Introduction: Gastronomy tourism has become a phenomenal trend of the global tourism industry in the 21st century. As the tourism industry and its related foodservice businesses flourish, street food has received increasing popularity with its combination of local delights and the cultural value of the destination. This study examined the psychology of street food consumption and assessed the effect of street food quality that is represented by the cultural experience, health and safety of the food, food sensory appeal, staff service, physical environment, the meal menus with perceived reasonable prices, involvement in Thai street food, and repurchase intention from an international tourist perspective.
Methods: A survey method along with a quantitative structural analysis was used.
Results: The findings revealed that Thai street food quality positively and significantly predicted the international tourists’ perceived reasonable prices, involvement, and repurchase decisions. Perceived reasonable prices and involvement were found to be important mediators between Thai street food quality and repurchase intentions. Moreover, this research identified the significant moderating role of Eastern and Western cultures.
Keywords: Thai street food, food quality, price reasonableness, involvement in street food, international tourist, gastronomy tourism
Introduction
The tourism and hospitality industry has rapidly grown into an empowered leader throughout the world economy.1 The World Tourism Organization reported a total of 1460 million international tourist arrivals with 1481 billion USD in tourism receipts in 2019.5 The tourism and hospitality sectors are in fact the world’s third-largest source of revenue after chemicals and fuels.5 In domestic and international travels, expenditure on food while traveling accounts for more than one-third of the total travel expenses.6 This implies that food consumption represents a predominant and important part of tourism activities and the overall travel experience.7–9 Moreover, local food and cuisine plays an essential role regarding the tourists’ choice of destinations in regards to the travel decision-making process.10,11 No doubt local food and its culture has increasingly become a key part of tourism and hospitality resources, and it represents the image of a country.8 Given the rise of tourists’ interest in local food consumption, an increasing number of local foodservice businesses capitalize on the opportunity by creating a gastronomy tourism experience, which eventually contributes to the country’s economic development.
Street food at a destination is seen as an image that depicts the tangible local food varieties and the intangible cultural value of the local people out of the various gastronomic experiences.6,12 Street food in Asia has played a favorite role of the tourism industry, and it is governed in countries, such as India, Vietnam, Taiwan, Hong Kong, South Korea, Malaysia, Singapore, and Thailand.12–15 The local food and cuisine in Thailand are well-recognized as a pull factor that attracts tourists across the world to visit the country.12 Statistics showed that international tourists’ food expenditure was approximately 326 billion Thai baht of the total tourism revenue in 2016,16 which suggests that food tourism has a significant role in regards to Thailand’s total economic revenue.
The previous research has empirically investigated the role of foodservices and business17–19 and the tourists’ local food experience.11,20,21 Numerous studies have paid attention to foodservice businesses that function in the segments of hotels, restaurants, and coffee shops17–19,22,23. In the context of street food, some academic studies were conducted about street food and the hawker food center as a significant role of tourist attractions.6,14,15,24 However, only a few studies focused on street food and its’ associated qualities that make up the gastronomy tourism experience as a whole12 as well as limited studies on its effect on the international tourists cognitive and behavioral responses. Hence, the following objectives were set for this research in response to the research gap, which include 1) investigating Thai street food quality and its influence on the international tourists’ perception of reasonable price, involvement in Thai street food, and repurchase intentions for the food, 2) testing the mediating role of perceived reasonable prices and involvement in the structural model, and 3) examining the moderating role of cultural differences in order to explain the relationship between street food quality, perceived reasonable prices, involvement, and repurchase intentions. By comprehending how the international tourists respond to Thai street food, this research hopes to offer food tourism marketing guides in order to extend Thailand as a globally competitive food tourism destination.
Literature Review
The Role of Street Food in Tourism
Local food consumption has become a prevailing trend in the international travel and tourism industry.8,25 Food has commonly been identified to be a factor that promotes intentions to travel,13 so there has seen a constant rise in the number of tourists that seek authentic culinary experiences in contemporary travel and tourism. Gastronomy tourism is by definition a type of tourism journey about food experiences that reflects the culture of a destination. The primary purpose of gastronomy tourism is to interact with food venues and participate in food-related activities, such as dining experiences, food tours, food festivals, and food shows, which include tasting the local food, observing the food production, participating in the food preparation, and cooking classes.26 Moreover, gastronomy is a part of tourism that involves traditional value, culture, local lifestyle, and the authenticity of the destination that can collectively contribute to the tourists’ overall travel experience.26
The growth of foodservices in tourism is witnessed with the demand for international travel.25 Street food is a foodservice operation that operates in public places, which include food stalls/hawkers, local markets, roadsides, and festivals. Trolly carts are typically used in order to prepare and sell freshly made and ready-to-eat meals to consumers.27 The availability of local delights, affordable prices, and onsite dining are perhaps the selling features of street food.28 In the context of tourism, the street food experience is a tourism resource in certain destinations that offers a variety of food, which symbolizes the local people’s culture and lifestyle.6 The coexistence of street food and the tourism experience has undisputedly been an attraction in order to connect the tourists to the locals.
Many tourism destinations are targeting street food as a marketing tourism strategy, a part of tourism resources, and tourism attractions given the importance of street food in the tourism and hospitality industry.6,15,24 Many Asian countries prioritize their country’s street food when promoting tourism destinations, and they use street food as a means of enhancing the destination’s attractiveness. For example, Taiwan launched a campaign called a Taste of Taiwan.29 In 2016, two street food hawkers in Singapore, which are called Hill Street Tai Hwa Pork Noodles and Liao Fan Hong Kong Soya Sauce Chicken Rice and Noodles, were awarded Michelin stars.15 Later, Singapore’s hawker culture was officially recognized by UNESCO intangible cultural heritage in 2020.30
On the local front in Thailand, the Thai government has provided various marketing strategies in an effort to attract international tourism, which includes around 20% of the Tourism Authority of Thailand (TAT) budget that is spent on promoting food tourism.16 For example, TAT partnered with Michelin and produced the Michelin Guide to Bangkok in 2018, which runs until 2022.31 More recently, TAT welcomed Chef Andy Ricker’s, who is a celebrated chef in the United States, and Thai-Licious Journey Project Two, which is a travel web series that provided a film about authentic Thai food that presented a unique vision of Thai food and showed tips about how to experience Thai food like a local.32 TAT also promoted Thai food in other releases, such as the Gault & Millau Belux Guidebook, which was published in 2018 in French and Dutch.16 Also, Thailand’s Ministry of Foreign Affairs (MFA) launched video clips on YouTube called 40 Thai Street Food Recipes in order to promote street food via social media in 2018.4
The Role of Street Food in Thailand’s Tourism Industry
Over 150,000 foodservice providers are operating in Thailand with a market capitalization around 834,856 million Thai baht. The major foodservice segments commonly found in Thailand are home deliveries and take out, cafes and bars, full-service restaurants, fast food restaurants, food cafeterias, street food vendors, and kiosks. There are about 103,000 street food operators of these segments that includes about 69.0% of all food businesses. This translates into a total revenue of approximately 271,355 million Thai baht, which is around 32.4% of all food businesses. The street food segment is indeed the largest market share among the other foodservice segments in Thailand.33 In the tourism industry, international tourists in Thailand spent about 20.0% of their travel budget on food and beverages.32
Street food in Thailand represents a critical element of gastronomy tourism in particular and economic development in general. In fact, Thailand is one of the top-ranked destinations when it comes to food and travel.34 This Southeast Asian country is well-known globally for its variety of delectable food that is sold at affordable prices.32 This is reflected by the fact that many popular tourism destinations in Thailand, which include Bangkok Phuket, Chiang Mai, Pattaya, and Krabi have consistently offered and promoted street food as destination attractions. For example, Bangkok has been acknowledged as one of the famous cities in the world for travel and food. This is proven by the fact that the city was ranked third in the Top Global Cities for Dining category,32 and it was one of the world’s best destinations to eat scrumptious food35 with many popular tourist sites offering street food, such as Yaowarat (Bangkok’s Chinatown), Banglamphu (Bangkok’s Old Town), Sukhumvit, Silom, Sathorn Roads, and Saphan Lueng. In recent years, the Thai government cooperated with Michelin to create official Michelin guides for Thailand where a total of 28 Bangkok Thai street food vendors received Big Gourmand, Michelin Plate, and Jay Fai (Auntie Fai Street Food) ratings and earned its first Thai street food One Michelin-Star in 2018.31
Furthermore, Phuket, which is located on the southern part of Thailand, is well known in the world as a rich island with famous beaches and marine activities that include diving and water-sports activities.3,32 One interesting fact is that Phuket is a valued cultural and historical site that comes from the Baba Peranakan or Baba Nyonya culture. Phuket joined the UNESCO creative cities network and was the first city in Southeast Asia to hold the Creative City of Gastronomy title in December 2015.12 Furthermore, Thailand’s Ministry of Foreign Affairs (MFA) has taken the initiative to promote Phuket cuisine and street food by launching a mobile application that is called Phuket Street Food, which provides information about the most popular dishes and the locations of street food. Phuket is rich in authentic street food, such as Hokkien noodles (Baba Nyonya style), dim sum (shumai), satay, roti, sticky rice served with mangoes, and Kanom Jeen, which is rice noodles in a creamy coconut and curry sauce that is similar to laksa of Malaysia and Singapore. The local delights can be easily accessed in the street areas, such as Old Phuket Town, Phuket Centre Market, and Phuket Night Market. Additionally, the Thailand government and Michelin reported 13 types of street food being highlighted in the Michelin Guide Phuket in 2019.31 All things considered, there is no doubt that the street food phenomenon in Thailand has become an attraction for international tourists, which is reflected in the positive development of gastronomy tourism in Thailand.
Street Food Quality Attributes
Quality is defined as a customer’s evaluation about the excellence of a product/service performance based on the perception of the individual attributes that jointly form the overall performance.36 Quality improvement has been recognized as an important strategy in order to achieve business excellence. In the foodservice industry, quality has been identified as a fundamental concept and tool in order to achieve a competitive edge.37 Many scholars have confirmed that a customer’s perception of quality is positively related to post-consumption behavior. For example, Zhao et al39 found three mobile-related service quality dimensions, which included interactional quality, environmental quality, and outcome quality, positively determined customer repurchase intentions. In modeling international travelers’ visit intentions, Han and Hyun58 reported the positive impact of quality on traveler behavior in medical clinics. Han et al48 indicated that the quality of products and services offered by airlines significantly influenced customer perception of price. In a study by40, the food quality of organic restaurants was found to be positively related to price fairness, satisfaction, and behavioral intentions. In travel and tourism, street food is one of the immediate ways that international tourists can learn and experience the culture, value, and lifestyle of the local people in a country they visit.12,41 Street food quality represents a major contributor in order to enhance the tourism experience, which can ultimately contribute to sustainable tourism.6
In addition, the perceived quality of food and restaurants is an important element of the customer decision-making process, which is evident in the extant literature.8,17,19,20,22,23,42,43 For example, Ryu and Han42 found the quality of food, service, and the physical environment were significantly related to the customer experience in quick-casual restaurants. Kwun19 explored the positive relationship between the foodservice elements, which include the service performance, product quality, menu, and facility, satisfaction, and attitude in campus dining. Heung and Gu17 illustrated the positive influence of restaurant atmospherics on behavioral intentions. Ryu43 confirmed the quality of a restaurant’s physical environment and food quality as a significant determinant of the customer’s perceived value. Canny44 found the positive impact of service quality on customer behavior in Indonesian restaurants. Choe and Kim8 explored the positive role of the local food consumption value, which include taste/quality, health value, epistemic value, and prestige value, in order to regulate tourist behavior. A study by Zhang et al,38 investigated the positive association between authenticity value and local food quality. Based on the previous studies, perceived quality is captured by the attributes that are related to street food in this study, which include cultural experience, health and safety of the food, food sensory appeal, staff service, physical environment, and meal menus.
Perceived Reasonable Price
Price refers to the amount of money that customers spend on a product or service.45 Price is also a cue that is used by customers to judge the quality of a product or service that they purchased.40 Perceived reasonable price is generally defined as the customer evaluation of price fairness and acceptability by comparing the actual charged price of a product or service to the reference price, which is the competitor’s price or the price that they previously paid8,40,46. Customer perception of price fairness is something that customer perceived rather than an objective offering by sellers.47 Perceived price fairness in the service sectors has been playing an important role in customer behavior intentions.40,45,48 The benefits of generating a favorable customer perception of price reasonableness include improving advantage differentiation of businesses and ultimately excel in a competitive environment.49
Involvement
Involvement has been widely recognized in the services marketing literature for its important role in order to predict individual attitudes and behaviors.50 Involvement refers to the degree of customer practice, interest, and engagement in products or services.51,52 As involvement increases, positive behavioral intentions are likely to follow.52,53 The positive correlation between involvement and behavioral intention is found in the previous studies conducted in settings, such as shopping, sports, and cruises.52–56, For example, Lai and Chen52 explored the positive association between the perceived service quality, perceived value, satisfaction, involvement, and the behavioral intentions of public transit passengers. Biswas et al55 tested the relationship between sport involvement, satisfaction, and revisit intentions. Chua et al53 examined the involvement of first-time and repeat cruise passengers and its impact on their cognitive, affective, and behavioral responses. Biswas et al54 tested involvement as the mediator between destination attributes and the satisfaction of tourists.
Repurchase Intentions
Repurchase intentions indicate the customer post-consumption action, which has been related to customer loyalty.60 Repurchase intentions are characterized as the process of customers’ desire to return by purchasing the goods, products, or services from the same provider, such as the store or destination, which are based on their past experiences with the provider.49 Continuance purchase intention is defined as the probability that customers will purchase the same products, services, or brands in the future.57 Factors and how they influence individual’s repurchase intentions in the tourism and hospitality settings23,54,58 as well as in the food-related businesses17,59 have been prevalently examined in the extant literature.
Relationships Among Study Variables
It is commonly accepted that a customer’s perception of quality could influence post-consumption behaviors19,60. In the existing hospitality studies, the role of perceived quality in order to explain customer behavior has received considerable attention.40,42,45,51,56,57,61 For example, in the context of restaurants, Kim et al23 demonstrated significant links among perceived food healthiness, perceived value, satisfaction, and revisit intentions. Han and Hyun58 tested the model of international medical tourists’ intentions, and the results confirmed that the customer perception of quality, satisfaction, and trust have a significant effect on their revisit intentions. Han and Hyun58 confirmed the relative influence of quality on tourists’ intentions to revisit art museums. Konuk40 found that perceived price fairness, perceived value, and perceived quality are positively associated. Jeaheng et al51 showed that Muslim tourists’ perceived price and revisit intentions could be heightened by increasing the perceived quality of halal food offerings.
Customer involvement is an important factor in the customer decision-making process.62 The previous studies confirmed that high involvement could contribute to favorable behavioral intentions.51,53,62,63 For example, Lai and Chen52 showed that involvement was an important mediator in order to predict the link between public transport service quality, which includes safety, facility cleanliness, and staff handling, and passenger behavioral intentions. Brown et al55 found involvement in sports and place attachment had a direct influence on revisit intentions to an Olympics city. Chua et al53 reported that involvement played an important role in order to shape cruise passenger loyalty. Based on the empirical studies explained above, this study posited that perceived reasonable price, involvement in Thai street food, and repurchase intentions are the functions of the perceived Thai street food quality, so the following hypotheses were developed, which are listed below.
Hypothesis 1: The perceived quality of Thai street food will lead to an increase in the perceived reasonable price of Thai street food. Hypothesis 2: The perceived reasonable price of Thai street food will lead to an increase in international tourists’ involvement in Thai street food. Hypothesis 3: International tourists’ involvement in Thai street food will lead to an increase in repurchase intentions for Thai street food.
Moderating Role of Cultural Difference (Eastern and Western)
The role of culture should not be neglected in order to understand customer behavior. Culture is an acquired knowledge that people use to interpret experiences and generate social behavior.64 Culture can affect human knowledge, values, attitudes, ways of thinking, and behavior. From a business perspective, culture can affect the strategic marketing in business management.65 In this study, western culture refers to the culture of European countries, the United States, and countries that are deep-rooted in English culture. On the other hand, eastern culture includes people living in Southeast Asia, East Asia, and the Indian subcontinent. It has been suggested that culture could predominantly explain the differences in tourist’s knowledge, attitudes, motivations, and actions.66 Hofstede’s cultural framework, which captures individualism/ collectivism, uncertainty avoidance, power distance, masculinity/ femininity, and long-term orientation/short-term orientation has been widely utilized in order to understand cultural differences. Liu and McClure67 found that the different cultures of customers possessed different complaint patterns. Sivadas68 reported that Asian countries are mostly high on collectivism, and western countries are mostly high on individualism, which is consistent with common beliefs. Ladhari69 highlighted the significant impact of culture on a customer evaluation of service quality. Zhang et al70 showed that eastern consumers have a higher loyalty level than western consumers. Oh et al71 indicated that culture considerably affected the way that Americans and Koreans perceive their service experience in the context of coffeehouse chains. Given the significant influence of cultural difference, it is important to consider its impact on the international tourist behavior. In particular, cultural difference is posited to influence the way international tourists who visit Thailand perceive the Thai street food quality and its subsequent outcomes. As a result, the following hypotheses are postulated.
Hypothesis 4a: The magnitude of the relationship between the perceived quality of Thai street food and the perceived reasonable price of Thai street food is significantly different between western and eastern cultures. Hypothesis 4b: The magnitude of the relationship between the perceived reasonable price of Thai street food and involvement in Thai street food is significantly different between western and eastern cultures. Hypothesis 4c: The magnitude of the relationship between involvement in Thai street food and repurchase intentions for Thai street food is significantly different between western and eastern cultures. Hypothesis 4d: The magnitude of the relationship between the perceived quality of Thai street food and repurchase intentions for Thai street food is significantly different between western and eastern cultures.
Taking these hypotheses in conjunction, Figure 1 presents the conceptual model that depicts the relationships between the perceived quality of Thai street food, the perceived reasonable price of Thai street food, involvement in Thai street food, and repurchase intentions for Thai street food along with the moderating role of the cultural difference.
 |
Figure 1 The proposed research framework. |
Methodology
Measurement of the Study
A self-administrated questionnaire was systematically created for this research. All the constructs of the study variables were measured using multiple items on a seven-point Likert’s scale, which ranged (1) extremely disagree to (7) extremely agree. The measurement for multi-dimensional perceived street food quality was retrieved from the existing food-related and local food consumption studies, which was modified to fit to the context of this study.8,19–21,42 The physical environment of Thai street food was measured using five items, which included overall, Thai street food provides a good atmosphere). Thai street food staff service was measured using six items, which included Thai street food staff is friendly. The health and safety of Thai street food was measured using five items, which included Thai street food provides fresh foods, ingredients, and recipes. Thai street food sensory appeal was measured using four items, which included Thai street food smells good. The meal menu for Thai street food was measured using four items, which included Thai street food offers various menu items. The cultural experience of Thai street food was measured using eight items, which included experiencing Thai street food gives an opportunity to increase new knowledge about Thailand cultures. The perceived reasonable price of Thai street food was measured using four items that are based on the studies of Han and Ryu22, Jang et al18, Choe and Kim8, and Han48, which included Thai street food offers value for the money you pay. Involvement in Thai street food was measured using five items that are based on Yao55, and Biswas et al54, which included I feel a strong sense of belonging to Thai street food. Three items were used to measure repurchase intentions that are adapted from Ryu and Han42, Ryu et al43, and Han and Hyun58, which included I will continue eating Thai street food the next time I visit Thailand.
The study questionnaire was initially created in the English language. It was then translated into the Chinese, Korean, and Japanese languages using a back translation method. In addition to English, the three other languages the survey was translated to are broadly used by international tourists who visit Thailand. The survey questionnaire draft was reviewed and validated by two academic professionals. The reviewers’ feedback included strengthening the screening questions in order to ensure that the appropriate participants were recruited for this survey and adding some pictures of Thai street food to increase the clarity of what street food in Thailand is. After improving the questionnaire, it was sent to a total of 20 participants who had experienced Thai street food in order to make sure that the questions could be understood from a tourist standpoint. No major changes were made to the survey questionnaire following the pilot study.
Data Collection
The empirical data was collected from international tourists who had experienced street food in Thailand. The survey was conducted at the popular tourist attraction sites in Thailand, which included shopping streets, floating markets, and street food sites, such as Bangkok’s Chinatown Yaowarat, Banglamphu, Khaosan Road, Taling Chan Floating Market, Asiatique The Riverfront, Old Phuket Town, and Nakha Market. A non-probability convenience sampling was used of this study, it has been commonly used in many hospitality and marketing scholars as independent random sampling by selected the sample populations that were promptly and agreeable to answering the survey. In addition, the data collection lasted over a four-week period between January 2019 and February 2019. This study used a non-probability convenience sampling technique, which the researcher and the team distributed the questionnaires to international tourists who were willing to answer the survey questions.
Data Analysis
The raw data was organized in Microsoft Excel before transferring it to IBM SPSS Statistics 23.0 and AMOS version 24.0. During the first stage, the questionnaires with missing values, outliers, and unclear responses are eliminated. Accordingly, a total of 28 cases were deleted due to incomplete responses, which accounted for up to 20% of the responses. Moreover, a total of 25, variables with missing values that equate to less than 5% were replaced with the median for ordinal scales and the mean for continuous scales. After the data cleaning, 380 valid cases were employed for this study. According to Kline72 recommended, a minimum sample size of 200 was accepted for analysis. Therefore, our sample size of 380 was considered suitable.
The results of this study were analyzed according to Anderson and Gerbing's73 two-step approach analysis, which involved a confirmatory factor analysis (CFA) and structural equation modeling (SEM). First, a confirmatory factor analysis with the maximum likelihood estimation approach was performed. The reliability and validity analyses of the identified constructs were conducted. Second, the structural equation modeling is performed with a maximum likelihood estimation used to test the research hypotheses. Next, the second-order (Higher-order) construct as a common concept that represented the relationships between reflective of formative of the models was applied to test the multidimensional constructs in this research. Moreover, a bootstrapping technique with 2000 samples was applied for the mediation analysis and structural model. Finally, a metric invariance analysis was used to determine the group difference in the structural model.2,74
Result
Profiles of the Sample
Among the 380, respondents, all the survey respondents had Thai street food consumption experience. About 41.8% [n=159] had experience Thai Street food two to five times, 28.4% (n=108) had experienced it six to ten times, 21.6% (n=82) had experienced Thai street food once, and 8.2% (n=31) had experiencing Thai street food more than ten times. About 39.2% (n=149) had consumed Thai street food in the past one to three day(s) prior to this survey, which was closely followed by 32.9% (n=125) had consumed Thai street food on the day this survey was conducted, 12.9% (n=49) had consumed Thai street food in the past four to seven days, 12.9% (n=49) indicated one to two week(s) ago, and 2.1% (n=8) indicated more than two weeks ago.
The respondents consisted of 50.5% (n=192) female and 49.5% (n=188) male international tourists. The respondents came from 45 countries, which Asian countries accounted for 52.6% (n=200), and European countries, the United States, and other western countries accounted for 47.4% (n=180). The average mean age of the respondents was 27 years (std. deviation=6.627 SD), which ranged from 16 to 70 years old. Approximately 53.9% (n=205) of the respondents were college graduates, which was followed by 16.8% (n=64) who had a graduate degree, 14.5% (n=55) were high school graduates, 12.1% (n=46) had finished some college, and 2.6% (n=10) had less than a high school education. About 36.6% (n=139) of the respondents worked in the business sectors, which was followed by 25.5% (n=97) who were students, 12.9% (n=49) were professionals, 6.1% (n=23) were government employees, 3.9% (n=15) worked in education, 3.4% (n=15) worked in the agricultural sector, one respondent was a retiree, and 11.3% (n=43) reported other types of occupation. Around 24.7% (n=94) indicated that they had an annual income between US$ 55,000 and 69,999, 22.6% (n=86) had an income between US$ 25,000 and 39,999, 21.6% (n=82) had an income under US$ 24,999, 17.4% (n=66) had an income between US$ 40,000 and 54,999, 11.6% (n=44) had an income between US$ 70,000 and 84,999, and 2.1% (n=8) reported an income that was over US$ 85,000. The majority of the respondents, which was 68.9% (n=262), reported that the primary purpose of visiting Thailand was for a holiday. In addition, 11.3% (n=43) were in Thailand to visit friends/relatives, 6.1% (n=23) were traveling for work purposes, 2.9% (n=11) visited Thailand for shopping, 3.4% (n=13) traveled to Thailand for medical tourism, 2.9% (n=11) visited Thailand for spa and wellness tourism, and 2.1% (n=8) visited Thailand for sports and other purposes. The sample profiles are presented in Table 1.
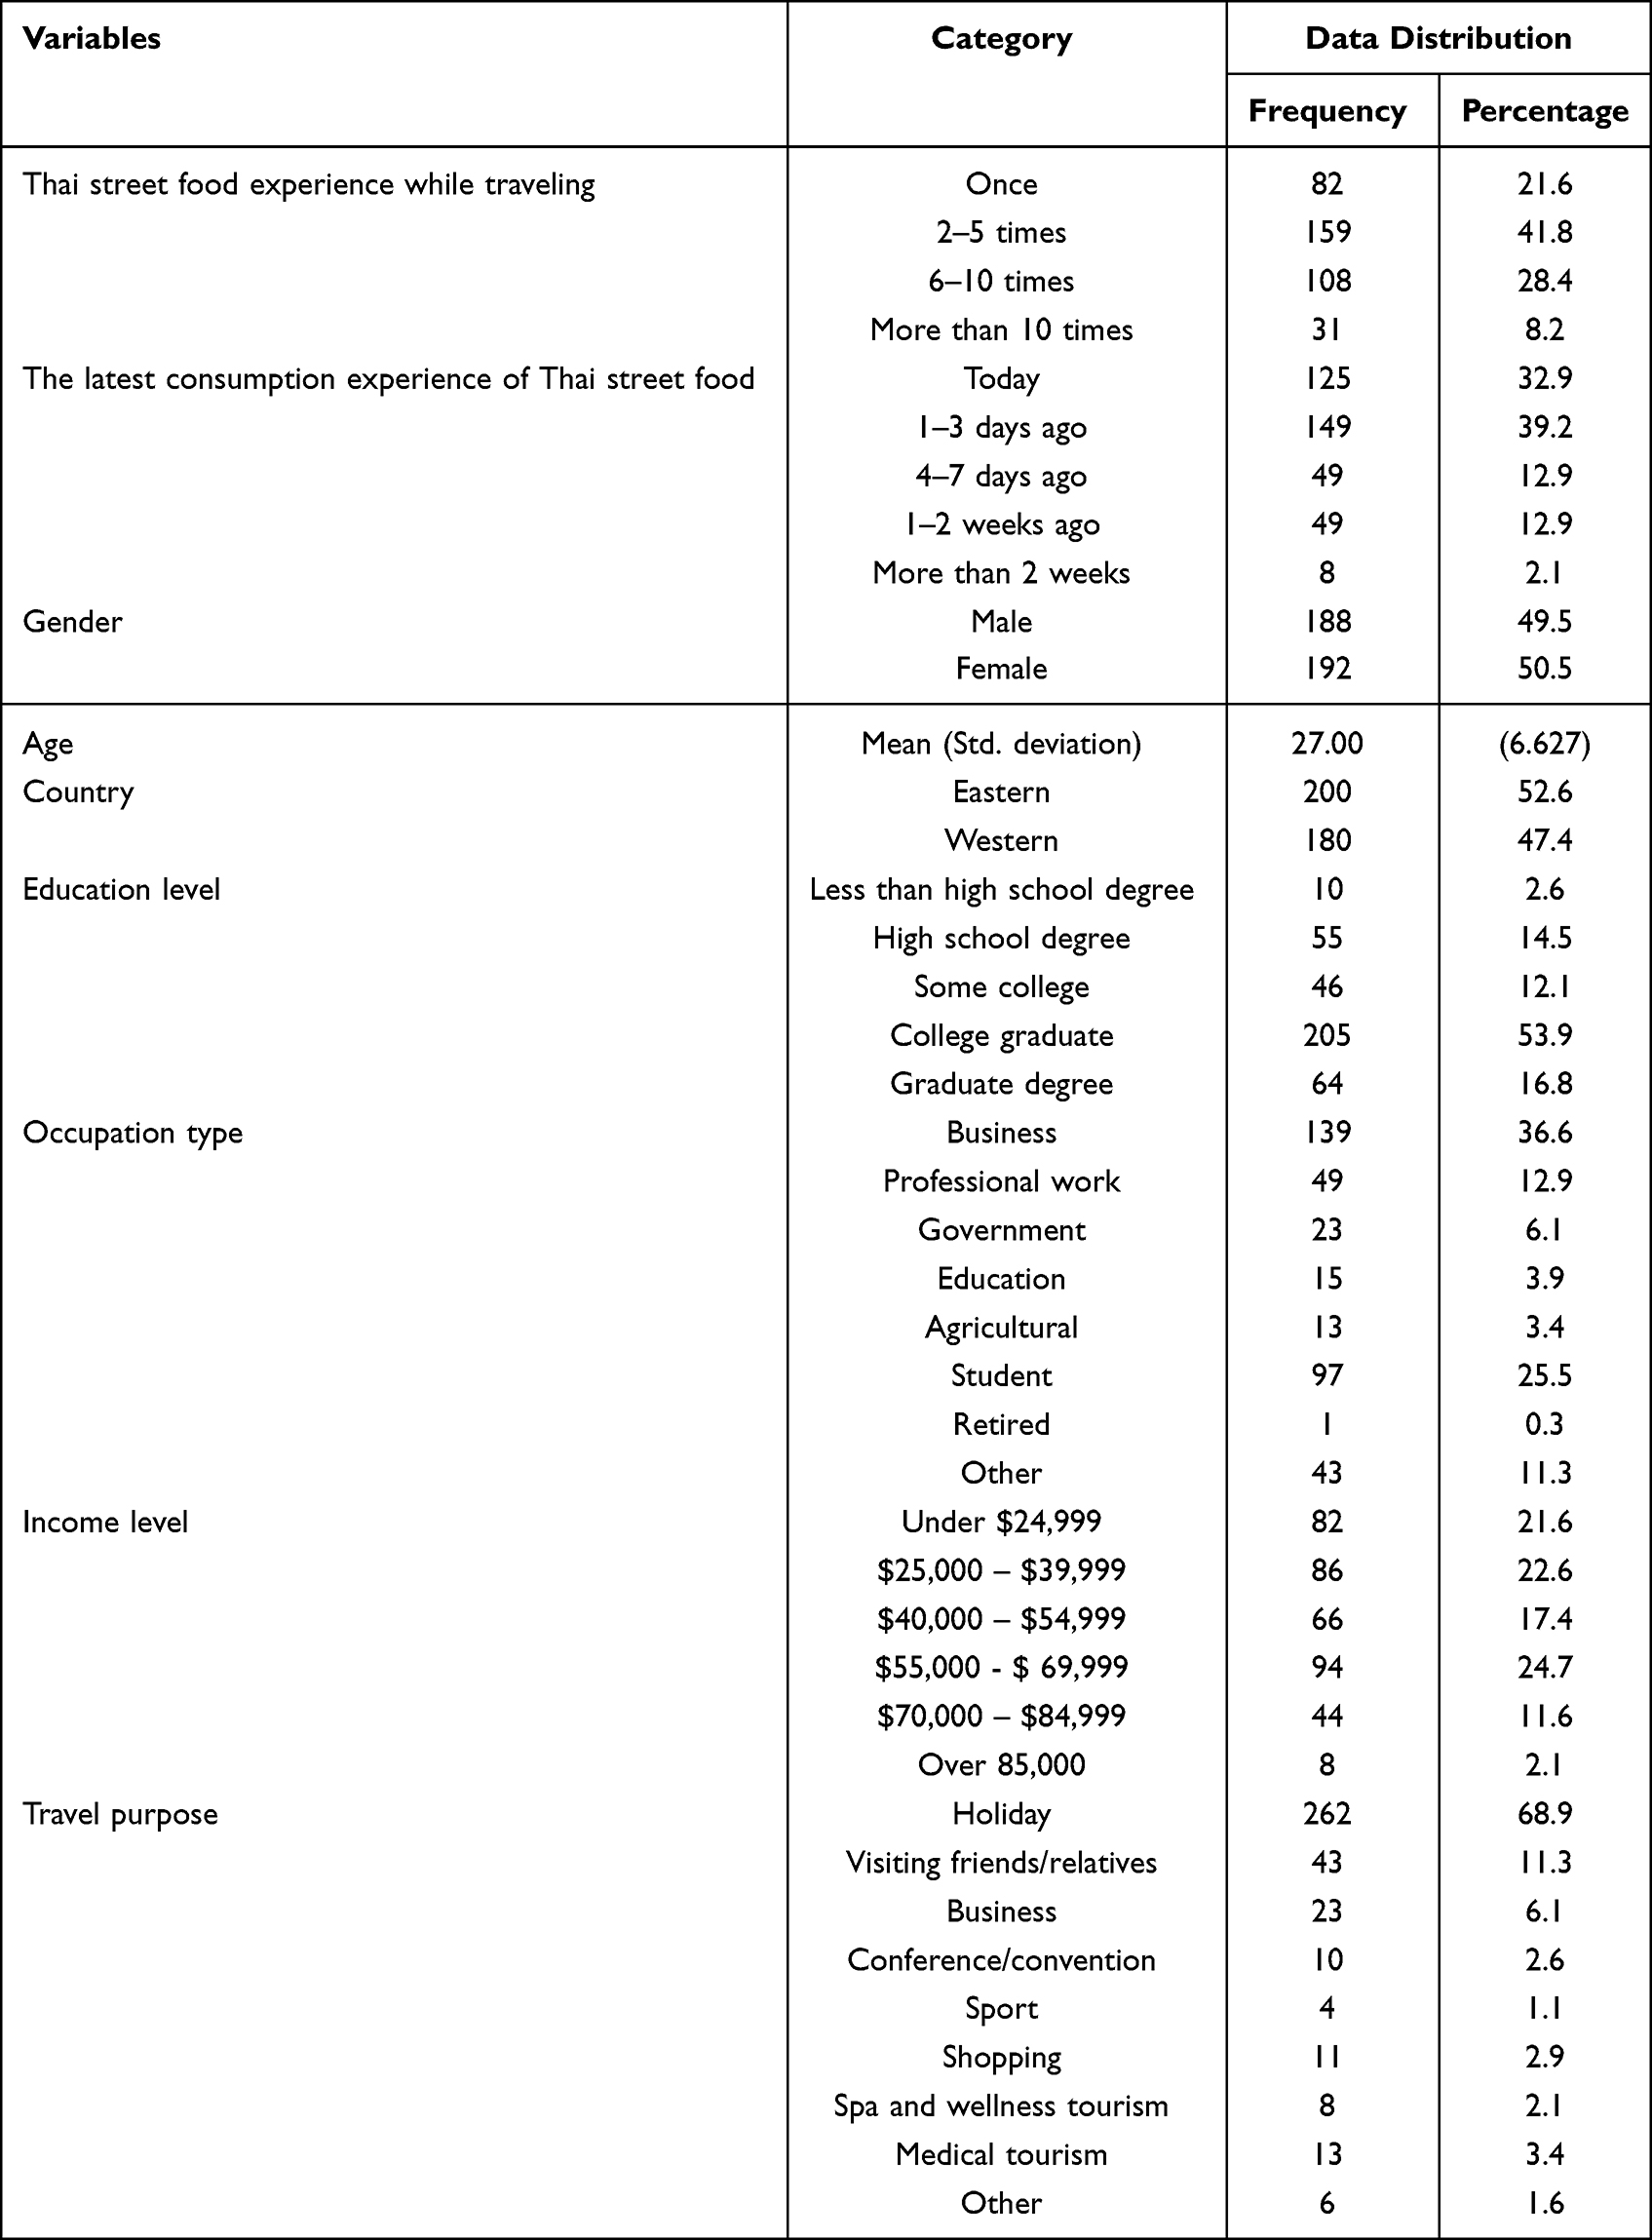 |
Table 1 Sample Characteristics |
Confirmatory Factor Analysis
The details of the confirmatory factor analysis are summarized in Tables 2 and 3. The conceptual model satisfactorily fit the data (χ2=1809.935, df=848, χ2/df=2.134, p<0.001, RMSEA=0.055, CFI=0.908, NFI=0.841, and IFI=0.909). The composite reliability was tested according to Fornell and Larcke’s75 suggested cut-off value of 0.70. The results indicated that all the reliability values ranged between 0.910 and 0.844, which confirmed that each study construct was reliable. The average variance extracted (AVE) values for all the constructs ranged between 0.505 and 0.717, which were all higher than the cut-off value of 0.50.76 The AVE values also exceeded the squared correlations between the study constructs. Hence, the discriminant validity of the measures was supported. Next, Harman’s one-factor test was conducted in order to scrutinize the existence of a common method bias in this survey.77 The results showed that a total of 28.86% of the variance was explained by a single factor of all the observed variables, which was lower than the threshold of 50%.78 Hence, this implies that a common method bias is not a concerning issue in this study. Furthermore, the normality was assessed using the skewness and kurtosis values. The skewness values ranged between −1.173 and 0.264 (std. error=0.125), and the kurtosis values ranged between −0.744 and 1.828 (std. error=0.250). In addition, the normality results suggested that the data was free from a normality issue considering that the values all occurred within the acceptable range of −2.00 to + 2.00.76,79
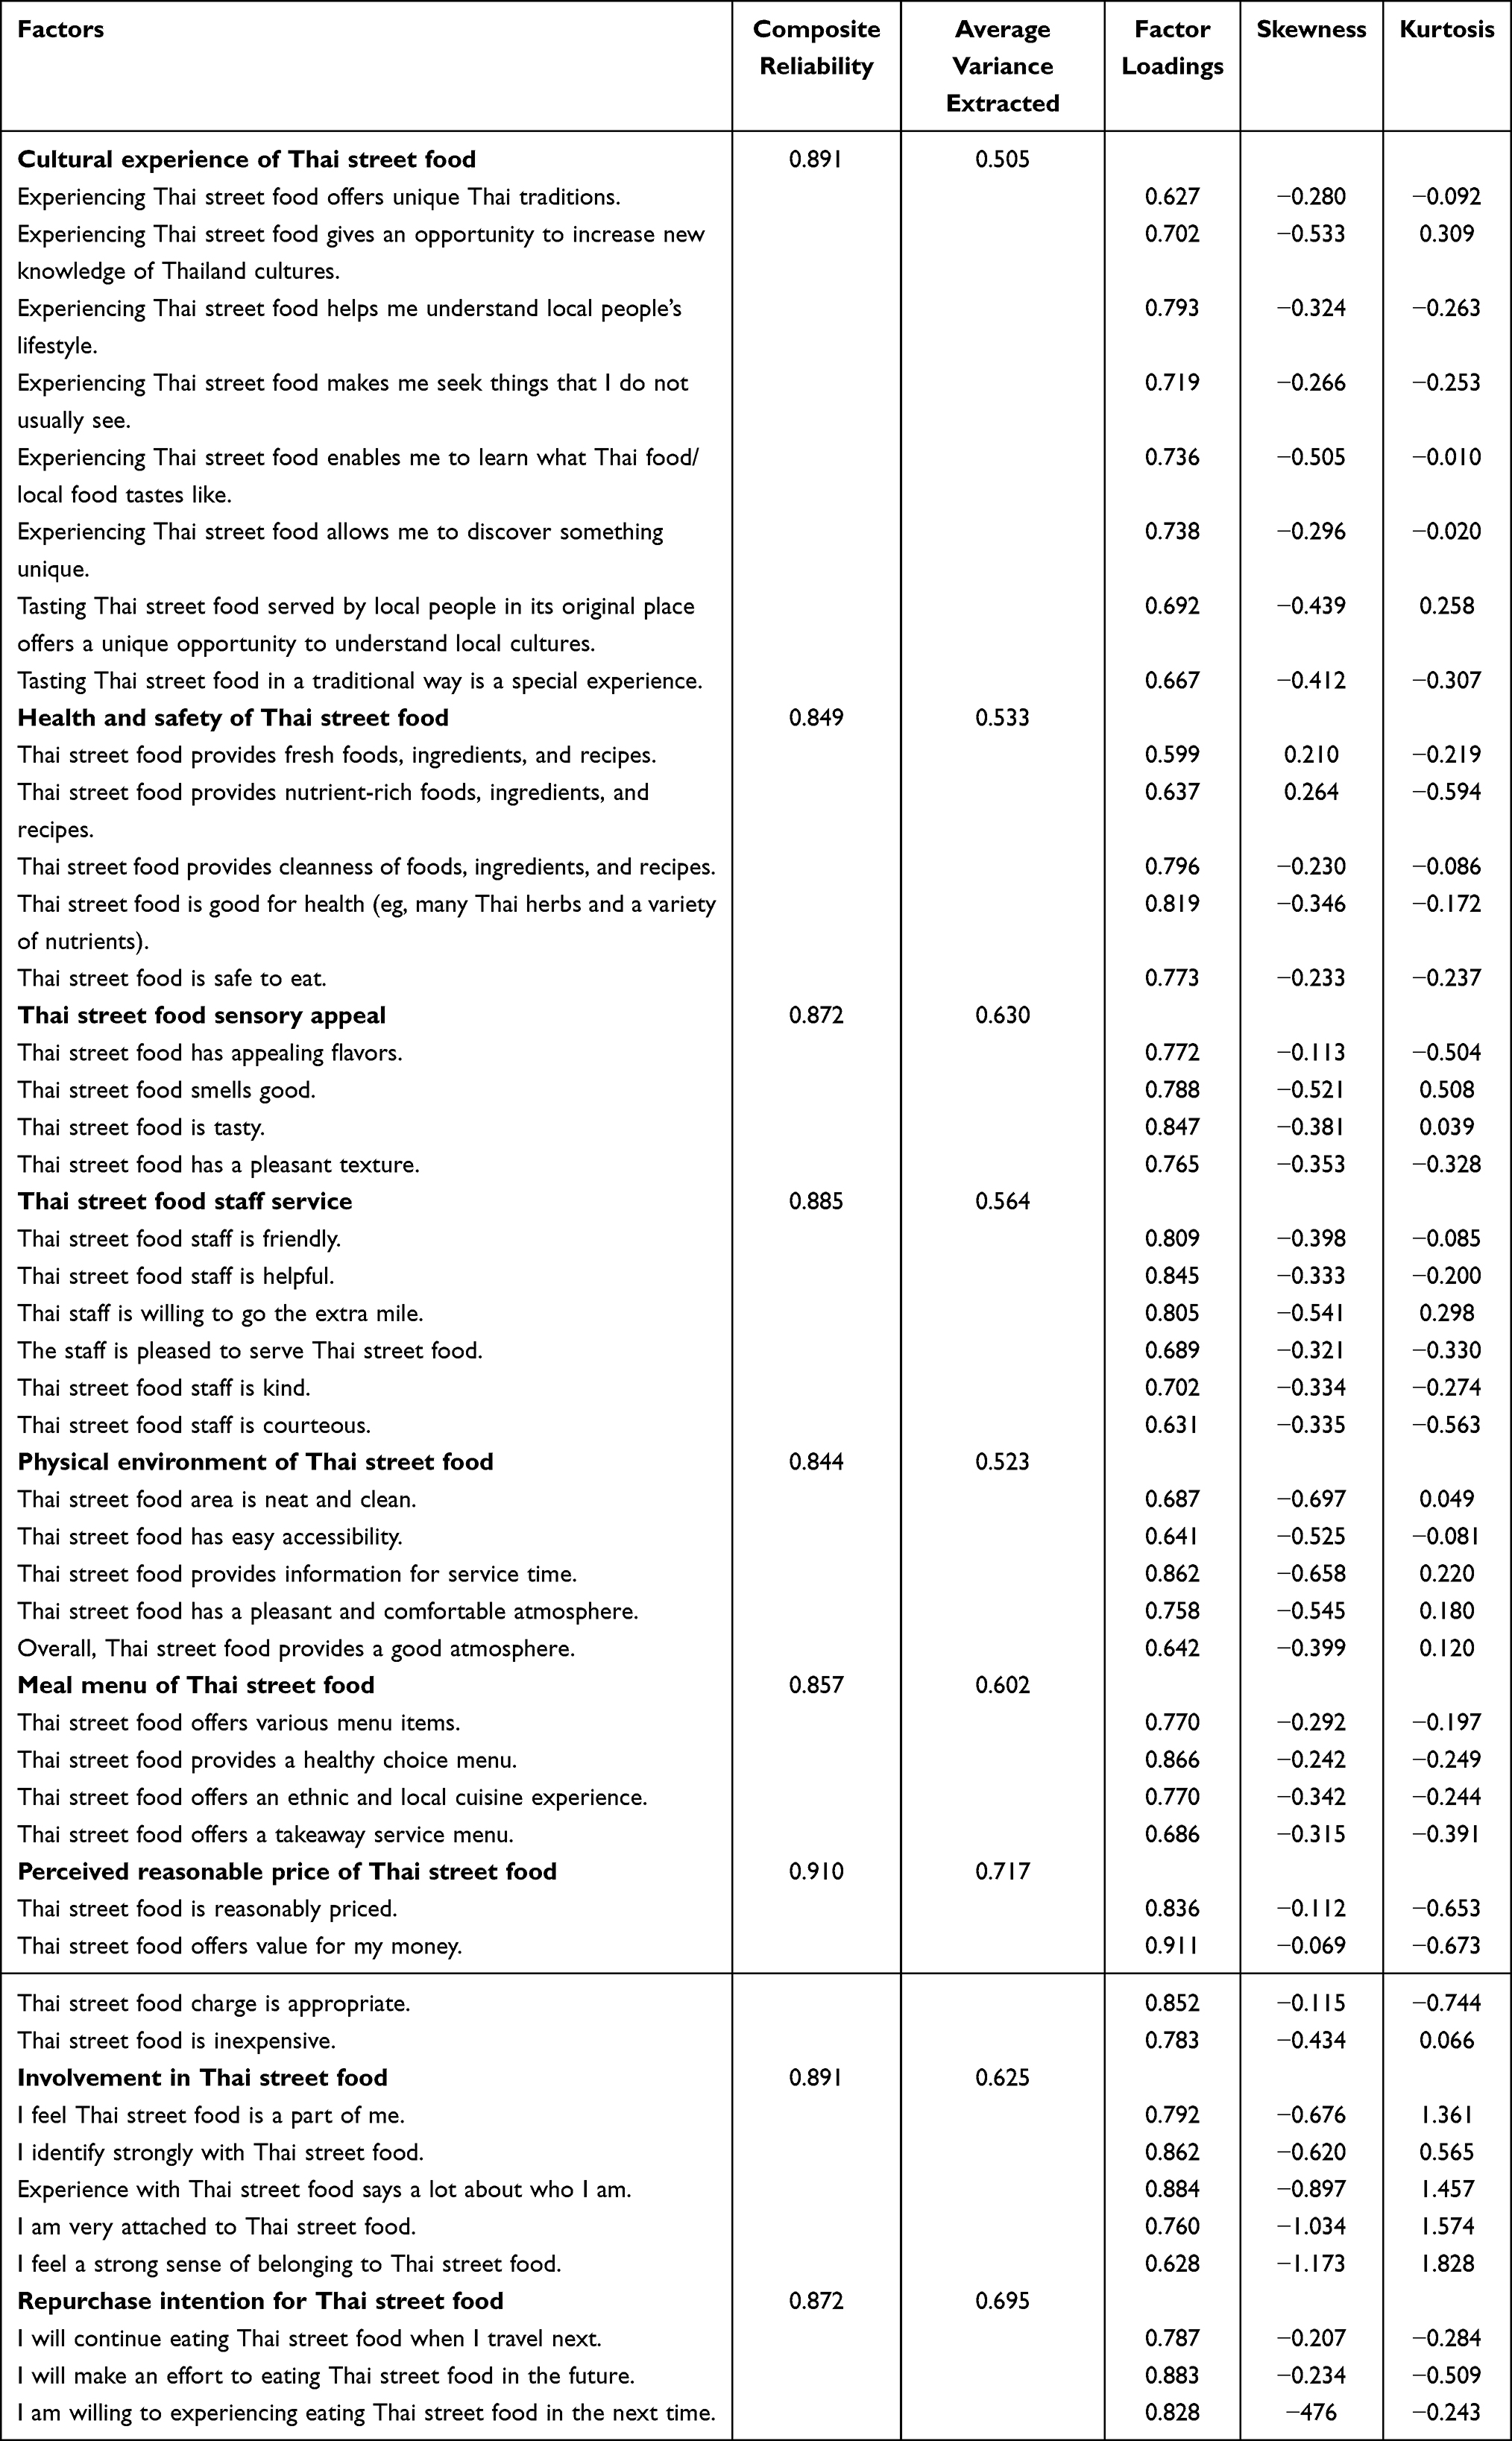 |
Table 2 The Confirmatory Factor Analysis Results |
 |
Table 3 Correlations Among Variables |
Structural Equation Modeling
The results of structural equation modeling showed an appropriate fit of the structural model to the data (χ2=2227.522, df=886, χ2/df=2.514, p<0.001, RMSEA=0.060, CFI=0.871, IFI=0.872). The modification indices suggested that by adding additional paths, the strength of the model has improved. The modified model was found to be more statistically robust than the proposal model (χ2=1980.303, df=881, χ2/df=2.248, p<0.001, RMSEA=0.057, CFI=0.895, IFI=0.895). The comparison between proposed model and modified model was Δχ2=247.219, (Δ df=5), p<0.01 as showed in Table 4.
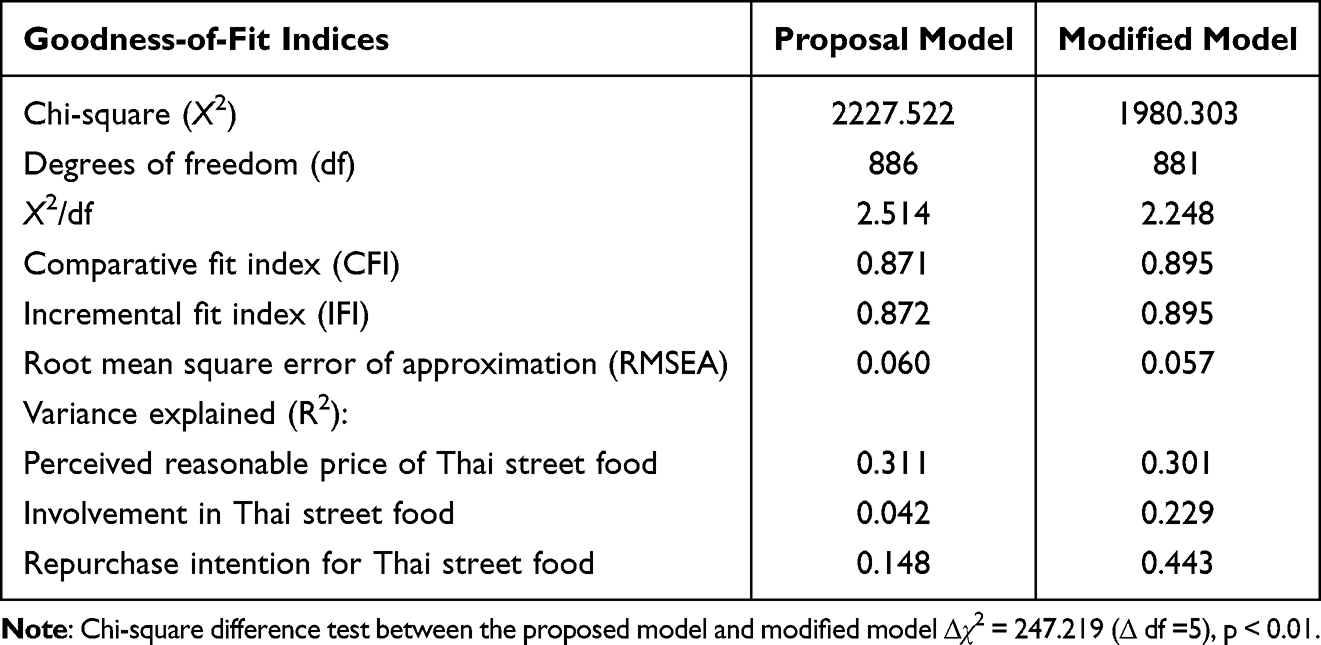 |
Table 4 Fit Indices of Models |
The results of the hypothesis testing are depicted in Table 5 and Figure 2. Hypothesis 1 was tested and supported that the quality of Thai street food had a significant positive influence on perceived reasonable price of Thai street food (β=0.548, t=7.385, and p<0.001). The finding for Hypothesis 2 indicated that perceived reasonable price of Thai street food had a significant negative influence on involvement in Thai street food (β=−.132, t=−2.009, and p<0.05). Next, Hypothesis 3 was tested and indicated that involvement in Thai street food had a significant positive influence on repurchase intention for Thai street food (β=0.190, t=3.392, and p<0.001). Additional paths were tested and indicated that perceived quality of Thai street food was positively and significantly related to involvement in Thai street food (β=0.539, t=6.245, and p<0.001) and repurchase intention for Thai street food (β=0.257, t=6.222, and p<0.001). Perceived reasonable price of Thai street food also positively and significantly predicted repurchase intention for Thai street food (β=0.389, t=3.411, and p<0.001).
 |
Table 5 Results of the Structural Equation Modeling |
 |
Figure 2 Structural model modification (n=380). Notes: Goodness-of-fit statistics: χ2=1980.303, df=881, χ2/df=2.248, p<0.001, RMSEA=0.057, CFI=0.895, IFI=0.895. *p < 0.05. **p < 0.01. ***p < 0.001. |
Next, the indirect impact of the study variables was tested by using a bootstrapping technique. The results indicated that perceived quality of Thai street food did not have a significant indirect influence on involvement in Thai street food (statistics=0.164 and p>0.05). Next, the indirect path of perceived reasonable price of Thai street food on repurchase intention for Thai street food was not significantly related (statistics=0.574 and p>0.05). However, the indirect path of perceived quality of Thai street food on repurchase intention for Thai street food was significantly related (statistics=−.021 and p<0.05). As shown in Table 5, the explained variation was 30.1% for perceived reasonable price of Thai street food, 22.9% for involvement in Thai street food, and 43.3% for repurchase intention for Thai street food.
Invariance Model
In order to test the moderating effect of cross-cultural difference, which involves Hypothesis 4a to Hypothesis 4c, a metric invariance assessment was conducted. The details are provided in Table 6 and Figure 3. First, the sample was split into two groups, which included Eastern Culture (n=200) and Western Culture (n=180). The model adequately fit the data (goodness-of-fit statistics: χ2/df=1.736 χ2=3059.067, df=2404, p<0.001, RMSEA=0.044, CFI=0.878, and IFI=0.879). Next, the structural invariance of the baseline model was compared to the nested models between Eastern Culture and Western Culture are shown in Table 7. The chi-square test revealed that the link from perceived quality of Thai street food to perceived reasonable price of Thai street food was statistically significant across the groups (Δχ2=(1)=4.562 and p<0.05). The link from perceived reasonable price of Thai street food to involvement in Thai street food (Δχ2=(1)=.263 and, p>0.05) was not statistically significant across the groups. The link from involvement in Thai street food to repurchase intention for Thai street food (Δχ2=(1)=1.855 and p>0.05) was not statistically significant across the groups. The additional path illustrating the connection between perceived quality of Thai street food and repurchase intention for Thai street food was also not significant across groups (Δχ2=(1)=.683 and p>0.05). In summary, the moderating test results found that the influence of perceived quality of Thai street food on perceived reasonable price of Thai street food was evaluated differently between eastern and western tourists.
 |
Table 6 Results of the Measurement Invariance Model for Eastern Group (n=200) and Western Group (n=180) |
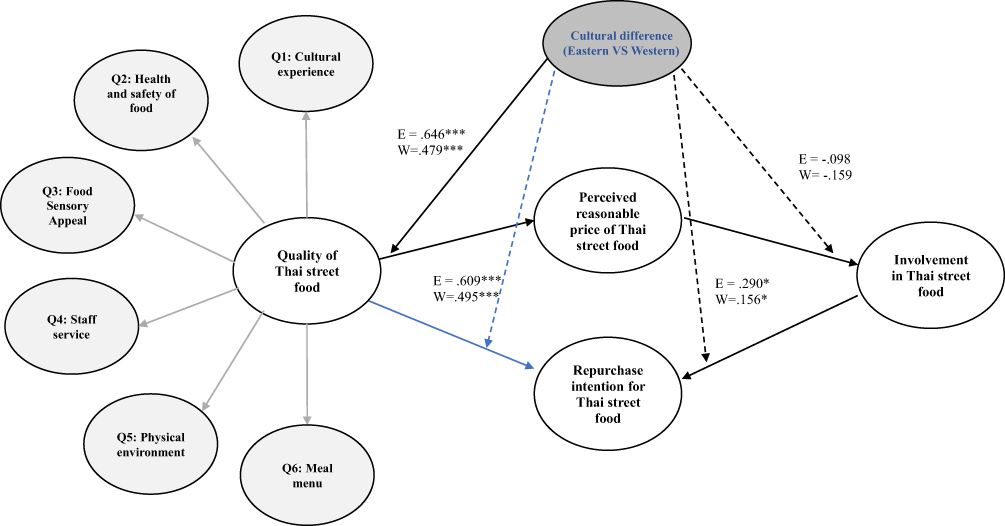 |
Figure 3 Structural model with invariant analysis results (n=380). Notes: Goodness-of-fit statistics: χ2=3059.067, df=1762, χ2/df=1.736, p<0.001, RMSEA=0.044, CFI=0.878, IFI=0.879. *p < 0.05, ***p < 0.001. |
 |
Table 7 Results of the Structural Invariance Model for Eastern and Western Groups |
Discussion and Implications
Even though there is a substantial amount of research on food tourism and local food consumption in Asian tourist destinations, a limited number of studies have determined the role of street food quality in their post-consumption decision making. This research contributed to the body of knowledge by identifying how the perceived quality of Thai street food could lead repurchase intentions from an international tourist perspective. The elements of Thai street food quality, which consisted of the cultural experience, health and safety of the food, food sensory appeal, staff service, physical environment, and the meal menus were identified in this study. This study tested the effect of perceived quality of Thai street food on perceived reasonable prices as well as involvement in Thai street food. The effect of tourist involvement in Thai street food on repurchase intentions was also determined. Lastly, the moderating impact of cross-culture on the structural paths was investigated.
The results of the hypothesis testing found that when tourists perceive the quality of Thai street food to be high, it could affect their perception of street food price reasonableness. Furthermore, the perceived reasonable price was found to be a driver of international tourist involvement with Thai street food. The involvement of tourists in Thai street food would then greatly increase their intentions to repurchase Thai street food. The empirical results concur with the notion that the quality elements could positively determine the customer’s post-consumption behavior in the context of food studies.40,42,45,51,56,57,61 This suggests that street food quality should be viewed as a critical tool in order to achieve sustainable gastronomy tourism.
Additionally, the results showed that international tourists’ perceived reasonable price of Thai street food positively affected their intention to repurchase Thai street food, which was based on the modification paths in the modified model. This confirms the view that one of the keys in order to retain customers is to create a reasonable price perception.40,45,48,49 The findings of this study also found the direct impact of the perceived Thai street food quality on the tourists’ involvement and repurchase intentions for Thai street food. Moreover, the metric invariance test of Western and Eastern cultures reported one significant path existed in the relationship between the perceived street food quality and the perceived reasonable price. The magnitude of the relationship was found to be significantly stronger for Eastern tourists than Western tourists. In international business, Brouthers80 noted that providing superior product strategies was more effective in order to attract Asian consumers than US consumers. Cross-culture is seen as a valuable role in order to predict how people from different cultural backgrounds think.
This study offers some practical implications for the government and street food operators as well as the stalls or hawkers. This study informed that the tourists would seek the quality of the food image of the destination. Accordingly, the national government and regulatory bodies should recognize and get involved in assisting the street food businesses to improve the quality of street food and its image as well as constantly promoting Thailand as a gastronomy tourism destination. In this regard, the government should create a policy to control and support the standards of street food quality by concentrating on the quality measures, which include cultural experience, health and safety of the food, food sensory appeal, staff service, physical environment, and the meal menus. The elements of street food quality should be managed in an integrated manner and taken as fundamental tools when positioning Thailand a globally competitive gastronomy tourism destination. In addition to this, considering the importance role of perceived price, the government should actively regulate street food prices, which form a part of the Thai street food image.
From the street food operator’s perspective, they should keep improving the business by elevating the level of the street food quality. The tourist expectations of the street food quality should be met in order to increase their repurchase intentions. As more and more international tourists are increasingly seeking authentic cultural experience while traveling, street food is a commercial product as well as seen as an image that portrays the local culture. Thus, the locals should keenly take quality into consideration when planning a street food business. Price is another important issue that international tourists use to evaluate their street food experience, because they would compare the price paid against the quality received. The street food operators in Thailand should strive to excel in order to meet the international tourists’ demand by taking the point mentioned above in conjunction.
This study has several limitations that warrant future investigations, which is similar to many previous studies. First, this current study only assessed six street food quality elements. The elements are fundamentally sufficient in order to capture the street food quality, but the future studies may extend the quality dimensions that have been overlooked in this study. Second, the data was collected from international tourists in Bangkok and Phuket from Thailand. The future studies may consider collecting data from other tourist destinations in Thailand that are well-known for street food, such as Chiang Mai, Krabi, and Pattaya. In addition, the studies on tourist behavior that concern local street food in other Asian countries, such as Malaysia, Singapore, Vietnam, South Korea, and Taiwan will be an interesting future research avenue. Third, the future studies are suggested to expand the conceptual model of this study in order to increase its robustness and comprehensiveness in order to understand the tourist decision-making in regards to the local street food.
Ethical Statement
The present research was conducted according to the guidelines of the Declaration of Helsinki, and approved by the research program committee of Sejong University (No. 338.4791 J43t from Sejong University). All participants provided informed consent to participate in this survey.
Funding
This research received no external funding.
Disclosure
The authors declare that they have no competing interests in this work.
References
1. Moyle C, Moyle B, Burgers H. Entrepreneurial strategies and tourism industry growth. Tour Manage Perspect. 2020;35:100708. doi:10.1016/j.tmp.2020.100708
2. Steenkamp JEM, Baumgartner H. Assessing measurement invariance in Cross‐National Consumer Research. J Consumer Res. 1998;25(1):78–107. doi:10.1086/209528
3. TAT announces Phuket’s inclusion among the ‘World’s Best Places to Visit’—TAT Newsroom; 2022. Available from: https://www.tatnews.org/2019/07/tat-announces-phukets-inclusion-among-The-worlds-best-places-to-visit/.
4. TAT Newsroom. Thailand Foundation launches video clips on Thai street food cooking; 2018. Available from: https://www.tatnews.org/2018/02/thailand-foundation-launches-video-clips-thai-street-food-cooking/.
5. World Tourism Organization (UNWTO). UNWTO Tourism Highlights: 2018 Edition. World Tourism Organization (UNWTO); 2018.
6. Henderson JC, Yun OS, Poon P, Biwei X. Hawker centres as tourist attractions: the case of Singapore. Int J Hospital Manage. 2012;31(3):849–855. doi:10.1016/j.ijhm.2011.10.002
7. Chang RCY, Kivela J, Mak AHN. Attributes that influence the evaluation of travel dining experience: when East meets West. Tour Manage. 2011;32(2):307–316. doi:10.1016/j.tourman.2010.02.009
8. Choe JY, Kim S. Effects of tourists’ local food consumption value on attitude, food destination image, and behavioral intention. Int J Hospital Manage. 2017;71:1–10. doi:10.1016/j.ijhm.2017.11.007
9. Rousta A, Jamshidi D. Food tourism value: investigating the factors that influence tourists to revisit. J Vacation Market. 2020;26(1):73–95. doi:10.1177/1356766719858649
10. Chang S. Food tourism in Korea. J Vacation Market. 2021;27(4):420–436. doi:10.1177/13567667211009580
11. Mak AHN, Lumbers M, Eves A, Chang RCY. Factors influencing tourist food consumption. Int J Hospital Manage. 2012;31(3):928–936. doi:10.1016/j.ijhm.2011.10.012
12. Torres Chavarria LC, Phakdee-auksorn P. Understanding international tourists’ attitudes towards street food in Phuket, Thailand. Tour Manage Perspect. 2017;21:66–73. doi:10.1016/j.tmp.2016.11.005
13. Ab Karim S, Chi CGQ. Culinary tourism as a destination attraction: an empirical examination of destinations’ food image. J Hosp Market Manage. 2010;19(6):531–555. doi:10.1080/19368623.2010.493064
14. Choi J, Lee A, Ok C. The effects of consumers’ perceived risk and benefit on attitude and behavioral intention: a study of street food. J Travel Tour Market. 2013;30(3):222–237. doi:10.1080/10548408.2013.774916
15. Henderson JC. Street food and tourism: a southeast asian perspective. In: Park E, Kim S, Yeoman I, editors. Food Tourism in Asia. Singapore: Springer; 2019:45–57. doi:10.1007/978-981-13-3624-9_4
16. TAT Newsroom. Amazing Thai Taste Festival 2017 to showcase authentic cuisine of Thailand; 2017. Available from: https://www.tatnews.org/2017/05/amazing-thai-taste-festival-2017-showcase-authentic-cuisine-thailand/.
17. Heung VCS, Gu T. Influence of restaurant atmospherics on patron satisfaction and behavioral intentions. Int J Hospital Manage. 2012;31(4):1167–1177. doi:10.1016/j.ijhm.2012.02.004
18. Jang YJ, Kim WG, Bonn MA. Generation Y consumers’ selection attributes and behavioral intentions concerning green restaurants. Int J Hospital Manage. 2011;30(4):803–811. doi:10.1016/j.ijhm.2010.12.012
19. Kwun DJW. Effects of campus foodservice attributes on perceived value, satisfaction, and consumer attitude: a gender-difference approach. Int J Hospital Manage. 2011;30(2):252–261. doi:10.1016/j.ijhm.2010.09.001
20. Kim YG, Eves A. Construction and validation of a scale to measure tourist motivation to consume local food. Tour Manage. 2012;33(6):1458–1467. doi:10.1016/j.tourman.2012.01.015
21. Stone MJ, Soulard J, Migacz S, Wolf E. Elements of memorable food, drink, and culinary tourism experiences. J Travel Res. 2018;57(8):1121–1132. doi:10.1177/0047287517729758
22. Han H, Ryu K. The roles of the physical environment, price perception, and customer satisfaction in determining customer loyalty in the restaurant industry. J Hosp Tour Res. 2009;33(4):487–510. doi:10.1177/1096348009344212
23. Kim HJ, Park J, Kim MJ, Ryu K. Does perceived restaurant food healthiness matter? Its influence on value, satisfaction and revisit intentions in restaurant operations in South Korea. Int J Hospital Manage. 2013;33(1):397–405. doi:10.1016/j.ijhm.2012.10.010
24. Tsai C-T, Wang Y-C. Experiential value in branding food tourism. J Destination Market Manage. 2017;6(1):56–65. doi:10.1016/j.jdmm.2016.02.003
25. Lefrid M, Torres EN. Hungry for food and community: a study of visitors to food and wine festivals. J Vacation Market. 2021;135676672110605. doi:10.1177/13567667211060568
26. World Tourism Organization (UNWTO) & Basque Culinary Center. Guidelines for the Development of Gastronomy Tourism. World Tourism Organization (UNWTO); 2019.
27. Food for the cities: street foods; 2022. Available from: https://www.fao.org/fcit/food-processing/street-foods/en/.
28. Cohen M. By. June. 1984.
29. Chaney S, Ryan C. Analyzing the evolution of Singapore’s World Gourmet Summit: an example of gastronomic tourism. Int J Hospital Manage. 2012;31(2):309–318. doi:10.1016/j.ijhm.2011.04.002
30. Yong C. Singapore’s hawker culture added to Unesco list of intangible cultural heritage. The Straits Times; 2020. Available from: https://www.straitstimes.com/singapore/singapores-hawker-culture-added-to-unesco-list-of-intangible-cultural-heritage.
31. MICHELIN Guide. Michelin Guide Bangkok; 2022. Available from: https://guide.michelin.com/th/en/article/dining-in/press-release-michelin-guide-bangkok.
32. TAT Newsroom. Bangkok ranked in Top Ten list of global cities for dining and shopping in MasterCard index 2018; 2019. Available from: https://www.tatnews.org/2019/01/bangkok-ranked-in-top-ten-list-of-global-cities-for-dining-and-shopping-in-mastercard-index-2018/.
33. Prachachat News. Golden opportunity of street food in Thailand; 2018. Available from: https://www.prachachat.net/economy/news-153570.
34. TAT Newsroom. Thailand ranks top in Travel Weekly UK best Destinations in the World survey; 2018. Available from: https://www.tatnews.org/2018/08/thailand-ranks-top-in-travel-weekly-uk-best-destinations-in-the-world-survey/.
35. CNN Travel. World street food congress 2016 in Manila; 2022. Available from: https://edition.cnn.com/travel/article/manila-world-street-food-congress/index.html.
36. Zeithaml VA. Consumer perceptions of price, quality, and value: a means-end model and synthesis of evidence. J Mark. 1988;52(3):2–22. doi:10.1177/002224298805200302
37. Chua B, Lee S, Goh B, Han H. International Journal of Hospitality Management Impacts of cruise service quality and price on vacationers’ cruise experience: moderating role of price sensitivity. Int J Hospital Manage. 2015;44:131–145. doi:10.1016/j.ijhm.2014.10.012
38. Zhang M, Kim PB, Goodsir W. Effects of service experience attributes on customer attitudes and behaviours: the case of New Zealand café industry. J Hosp Market Manage. 2019;28(1):28–50. doi:10.1080/19368623.2018.1493711
39. Zhao L, Lu Y, Zhang L, Chau PYK. Assessing the effects of service quality and justice on customer satisfaction and the continuance intention of mobile value-added services: an empirical test of a multidimensional model. Decis Support Syst. 2012;52(3):645–656. doi:10.1016/j.dss.2011.10.022
40. Konuk FA. The influence of perceived food quality, price fairness, perceived value and satisfaction on customers’ revisit and word-of-mouth intentions towards organic food restaurants. J Retail Consumer Services. 2019;50:103–110. doi:10.1016/j.jretconser.2019.05.005
41. Ellis A, Park E, Kim S, Yeoman I. What is food tourism? Tour Manage. 2018;68:250–263. doi:10.1016/j.tourman.2018.03.025
42. Ryu K, Han H. Influence of the quality of food, service, and physical environment on customer satisfaction and behavioral intention in quick-casual restaurants: moderating role of perceived price. J Hosp Tour Res. 2010;34(3):310–329. doi:10.1177/1096348009350624
43. Ryu K, Lee H, Gon Kim W. The influence of the quality of the physical environment, food, and service on restaurant image, customer perceived value, customer satisfaction, and behavioral intentions. Int J Contemp Hosp Manage. 2012;24(2):200–223. doi:10.1108/09596111211206141
44. Canny I. Measuring the mediating role of dining experience attributes on customer satisfaction and its impact on behavioral intentions of casual dining restaurant in Jakarta. Int J Innov Manage Technol. 2014;5(1). doi:10.7763/IJIMT.2014.V5.480
45. Zhong Y, Moon HC. What drives customer satisfaction, loyalty, and happiness in fast-food restaurants in china? perceived price, service quality, food quality, physical environment quality, and the moderating role of gender. Foods. 2020;9(4):460. doi:10.3390/foods9040460
46. Chung JY, Petrick JF. Price fairness of airline ancillary fees: an attributional approach. J Travel Res. 2013;52(2):168–181. doi:10.1177/0047287512457261
47. Hu -H-H, Kandampully J, Juwaheer TD. Relationships and impacts of service quality, perceived value, customer satisfaction, and image: an empirical study. Service Industr J. 2009;29(2):111–125. doi:10.1080/02642060802292932
48. Han H, Lee K-S, Chua B-L, Lee S, Kim W. Role of airline food quality, price reasonableness, image, satisfaction, and attachment in building re-flying intention. Int J Hospital Manage. 2019;80:91–100. doi:10.1016/j.ijhm.2019.01.013
49. Chen CF, Chen FS. Experience quality, perceived value, satisfaction and behavioral intentions for heritage tourists. Tour Manage. 2010;31(1):29–35. doi:10.1016/j.tourman.2009.02.008
50. Zaichkowsky JL. Measuring the Involvement Construct. J Consumer Res. 1985;12(3):341. doi:10.1086/208520
51. Jeaheng Y, Han H. Thai street food in the fast growing global food tourism industry: preference and behaviors of food tourists. J Hosp Tour Manage. 2020;45:641–655. doi:10.1016/j.jhtm.2020.11.001
52. Lai WT, Chen CF. Behavioral intentions of public transit passengers-The roles of service quality, perceived value, satisfaction and involvement. Transport Policy. 2011;18(2):318–325. doi:10.1016/j.tranpol.2010.09.003
53. Chua BL, Lee S, Kim HC, Han H. Investigating the key drivers of traveler loyalty in the airport lounge setting. Asia Pacific J Tour Res. 2017;22(6):651–665. doi:10.1080/10941665.2017.1308392
54. Biswas C, Deb SK, Hasan AA-T, Khandakar SA. Mediating effect of tourists’ emotional involvement on the relationship between destination attributes and tourist satisfaction. J Hosp Tour Insights. 2021;4(4):490–510. doi:10.1108/JHTI-05-2020-0075
55. Brown G, Smith A, Assaker G. Revisiting the host city: an empirical examination of sport involvement, place attachment, event satisfaction and spectator intentions at the London Olympics. Tour Manage. 2016;55:160–172. doi:10.1016/j.tourman.2016.02.010
56. Han H, Hyun SS. Customer retention in the medical tourism industry: impact of quality, satisfaction, trust, and price reasonableness. Tour Manage. 2015b;46:20–29. doi:10.1016/j.tourman.2014.06.003
57. Kuo YF, Wu CM, Deng WJ. The relationships among service quality, perceived value, customer satisfaction, and post-purchase intention in mobile value-added services. Comput Human Behav. 2009;25(4):887–896. doi:10.1016/j.chb.2009.03.003
58. Han H, Hyun SS. Key factors maximizing art museum visitors’ satisfaction, commitment, and post-purchase intentions. Asia Pacific J Tour Res. 2017;22(8):834–849. doi:10.1080/10941665.2017.1345771
59. Han H, Back KJ, Barrett B. Influencing factors on restaurant customers’ revisit intention: the roles of emotions and switching barriers. Int J Hospital Manage. 2009;28(4):563–572. doi:10.1016/j.ijhm.2009.03.005
60. Oliver R. Whence consumer loyalty? J Market. 1999;63:33–44. doi:10.2307/1252099
61. Gallarza MG, Saura IG. Value dimensions, perceived value, satisfaction and loyalty: an investigation of university students’ travel behaviour. Tour Manage. 2006;27(3):437–452. doi:10.1016/j.tourman.2004.12.002
62. Han H, Hyun SS. Role of motivations for luxury cruise traveling, satisfaction, and involvement in building traveler loyalty. Int J Hospital Manage. 2018;70:75–84. doi:10.1016/j.ijhm.2017.10.024
63. Chen CF, Tsai MH. Perceived value, satisfaction, and loyalty of TV travel product shopping: involvement as a moderator. Tour Manage. 2008;29(6):1166–1171. doi:10.1016/j.tourman.2008.02.019
64. Hodgetts RM, Luthans F. International Management: Culture, Strategy, and Behavior. McGraw-Hill; 2018.
65. Li Y, Liu C. Impact of cultural contact on satisfaction and attachment: mediating roles of creative experiences and cultural memories. J Hosp Market Manage. 2019;1–25. doi:10.1080/19368623.2019.1611516
66. Li M. Cross-cultural tourist research: a meta-analysis. J Hosp Tour Res. 2014;38(1):40–77. doi:10.1177/1096348012442542
67. Liu RR, McClure P. Recognizing cross‐cultural differences in consumer complaint behavior and intentions: an empirical examination. J Consumer Market. 2001;18(1):54–75. doi:10.1108/07363760110365813
68. Sivadas E, Bruvold NT, Nelson MR. A reduced version of the horizontal and vertical individualism and collectivism scale: a four-country assessment. J Bus Res. 2008;61(3):201–210. doi:10.1016/j.jbusres.2007.06.016
69. Ladhari R, Pons F, Bressolles G, Zins M. Culture and personal values: how they influence perceived service quality. J Bus Res. 2011;64(9):951–957. doi:10.1016/j.jbusres.2010.11.017
70. Zhang S, Van Doorn J, Leeflang PSH. Does the importance of value, brand and relationship equity for customer loyalty differ between Eastern and Western cultures? Int Bus Rev. 2014;23(1):284–292. doi:10.1016/j.ibusrev.2013.05.002
71. Oh D, Yoo M, Lee Y. A holistic view of the service experience at coffee franchises: a cross-cultural study. Int J Hospital Manage. 2019;82:68–81. doi:10.1016/j.ijhm.2019.03.022
72. Kline RB. Principles and Practice of Structural Equation Modeling.
73. Anderson JC, Gerbing DW. Structural equation modeling in practice: a review and recommended two-step approach. Psychol Bull. 1988;103(3):411–423. doi:10.1037/0033-8309.103.3.411
74. Yoo B. Cross-group comparisons: a cautionary note. Psychol Market. 2002;19(4):357–368. doi:10.1002/mar.10014
75. Fornell C, Larcker DF. Structural equation models with unobservable variables and measurement error: algebra and statistics. J Market Res. 1981;18(3):382–388. doi:10.1177/002224378101800313
76. Hair J, Black W, Babin B, Anderson R. Multivariate Data Analysis: A Global Perspective. Upper Saddle River, NJ: Prentice Hall; 2010.
77. Harman HH. Modern Factor Analysis. University of Chicago Press; 1976.
78. Podsakoff PM, MacKenzie SB, Lee J-Y, Podsakoff NP. Common method biases in behavioral research: a critical review of the literature and recommended remedies. J Appl Psychol. 2003;88(5):879–903. doi:10.1037/0021-9010.88.5.879
79. Byrne BM. Structural Equation Modeling with AMOS: Basic Concepts, Applications, and Programming. Taylor and Francis Group Publication; 2010.
80. Brouthers LE, Werner S, Matulich E. The influence of triad nations’ environments on price-quality product strategies and MNC performance. J Int Bus Stud. 2000;31(1):39–62. doi:10.1057/palgrave.jibs.8490899
 © 2023 The Author(s). This work is published and licensed by Dove Medical Press Limited. The full terms of this license are available at https://www.dovepress.com/terms.php and incorporate the Creative Commons Attribution - Non Commercial (unported, v3.0) License.
By accessing the work you hereby accept the Terms. Non-commercial uses of the work are permitted without any further permission from Dove Medical Press Limited, provided the work is properly attributed. For permission for commercial use of this work, please see paragraphs 4.2 and 5 of our Terms.
© 2023 The Author(s). This work is published and licensed by Dove Medical Press Limited. The full terms of this license are available at https://www.dovepress.com/terms.php and incorporate the Creative Commons Attribution - Non Commercial (unported, v3.0) License.
By accessing the work you hereby accept the Terms. Non-commercial uses of the work are permitted without any further permission from Dove Medical Press Limited, provided the work is properly attributed. For permission for commercial use of this work, please see paragraphs 4.2 and 5 of our Terms.