")
Back to Journals » Medical Devices: Evidence and Research » Volume 13
Influence of Stent Flexibility on Artery Wall Stress and Wall Shear Stress in Bifurcation Lesions
Authors Saito N, Mori Y, Komatsu T
Received 11 August 2020
Accepted for publication 21 September 2020
Published 2 November 2020 Volume 2020:13 Pages 365—375
DOI https://doi.org/10.2147/MDER.S275883
Checked for plagiarism Yes
Review by Single anonymous peer review
Peer reviewer comments 2
Editor who approved publication: Dr Scott Fraser
Noboru Saito, Yuhei Mori, Tomoya Komatsu
Terumo Shonan Center, Kanagawa 259-0151, Japan
Correspondence: Noboru Saito
Terumo Shonan Center, 1500 Inokuchi, Nakai-Machi, Ashigarakami-Gun, Kanagawa 259-0151, Japan
Tel +81-465-81-4251
Fax +81-465-81-4217
Email [email protected]
Purpose: Stent flexibility can influence clinical outcome, especially in bifurcation lesions. For instance, an overly rigid stent can impose mechanical stress on the artery at the stent edges and alter both arterial geometry and blood flow dynamics in bifurcations. This study investigated the influence of stent flexibility on vessel geometry, histology, wall stress, and blood flow dynamics in arterial bifurcations.
Materials and Methods: We compared arterial angulation, stenosis, histopathology, simulated wall shear stress (WSS), and simulated blood flow velocity distribution in swine coronary artery bifurcations following placement of the less flexible Multi-link 8 or more flexible Kaname stent (4.1 ± 0.5 vs 1.5 ± 0.1 mN, p < 0.05, t-test). Stents were implanted into six coronary artery bifurcations each using the single-stent crossover technique without side branch strut dilatation. Outcomes were examined after 28 days.
Results: Implantation of both stents significantly increased site angulation (Multi-link 8: 148° ± 8° to 172° ± 2°, p < 0.05, paired t-test; Kaname: 152° ± 5° to 164° ± 4°, p < 0.05, paired t-test), but the change tended to be greater after Multi-link 8 stent implantation (24° ± 15° vs 11° ± 7°, p = 0.1, t-test), suggesting greater straightening of the bifurcation. The Multi-link 8 stent induced greater neointimal thickness than the Kaname stent (0.53 ± 0.3 mm vs 0.26 ± 0.1 mm, p < 0.05, t-test). The distribution of neointimal hyperplasia following stent implantation as revealed by longitudinal histopathology matched the distribution of WSS simulated using computational fluid dynamics (CFD). The endothelium at low WSS areas exhibited aberrant cell morphology and leukocyte adhesion. A CFD model of a curved bifurcation suggested that the region of low WSS is expanded by artery straightening.
Conclusion: In bifurcated lesions, stent flexibility influences not only mechanical stress on the artery but also WSS, which may induce local neointimal hyperplasia.
Keywords: bifurcation, stent flexibility, wall shear stress, neointimal hyperplasia
Introduction
During the 1990s, the restenosis rate following balloon angioplasty decreased from roughly 30–50% to 20–30% with the development of stents that prevent elastic recoil of the stenotic artery following balloon dilatation with a metallic cage. During the 2000s, the development of drug-eluting stents (DES) that prevent intima hyperplasia caused by the proliferation of smooth muscle cells further reduced the restenosis rate.1,2 However, the restenosis rate of bifurcation lesions remains high despite the development of several specialized stenting techniques.3–5 This high restenosis rate in bifurcation lesions could stem from chronic inflammation due to continuous mechanical stress from the stent on the artery.6–8 Alternatively, restenosis could be caused by the delay in re-endothelialization and endothelial dysfunction due to flow disturbances and the concomitant change in wall shear stress (WSS) on endothelial cells (ECs).9 In either case, stent flexibility is likely a key contributing factor because a rigid stent would straighten the artery, increasing mechanical stress and the change of WSS. However, there was no significant difference in clinical outcomes at 1 year of follow-up between a metallic drug-eluting stent and a more flexible bioresorbable drug-eluting scaffold10 despite the fact that the more flexible bioresorbable scaffold was less straightened at curved arteries.11 One possible reason for the absence of a significant difference is that the superiority created by the flexibility of the bioresorbable scaffold was offset by inflammation caused by the bioresorbable scaffold.12 Another possible reason is that the superiority was not determined as the clinical outcomes in simple curved arteries.
The aim of the present study was to investigate how stent flexibility influences mechanical stress on the artery wall and WSS by implanting two stents made up of the same material but different flexibilities into a more complex geometrical artery in the bifurcated coronary arteries of swine for 28 days.
Materials and Methods
Stents and Stent Flexibility
The Multi-link 8 coronary stent (Abbott, CA, USA) has a 3-link design and the Kaname CoCr coronary stent (Terumo, Tokyo, Japan) has a 2-link design (Figure 1A and B). Flexibility was measured in 15-mm long stent segments of 3-mm inner diameter using a cantilever method (Figure 1C). First, the stent was expanded to 3-mm inner diameter using a balloon catheter and clamped with a fixture to a creep meter (Rheoner RE-3305, Yamaden, Tokyo, Japan). Next, a point on the stent 7-mm from the fixture was nudged with a plunger at 0.1 mm/s and the load and displacement were recorded. Then, the stent was rotated 90° of arc and another point 7-mm from the fixture was nudged with the plunger and the load and displacement were recorded. The stent flexibility was evaluated as the force required for a 0.5-mm displacement at 0° and 90° of arc.
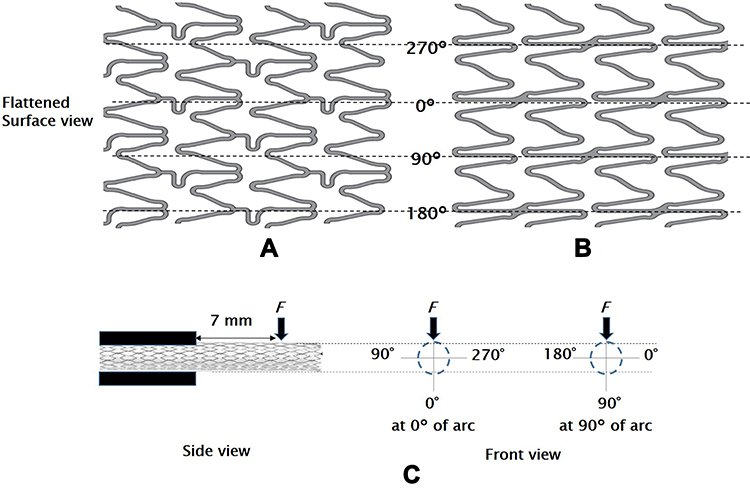 |
Figure 1 Flattened surface view of the Multi-link 8 and Kaname stents compared in this study for implantation in bifurcated artery sites and an illustration of the test method of stent flexibility. (A) The Multi-link 8 stent is made from L605 cobalt chromium with a strut thickness of 81 μm. The inner diameter is 3.0 mm and the surface consists of six crowns with a strut width ranging from 76 μm to 102 μm.31 The data used to create the flattened surface view were created by reverse engineering of the product. (B) The Kaname stent is also made from L605 cobalt chromium and has a similar strut thickness (80 μm) and inner diameter (3.0 mm). The surface consists of eight crowns with a strut width ranging from 90 μm to 100 μm. (C) Stent flexibility was evaluated as a force required for a 0.5-mm displacement when a point on the stent 7 mm from the fixture was nudged. |
Stent Implantation and Follow-Up
Six large female Yorkshire swine (approximately 35 kg) were included in this study, four (animals no. 1–4) for histopathological analysis and two (animals no. 5 and 6) for scanning electron microscopy (SEM) of the endothelium. This study was approved by the Institutional Animal Care and Use Committee of Terumo Corporation. All animals received standard care in accordance with the Institute of Laboratory Animal Resources guidelines.
Three hundred mg/day clopidogrel (Sanofi, Paris, France) and 75 mg/day aspirin (Lion, Tokyo, Japan) were administrated to each animal from 3 days before to 28 days after stent implantation. Surgical anesthesia was induced using a combination of medetomidine (Nihon Zenyaku Kougyo, Fukushima, Japan) and midazolam (Sandoz, Holzkirchen, Germany), and maintained with 2–4% sevoflurane (Pfizer, NY, USA). Vascular access was obtained via the carotid artery and 10,000 IU heparin sodium (Mochida Pharmaceutical, Tokyo, Japan) was injected via an introducer sheath. Coronary angiography was first performed using an X-ray cardiovascular diagnostic system (Infinix Celeve-i INFX-800V, Canon Medical Systems, Tochigi, Japan), and angiographic projections at least 25° apart were acquired to construct a three-dimensional (3D) vessel model. The Multi-link 8 and Kaname stents were deployed into curved bifurcations of the right coronary artery (RCA) with the left circumflex artery (LCX) or left anterior descending artery (LAD) using the single-stent crossover technique without side branch strut dilatation13 at a balloon/artery ratio of 1.05–1.25. New coronary angiographs were then acquired post-implantation for comparison. Cefazolin sodium (Astellas Pharma, Tokyo, Japan), ampicillin (Meiji Pharmaceutical, Tokyo, Japan), and buprenorphine (Otsuka Pharmaceutical, Tokyo, Japan) were administrated, and the swine returned to cages.
After 28 days, coronary angiography was reperformed for clinical outcome assessments. The animals were then administered a bolus of 10,000 IU heparin, anesthetized (as described above), and euthanized by intravenous injection of 40 mEq potassium chloride solution. In the four animals reserved for histopathological analysis, arteries containing stents were harvested and perfused sequentially with saline and 10% neutral buffered formalin. In the two reserved for SEM observation, the stented coronary arteries were fixed with 2% paraformaldehyde/1.25% glutaraldehyde in 0.1 M phosphate buffer, longitudinally halved, postfixed with 1% osmium tetroxide in 0.1 M phosphate buffer, and dehydrated in an ethanol gradient (50–98%). Samples were then soaked in t-butyl alcohol and freeze-dried.
Quantitative Coronary Analysis and Geometric Analysis
Minimal lumen diameter (MLD) and reference vessel diameter (RVD) were determined from the angiograms taken immediately after stent implantation (day 0) and 28 days later using a quantitative coronary analysis software, CAAS (Pie Medical Imaging, Maastricht, The Netherlands). The percent diameter stenosis (%DS) was calculated as %DS=(1-MLDday28/MLDday0) × 100.
The degree of artery angulation across the stent, defined as the angle between the proximal and distal artery segment, the proximal edge angle, defined as the angle between the proximal artery segment and the stented segment, and the side branch angle, defined as the angle between the daughter artery and the side branch (Figure 2), were measured on systolic images before and after stenting using WinROOF image analysis software (Mitani, Fukui, Japan).
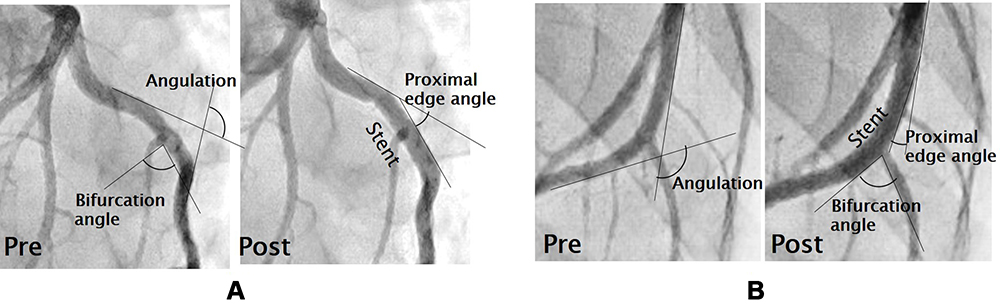 |
Figure 2 Changes in bifurcation geometry following stent implantation. (A) Angiographic images of the artery before (left) and after (right) implantation of the Multi-link 8 stent. (B) Angiographic images of the artery before (left) and after (right) implantation of the Kaname stent. The degree of artery angulation is defined as the angle between the proximal artery segment and the distal artery segment. The proximal edge angle is the angle between the proximal artery segment and the stented artery segment, and the side branch angle is the angle between the daughter artery and the side branch. The change in angulation was numerically greater in the Multi-link 8 implantation group, while other metrics showed no consistent group differences (see Table 1). |
Histopathological Analysis and SEM Observation
For histopathological analysis, stented coronary arteries in animals no. 1–4 were embedded in agar low viscosity resin (Agar Scientific, Essex, UK) and sectioned longitudinally at 4 µm thickness using a rotary microtome with a tungsten knife, RM2255 (Leica Microsystems, Wetzlar, Germany). The sections were stained with hematoxylin/eosin and elastic-tissue Masson’s (Elastica) trichrome, and observed under light microscopy. In SEM, the longitudinally halved arteries from animal no. 5 and 6 were coated with platium using an automated sputter coater (JUC-5000, JEOL, Tokyo Japan). The neointimal thickness at the stent strut on the longitudinal halved arteries and the morphology of the endothelial cells observed with SEM were analyzed as the cell shape index (Y long axis divided by X short axis)14 using the image processing program (ImageJ, National Institutes of Health, MD, USA).
Statistical Analysis
Data are presented as mean ± standard error of the mean (S.E.). The data were compared between measurement times (pre- and post-stenting) and stent groups by paired and independent samples t-test, and the data for neointimal thickness (at proximal, middle, and distal sites) were compared by Tukey’s test, as appropriate using EXSUS version 8.1 (CAC Croit, Tokyo, Japan) and SAS System Software Version 9.4 (SAS Institute, NC, USA). A P < 0.05 (two-tailed) was considered significant for all tests.
Computational Fluid Dynamics (CFD) for Bifurcated Arteries
Anatomical vessel models were constructed from the two-dimensional X-ray angiographic projections using 3D QAngio XA analytical software (Medis medical imaging systems, Leiden, The Netherlands).15 The inlets and outlets were extended to 50 mm in order to minimize the effect of entrance and exit boundary conditions on flow patterns in the actual anatomical domain of interest. Surface and volume meshes for the anatomical vessel models consisting of seven prism boundary layers (total height = 0.15 mm, growth rate = 1.2) and polyhedral cells (representative length = 0.3 mm) were generated using the automatic mesh generation module of Star CCM+ Ver.14.02.012 (Siemens PLM Software, TX, USA).
Assuming that blood is an incompressible Newtonian fluid, the Reynolds-averaged Navier–Stokes equations were solved for viscosity = 0.004 Pa·s and density = 1060 kg/m3 under the following boundary conditions: steady flow rates at the RCA inlet of 0.236 L/min, at the LAD of 0.193 L/min, and at the LCX of 0.104 L/min, relative pressure at the outlets of 0 mmHg, and no-slip at the wall.16,17 The convergence criterion was satisfied when the residual of continuity was less than 10−4.
Bifurcation Models and CFD
First, a curved non-stented bifurcation model subjected to Murray’s law (mother vessel radius of 3.0 mm, daughter vessel radius of 2.4 mm, and the side branch radius of 2.0 mm) was designed using CAD software. Then, the curved mother vessel was straightened and the bifurcation angle reduced substantially to simulate the worst-case geometric change induced by stenting. Both CAD models were imported, meshed in STAR CCM+, and the Reynolds-averaged Navier–Stokes equations were solved for viscosity = 0.004 Pa·s and density = 1060 kg/m3 under boundary conditions of steady flow at the inlet = 0.05 L/min, relative pressure at the outlets = 0 mmHg, and no-slip at the wall. The convergence criterion was satisfied when the residual of continuity was less than 10−4. The regions of low WSS (<1.0 Pa) were identified18 and the areas were calculated.
Results
Stent Flexibility
Stent flexibility was evaluated as the force required to bend a 7 mm-length segment a given distance in both orthogonal directions. These measures revealed that the Multi-link 8 stent was significantly less flexible than the Kaname stent (force at 0°: 3.8 ± 0.6 vs 1.8 ± 0.1 mN; force at 90°: 4.3 ± 0.5 vs 1.3 ± 0.1 mN; averaged force: 4.1 ± 0.5 vs 1.5 ± 0.1 mN; all p < 0.05, t-test). Further, in the Kaname stent, there was a significant difference between the force at 0° and force at 90° (p < 0.05, paired t-test).
Stent Implantation and Changes in Bifurcation Geometry
Multi-link 8 and Kaname stents were implanted into bifurcated artery sites with equivalent mean vessel diameter (2.5 ± 0.2 mm) and artery angulation (148° ± 8° and 152° ± 5°, respectively, P = 0.63, t-test). The geometric angles of the bifurcated arteries before and after stenting are listed in Table 1. Upon stent implantation, angulation was increased significantly (the bifurcation straightened) at all sites (Multi-link 8 implantation sites: 148° ± 8° to 172° ± 2°; Kaname implantation sites: 152° ± 5° to 163° ± 4°; both changes p <0.05, paired t-test) (Figure 2) but the change was numerically greater at sites implanted with the less flexible Multi-link 8 stent (24° ± 6° vs 11° ± 3°, p = 0.1, t-test). The proximal edge angle was increased in 4 of 6 bifurcation sites implanted with the Multi-link 8 stent and in 5 of 6 implanted with the Kaname stent, but there was no significant mean difference pre- vs post-stenting or between stent groups. Similarly, there was no significant change in bifurcation angle after stenting in either group or a difference between groups (summarized in Table 1).
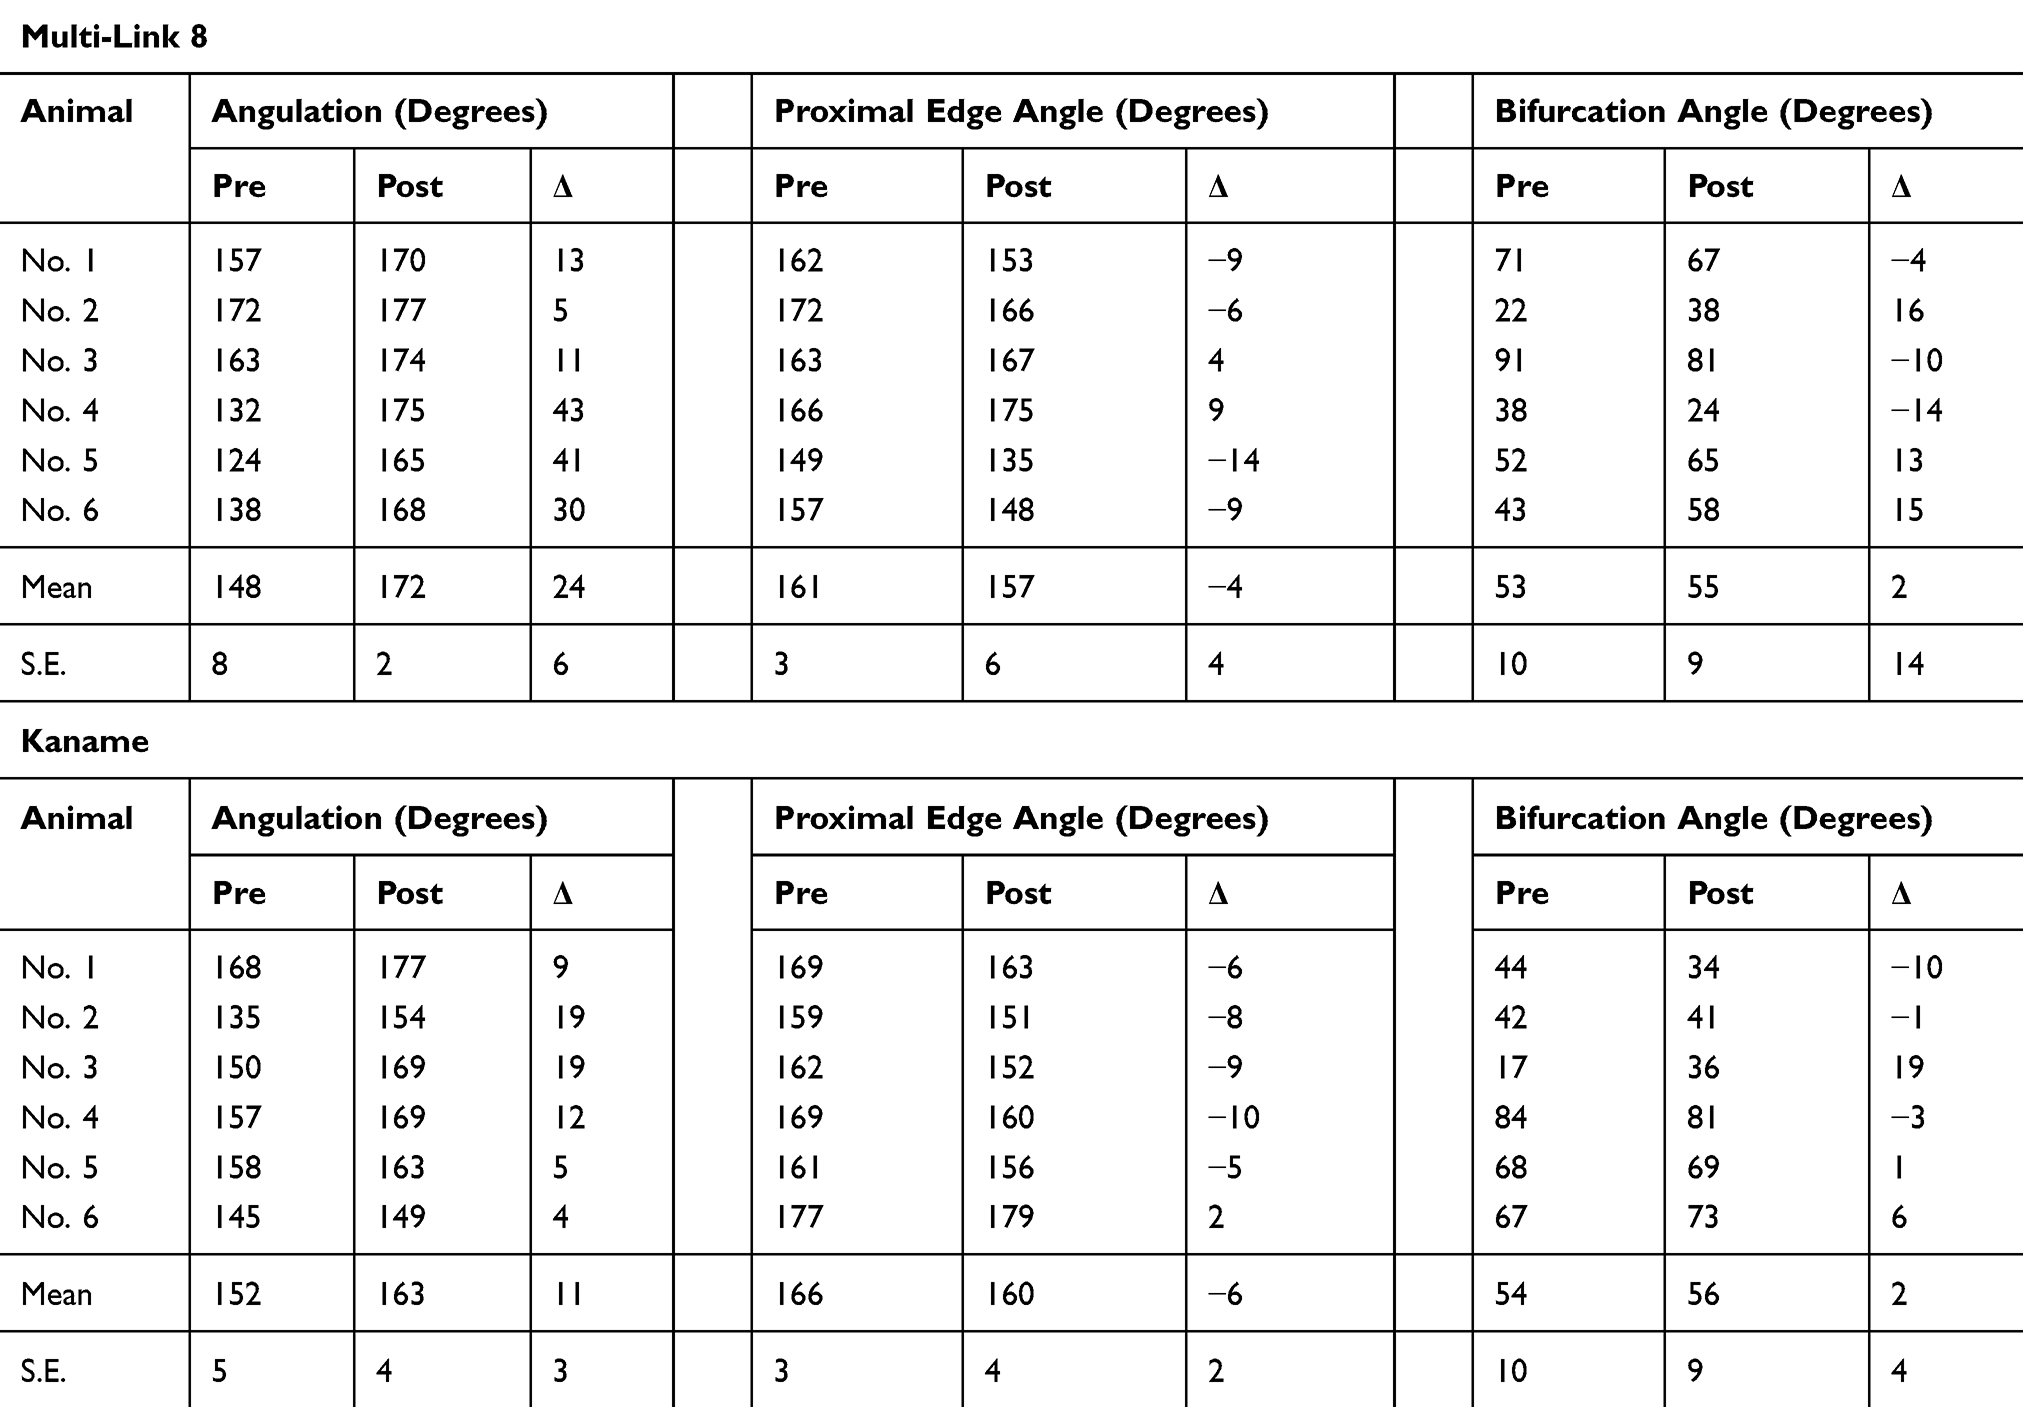 |
Table 1 Geometric Angles of the Bifurcated Arteries Before and After Stenting |
Neointimal Hyperplasia
The percent diameter stenosis 28 days after stent placement, determined based on MLD and RVD measured from angiograms, was numerically greater in the Multi-link 8 stent group compared to the Kaname group (23% ± 6% vs 14% ± 4%, p = 0.23, t-test).
Longitudinal histopathological images of the stented arteries are shown in Figure 3. In the Multi-link 8 stent group (Figure 3A), the neointimal thickness was greater at the distal stent edge (0.78 ± 0.17 mm at the distal edge, 0.51 ± 0.10 mm at the middle, and 0.38 ± 0.06 mm at the proximal edge, p < 0.05, Tukey’s test) and at the distal region opposite side branches (eg, the maximum neointimal thickness: 0.69 mm at the opposite side branch and 0.19 mm at the side branch side in animal no.2), with disruption of the internal elastic lamina (IEL) at all these sites except for the sample from animal no. 4. Moreover, the distal-end struts of the stent disrupted the IEL and strongly depressed the external elastic lamina outward, accompanied by chronic local inflammation of the adventitia (Figure 3C), while the middle struts of the stent did not strongly depress the vessel wall. In contrast, thin uniform neointimal hyperplasia (average neointimal thickness: 0.26 ± 0.01 mm for Kaname and 0.53 ± 0.03 mm for Multi-link 8, p < 0.05, t-test) distributed circumferentially without disruption of the IEL was observed at sites implanted with Kaname stents (Figure 3B) except for the sample from animal no. 4, in which eccentric neointimal hyperplasia was observed at the distal stent edge.
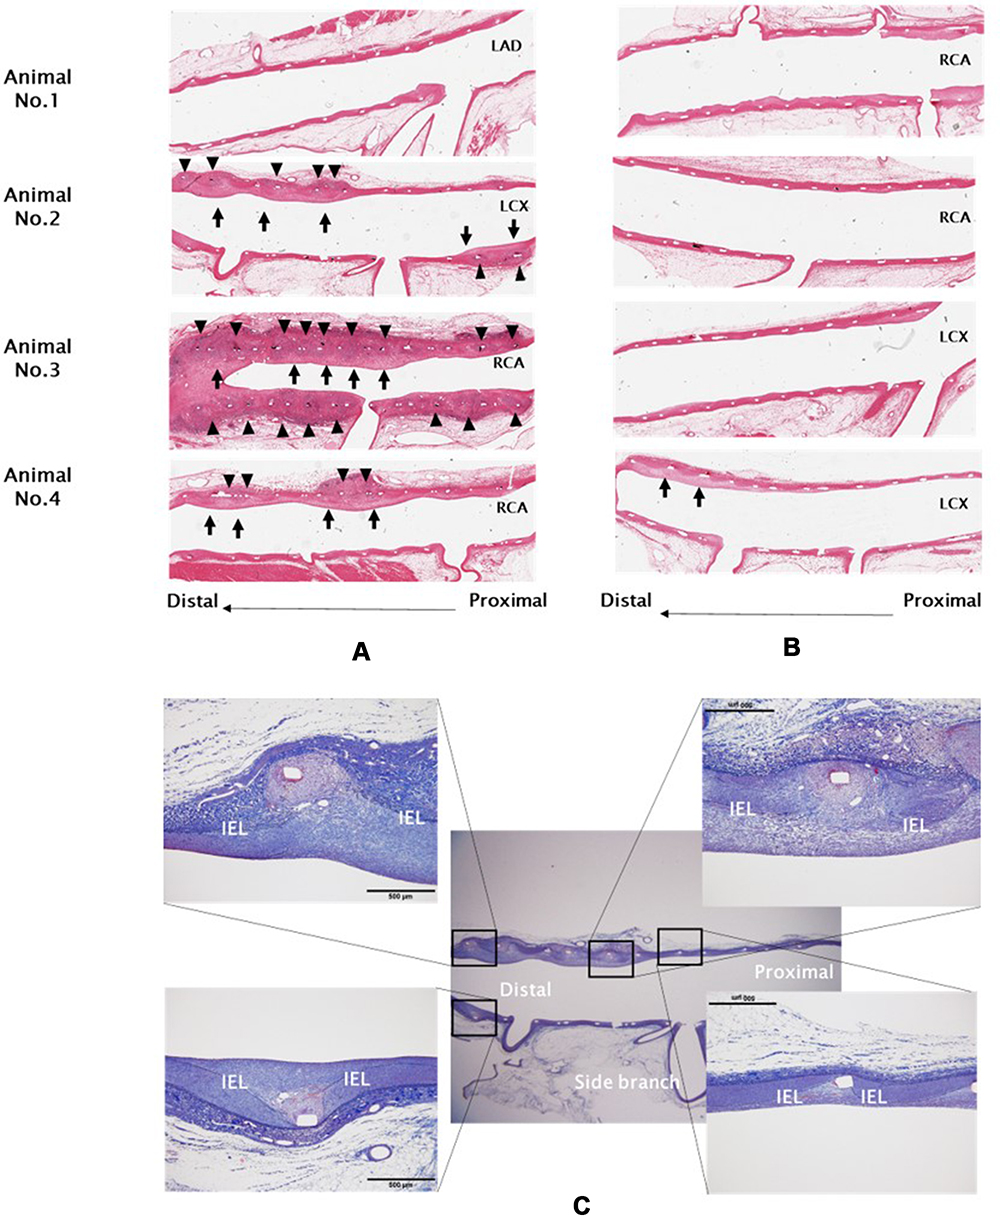 |
Figure 3 Histological abnormalities at artery bifurcations following stent placement. Shown are longitudinal hematoxylin-eosin (HE)-stained sections (×12.5) of bifurcation artery sites implanted with the Multi-link8 stent (A) or the Kaname stent (B) for 28 days. Adventitia inflammation and internal elastic lamina (IEL) injury (▲) and neointima hyperplasia (↑) were observed mainly at distal sites opposite side branches. Lower images (C) Elastica trichrome staining (×12.5 and ×100) of the bifurcation artery site from animal No. 2 implanted with the Multi-link 8 stent for 28 days. |
Representative SEM images of the longitudinally halved artery from animal no. 5 implanted with the Multi-link 8 stent are shown in Figure 4. The luminal surface of the stented artery was completely covered with ECs; however, ECs at the distal region opposite the side branches were an abnormal cobblestone-like shape (cell shape index: 1.6 ± 0.1), while ECs around the side branch were the typical spindle shaped (cell shape index: 2.7 ± 0.4, p < 0.05, t-test).
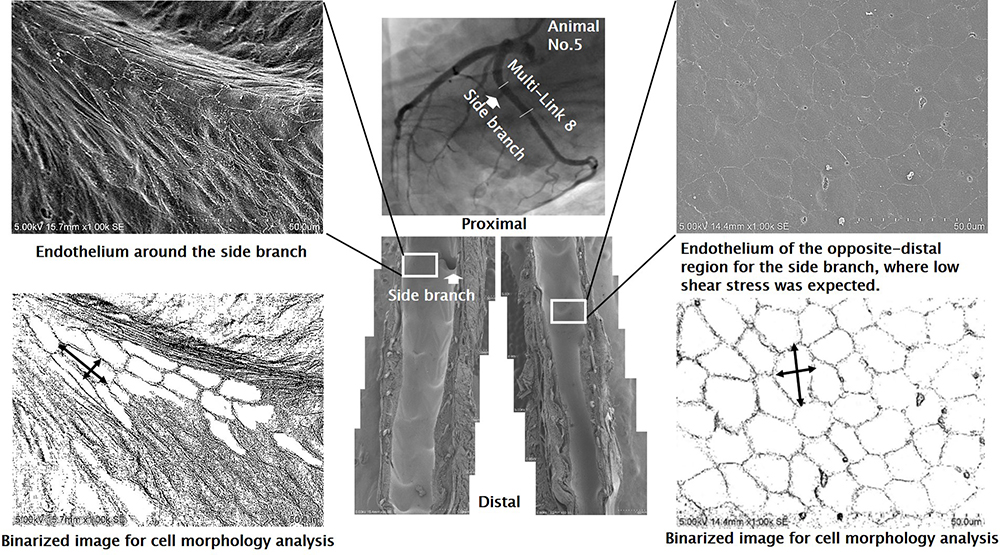 |
Figure 4 Scanning electron microscopy (SEM) images of the endothelium at bifurcating artery sites implanted with the Multi-ink 8 stent and their binarized images showing distinct cell morphology according to the level of wall shear stress. Endothelial cells at the distal region opposite side branches were round or cobblestone in shape with adherent leukocytes. The binarized images were obtained by the binarization of original images, and the cell shape index (Y long axis divided by X short axis) was analyzed using the image processing program ImageJ. |
Hemodynamics in Bifurcated Arteries
The 3-D WSS distribution in bifurcation arteries from animal no. 4 implanted with a Multi-link 8 or Kaname stent are presented in Figure 5 together with the corresponding angiograms and longitudinal histopathological images. At both bifurcation sites, low WSS regions were observed in the inner curve and the stented segment, and lower WSS areas were observed in the distal region opposite the side branch overlapping with the region of neointimal hyperplasia.
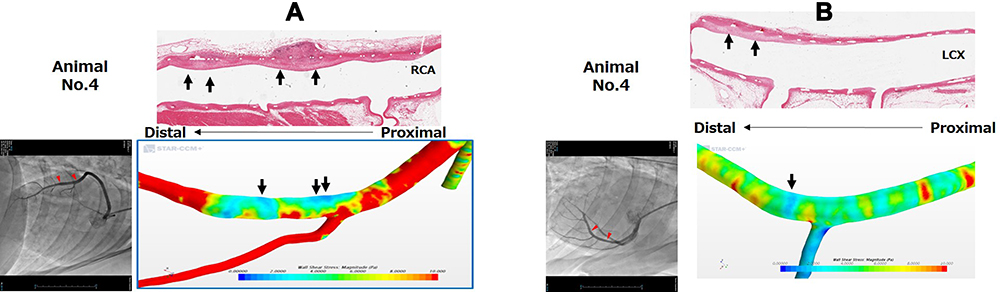 |
Figure 5 Representative 3-D wall shear stress distribution in bifurcation artery sites implanted with the Multi-link8 stent (A) or Kaname stent (B) on day 0 and corresponding longitudinal histopathological and angiographic images on day 28. In both stent groups, the distribution of neointima hyperplasia (arrows) matched regions of low wall shear stress (blue areas) simulated by computational fluid dynamics (CFD). |
The 2-D blood velocity contours with velocity vector plots and low WSS area for the non-stent and stented bifurcation models are shown in Figure 6. High-velocity blood flow in the curved bifurcation was shifted by stenting from the center of the main vessel toward the outer curve, thereby increasing both side branch blood velocity (from 0.2153 m/s to 0.2228 m/s; 3.5% increase) and side branch blood flow (from 1.5557 × 10⁻⁴ kg/s to 1.5944 × 10⁻⁴ kg/s; 2.5% increase). Consequently, blood flow near the inner curve of the main vessel was reduced and the region of low WSS (<1.0 Pa) was expanded (from 0.3033 mm2 to 0.3960 mm2; 30% increase), from the proximal-edge of the stent toward the distal edge (longitudinal length of the low WSS area: 8.6 mm for the non-stented model and 11.8 mm for the stented model; 37% increase), with the generation of neither vortex flow nor inverted flow.
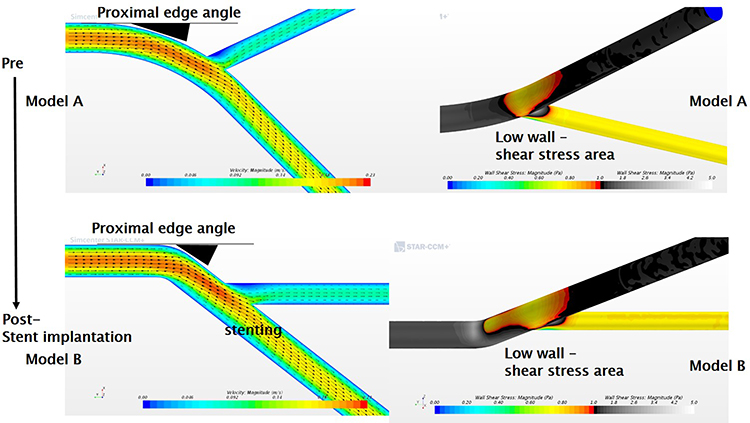 |
Figure 6 Changes in flow velocity vector contours and low WSS areas at a bifurcating artery following stent placement. Left upper panel: The 2-D velocity contours for the curved bifurcation model (subject to Murray’s law) in the non-stented condition (Model A). Left lower panel: Worse-case stent placement model (Model B) created by extreme straightening (reduced bifurcation angle). The high-velocity blood flow in the curved bifurcation is further shifted toward the outer curve in Model B, and the blood flow near the inner curve is decreased with the generation of neither vortex flow nor inverted flow (left panels). The low WSS (<1.0 Pa) region is expanded by stenting (right panels). |
Discussion
It is known that angulation at the stent edge segment can promote edge restenosis. It has been suggested that this arises from mechanical injury and chronic local inflammation at the stent edge induced by hinge motion between stented and unstented segments of the vessel with every heart contraction.8 It has also been suggested that straightening of a curved artery upon stenting changes the WSS distribution at the stent edge, leading to endothelial dysfunction and edge restenosis.19 Moreover, finite element analysis of a curved bifurcation model suggested that the straightening effect is attenuated by making the stent more flexible, thereby reducing the mechanical stress to the artery, in particular at the distal end of the stent and the side branch ostium.20
In this study, stent flexibility was evaluated as the force required to bend a 7-mm stent segment a given distance. This segment length encompassed five bands connected by links in the Multi-link 8 stent and six bands connected by links in the Kaname stent. Both stents are made of the same material (cobalt chromium) and have a similar strut thickness (~80 μm), but the Kaname stent has a 2-link design while the Multi-link 8 stent has a 3-link design, which may account for the difference in flexibility. A segment composed of two bands connected by two links positioned 180° of arc apart would be flexible at positions 90° of arc to the links but less flexible at 0° and 180° of arc to the links. On the other hand, a segment composed of two bands connected by three links positioned 120° of arc apart would be less flexible regardless of position. In general, therefore, stents with 2-link systems are designed not to align links longitudinally in a straight line (eg, helically) to attenuate radial anisotropy of flexibility, while stents with three links are designed to introduce bendable parts into the link (eg, for S- or N- or W-shapes) for improved flexibility.21 Although the Kaname stent has a 2-link system in which the links look aligned longitudinally in a straight line, flexibility is less radially anisotropic than expected, possibly because the links connecting adjacent bands are helically positioned in the stent (Figure 1B).
In this study, these two stents of identical composition and similar geometry but differing in flexibility were implanted at curved bifurcations of swine coronary artery. Both stents increased angulation, but the extent of straightening was greater using the Multi-link 8 stent (although the difference between groups did not reach significance). In addition, changes to the proximal edge angle were also observed.
Gomez-Lara et al also reported that implantation of the Multi-link 8 stent at curved coronary artery sites in humans significantly altered the angulation from 38.1° to 28.8° (relative change: 25.4%, p < 0.01), whereas a more flexible bioresorbable scaffold (BVS) induced a much smaller change from 29.6° to 25.6° (relative change: 13.4%, p < 0.01).11,22 This result supports our hypothesis that stent flexibility influences mechanical stress to the artery wall. Further, this stress as calculated by a finite element analysis was concentrated at the outer stent edges when implanted at a curved vessel site.19
The difference in vessel angulation stemming from stent flexibility also influenced WSS. Wentzel et al reported WSS changes at both stent edges upon implantation and suggested that these changes may explain the asymmetric pattern of in-stent restenosis.23 Indeed, the asymmetric neointimal hyperplasia overlapped with the low WSS areas in our artery model (Figure 5). However, asymmetric neointimal hyperplasia and low WSS areas were observed not only at stent edges but also in the distal region opposite side branches. Moore et al also concluded that a branched artery influences the flow patterns in the main vessel and that the region of low WSS develops on the wall opposite the side branch.24 Moreover, Nakazawa et al reported that neointimal thickness was greater opposite the bifurcation side compared to the flow diverter side in stented coronary bifurcations of patients with severe coronary artery disease.9
In this study, neointimal hyperplasia was observed mostly at stent edges and at distal wall regions opposing side branches. The neointimal hyperplasia at stent edges could be due to mechanical stress from stent expansion on every heart contraction because IEL injury and chronic local inflammation of the adventitia were also observed at these sites (Figure 3). This assumption is also supported by the less severe neointimal hyperplasia at the edges of the more flexible Kaname stents. On the other hand, the neointimal hyperplasia at the distal region opposite side branches could be due to low WSS induced by the stent implantation as evidence by the overlapping distribution. Moreover, the endothelium of this distal region opposing side branches (where lower WSS is expected) exhibited leukocyte adhesion and aberrant EC morphology, suggesting endothelial dysfunction and enhanced risk of neointimal hyperplasia, whereas the ECs around the side branch showed a more typical spindle-shape morphology.25
Rouleau et al reported the dependence of endothelial cell morphology on spatial WSS gradients,26 and Fry demonstrated that low shear stress causes endothelial barrier dysfunction, which leads to an increase of endothelial permeability, development of intimal edema, and loss of intimal matrix material; consequently, a preatheromatous architecture was constructed in the artery of the low WSS area.27 These studies also support our assumption that neointimal hyperplasia at the distal region opposite side branches could be due to low WSS. However, the reason for the less severe neointimal hyperplasia distal to the Kaname stents and opposite the side branch is still unclear.
To better understand the effects of stent flexibility on hemodynamics in bifurcated artery visually, we created a bifurcation model and simulated the WSS distribution using CFD analysis under control conditions and when the proximal edge angle was increased as by an inflexible stent. The simple extreme model indicated that a dramatic increase in the proximal edge angle expands the low WSS area distal and opposite to the branch with the generation of neither vortex flow nor inverted flow, the same region showing neointimal hyperplasia in our animal experiments (Figure 6). Based on this simulation, we suggest that stent flexibility influences the distribution of WSS and consequently areas of endothelial dysfunction and ensuing neointimal hyperplasia. It is also possible that the stent design influences WSS and neointimal hyperplasia,28 although there are reports that some stent designs (eg, with reduced strut number and thickness) are less likely to alter WSS distribution and induce local neointimal hyperplasia.29,30 However, the two stents compared in this study have similar strut thickness and width (Figure 1).31 Therefore, we suggest that neointimal hyperplasia observed at the distal region opposite a side branch is due to expansion of the low WSS area induced by stenting and that this expansion is exacerbated by stents with low flexibility. To the best of our knowledge, this is the first report that stent flexibility influences the distribution of WSS and neointimal hyperplasia around a bifurcated artery.
In conclusion, stent flexibility influences not only mechanical stress on the artery wall, especially in the stent end, but also WSS, which in turn can cause endothelial dysfunction, neointimal hyperplasia, and ensuing restenosis. This conclusion is supported by sub-analysis of bifurcation lesions in the CENTURY II trial showing greater freedom from target lesion failure (TLF) among patients implanted with the Ultimaster DES (the Kaname stent platform was used) compared to patients implanted with the Xience DES (the Multi-link 8 stent platform was used) (94.7% vs 91.9% at 1 year, p for non-inferiority 0.031)32 whereas, in the overall cohort (all lesions), freedom from TLF was similar in the Ultimaster and Xience arms (95.6% vs 95.1% at 9 months, p for non-inferiority <0.0001).33
Study Limitations
First, the sample size was small, so further animal studies are required to confirm the relationship between stent flexibility and neointimal hyperplasia in bifurcated artery sites with statistical significance. Second, our SEM findings of aberrant EC morphology and leukocyte adherence suggest that the endothelium distal to the stent and opposite to a side branch is dysfunctional, but we did not actually assess endothelial integrity (eg, by examining permeability to Evans blue dye). Third, the CFD simulation was performed as a steady flow and WSS was used as a hemodynamic parameter, but there are studies reporting that neointimal hyperplasia is not associated with WSS34 or is associated with oscillatory shear index.35,36 However, in a systematic review,37 nine of eleven reports visually comparing maps of hemodynamic parameters and hyperplasia supported the low WSS (steady flow) theory, suggesting that CFD simulation was appropriate. Lastly, any effects on the side branch geometrically changed by straightening the mother artery with stenting in bifurcations were not investigated in this study.
Nonetheless, more in-depth studies are needed to understand the complex relationships between hemodynamic parameters and hyperplasia in bifurcation lesions.
Acknowledgments
The authors would like to thank Atsushi Isobe for help obtaining the longitudinal histopathological images.
Disclosure
All authors are employees of Terumo Corporation and report no other conflicts of interest in this work.
References
1. Pleva L, Kukla P, Hlinomaz O. Treatment of coronary in-stent restenosis: a systematic review. J Geriatr Cardiol. 2018;15:173–184.
2. Kokkinidis DG, Waldo SW, Armstrong EJ. Treatment of coronary artery in-stent restenosis. Expert Rev Cardiovasc Ther. 2017;15(3):191–202.
3. Burzotta F, Annone U, Paraggio L, et al. Clinical outcome after percutaneous coronary intervention with drug-eluting stent in bifurcation and nonbifurcation lesions: a meta-analysis of 23981 patients. Coron Artery Dis. 2020;31(5):438–445. doi:10.1097/MCA.0000000000000847
4. Collet C, Mizukami T, Grundeken MJ. Contemporary techniques in percutaneous coronary intervention for bifurcation lesions. Expert Rev Cardiovasc Ther. 2018;16(10):725–734. doi:10.1080/14779072.2018.1523717
5. Mishra S. Dedicated bifurcation stents - mechanistic, hardware, and technical aspects. Indian Heart J. 2016;68(6):841–850. doi:10.1016/j.ihj.2015.07.054
6. Morris PD, Iqbal J, Chiastra C, et al. Simultaneous kissing stents to treat unprotected left main stem coronary artery bifurcation disease; stent expansion, vessel injury, hemodynamics, tissue healing, restenosis, and repeat revascularization. Catheter Cardiovasc Interv. 2018;92(6):E381–E392. doi:10.1002/ccd.27640
7. Lee CH, Guan-Heng J, Ming-Yi H, et al. Effect of force-induced mechanical stress at the coronary artery bifurcation stenting: relation to in-stent restenosis. J Appl Phys. 2014;115(20):204904. doi:10.1063/1.4878956
8. Kim YG, Oh IY, Kwon YW, et al. Mechanism of edge restenosis after drug-eluting stent implantation– angulation at the edge and mechanical properties of the stent. Circ J. 2013;77(12):2928–2935. doi:10.1253/circj.CJ-12-1259
9. Nakazawa G, Yazdani SK, Finn AV, et al. Pathological findings at bifurcation lesions: the impact of flow distribution on atherosclerosis and arterial healing after stent implantation. J Am Coll Cardiol. 2010;55(16):1679–1687. doi:10.1016/j.jacc.2010.01.021
10. Ellis SG, Kereiakes DJ, Metzger DC, et al. Everolimus-eluting bioresorbable scaffolds for coronary artery disease. N Engl J Med. 2015;373(20):1905–1915. doi:10.1056/NEJMoa1509038
11. Gomez-Lara J, Garcia-Garcia HM, Onuma Y, et al. A comparison of the conformability of everolimus-eluting bioresorbable vascular scaffolds to metal platform coronary stents. JACC Cardiovasc Interv. 2010;3(11):1190–1198. doi:10.1016/j.jcin.2010.07.016
12. Rampat R, Williams T, Mayo T, et al. Association between inflammatory biomarkers and neointimal response following elective implantation of the ABSORB bioresorbable vascular scaffold. Coron Artery Dis. 2019;30(3):183–187. doi:10.1097/MCA.0000000000000699
13. Tanaka A, Jabbour RJ, Kawamoto H, et al. Preliminary report of clinical outcomes after single crossover bioresorbable scaffold implantation without routine side branch strut dilation. Catheter Cardiovasc Interv. 2016;88(6):865–870. doi:10.1002/ccd.26586
14. Mori H, Cheng Q, Lutter C, et al. Endothelial barrier protein expression in biodegradable polymer sirolimus-eluting versus durable polymer everolimus-eluting metallic stents. JACC Cardiovasc Interv. 2017;10(23):2375–2387.
15. Tu S, Koning G, Jukema W, Reiber JH. Assessment of obstruction length and optimal viewing angle from biplane X-ray angiograms. Int J Cardiovasc Imaging. 2010;26(1):5–17. doi:10.1007/s10554-009-9509-3
16. Wells RE
17. Vignon-Clementel IE, Figueroa CA, Jansen KE, Taylor CA. Outflow boundary conditions for three-dimensional simulations of non-periodic blood flow and pressure fields in deformable arteries. CMBBE. 2010;13(5):625–640.
18. He X, Ku ND. Pulsatile flow in the human left coronary artery bifurcation: average conditions. J Biomech Eng. 1996;118(1):74–82. doi:10.1115/1.2795948
19. Wu W, Wang QW, Yang ZD, et al. Stent expansion in curved vessel and their interactions: a finite element analysis. J Biomech. 2007;40(11):2580–2585. doi:10.1016/j.jbiomech.2006.11.009
20. Mortier P, Holzapfel AG, Beule DM, et al. A novel simulation strategy for stent insertion and deployment in curved coronary bifurcations: comparison of three drug-eluting stents. Ann Biomed Eng. 2009;38(1):88–99. doi:10.1007/s10439-009-9836-5
21. Mori K, Saito T. Effects of stent structure on stent flexibility measurements. Ann Biomed Eng. 2005;33(6):733–742. doi:10.1007/s10439-005-2807-6
22. Oberhauser JP, Hossainy S, Rapoza RJ. Design principles and performance of bioresorbable polymeric vascular scaffolds. EuroIntervention. 2009;5(SupplementF):F15–F22. doi:10.4244/EIJV5IFA3
23. Wentzel JJ, Whelan DM, van der Giessen W, et al. Coronary stent implantation changes 3-D vessel geometry and 3-D shear stress distribution. J Biomech. 2000;33(10):1287–1295. doi:10.1016/S0021-9290(00)00066-X
24. Moore JE, Timmins LH, LaDisa JF. Coronary artery bifurcation biomechanics and implications for interventional strategies. Catheter Cardiovasc Interv. 2010;76(6):836–843. doi:10.1002/ccd.22596
25. Richter Y, Groothuis A, Philip Seifert P, Edelman RE. Dynamic flow alterations dictate leukocyte adhesion and response to endovascular interventions. J Clin Invest. 2004;113(11):1607–1614. doi:10.1172/JCI21007
26. Rouleau L, Farcas M, Tardif JC, et al. Endothelial cell morphologic response to asymmetric stenosis hemodynamics: effects of spatial wall shear stress gradients. J Biomech Eng. 2010;132(8):081013. doi:10.1115/1.4001891
27. Fry DL. Arterial intimal-medial permeability and coevolving structural responses to defined shear-stress exposures. Am J Physiol Heart Circ Physiol. 2002;283(6):H2341–H2355. doi:10.1152/ajpheart.00219.2001
28. Kastrati A, Mehilli J, Dirschinger J, et al. Intracoronary stenting and angiographic results: strut thickness effect on restenosis outcome (ISAR-STEREO) trial. Circulation. 2001;103(23):2816–2821. doi:10.1161/01.CIR.103.23.2816
29. LaDisa JF
30. Beier S, Ormiston J, Webster M, et al. Hemodynamics in idealized stented coronary arteries: important stent design considerations. Ann Biomed Eng. 2016;44(2):315–329. doi:10.1007/s10439-015-1387-3
31. Wöhrle J, Nusser T, Hoffmann S, Kochs M. Angiographic results of the cobalt chromium vision and mini-vision stents. Can J Cardiol. 2009;25(10):581–584. doi:10.1016/S0828-282X(09)70716-0
32. Orvin K, Carrie D, Richardt G, et al. Comparison of sirolimus eluting stent with bioresorbable polymer to everolimus eluting stent with permanent polymer in bifurcation lesions: results from CENTURY II trial. Catheter Cardiovasc Interv. 2016;87(6):1092–1100. doi:10.1002/ccd.26150
33. Saito S, Valdes-Chavarri M, Richardt G, et al. CENTURY II investigators. A randomized, prospective, intercontinental evaluation of a bioresorbable polymer sirolimus-eluting coronary stent system: the CENTURY II (Clinical evaluation of new terumo drug-eluting coronary stent system in the treatment of patients with coronary artery disease) trial. Eur Heart J. 2014;35(30):2021–2031.
34. Joshi AK, Leask RL, Myers JG, et al. Intimal thickness is not associated with wall shear stress patterns in the human right coronary artery. Thromb Vasc Biol. 2004;24(12):2408–2413. doi:10.1161/01.ATV.0000147118.97474.4b
35. Yao X, Dai Z, Zhang X, et al. Carotid geometry as a predictor of in-stent neointimal hyperplasia - a computational fluid dynamics study. Circ J. 2019;83(7):1472–1479. doi:10.1253/circj.CJ-18-1152
36. Kleinstreuer C, Hyun S, Buchanan JR
37. Peiffer V, Sherwin JS, Peter D, Weinberg DP. Does low and oscillatory wall shear stress correlate spatially with early atherosclerosis? A systematic review. Cardiovasc Res. 2013;99(2):242–250. doi:10.1093/cvr/cvt044
 © 2020 The Author(s). This work is published and licensed by Dove Medical Press Limited. The full terms of this license are available at https://www.dovepress.com/terms.php and incorporate the Creative Commons Attribution - Non Commercial (unported, v3.0) License.
By accessing the work you hereby accept the Terms. Non-commercial uses of the work are permitted without any further permission from Dove Medical Press Limited, provided the work is properly attributed. For permission for commercial use of this work, please see paragraphs 4.2 and 5 of our Terms.
© 2020 The Author(s). This work is published and licensed by Dove Medical Press Limited. The full terms of this license are available at https://www.dovepress.com/terms.php and incorporate the Creative Commons Attribution - Non Commercial (unported, v3.0) License.
By accessing the work you hereby accept the Terms. Non-commercial uses of the work are permitted without any further permission from Dove Medical Press Limited, provided the work is properly attributed. For permission for commercial use of this work, please see paragraphs 4.2 and 5 of our Terms.