Back to Journals » Clinical Ophthalmology » Volume 19
Influence of Retinal Venous Pressure on Visual and Structural Outcomes in Eyes with Central Retinal Vein Occlusion Undergoing Anti-VEGF Treatment
Authors Hidasa I ![]() , Yang KB, Zhang ML, Wang BY, Zhang GQ, Gao ZY, Liu ZY, Qi P, Xie J, Wang H, Liu L
, Yang KB, Zhang ML, Wang BY, Zhang GQ, Gao ZY, Liu ZY, Qi P, Xie J, Wang H, Liu L ![]() , Zhang H
, Zhang H
Received 12 May 2025
Accepted for publication 25 July 2025
Published 1 August 2025 Volume 2025:19 Pages 2551—2563
DOI https://doi.org/10.2147/OPTH.S533016
Checked for plagiarism Yes
Review by Single anonymous peer review
Peer reviewer comments 2
Editor who approved publication: Dr Scott Fraser
Iko Hidasa,1,* Kai-Bo Yang,1,* Mo-Luan Zhang,2 Bing-Yu Wang,1 Gui-Qi Zhang,1 Zhi-Yu Gao,3 Zhi-Yu Liu,1 Peng Qi,1 Jing Xie,1 Heng Wang,1 Lei Liu,4 Han Zhang1
1Department of Ophthalmology, the First Hospital of China Medical University, Shenyang, People’s Republic of China; 2School of Medicine, Gifu University, Gifu City, Japan; 3Department of Ophthalmology, the Fourth Affiliated Hospital of China Medical University; Eye Hospital of China Medical University; Key Lens Research Laboratory of Liaoning Province, Shenyang, People’s Republic of China; 4Department of Ophthalmology, Guangdong Eye Institute; Guangdong Provincial People’s Hospital (Guangdong Academy of Medical Sciences), Southern Medical University, Guangzhou, People’s Republic of China
*These authors contributed equally to this work
Correspondence: Han Zhang, Department of Ophthalmology, the First Hospital of China Medical University, Shenyang, People’s Republic of China, Email [email protected] Lei Liu, Department of Ophthalmology, Guangdong Eye Institute; Guangdong Provincial People’s Hospital (Guangdong Academy of Medical Sciences), Southern Medical University, Guangzhou, People’s Republic of China, Email [email protected]
Purpose: This study investigates the role of retinal venous pressure (RVP) in determining visual and anatomical outcomes in eyes affected by macular edema (ME) secondary to central retinal vein occlusion (CRVO) and treated with anti-vascular endothelial growth factor (VEGF) therapy.
Methods: A retrospective observational study analyzed data from 31 eyes of 31 patients with CRVO-induced ME. RVP was quantified using an ophthalmodynamometer, and participants were divided into two cohorts: low RVP (19 eyes) and high RVP (12 eyes). Treatment involved three monthly intravitreal ranibizumab (IVR) injections, followed by a pro re nata (PRN) approach. Visual and anatomical metrics, injection frequencies, RVP levels, and diastolic central retinal artery pressure (CRAP) were monitored over 12 months.
Results: At baseline, the low RVP group demonstrated superior mean best-corrected visual acuity (BCVA) in logMAR (P = 0.017), lower central retinal thickness (CRT) (P = 0.018), and higher diastolic CRAP (P = 0.028) compared to the high RVP group. Both groups exhibited significant improvements in BCVA and CRT after 12 months of IVR therapy, with more pronounced gains in the low RVP group for BCVA (P = 0.005) and CRT (P = 0.030). RVP and diastolic CRAP improved in both groups over the study period, with the low RVP group showing greater changes in RVP (P = 0.005) and diastolic CRAP (P = 0.002). Additionally, fewer injections were required in the low RVP group compared to the high RVP group (6.3 vs 7.8, P = 0.017).
Conclusion: Eyes with CRVO-associated ME and lower RVP levels exhibit superior baseline visual function, lower CRT, and more favorable outcomes following IVR treatment. Lower RVP is also associated with a reduced injection burden, underscoring its potential as a predictive marker for therapy response.
Keywords: central retinal vein occlusion, central retinal venous pressure, macular edema, anti-vascular endothelial growth factor, ranibizumab
Introduction
Retinal vein occlusion (RVO) represents a significant cause of visual impairment in the elderly population and is second only to diabetic retinopathy as the most prevalent retinal vascular disorder. This condition is subdivided into two primary categories based on the site of vascular blockage. Central retinal vein occlusion (CRVO), one of these subtypes, occurs within the principal trunk of the central retinal vein, typically at or in proximity to the lamina cribrosa. The pathophysiology of CRVO aligns with Virchow’s triad, which encompasses endothelial injury, blood flow stasis, and a hypercoagulable state as critical contributors to thrombus formation.1 Anatomically, the central retinal vein and artery are encased in a common adventitial sheath at arteriovenous crossings posterior to the lamina cribrosa. Atherosclerotic alterations within the artery at these crossings can exert compressive forces on the adjacent vein. This vascular compression, coupled with endothelial dysfunction induced by atherosclerosis, compromises venous blood flow, promoting stasis, thrombus formation, and eventual occlusion of the central vein.
The obstruction of venous outflow in the central retinal vein leads to a marked increase in intravascular hydrostatic pressure. Ophthalmodynamometric assessments have revealed that retinal venous pressure (RVP) in eyes affected by CRVO can reach levels up to 24 times greater than those observed in healthy veins (103.6 ± 25.4 vs 4.2±7.8 arbitrary units).2 Elevated RVP following severe CRVO has been associated with significantly impaired visual acuity, diminished retinal perfusion, a heightened prevalence of rubeosis iridis, and extensive capillary nonperfusion (CNP), with the severity of these outcomes closely linked to the magnitude of RVP elevation.3 These observations underscore the potential of RVP as a critical parameter for evaluating retinal hemodynamics and forecasting visual outcomes in CRVO cases.
Macular edema (ME) remains a primary contributor to visual impairment in individuals diagnosed with CRVO. The identification of intraocular vascular endothelial growth factor (VEGF) as a key mediator in the pathogenesis of CRVO-associated ME has positioned anti-VEGF therapies as the cornerstone of treatment for this condition.4 However, the development of ME in CRVO likely involves multiple factors, including elevated RVP, cytokine upregulation, and inflammation. Responses to anti-VEGF therapy in CRVO-ME patients vary significantly between individuals, with most requiring repeated injections over several years.5,6 Personalized medicine can help identify patients who are most likely to benefit from treatment. By integrating some biomarkers, including VEGF levels, genetic variants, and imaging biomarkers, into clinical practice, clinicians may develop personalized treatment plans that optimize treatment outcomes.7 Currently, no reliable markers are available to accurately forecast the duration and frequency of anti-VEGF injections required for managing ME secondary to CRVO. As elevated RVP reflects the extent of venous outflow obstruction in CRVO, it is hypothesized that RVP may contribute to interindividual differences in therapeutic response to anti-VEGF treatment. This study aims to evaluate the influence of RVP on visual and anatomical outcomes, as well as on the injection frequency required for CRVO-ME management.
Subjects and Methods
Study Participants
This retrospective study was carried out within the Department of Ophthalmology at the First Hospital of China Medical University, Shenyang, China. The research protocol was meticulously reviewed and approved by the institution’s Ethics Committee and Institutional Review Board, ensuring strict adherence to the ethical standards established by the Declaration of Helsinki. Prior to any treatment, comprehensive written informed consent was obtained from all participants to safeguard ethical compliance and transparency.
Patients with treatment-naïve unilateral CRVO and symptom onset within one month prior to the initial evaluation were recruited for this study. Inclusion criteria comprised cases of CRVO-ME treated with intravitreal ranibizumab (IVR), presenting with a baseline best-corrected visual acuity (BCVA) of ≤ 20/40 and a central retinal thickness (CRT) of ≥ 250 μm, attributable to intraretinal fluid (IRF) or subretinal fluid (SRF) as confirmed by optical coherence tomography (OCT). All participants completed a minimum follow-up period of one year. Exclusion criteria encompassed neovascularization of the optic disc or other retinal locations, rubeosis iridis, advanced ischemic retinopathy with CNP areas exceeding 10-disc diameters identified via OCT angiography (OCTA), intraocular pressure (IOP) greater than 21 mmHg, prior intraocular surgeries, additional retinal pathologies unrelated to CRVO, media opacity that interfered with good quality of images and systemic conditions such as diabetes mellitus or uncontrolled hypertension.
At the initial evaluation, all enrolled eyes underwent a thorough ophthalmologic assessment to establish baseline parameters. This included the measurement of BCVA using a standardized Snellen chart, slit lamp biomicroscopy, IOP evaluation, and indirect ophthalmoscopy. Advanced imaging techniques were also employed, including spectral-domain OCT (SD-OCT) (Spectralis; Heidelberg Engineering, Heidelberg, Germany) and widefield swept-source OCTA (VG200; Intalight, Luoyang, China), to provide high-resolution structural and vascular assessments of the retina.
RVP Measurement
The measurement of RVP was performed at baseline and during follow-up visits using an ophthalmodynamometer (Imedos Systems UG, Jena, Germany; previously Meditron GmbH, Völklingen, Germany). This technique, thoroughly described in previous studies,8,9 utilizes a Goldmann contact lens modified with a pressure sensor encircling its outer rim. The sensor continuously monitors the pressure applied through the lens and subsequently to the eye. Following pharmacological mydriasis induced with tropicamide, the optic nerve head was examined using a slit lamp and a noncontact lens to detect any spontaneous pulsations in the central retinal vein or its branches. If such pulsations were present, RVP was assumed to equal the IOP. In the absence of pulsations, topical anesthesia was administered, and the Goldmann lens was gently placed on the corneal surface. The absence of pulsations was confirmed after observing three complete breathing cycles. Gradual pressure was then applied via the lens while continuously monitoring the optic nerve head. The appearance of pulsations in the central retinal vein or its branches was recorded as the ocular dynamic force (ODF), and RVP was calculated by summing ODF and IOP. To measure diastolic central retinal artery pressure (CRAP), additional pressure was applied until slight pulsations were observed in the central retinal artery. Diastolic CRAP was determined by adding the corresponding ODF value to the IOP. Each measurement was conducted a minimum of nine times, and the average was used for subsequent statistical analysis.
Patients were categorized into two distinct groups based on baseline RVP and diastolic CRAP measurements. Group 1, referred to as the low RVP group, consisted of individuals with RVP values lower than the diastolic CRAP, suggesting the likelihood of continuous retinal blood flow throughout the cardiac cycle. In contrast, Group 2, identified as the high RVP group, included patients whose RVP was equal to or exceeded the diastolic CRAP, indicating intermittent or restricted retinal perfusion.3,10
IVR Treatment and Follow-Up Assessment
All participants underwent a regimen of three monthly intravitreal injections, each consisting of 0.5 mg/0.05 mL of ranibizumab (Lucentis; Novartis, Pharma AG, Switzerland). These procedures were performed under sterile conditions in a dedicated operating room to minimize the risk of infection. Prior to each injection, topical anesthesia was administered to ensure patient comfort, and the conjunctival surface was thoroughly irrigated with a 5% povidone-iodine solution as an antiseptic measure. A 30-gauge needle was carefully introduced through the pars plana, allowing for the precise delivery of 0.05 mL of ranibizumab into the vitreous cavity.
Follow-up examinations occurred 1 month after the first IVR treatment, with subsequent assessments conducted monthly for a total of 12 months. Upon completion of the initial three intravitreal injections, patients were re-evaluated monthly, and additional treatments were administered as needed if OCT identified the persistence or recurrence of IRF or SRF. Each follow-up visit included a comprehensive examination comprising BCVA assessment, slit lamp biomicroscopy, IOP measurement, indirect ophthalmoscopy, ophthalmodynamometry, and detailed OCT imaging to monitor structural retinal parameters.
As this was a retrospective observational study, no blinding was applied during outcome assessment. Investigators were aware of group allocation when analyzing clinical data.
Statistical Analysis
The statistical analysis was performed using SPSS software (version 29.0.2.0; SPSS, Inc., Chicago, IL). Visual acuity measured with the Snellen chart was converted to its logarithm of the minimum angle of resolution (logMAR) equivalent for analysis. Continuous variables were summarized as means ± standard deviation or medians with ranges, as appropriate. The normality of data distribution was evaluated using histogram inspection and the Shapiro–Wilk test. For variables following a normal distribution, pairwise group comparisons were conducted using the t-test. In cases where data deviated from normality, the Mann–Whitney U-test and Wilcoxon signed-rank test were applied. Categorical variables were analyzed using Fisher’s exact test for small sample sizes and chi-square tests for larger datasets. Statistical significance was defined as a P value of less than 0.05.
Results
Baseline Characteristics
Thirty-seven eyes of 37 consecutive patients who were treated with ranibizumab for ME associated with nonischemic CRVO and followed for at least 12 months were enrolled initially. Six eyes were excluded because of diabetic retinopathy (4 eye), epiretinal membrane (1 eye), and low image quality (1 eye). Therefore, a total of 31 patients (31 eyes) with ME secondary to nonischemic CRVO were included in this study. Among these, 19 eyes were assigned to the low RVP group (Group 1), while 12 eyes comprised the high RVP group (Group 2). The mean RVP in Group 1 was 48.2 ± 8.5 mmHg, which was significantly lower compared to Group 2, where the mean RVP was 65.7 ± 6.5 mmHg (P < 0.001, Cohen’s d = 2.240). Baseline clinical characteristics and demographic data for both groups are detailed in Table 1. No statistically significant differences were observed between the groups with respect to mean age, gender distribution, symptom duration, IOP, or systolic and diastolic blood pressure measurements.
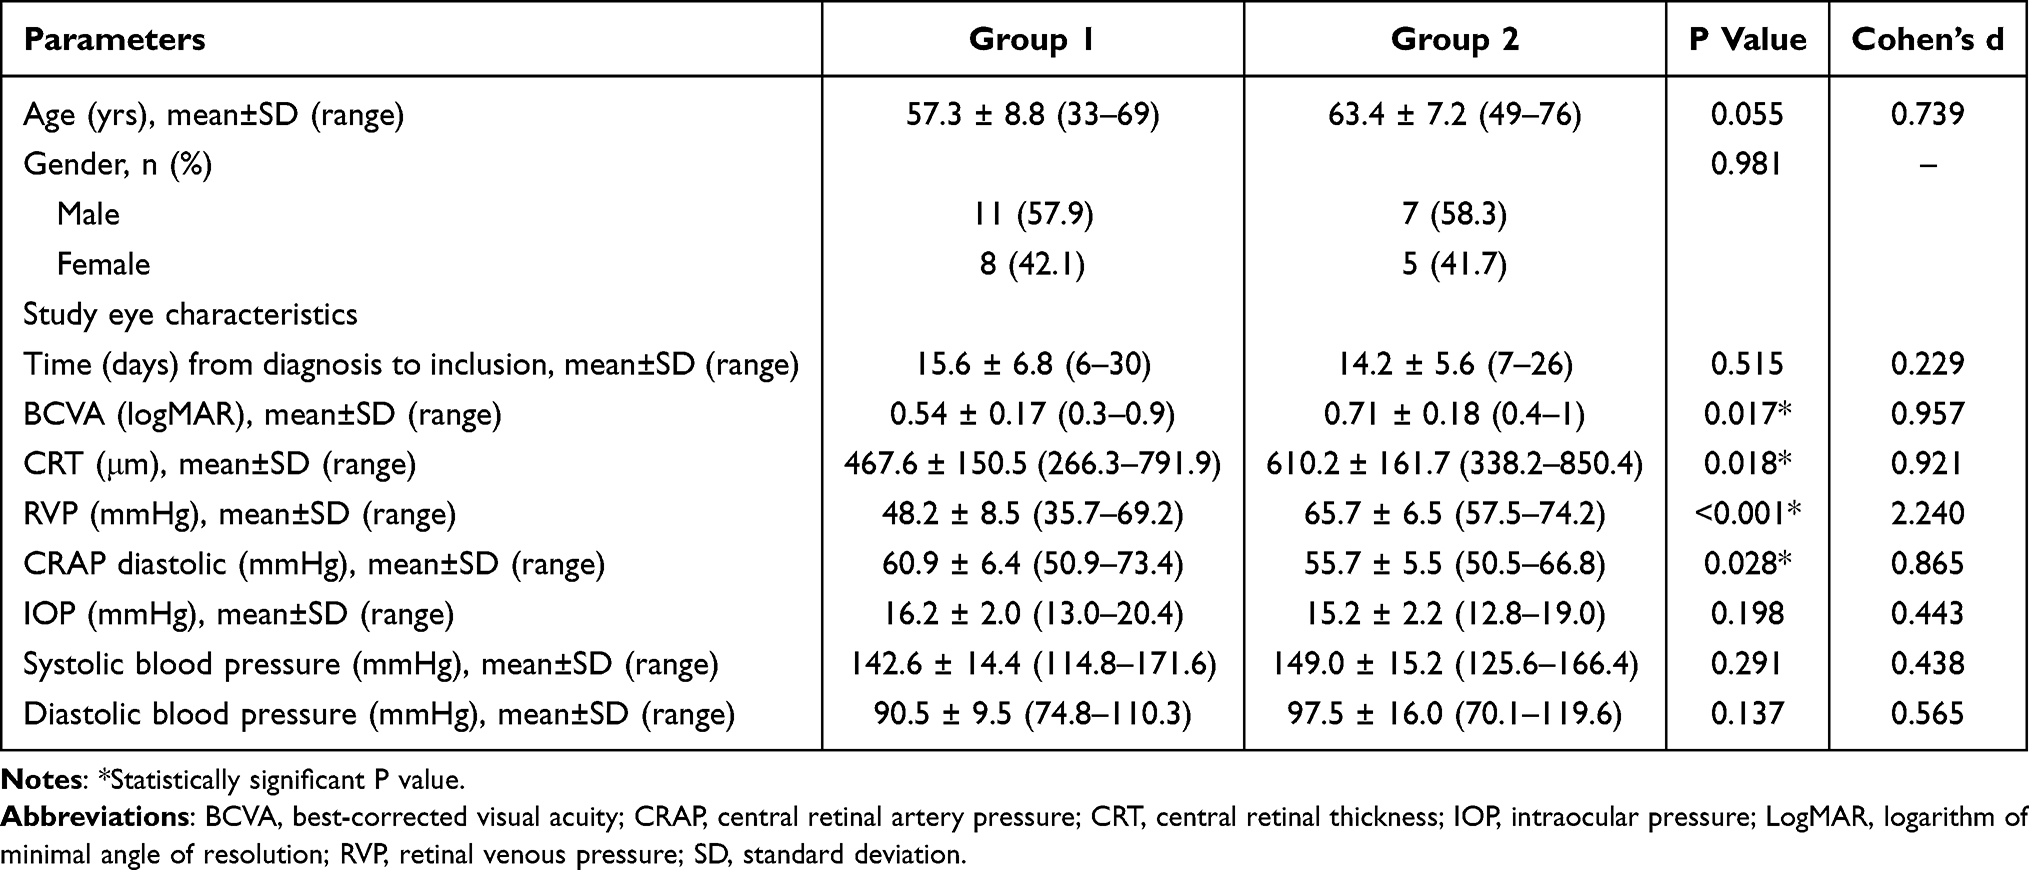 |
Table 1 Patient Demographics and Baseline Ocular Characteristics (n=31) |
At baseline, Group 1 demonstrated a significantly better mean BCVA in logMAR values compared to Group 2 (0.54 ± 0.17 vs 0.71 ± 0.18; P = 0.017, Cohen’s d = 0.957). Similarly, the mean CRT was notably lower in Group 1 than in Group 2 (467.6 ± 150.5 μm vs 610.2 ± 161.7 μm; P = 0.018, Cohen’s d = 0.921). Furthermore, the mean diastolic CRAP at baseline was significantly higher in Group 1 (60.9 ± 6.4 mmHg) compared to Group 2 (55.7 ± 5.5 mmHg; P = 0.028, Cohen’s d = 0.856).
Visual and Anatomic Outcomes
At the 1-month follow-up, the mean BCVA in logMAR significantly improved to 0.31 ± 0.22 in Group 1 (P < 0.001, Cohen’s d = 1.665) and 0.46 ± 0.22 in Group 2 (P < 0.001, Cohen’s d = 2.500). However, the difference in improvement between the two groups at this time point was not statistically significant (P = 0.073, Cohen’s d = 0.687). By the 3-month follow-up, the mean logMAR BCVA showed further improvement, reaching 0.27 ± 0.19 in Group 1 (P < 0.001, Cohen’s d = 1.845) and 0.45 ± 0.20 in Group 2 (P < 0.001, Cohen’s d = 3.258), with Group 1 demonstrating a significantly greater change compared to Group 2 (P = 0.022, Cohen’s d = 0.894). At 6 months, the mean logMAR BCVA values were 0.31 ± 0.20 in Group 1 (P < 0.001, Cohen’s d = 1.551) and 0.53 ± 0.23 in Group 2 (P < 0.001, Cohen’s d = 1.447), with Group 1 again exhibiting a significantly larger improvement (P = 0.001, Cohen’s d = 0.976). Over the course of the study, mean logMAR BCVA continued to improve, reaching 0.27 ± 0.19 in Group 1 (P < 0.001, Cohen’s d = 1.895) and 0.49 ± 0.20 in Group 2 (P < 0.001, Cohen’s d = 2.595) at the 12-month follow-up. The overall change in mean logMAR BCVA across the study duration was significantly greater in Group 1 compared to Group 2 (P = 0.005, Cohen’s d = 1.116). The progression of BCVA changes from baseline over the 12-month period is presented in Figure 1.
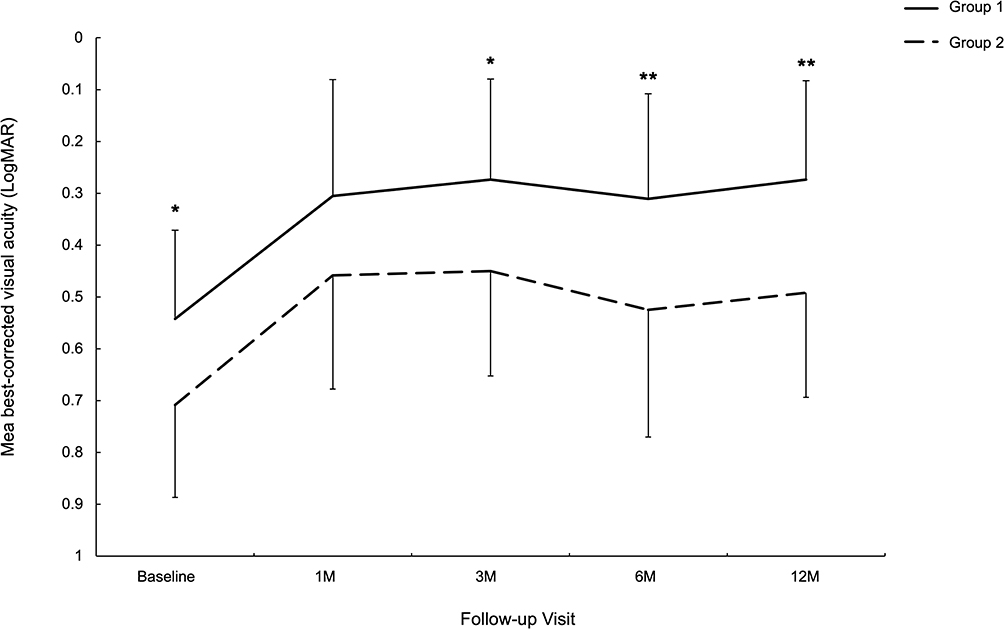 |
Figure 1 Changes in mean logMAR BCVA over 12 months after IVR treatment for ME secondary to CRVO in the low RVP group (Group 1) and the high RVP group (Group 2). Group 1 showed a significantly greater improvement in logMAR BCVA from Month 3 onward. Error bars represent standard deviation of the mean. Asterisks (* P < 0.05, ** P < 0.01) indicate time points with significant between-group differences. |
CRT showed a significant reduction following the first month of treatment, decreasing to 329.6 ± 73.1 μm in Group 1 (P < 0.001, Cohen’s d = 1.523) and 404.2 ± 114.6 μm in Group 2 (P < 0.001, Cohen’s d = 2.870). Over the course of one year, CRT continued to decrease, reaching 249.2 ± 56.8 μm in Group 1 (P < 0.001, Cohen’s d = 1.715) and 309.3 ± 90.2 μm in Group 2 (P < 0.001, Cohen’s d = 2.879) by the final follow-up. The extent of CRT improvement over the 12-month period was consistently greater in Group 1 compared to Group 2, with statistically significant differences observed at 1 month (P = 0.034, Cohen’s d = 0.819), 3 months (P = 0.031, Cohen’s d = 0.834), 6 months (P = 0.031, Cohen’s d = 0.834), and 12 months (P = 0.030, Cohen’s d = 0.842). Figure 2 illustrates the mean changes in CRT from baseline throughout the study period.
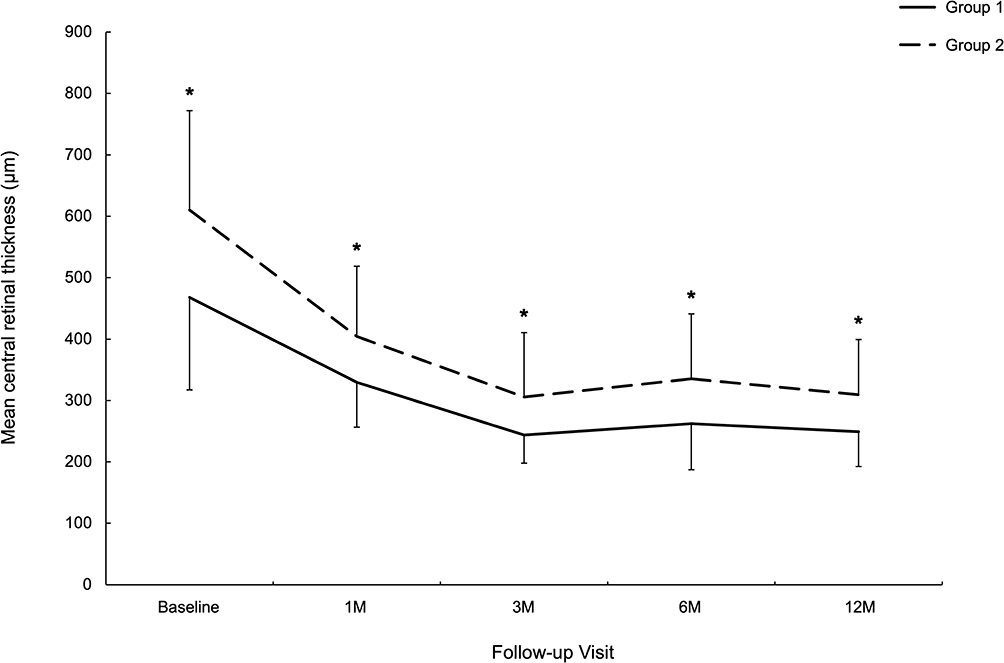 |
Figure 2 Changes in mean CRT over 12 months after IVR treatment for ME secondary to CRVO in the low RVP group (Group 1) and the high RVP group (Group 2). Error bars represent the standard deviation of the mean. Asterisks (* P < 0.05) indicate time points with significant between-group differences. |
Throughout the follow-up period, patients in Group 1 required an average of 6.3 intravitreal injections (median: 7; range: 3–9), whereas those in Group 2 received a higher average of 7.8 injections (median: 8; range: 6–9), with this difference reaching statistical significance (P = 0.017, Cohen’s d = 0.957). Notably, in Group 1, two eyes (10.5%) required only the initial series of three injections without the need for additional retreatments during the study duration. In contrast, none of the eyes in Group 2 demonstrated a similar treatment pattern.
There were no systemic or ocular complications during the 12-month anti-VEGF therapy.
RVP Change During Anti-VEGF Therapy
At the 1-month follow-up, mean RVP demonstrated a significant reduction, reaching 44.6 ± 10.8 mmHg in Group 1 (P < 0.001, Cohen’s d = 0.944) and 62.8 ± 19.1 mmHg in Group 2 (P = 0.029, Cohen’s d = 0.725). Further decreases were observed at subsequent follow-ups, with mean RVP declining to 38.8 ± 10.6 mmHg in Group 1 (P < 0.001, Cohen’s d = 1.825) and 57.2 ± 10.6 mmHg in Group 2 (P < 0.001, Cohen’s d = 1.449) at 3 months, and to 36.8 ± 11.3 mmHg in Group 1 (P < 0.001, Cohen’s d = 1.649) and 52.6 ± 12.1 mmHg in Group 2 (P < 0.001, Cohen’s d = 1.634) at 6 months. By the 12-month follow-up, the mean RVP had further decreased to 33.2 ± 11.7 mmHg in Group 1 (P < 0.001, Cohen’s d = 2.533) and 46.8 ± 12.8 mmHg in Group 2 (P < 0.001, Cohen’s d = 1.747). Across all time points, Group 1 consistently exhibited significantly lower mean RVP compared to Group 2, with statistical significance observed at 1 month (P < 0.001, Cohen’s d = 1.781), 3 months (P < 0.001, Cohen’s d = 1.724), 6 months (P = 0.001, Cohen’s d = 1.353), and 12 months (P = 0.005, Cohen’s d = 1.119). Figure 3 provides a graphical representation of the mean changes in RVP from baseline over the 12-month study period.
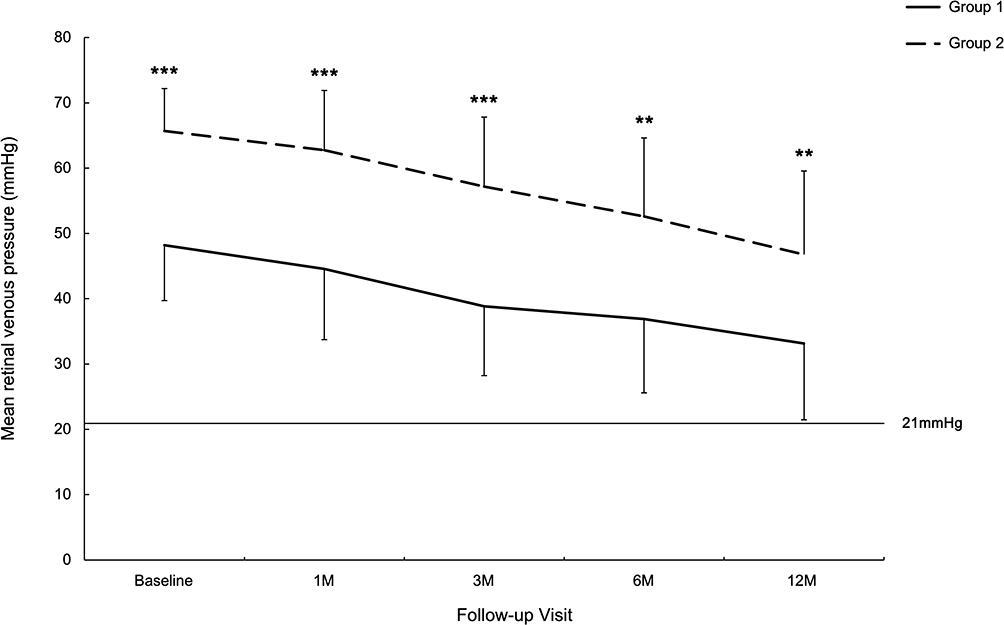 |
Figure 3 Changes in mean RVP over 12 months after IVR treatment for ME secondary to CRVO in the low RVP group (Group 1) and the high RVP group (Group 2). Error bars represent the standard deviation of the mean. Asterisks (** P < 0.01, *** P < 0.001) indicate time points with significant between-group differences. |
At baseline, no spontaneous pulsations of the central retinal vein were identified in any eyes across both groups, confirming elevated RVP in all cases. By the 3-month follow-up, spontaneous pulsations were detected in two eyes from Group 1, both of which had only received the initial three injections without requiring additional treatments throughout the 12-month study period. At the final 12-month follow-up, spontaneous pulsations of the central retinal vein were present in four eyes within Group 1 (21.1%) and in one eye within Group 2 (8.3%).
Diastolic CRAP Change During Anti-VEGF Therapy
At the 1-month and 3-month follow-ups, the mean diastolic CRAP was measured at 60.9 ± 6.5 mmHg (P = 0.116, Cohen’s d = 0.379) and 63.2 ± 6.9 mmHg (P = 0.147, Cohen’s d = 0.463) in Group 1, and at 57.2 ± 3.9 mmHg (P = 0.137, Cohen’s d = 0.348) and 57.5 ± 4.2 mmHg (P = 0.253, Cohen’s d = 0.345) in Group 2. These values showed no statistically significant differences compared to baseline in either group. By 6 months, diastolic CRAP had significantly increased to 65.7 ± 7.5 mmHg in Group 1 (P = 0.015, Cohen’s d = 0.620), while Group 2 exhibited no significant change, with a mean diastolic CRAP of 59.6 ± 5.1 mmHg (P = 0.054, Cohen’s d = 0.624). At the 12-month follow-up, the mean diastolic CRAP demonstrated further improvement, reaching 69.2 ± 8.3 mmHg in Group 1 (P = 0.003, Cohen’s d = 0.794) and 60.8 ± 5.3 mmHg in Group 2 (P = 0.003, Cohen’s d = 0.696). Across the 12-month study period, Group 1 consistently exhibited higher mean diastolic CRAP values compared to Group 2, with statistically significant differences at 1 month (P = 0.026, Cohen’s d = 0.767), 3 months (P = 0.004, Cohen’s d = 1.039), 6 months (P = 0.005, Cohen’s d = 1.036), and 12 months (P = 0.002, Cohen’s d = 1.155). Figure 4 depicts the mean changes in diastolic CRAP from baseline over the 12-month duration.
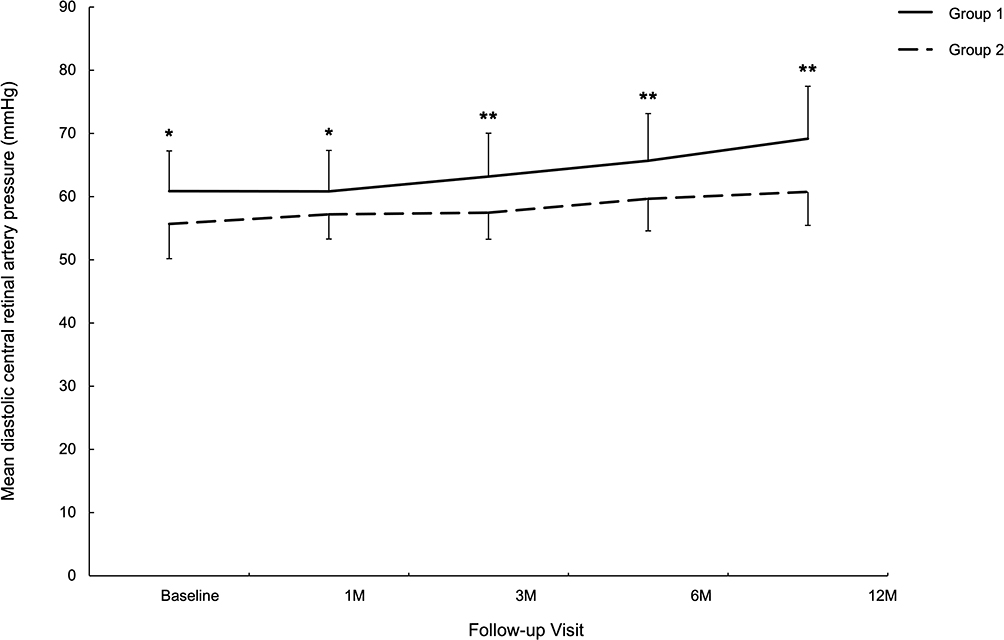 |
Figure 4 Changes in mean diastolic CRAP over 12 months after IVR treatment of ME secondary to CRVO in the low RVP group (Group 1) and the high RVP group (Group 2). Error bars represent the standard deviation of the mean. Asterisks (* P < 0.05, ** P < 0.01) indicate time points with significant between-group differences. |
Representative cases from both groups are presented in Figures 5 and 6.
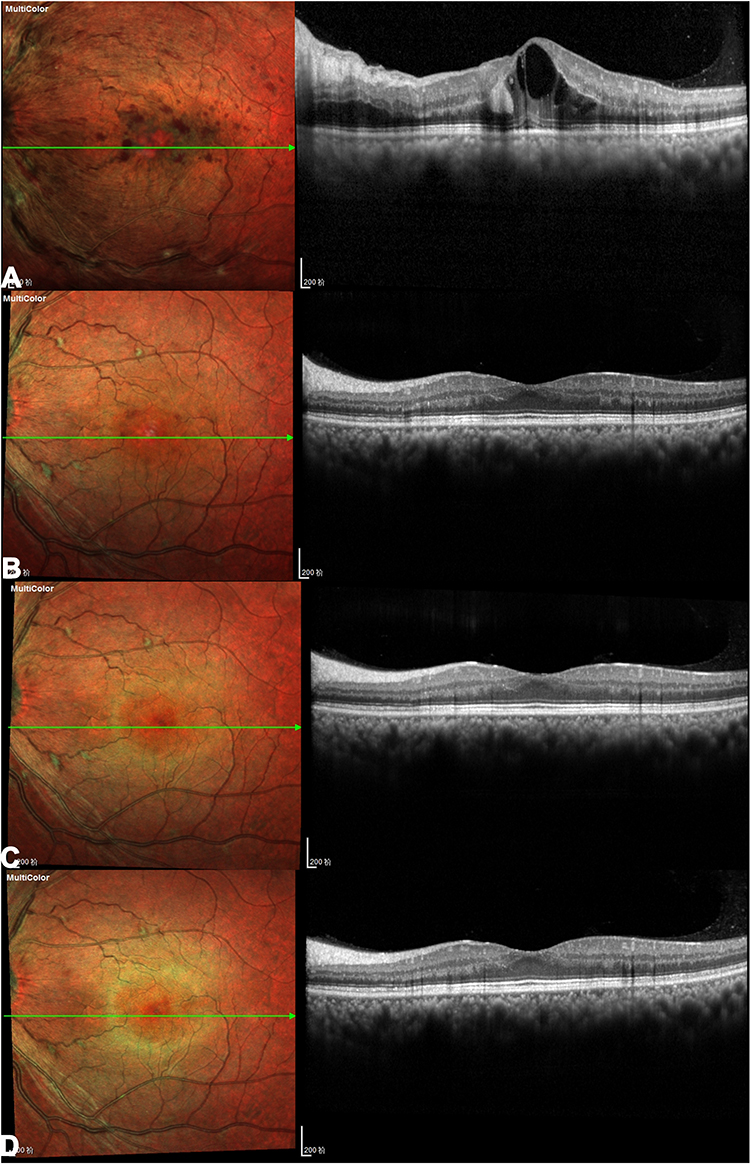 |
Figure 5 Images obtained from a 49-year-old male with CRVO in the left eye from the low RVP group (Group 1). At baseline, the patient’s BCVA was 20/63, CRT was 568 μm, RVP was 39.1 mmHg and diastolic CRAP was 65.4 mmHg. OCT image demonstrated intraretinal fluid in cystoid spaces (A). At the 3-month follow-up, the BCVA improved to 20/32, CRT decreased to 260 μm, RVP and diastolic CRAP improved to 19.3 mmHg and 76.8 mmHg respectively. OCT image showed complete resolution of ME (B). This patient only received the initial three injections without requiring additional treatments throughout the 12-month study period and no ME recurrence occurred at 6-month and 12-month follow-up (C and D). At the 12-month follow-up, the BCVA was 20/25, CRT was 240 μm, RVP and diastolic CRAP was 17.4 mmHg and 83.2 mmHg respectively. |
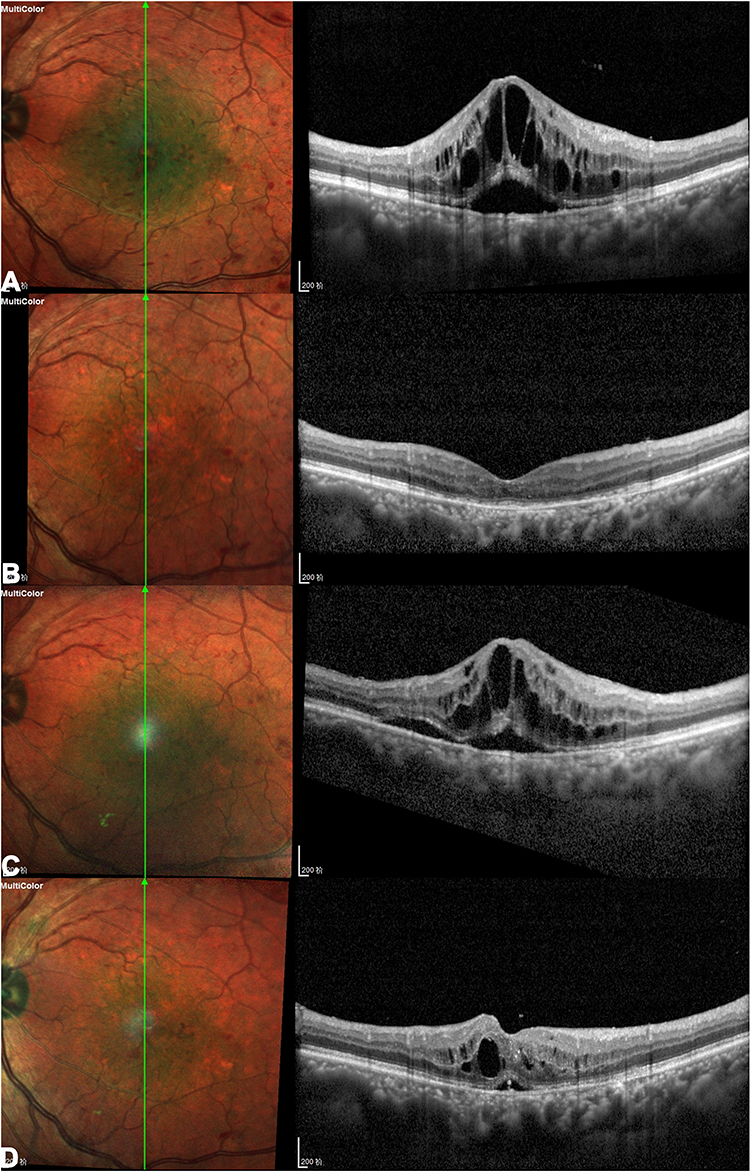 |
Figure 6 Images obtained from a 65-year-old male with CRVO in the left eye the high RVP group (Group 2). At baseline, the patient’s BCVA was 20/100, CRT was 925 μm, RVP was 67.2 mmHg and diastolic CRAP was 53.7 mmHg. OCT image demonstrated intraretinal fluid in cystoid spaces and subretinal fluid (A). At the 3-month follow-up, the BCVA improved to 20/50 and CRT decreased to 207 μm. OCT image showed complete resolution of ME (B). However, RVP and diastolic CRAP showed minimal improvement, measuring 63.0 mmHg and 55.9 mmHg respectively. The patient subsequently showed ME recurrence during the PRN phase, requiring additional treatments (total of 8 injections over the 12-month study period). OCT images demonstrate ME recurrence at the 6-month and 12-month follow-up (C and D). At the 12-month follow-up, the BCVA was 20/80, CRT was 408 μm, RVP and diastolic CRAP was 58.1 mmHg and 57.7 mmHg respectively. |
Discussion
The exact mechanisms underlying the pathogenesis of CRVO remain incompletely understood and subject to ongoing debate. However, it is widely acknowledged that the clinical manifestations arise from impaired venous outflow, resulting in substantial elevations in RVP.3,11 Jonas JB, utilizing ophthalmodynamometry, demonstrated that RVP is markedly elevated in CRVO cases.2 Moreover, ischemic CRVO has been shown to exhibit significantly higher RVP levels compared to nonischemic cases.8 A prior investigation assessing the influence of RVP on visual outcomes, retinal ischemia, and anterior segment neovascularization over an 18-month period reported consistently higher mean BCVA in patients with lower RVP throughout follow-ups.3 Furthermore, areas of CNP were observed to increase significantly with higher RVP levels, with progression noted over time. These findings suggest that RVP measurements in CRVO could serve as valuable diagnostic and prognostic indicators. Most prior investigations were conducted before the advent of intravitreal anti-VEGF therapies and did not evaluate the specific role of RVP in ME, a leading cause of visual impairment in CRVO. This study aimed to assess the influence of RVP on visual and anatomical outcomes, the frequency of anti-VEGF injections required, and the longitudinal changes in RVP over a 12-month follow-up period in eyes with CRVO-associated ME. To the best of our knowledge, this represents the first study to comprehensively investigate the prognostic value of RVP in CRVO-ME patients undergoing anti-VEGF treatment.
In this investigation, patients were stratified into two distinct groups based on RVP and diastolic CRAP measurements. Group 1, the low RVP group, comprised eyes with RVP values below the diastolic CRAP, suggesting that while retinal blood flow might be reduced, effective perfusion likely remains intact. In contrast, Group 2, the high RVP group, included eyes where RVP equaled or exceeded the diastolic CRAP, indicating that retinal circulation is characterized by variable periods of stagnation interspersed with intermittent blood flow during parts of the cardiac cycle.3 At baseline, the low RVP group exhibited significantly lower mean CRT and higher mean BCVA compared to the high RVP group, findings consistent with earlier studies.3,8 Following 12 months of anti-VEGF therapy, both groups demonstrated improvements in mean BCVA and CRT; however, the low RVP group consistently showed greater reductions in mean CRT across all follow-up intervals. Additionally, the increase in mean BCVA was greater in the low RVP group over the 12-month period, except at the 1-month follow-up. The favorable outcomes observed in the low RVP group following anti-VEGF therapy may be attributed to several factors. First, the lower RVP and higher diastolic CRAP at baseline in Group 1 likely resulted in better retinal capillary perfusion and less damage to the capillary vasculature. Second, the greater improvement in PVP and diastolic CRAP over 12 months in Group 1 further enhanced retinal capillary perfusion. Third, Group 1 exhibited higher baseline BCVA and lower baseline CRT, which are linked to better visual and anatomic outcomes after anti-VEGF therapy.12–14
An additional significant observation from this study is the reduced number of IVR injections required in the low RVP group compared to the high RVP group over the 12-month follow-up period (6.3 vs 7.8 injections; P = 0.017). Notably, two eyes (10.5%) in the low RVP group required only the initial three injections, with no need for further retreatments. In these cases, RVP normalized, and spontaneous pulsations of the central retinal vein were observed by the 3-month follow-up. Conversely, all eyes in the high RVP group necessitated additional injections beyond the initial treatment series. Histopathological studies indicate that CRVO typically occurs in the lamina cribrosa region, characterized by thrombosis.15 While most thrombi can recanalize, restoring some circulation, this recovery process may take considerable time. We hypothesize that eyes in the low RVP group may develop recanalized channels more quickly or may have had incomplete occlusions at baseline, facilitating the normalization of retinal circulation and resulting in fewer retreatments. Responses to anti-VEGF therapy in CRVO-ME patients vary significantly between individuals, with most requiring repeated injections over several years.5,6 In our previous study, only 12.2% eyes showed no recurrence of ME after the initial ME resolution.16 Measuring RVP and identifying the baseline characteristics of these patients can help us select different treatment regimen, thus reducing treatment burden and achieving the goals of precision treatment and tailored treatment. These findings and hypotheses warrant further investigation in larger, randomized, controlled clinical trials.
At baseline, spontaneous pulsations of the central retinal vein were absent in all eyes across both groups, indicating elevated RVP at the start of the study. By the 12-month follow-up, spontaneous pulsations had become evident in four eyes within the low RVP group and in one eye from the high RVP group, suggesting a partial restoration of normal venous hemodynamics in these cases. Mean RVP exhibited a progressive decline in both groups over the 12-month follow-up period. A prior study investigating the relationship between RVP and visual outcomes, as well as retinal ischemia in eyes with CRVO, categorized baseline RVP into three levels: low (17% of patients), moderate (67%), and high (16%).3 Over the course of the 18-month follow-up, RVP demonstrated a general downward trend, with the distribution shifting to 41%, 48.9%, and 10.2% for the low, moderate, and high categories, respectively. These findings suggest that improvements in retinal venous outflow may occur naturally over time in CRVO eyes. Additionally, another study reported a significant reduction in RVP in CRVO-ME eyes following a single intravitreal anti-VEGF injection.17 However, the authors noted that it was not conclusively determined whether this reduction in RVP was directly attributable to the anti-VEGF treatment.
Our findings revealed that the baseline mean diastolic CRAP was significantly lower in the high RVP group compared to the low RVP group. This observation aligns with previous research indicating that diastolic CRAP is markedly reduced in eyes with ischemic CRVO compared to nonischemic CRVO, which itself exhibits lower values than those observed in healthy controls.8 The reduction in diastolic CRAP in CRVO-affected eyes is likely a consequence of elevated RVP, as increased intraluminal pressure in the retinal capillary network can impede or even halt arterial blood flow in severe cases, such as combined central retinal artery and vein occlusion.18 In the present study, mean diastolic CRAP progressively increased in both groups following anti-VEGF therapy over the 12-month follow-up period, suggesting potential improvements in retinal perfusion dynamics. This rise in diastolic CRAP may reflect a natural progression in CRVO eyes rather than a direct effect of anti-VEGF injections. In fact, anti-VEGF injections can cause temporary vasoconstriction of the retinal arteries, reducing retinal blood flow and velocity in RVO eyes, which might decrease retinal capillary perfusion.19 The implications of changes in CRAP in CRVO require further investigation.
Our results of this study suggest that ophthalmodynamometry may provide prognostic information in nonischemic CRVO-ME eyes received anti-VEGF treatment, however, this test is not part of the routine clinical evaluation of patients with CRVO. A simplification of this test can be commonly used by clinicians to elucidate whether the venous pressure is increased in patients with CRVO.20 It relies on the clinical maneuver of exerting pressure on the eye at the same time that the blood vessels are visualized by slit lamp biomicroscopy. As the pressure in the eye is increased (by pressing on the eye), the central retinal artery may collapse at the same time or even before the central retinal vein does, indicating very high venous pressure (venous pressure in normal circumstances is much lower than the pressure in arteries, and thus, veins should collapse earlier than arteries when pressure is exerted on the eye), and poor visual and anatomical outcomes, along with greater required injections.
This study is subject to several limitations. First, the retrospective design may limit the generalizability of the results to broader clinical populations. Second, the relatively small sample size and the short duration of the follow-up period may have restricted the robustness of statistical analyses and the ability to capture long-term outcomes. Third, the measurement of RVP using an ophthalmodynamometer remains an indirect and subjective method. The reliance on the observation of retinal venous pulsations introduces a degree of variability and potential bias, as this approach is inherently dependent on examiner interpretation. The reproducibility of the technique was evaluated in a previous study.8 It showed that the coefficient of variation for the redetermination of the RVP was 15.9 ± 11.9%, and that the coefficient of variation for the redetermination of the diastolic CRAP was 9.1 ± 4.2%. We employ multiple methods to improve inter- and intra-rater reliability, including standardized protocol, training, monitoring, pilot testing, and repeated measurements. Recent advancements have focused on the development of more objective techniques for evaluating retinal venous pulsations, enabling quantification of their presence or absence with greater accuracy. These innovations hold promise for enhancing the reliability of RVP assessment in future studies. These methods include quantitative vessel diameter measurement,21 lateral displacement of blood vessels,22 and hemoglobin concentration assessment.23 Further research is warranted to validate the findings of this study and to explore their applicability to broader clinical contexts.
In summary, this study found that CRVO-ME eyes with lower RVP exhibited significantly better vision, lower CRT at baseline, and more favorable visual and anatomic outcomes after IVR treatment, along with a reduced number of injections. RVP levels may influence individual differences in response to anti-VEGF therapy and could serve as a useful predictor for the duration and number of injections required for anti-VEGF therapy in CRVO-ME eyes. While the findings are promising, the retrospective nature of the study and small sample size limit definitive conclusions regarding clinical adoption. Prospective validation in larger, multi-center cohorts is necessary before RVP can be integrated into routine treatment algorithms.
Data Sharing Statement
Clinical imaging materials (OCT images) cannot be shared publicly due to patient privacy restrictions but may be accessed under approval by the Ethics Committee of China Medical University 1st Hospital (contact: [email protected]).
Ethics Approval and Consent to Participate
The Ethical Committee and the Institutional Review Board of China Medical university First Hospital approved the study protocol, which was conducted in accordance with the Declaration of Helsinki.
Funding
Liaoning Science and Technology Project (No. 2023-MS-185, KB. Y. and No. 2024JH2/102600317, H. Z.) supported this work. However, the funder played no role in the study design, data assembly or analysis, publishing decision, or manuscript preparation.
Disclosure
The authors declare that they have no competing interests in this work.
References
1. Zhang XT, Zhong YF, Xue YQ, et al. Clinical features of central retinal vein occlusion in young patients. Ophthalmol Ther. 2022;11(4):1409–1422. doi:10.1007/s40123-022-00534-7
2. Jonas JB. Ophthalmodynamometric assessment of the central retinal vein collapse pressure in eyes with retinal vein stasis or occlusion. Graefes Arch Clin Exp Ophthalmol. 2003;241(5):367–370. doi:10.1007/s00417-003-0643-7
3. McAllister IL, Tan MH, Smithies LA, Wong WL. The effect of central retinal venous pressure in patients with central retinal vein occlusion and a high mean area of nonperfusion. Ophthalmology. 2014;121(11):2228–2236. doi:10.1016/j.ophtha.2014.05.031
4. Nicholson L, Talks SJ, Amoaku W, Talks K, Sivaprasad S. Retinal vein occlusion (RVO) guideline: executive summary. Eye. 2022;36(5):909–912. doi:10.1038/s41433-022-02007-4
5. Campochiaro PA, Sophie R, Pearlman J, et al. Long-term outcomes in patients with retinal vein occlusion treated with ranibizumab: the RETAIN study. Ophthalmology. 2014;121(1):209–219. doi:10.1016/j.ophtha.2013.08.038
6. Spooner KL, Fraser-Bell S, Hong T, Wong JG, Chang AA. Long-term outcomes of anti-VEGF treatment of retinal vein occlusion. Eye. 2022;36(6):1194–1201. doi:10.1038/s41433-021-01620-z
7. Feng Y, Wu Y, Zhu Y, He Y, Weng W. Progress in single-cell sequencing of retinal vein occlusion or ischemic hypoxic retinopathy. Exp Eye Res. 2025;257:110436. doi:10.1016/j.exer.2025.110436
8. Jonas JB, Harder B. Ophthalmodynamometric differences between ischemic vs nonischemic retinal vein occlusion. Am J Ophthalmol. 2007;143(1):112–116. doi:10.1016/j.ajo.2006.09.019
9. Flammer J, Konieczka K. Retinal venous pressure: the role of endothelin. EPMA J. 2015;6:21. doi:10.1186/s13167-015-0043-1
10. McAllister IL, Smithies LA, Chen FK, Mackey DA, Sanfilippo PG. Functional benefits of a chorioretinal anastomosis at 2 years in eyes with a central retinal vein occlusion treated with ranibizumab compared with ranibizumab monotherapy. BMJ Open Ophthalmol. 2021;6(1):e000728. doi:10.1136/bmjophth-2021-000728
11. Hayreh SS. Prevalent misconceptions about acute retinal vascular occlusive disorders. Prog Retin Eye Res. 2005;24(4):493–519. doi:10.1016/j.preteyeres.2004.12.001
12. Sophie R, Wang PW, Channa R, Quezada-Ruiz C, Clark A, Campochiaro PA. Different factors associated with 2-year outcomes in patients with branch versus central retinal vein occlusion treated with ranibizumab. Ophthalmology. 2019;126(12):1695–1702. doi:10.1016/j.ophtha.2019.07.018
13. Sen P, Gurudas S, Ramu J, et al. Predictors of visual acuity outcomes after anti-vascular endothelial growth factor treatment for macular edema secondary to central retinal vein occlusion. Ophthalmol Retina. 2021;5(11):1115–1124. doi:10.1016/j.oret.2021.02.008
14. Ach T, Hoeh AE, Schaal KB, Scheuerle AF, Dithmar S. Predictive factors for changes in macular edema in intravitreal bevacizumab therapy of retinal vein occlusion. Graefes Arch Clin Exp Ophthalmol. 2010;248(2):155–159. doi:10.1007/s00417-009-1167-6
15. Green WR, Chan CC, Hutchins GM, Terry JM. Central retinal vein occlusion: a prospective histopathologic study of 29 eyes in 28 cases. Trans Am Ophthalmol Soc. 1981;79:371–422.
16. Yang KB, Sun XY, Sun LP, Li J, Liu ZL, Zhang H. Aqueous humor cytokine levels and rebound macular edema after conbercept treatment in patients with central retinal vein occlusion. Retina. 2021;41(4):834–843. doi:10.1097/IAE.0000000000002918
17. Kida T, Flammer J, Konieczka K, Ikeda T. Retinal venous pressure is decreased after anti-VEGF therapy in patients with retinal vein occlusion-related macular edema. Graefes Arch Clin Exp Ophthalmol. 2021;259(7):1853–1858. doi:10.1007/s00417-020-05068-x
18. Wang H, Chang Y, Zhang F, et al. Clinical features of combined central retinal artery and vein occlusion. J Ophthalmol. 2019;2019:7202731. doi:10.1155/2019/7202731
19. Fukami M, Iwase T, Yamamoto K, Kaneko H, Yasuda S, Terasaki H. Changes in retinal microcirculation after intravitreal ranibizumab injection in eyes with macular edema secondary to branch retinal vein occlusion. Invest Ophthalmol Vis Sci. 2017;58(2):1246–1255. doi:10.1167/iovs.16-21115
20. Khayat M, Williams M, Lois N. Ischemic retinal vein occlusion: characterizing the more severe spectrum of retinal vein occlusion. Surv Ophthalmol. 2018;63(6):816–850. doi:10.1016/j.survophthal.2018.04.005
21. Golzan SM, Graham SL, Leaney J, Avolio A. Dynamic association between intraocular pressure and spontaneous pulsations of retinal veins. Curr Eye Res. 2011;36(1):53–59. doi:10.3109/02713683.2010.530731
22. Moret F, Reiff CM, Lagreze WA, Bach M. Quantitative analysis of fundus-image sequences reveals phase of spontaneous venous pulsations. Transl Vis Sci Technol. 2015;4(5):3. doi:10.1167/tvst.4.5.3
23. Morgan WH, Abdul-Rahman A, Yu DY, Hazelton ML, Betz-Stablein B, Lind CR. Objective detection of retinal vessel pulsation. PLoS One. 2015;10(2):e0116475. doi:10.1371/journal.pone.0116475
 © 2025 The Author(s). This work is published and licensed by Dove Medical Press Limited. The
full terms of this license are available at https://www.dovepress.com/terms
and incorporate the Creative Commons Attribution
- Non Commercial (unported, 4.0) License.
By accessing the work you hereby accept the Terms. Non-commercial uses of the work are permitted
without any further permission from Dove Medical Press Limited, provided the work is properly
attributed. For permission for commercial use of this work, please see paragraphs 4.2 and 5 of our Terms.
© 2025 The Author(s). This work is published and licensed by Dove Medical Press Limited. The
full terms of this license are available at https://www.dovepress.com/terms
and incorporate the Creative Commons Attribution
- Non Commercial (unported, 4.0) License.
By accessing the work you hereby accept the Terms. Non-commercial uses of the work are permitted
without any further permission from Dove Medical Press Limited, provided the work is properly
attributed. For permission for commercial use of this work, please see paragraphs 4.2 and 5 of our Terms.
Recommended articles
Intravitreal Ziv-Aflibercept versus Bevacizumab for Naïve Central Retinal Vein Occlusion with Macular Edema: An Interim Analysis of a Randomized Non-Inferiority Trial
Sinawat S, Hemanak S, Chanthowong K, Sinawat S, Yospaiboon Y
Clinical Ophthalmology 2023, 17:2719-2728
Published Date: 18 September 2023
From Monotherapy to Combination Strategies: Redefining Treatment Approaches for Multiple-Cause Macular Edema
Zhu Q, Pan X, Du Z, Ying J, Hu Y, Yi Q, Fu X
Clinical Ophthalmology 2025, 19:887-897
Published Date: 12 March 2025
Efficacy and Safety of Ranibizumab Combined with Dexamethasone Intravitreal Implant Sequential Therapy for Macular Edema Secondary to Non-Ischemic Retinal Vein Occlusion
Gao L, Cai X, Dang Y
Drug Design, Development and Therapy 2026, 20:604539
Published Date: 30 March 2026