Back to Journals » Diabetes, Metabolic Syndrome and Obesity » Volume 15
Influence of Red Blood Cell Distribution Width on All-Cause Death in Critical Diabetic Patients with Acute Kidney Injury
Authors Mo M, Huang Z, Huo D, Pan L ![]() , Xia N, Liao Y
, Xia N, Liao Y ![]() , Yang Z
, Yang Z
Received 10 June 2022
Accepted for publication 18 July 2022
Published 2 August 2022 Volume 2022:15 Pages 2301—2309
DOI https://doi.org/10.2147/DMSO.S377650
Checked for plagiarism Yes
Review by Single anonymous peer review
Peer reviewer comments 2
Editor who approved publication: Prof. Dr. Juei-Tang Cheng
Manqiu Mo,1 Zichun Huang,2 Dongmei Huo,3 Ling Pan,3 Ning Xia,1 Yunhua Liao,3,* Zhenhua Yang3,*
1Geriatric Department of Endocrinology, the First Affiliated Hospital of Guangxi Medical University, Nanning, 530021, People’s Republic of China; 2Department of Cardiovascular Thoracic Surgery, the Third Affiliated Hospital of Guangxi Medical University: Nanning Second People’s Hospital, Nanning, 530031, People’s Republic of China; 3Department of Nephrology, the First Affiliated Hospital of Guangxi Medical University, Nanning, 530021, People’s Republic of China
*These authors contributed equally to this work
Correspondence: Zhenhua Yang; Yunhua Liao, Department of Nephrology, the First Affiliated Hospital of Guangxi Medical University, No. 6, Shuangyong Road, Nanning, 530021, Guangxi, People’s Republic of China, Email [email protected]; [email protected]
Objective: To explore the relationship between red blood cell distribution width (RDW) and all-cause death in critical diabetic patients with acute kidney injury (AKI).
Methods: The clinical data of critical diabetic patients with AKI in MIMIC-III database were analyzed retrospectively. According to the survival status of 28-day after AKI and levels of RDW, patients were divided into survival and death groups, high RDW (RDW > 15.3%) and low RDW groups (RDW ≤ 15.3%). Kaplan–Meier curves were used to compare the survival rates of diabetic patients with AKI in different RDW and AKI stages, and Cox regression analysis was used to evaluate the risk factors of 28-day all-cause death in critical diabetic patients with AKI.
Results: A total of 5200 patients with critical diabetic patients with AKI were included in this study with the male to female ratio of 1.53:1. The mean follow-up time was 24.97 ± 7.14 days, and the 28-day all-cause mortality was 17.9% (931/5200). Age, RDW, blood urea nitrogen, serum creatinine, lactic acid, proportion of AKI stage, sepsis and respiratory failure in the death group were higher than those in the survival group, while mean arterial pressure (MAP) and red blood cell count were lower than those in the survival group. Kaplan–Meier analysis showed that the 28-day survival rate of the high RDW group was significantly lower than that of the low RDW group (log-rank χ2 = 9.970, P = 0.002). Multivariate Cox regression analysis showed that advanced age (HR = 1.042, 95% CI = 1.021– 1.063), decreased MAP (HR = 0.984, 95% CI = 0.969– 0.998), stage 3 AKI (HR = 3.318, 95% CI = 1.598– 6.890) and increased RDW (HR = 1.255, 95% CI = 1.123– 1.403) were independent risk factors of 28-day all-cause death in critical diabetic patients with AKI (P < 0.05).
Conclusion: High level of RDW is an important risk factor of all-cause death in critical diabetic patients with AKI, and it may be used as a valuable index to classify the mortality.
Keywords: diabetes, acute kidney injury, all-cause death, red cell distribution width, critical
Background
Diabetes is one of the most common chronic diseases in the world, which seriously threatens the life and health of human. In recent years, the incidence and prevalence of diabetes have grown significantly throughout the world.1 According to the International Diabetes Federation Atlas, 10th edition, 537 million adults aged 20–79 are currently living with diabetes, which is expected to rise to 643 million (accounting for 11.3%) by 2030 and 783 million (accounting for 12.2%) by 2045.2
Acute kidney injury (AKI) has a very high incidence and fatality rate in intensive care unit (ICU), and occurs in approximately 50% of critically ill patients.3,4 A prospective study showed that about 11.0% of patients with AKI died in ICU, and AKI was an independent risk factor of the increased 28-day mortality (OR = 1.77, 95% CI = 1.17–2.68).5 In addition, AKI is also considered to be one of the common renal complications of diabetes.6 A retrospective cohort study showed that the incidence of AKI in patients with diabetes was approximately 48.6%, significantly higher than that in non-diabetic patients (accounting for 17.2%).7 Diabetic patients with AKI have poor clinical outcomes, which seriously affect the quality of life of patients. Without timely treatment, critical diabetic patients with AKI are more likely to develop into chronic renal failure or end-stage renal disease, severe infection, heart failure, and even death.8,9
Red blood cell distribution Width (RDW) is a convenient and inexpensive biochemical parameter. As one of the complete blood routine test indexes, RDW is calculated from the ratio of mean red blood cell (RBC) volume to its standard deviation, and mainly reflects the variability of RBC volume.10 Both diabetes and AKI cause high inflammatory burden. Increased RDW has been reported other inflammatory conditions such as functional bowel conditions,11 rheumatoid arthritis,12 degenerative vertebral conditions,13 malignancy,14 and autoimmune hepatitis.15 However, the relationship between RDW levels and prognosis in diabetic patients with AKI is still unclear. This present study retrospectively analyzed the clinical data of Medical Information Mart for Intensive Care III (MIMIC-III) to explore the relationship between RDW and 28-day all-cause death in critical diabetic patients with AKI, providing some reference for evaluation of short-term prognosis and treatment of diabetic patients with AKI.
Materials and Methods
Database
As a free and open public database, MIMIC-III database collected clinical information from more than 50,000 patients who were admitted to the ICU of Beth Israel Deacon Medical Center from 2001 to 2012. The establishment of this database was approved by the institutional review boards of Massachusetts Institute of Technology (MIT, Cambridge, MA, USA) and Beth Israel Deaconess Medical Center. All included patients signed (or commissioned to sign) informed consent forms and were de-identified to protect their privacy. In order to gain access to the database, we completed the National Institutes of Health online course, passed the Protecting Human Study Participants Exam, and received a certificate (No. 30165505). This study was conducted according to the principles of the Declaration of Helsinki and approved by the Ethics Committee of the First Affiliated Hospital of Guangxi Medical University [approval number: 2019 (KY-E-028)].
Inclusion and Exclusion Criteria
Inclusion criteria: (1) diabetic patients with AKI; (2) ICU length of stay (LOS) ≥ 48h; (3) serum creatinine (Scr) levels were measured at least twice within 7 days. Exclusion criteria: (1) age < 18 years old; (2) stage 5 chronic kidney disease (CKD) or regular renal replacement therapy (RRT); (3) pregnant women, combined with blood diseases (such as leukemia or myelodysplastic syndrome); (4) patients with missing important baseline data (like RDW); (5) patients who discharged or died within 48h after ICU admission.
Data Collection
Baseline data of patients (including basic characteristics, vital signs, scoring system, laboratory parameters and comorbidities) were recorded. The scoring systems include the Simplified Acute Physiology Score II (SAPSII), Oxford Acute Severity of Illness Score (OASIS) and Sequential Organ Failure Assessment (SOFA) score. Laboratory parameters included white blood cell (WBC) count, hemoglobin (Hb), red blood cell(RBC) count, RDW, platelet (PLT) count, blood urea nitrogen (BUN), Scr, random blood glucose (RBG), and lactic acid (Lac). Complications include acute respiratory distress syndrome (ARDS), congestive heart failure (CHF), sepsis, and renal failure. Vital signs, score system data and laboratory parameters were recorded within 24 hours after admission. For patients admitted to ICU multiple times, the clinical data of the first admission to ICU were selected.
Diagnostic Criteria
AKI and stage were defined according to the diagnostic criteria of KDIGO guidelines:16 (1) diagnostic criteria of AKI: Scr increase ≥ 0.3mg/dL within 48h, or increase > 50% of baseline within 7 days. (2) The criteria of AKI stage: stage 1: Scr increase to 1.5–1.9 times of baseline value or increased ≥ 0.3mg/dL, stage 2: Scr increase to 2.0–2.9 times of base value, stage 3: Scr increase to 3 times or ≥ 4.0mg/dL or begin RRT. The diagnosis of diabetes was in line with the standards of the World Health Organization:17 diabetes symptoms plus (1) RBG ≥ 200mg/dL, or (2) fasting blood glucose ≥ 126mg/dL, or (3) postprandial blood glucose ≥ 200mg/dL; patients who had been diagnosed with diabetes and were taking antidiabetic therapy.
Study Grouping and Clinical Outcome
The retrospective cohort study was follow up at 28-day after AKI diagnosis or death (death within 28-day), and the clinical outcome was all-cause death. According to whether they died within 28 days, patients were divided into death group and survival group. Patients were also divided into high RDW group (RDW > 15.3%) and low RDW group (RDW ≤ 15.3%) according to the median of RDW levels.
Statistical Methods
SPSS22.0 statistical software was used for statistical analysis. Data were tested for normality using the histogram and Shapiro–Wilk tests. Measurement data conforming to normal distribution are expressed as mean ± standard deviation, and independent sample t-tests were used for comparison between groups; data with non-normal distribution are presented as the median and quartiles, and Wilcoxon rank-sum tests were used for comparison between groups. Counting data are expressed as frequency (percentage), and χ2 tests were used for comparison between groups. Kaplan–Meier survival curves (Log-rank χ2 method) were used to compare the survival rate of critical diabetic patients with AKI with different levels of RDW and AKI stages. Cox regression analysis was used to explore the independent risk factors of 28-day all-cause death in patients with critical diabetic patients with AKI. P < 0.05 was considered statistically significant.
Results
Baseline Characteristics and Clinical Outcomes
A total of 5200 critical diabetic patients with AKI were included in the analysis, including 3141 (accounting for 60.4%) males and 2059 (accounting for 39.6%) females, with a male to female ratio of 1.53:1. The average follow-up time was 24.97±7.14 days. Among them, 1440 patients (accounting for 27.7%) had AKI stage 1, 1732 (accounting for 33.3%) had AKI stage 2, and 2028 (accounting for 39.0%) had AKI stage 2. Using 15.3% (median of RDW) as truncation value, there were 2070 (accounting for 39.8%) patients in the high RDW group (RDW > 15.3%) and 3130 (accounting for 60.2%) patients in the low RDW group (RDW ≤ 15.3%). The 28-day all-cause mortality was 17.9% (930/5200). The main causes of death were 361 cases (accounting for 38.8%) of infection, 337 cases (accounting for 36.2%) of cardiovascular and cerebrovascular diseases, and 232 cases (accounting for 25.0%) of other or unknown causes.
Comparison of Clinical Data Between the Death and Survival Groups
As shown in Table 1, age, proportion of stage 3 AKI, SOFA, SAPSII, OASIS, RDW, BUN, Scr, Lac, proportion of sepsis and respiratory failure in the death group were higher than those in the survival group, and mean arterial pressure (MAP) and RBC were lower than those in the survival group (P < 0.05). There were no significant differences in the ratio of male to female, ICU LOS, body mass index, temperature, heart rate, respiration, central venous pressure, WBC, Hb, PLT, proportion of CHF, ARDS, hypertension and renal failure between the death group and the survival group (P > 0.05).
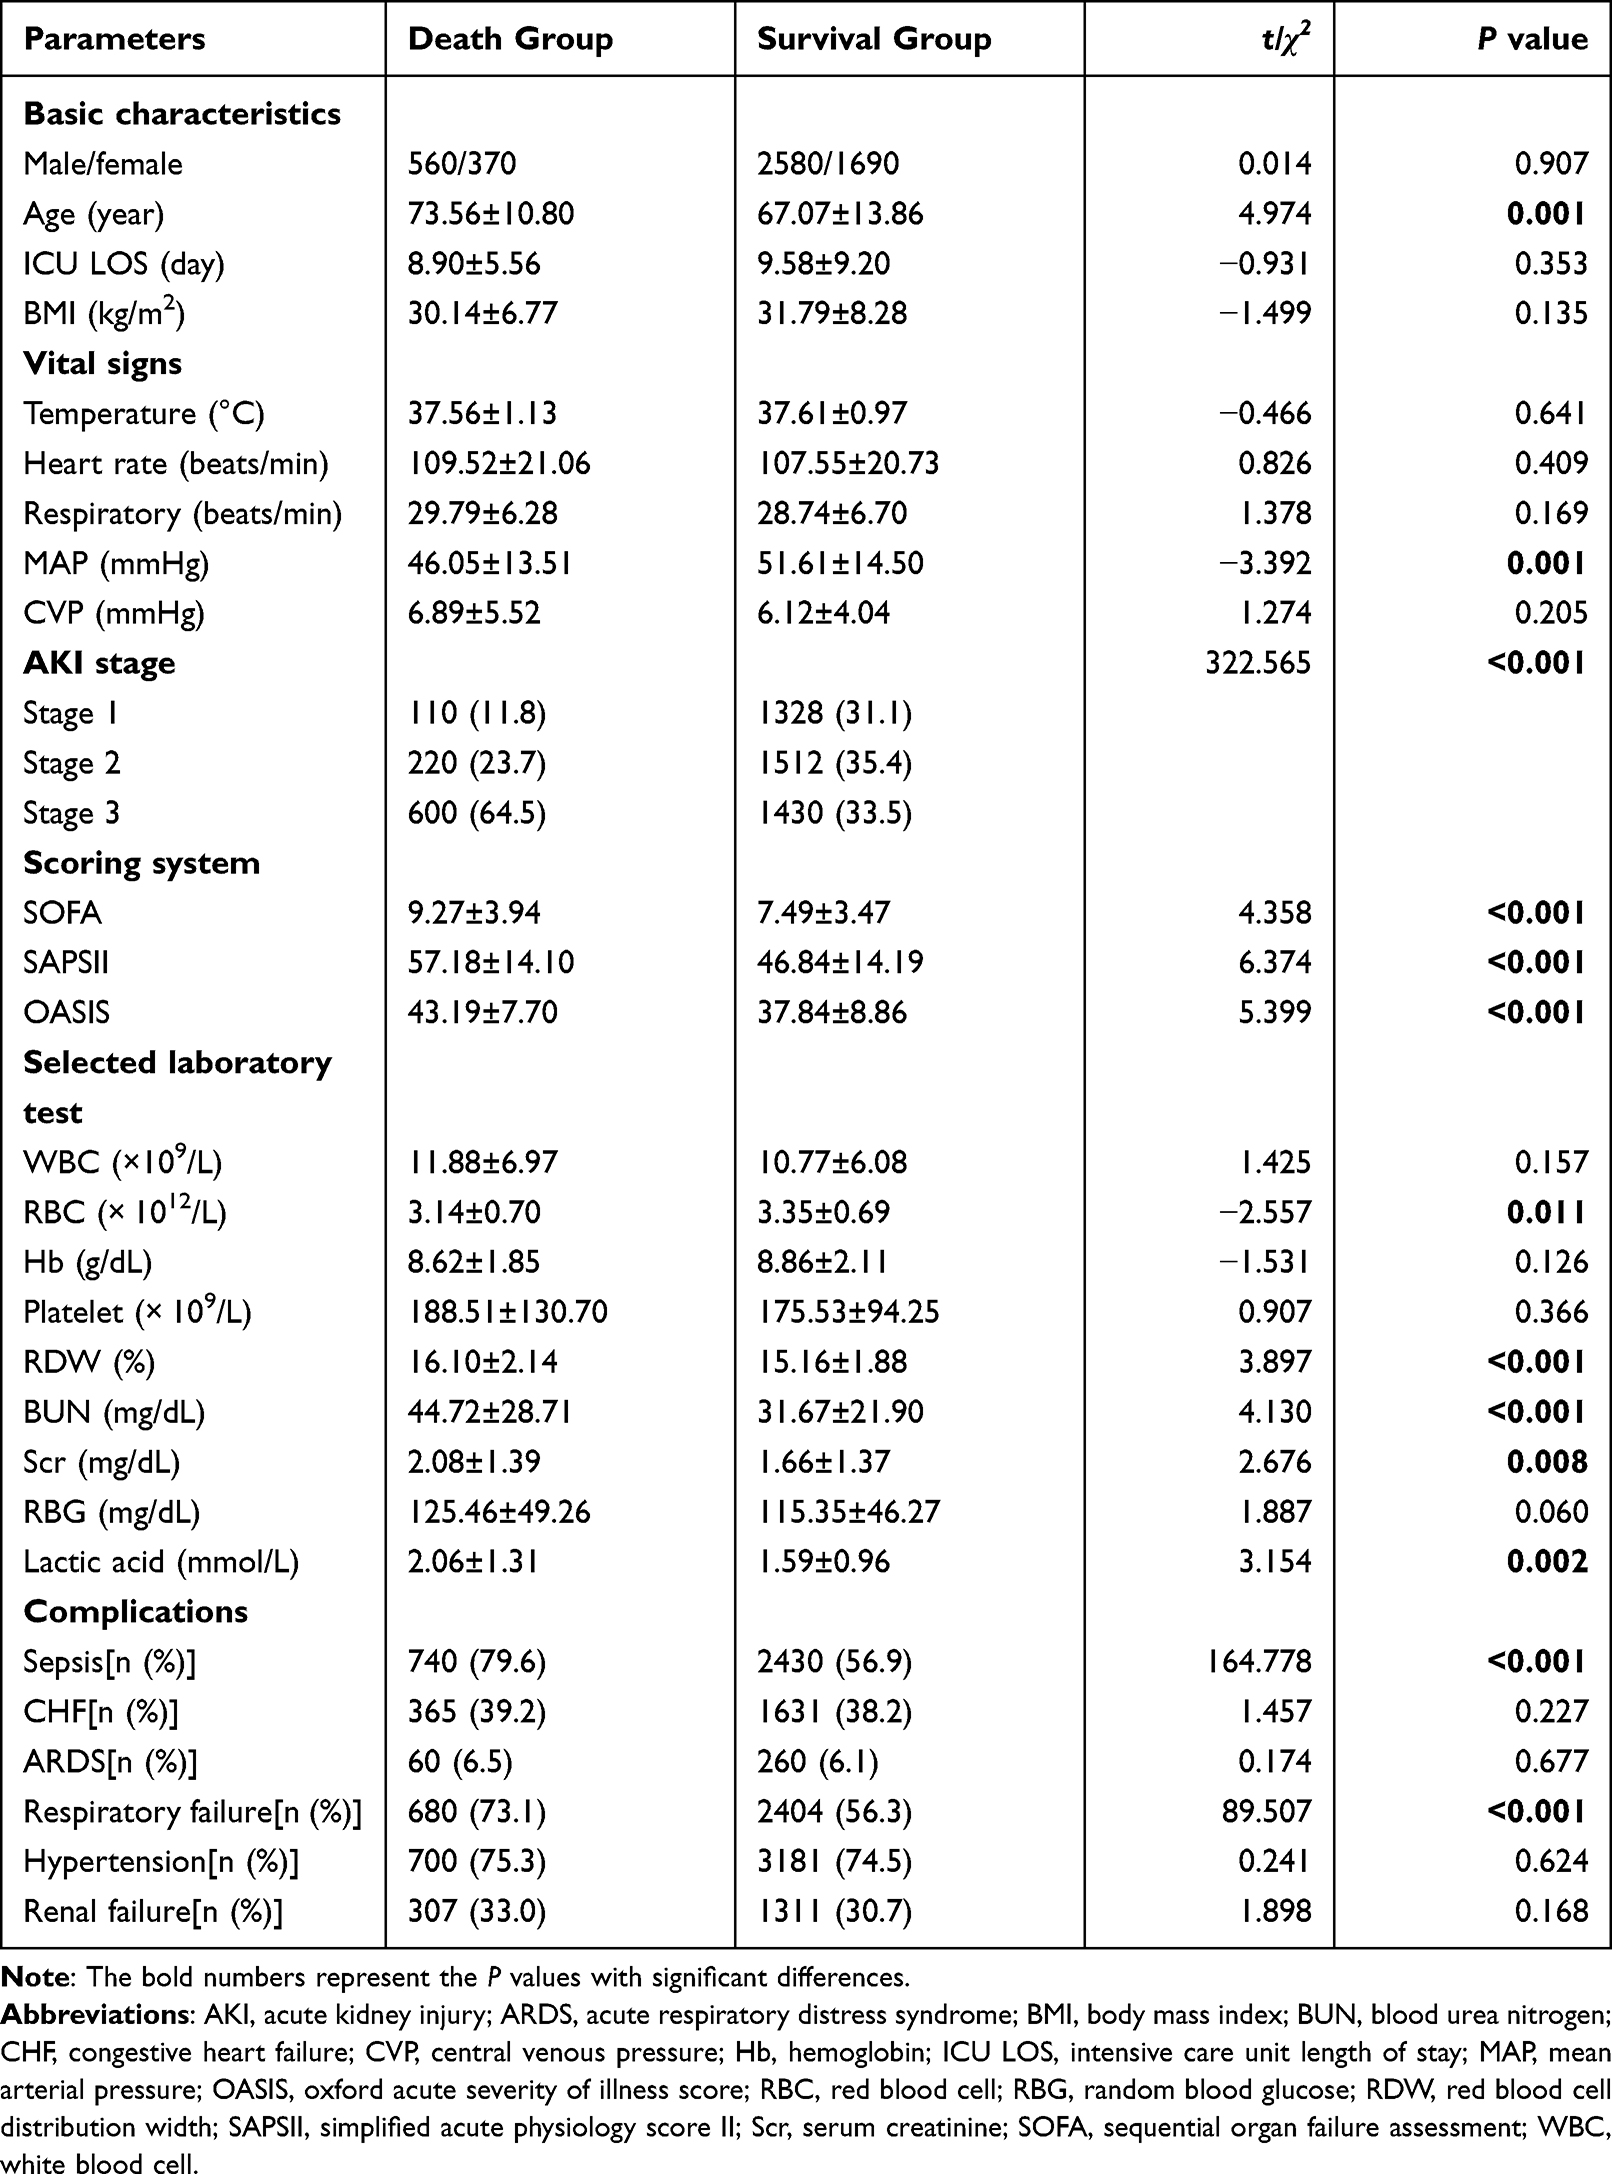 |
Table 1 Comparison of Data Between the Death Group and the Survival Group in Critical Diabetic Patients with AKI |
Risk Factors of All-Cause Death in Critical Diabetic Patients with AKI
According to the clinical data comparison between the death group and the survival group in Table 1, the variables with P < 0.05 were included in the multivariate Cox regression analysis, and the results showed that advanced age (HR = 1.042, 95% CI = 1.021–1.063), MAP decreased (HR = 0.984, 95% CI = 0.969–0.998), stage 3 AKI (HR = 3.318, 95% CI = 1.598–6.890) and high RDW (HR = 1.255, 95% CI = 1.123–1.403) were independent risk factors of 28-day all-cause death in critical diabetic patients with AKI (P < 0.05, as shown in Table 2).
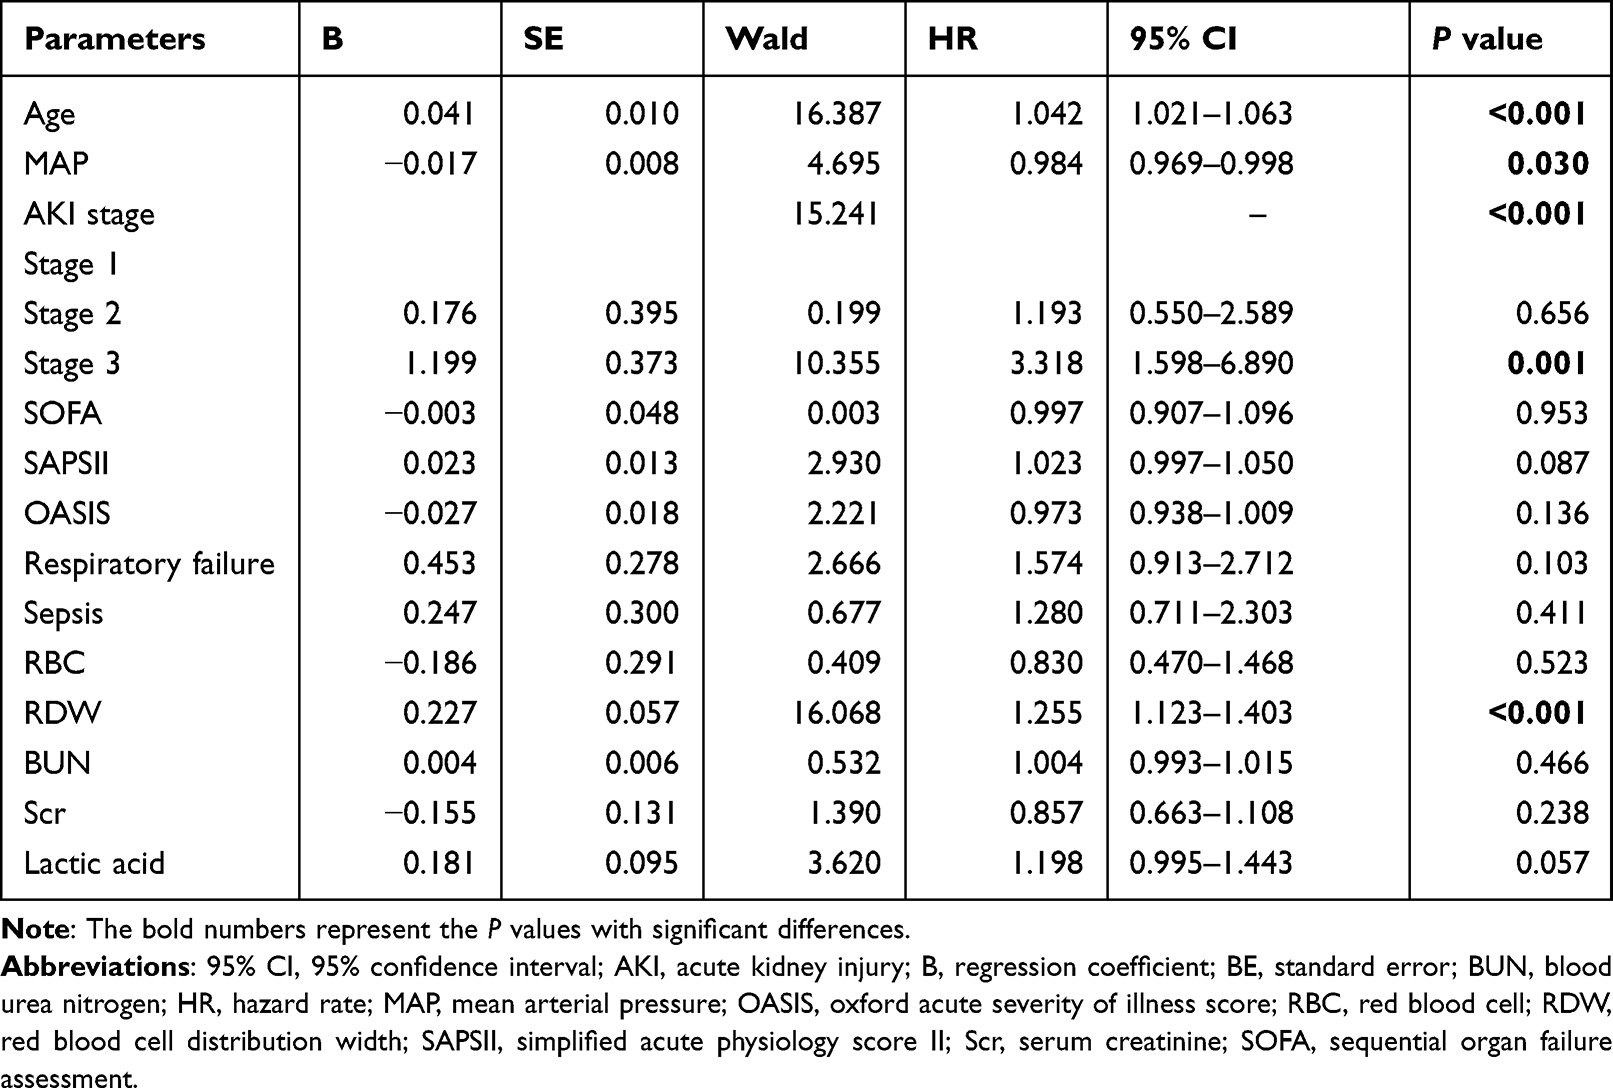 |
Table 2 Risk Factors of All-Cause Death in Critical Diabetic Patients with AKI (Multivariate Cox Regression Analysis) |
Influence of RDW on All-Cause Death and Other Adverse Outcomes
As shown in Table 3, patients were divided into high and low RDW groups using the median of RDW as truncation value. The 28-day all-cause mortality, proportion of stage 3 AKI, peak Scr levels, and proportion of RRT were higher in the high RDW group than in the low RDW group (P < 0.001).
 |
Table 3 Differences of All Cause Deaths and Other Adverse Outcomes at Different Levels of RDW |
Influence of Different RDW and AKI Stages on the Survival Rate
As shown in Figure 1, Kaplan-Meier survival analysis showed that the mean survival time of the high RDW group and the low RDW group were [23.68 days (95% CI = 22.55–24.81)] and [25.81 days (95% CI = 25.14–26.49)], respectively. The 28-day cumulative survival rate in the high RDW group was significantly lower than that in the low RDW group (75.7% vs 86.3%; Log-rank χ2 = 9.970, P= 0.002). As shown in Figure 2, the mean survival time of patients with AKI stage 1, 2 and 3 were [27.06 days (95% CI = 26.45–27.67)], [25.95 days (95% CI = 25.04–26.86)], [24.97 days (95% CI = 24.36–25.59)], respectively. The difference in 28-day cumulative survival were statistically significant among the three groups (92.4% vs 87.3% vs 70.4%; Log-rank χ2 = 34.353, P < 0.001).
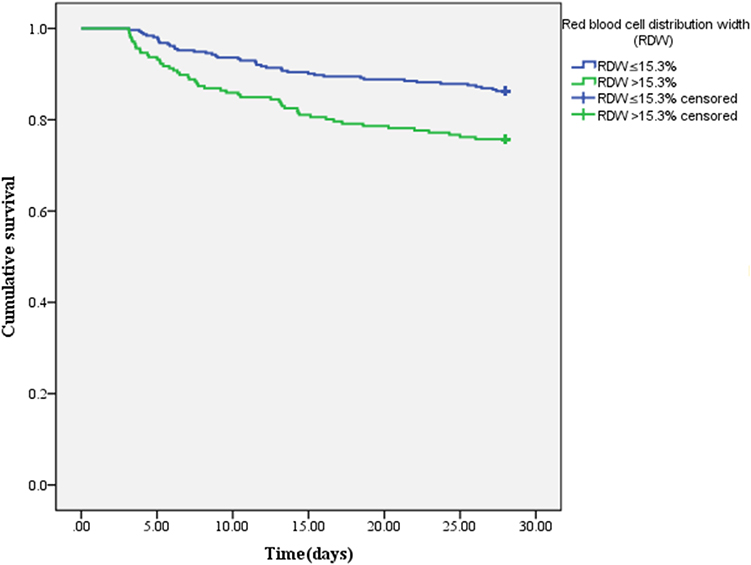 |
Figure 1 Comparison of survival curves of critical diabetic patients with AKI in different RDW groups (Kaplan–Meier survival curve). |
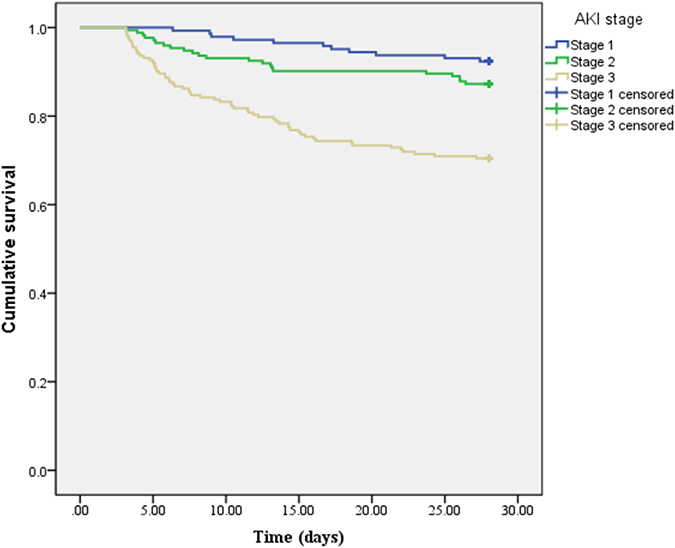 |
Figure 2 Comparison of survival curves of critical diabetic patients with AKI in different stages (Kaplan–Meier survival curve). |
Discussion
In the present retrospective study of 5200 critical diabetic patients with AKI, the relationship between baseline RDW and short-term survival was investigated. After adjusting for confounders, high RDW was an independent risk factor of 28-day all-cause death in critical diabetic patients with AKI. RDW is a parameter reflecting the heterogeneity of RBC volume in peripheral blood. Increased RDW is not only associated with increased RBC destruction and ineffective production, but also indicates iron deficiency anemia, inflammation and malnutrition.18 A prospective observational study showed that RDW was an independent predictor of AKI (OR = 1.059, 95% CI = 1.024–1.095) and in-hospital mortality (HR = 1.129, 95% CI = 1.005–1.268) in coronary care units.19 Nanjarapalle et al20 also showed that RDW was a better predictor of mortality in critically ill AKI patients requiring RRT than other disease severity scoring systems (area under the subject working curve was 0.904). In addition, previous studies have investigated the association between RDW and mortality and poor prognosis in patients with renal diseases such as AKI, hemodialysis and peritoneal dialysis.21–23 However, the prognoses of patients with diabetic AKI are worse than that of patients with simple diabetes or AKI, and there are little studies on RDW and prognosis of patients with diabetic AKI. In this study, based on MIMIC-III database, the relationship between RDW levels and short-term prognosis of patients with diabetic AKI was confirmed, which may help to stratify the risk of poor prognosis.
Our study showed that the incidence of high RDW in diabetic patients with AKI was 39.8%, which was similar to the results of Jia et al (34.5%)24 and Hu et al (30.8%).19 It can be seen that the incidence of high RDW in diabetic patients with AKI is high. The mechanisms of high RDW in diabetic patients with AKI are as follows: (1) renal ischemia during AKI might promote erythropoietin production and stimulate RBC proliferation,25 leading to increased RDW. (2) In diabetic patients with AKI, the inflammatory response of body was severe, iron metabolism and bone marrow function were inhibited, and the proliferation and maturation of RBC were inhibited, leading to the increase of RDW value.26 (3) Diabetic patients with AKI were often complicated by oxidative stress, including metabolic disorders, sepsis and hemodynamic disorders, which could lead to increased changes of RBC size, and thus increased the levels of RDW.27 Some reports suggested an association between inflammation and RDW, such as autoimmune diseases28 and COVID-19 infections.29 In addition, inflammation plays an important role both in the pathogenesis of diabetes and AKI, and our study also showed that RDW was associated with AKI in patients with diabetes. On the other hand, other reports found no diagnostic or prognostic value of RDW,30,31 which might be due to differences in the observation time of follow-up, variability in the degree of disease, and diversity of the intervention time and therapy in different studies. Our results also showed that patients in the high RDW group had higher AKI stage, peak Scr levels, and proportion of RRT than those in the low RDW group. Previous studies also showed that the glomerular filtration rate could decrease with the increase of RDW, and the increase of RDW was closely related to renal function injury.32,33 Thus, high RDW might be closely associated with the increased risk of renal function progression in diabetic patients with AKI. While the progression of renal function was an independent predictor of cardiovascular events and all-cause mortality.34 The effect of RDW on all-cause mortality might also be realized by increasing the risk of renal function progression. In addition, RDW is one of the parameters in blood routine and is easy to detect and obtain in clinic. Therefore, when increased RDW levels were detected clinically in diabetic patients with AKI, the occurrence of short-term renal function progression and poor prognosis should be warned. Clinicians can predict the risk of death by early assessment of RDW and improve the outcome of critical diabetic patients with AKI by actively managing and intervening risk factors.
Our study also showed that stage 3 AKI was an independent risk factor for 28-day all-cause death in critical diabetic patients with AKI. Mo et al35 established a clinical prediction model for short-term mortality in diabetic patients with AKI, and the results showed that AKI stage was also an independent risk factor for 90-day all-cause mortality in diabetic patients with AKI (HR = 4.803, 95% CI = 1.678–13.750), which was consistent with our study. Another prospective study showed that increased AKI severity was associated with in-hospital mortality in ICU patients after adjustment for other variables (OR = 6.884, 95% CI = 3.876–12.228).36 The mechanism of increased mortality in patients with higher stage of AKI might be related to these factors as follows: when diabetes was complicated with severe AKI, oliguria and volume recovery could lead to adverse consequences such as volume overload, metabolic acidosis and electrolyte disorder.37 Inflammation might also lead to dysfunction of multiple organs in the body.38 Uremia toxin might impair the immune function of patients and increase the probability of infection.39 In critical AKI, the complex dosage of various drugs would lead to treatment failure and adverse drug events, which ultimately could lead to increased mortality.40,41 Therefore, the short-term prognosis of critical diabetic patients with AKI might also be predicted according to AKI stage in clinical practice.
However, there were still some limitations in this study: (1) this study was a single-center retrospective study with a small sample size, and the study period was only 28 days. Some potential influencing factors of RDW and death might not be included in the analysis. (2) The diagnosis of AKI was only based on the degree of change in Scr, not including urine volume. (3) Only RDW might underestimate the true cause of poor prognosis. Therefore, multi-center cohort studies with large sample sizes are needed to further explore the specific pathophysiological mechanism of RDW in critical diabetic patients with AKI.
Conclusion
In conclusion, increased RDW is an important risk factor for increased all-cause mortality in critical diabetic patients with AKI, and may be used as a valuable indicator of mortality risk. RDW level may be a potential predictor of short-term renal poor outcome and all-cause mortality in critical diabetic patients with AKI.
Funding
This work was supported by the National Natural Science Foundation of China (8176030057); National Natural Science Foundation of Guangxi (2018GXNSFBA050040) and Guangxi Clinical Research Center for Urology and Nephrology (No. 2020AC03006).
Disclosure
All authors declare that there is no conflict of interest.
References
1. Tuttle KR, Bakris GL, Bilous RW, et al. Diabetic kidney disease: a report from an ADA consensus conference. Am J Kidney Dis. 2014;64:510–533. doi:10.1053/j.ajkd.2014.08.001
2. IDF. Diabetes Atlas.
3. Liborio AB, Leite TT, Neves FM, Teles F, Bezerra CT. AKI complications in critically ill patients: association with mortality rates and RRT. Clin J Am Soc Nephrol. 2015;10:21–28. doi:10.2215/CJN.04750514
4. Chen JJ, Kuo G, Hung CC, et al. Risk factors and prognosis assessment for acute kidney injury: the 2020 consensus of the Taiwan AKI task force. J Formos Med Assoc. 2021;120:1424–1433. doi:10.1016/j.jfma.2021.02.013
5. Kaddourah A, Basu RK, Bagshaw SM, Goldstein SL, Investigators A. Epidemiology of acute kidney injury in critically ill children and young adults. N Engl J Med. 2017;376:11–20. doi:10.1056/NEJMoa1611391
6. Advani A. Acute kidney injury: a bona fide complication of diabetes. Diabetes. 2020;69:2229–2237. doi:10.2337/db20-0604
7. Harding JL, Li Y, Burrows NR, Bullard KM, Pavkov ME. US trends in hospitalizations for dialysis-requiring acute kidney injury in people with versus without diabetes. Am J Kidney Dis. 2020;75:897–907. doi:10.1053/j.ajkd.2019.09.012
8. Go AS, Hsu CY, Yang J, et al. Acute kidney injury and risk of heart failure and atherosclerotic events. Clin J Am Soc Nephrol. 2018;13:833–841. doi:10.2215/CJN.12591117
9. Monseu M, Gand E, Saulnier PJ, et al. Acute kidney injury predicts major adverse outcomes in diabetes: synergic impact with low glomerular filtration rate and albuminuria. Diabetes Care. 2015;38:2333–2340. doi:10.2337/dc15-1222
10. Salvagno GL, Sanchis-Gomar F, Picanza A, Lippi G. Red blood cell distribution width: a simple parameter with multiple clinical applications. Crit Rev Clin Lab Sci. 2015;52:86–105. doi:10.3109/10408363.2014.992064
11. Aktas G, Alcelik A, Tekce BK, Tekelioglu V, Sit M, Savli H. Red cell distribution width and mean platelet volume in patients with irritable bowel syndrome. Prz Gastroenterol. 2014;9:160–163. doi:10.5114/pg.2014.43578
12. Rodríguez-Carrio J, Alperi-López M, López P, Alonso-Castro S, Ballina-García FJ, Suárez A. Red cell distribution width is associated with cardiovascular risk and disease parameters in rheumatoid arthritis. Rheumatology. 2015;54:641–646. doi:10.1093/rheumatology/keu345
13. Dagistan Y, Dagistan E, Gezici AR, et al. Could red cell distribution width and mean platelet volume be a predictor for lumbar disc hernias? Ideggyogy Sz. 2016;69:411–414. doi:10.18071/isz.69.0411
14. Aktas G, Sit M, Karagoz I, et al. Could red cell distribution width be a marker of thyroid cancer? J Coll Physicians Surg Pak. 2017;27:556–558.
15. Ustaoglu M, Aktas G, Avcioglu U, Bas B, Bahceci BK. Elevated platelet distribution width and red cell distribution width are associated with autoimmune liver diseases. Eur J Gastroenterol Hepatol. 2021;33:e905–e908. doi:10.1097/MEG.0000000000002296
16. Khwaja A. KDIGO clinical practice guidelines for acute kidney injury. Nephron Clin Pract. 2012;120:c179–184. doi:10.1159/000339789
17. Alberti KG, Zimmet PZ. Definition, diagnosis and classification of diabetes mellitus and its complications. Part 1: diagnosis and classification of diabetes mellitus provisional report of a WHO consultation. Diabet Med. 1998;15:539–553. doi:10.1002/(SICI)1096-9136(199807)15:7<539::AID-DIA668>3.0.CO;2-S
18. Ujszaszi A, Molnar MZ, Czira ME, Novak M, Mucsi I. Renal function is independently associated with red cell distribution width in kidney transplant recipients: a potential new auxiliary parameter for the clinical evaluation of patients with chronic kidney disease. Br J Haematol. 2013;161:715–725. doi:10.1111/bjh.12315
19. Hu Y, Liu H, Fu S, Wan J, Li X. Red blood cell distribution width is an independent predictor of aki and mortality in patients in the coronary care unit. Kidney Blood Press Res. 2017;42:1193–1204. doi:10.1159/000485866
20. Nanjarapalle S, Samantaray A, Vishnubhotla S. Red cell distribution width as a severity marker on the outcome of patients with acute kidney injury on renal replacement therapy. Indian J Crit Care Med. 2020;24:95–98. doi:10.5005/jp-journals-10071-23342
21. Vashistha T, Streja E, Molnar MZ, et al. Red cell distribution width and mortality in hemodialysis patients. Am J Kidney Dis. 2016;68:110–121. doi:10.1053/j.ajkd.2015.11.020
22. Odutayo A, Wong CX, Farkouh M, et al. AKI and long-term risk for cardiovascular events and mortality. J Am Soc Nephrol. 2017;28:377–387. doi:10.1681/ASN.2016010105
23. Hsieh YP, Chang CC, Kor CT, Yang Y, Wen YK, Chiu PF. The predictive role of red cell distribution width in mortality among chronic kidney disease patients. PLoS One. 2016;11:e0162025. doi:10.1371/journal.pone.0162025
24. Jia L, Cui S, Yang J, et al. Red blood cell distribution width predicts long-term mortality in critically ill patients with acute kidney injury: a retrospective database study. Sci Rep. 2020;10:4563. doi:10.1038/s41598-020-61516-y
25. Kwak J, Kim JH, Jang HN, et al. Erythropoietin ameliorates ischemia/reperfusion-induced acute kidney injury via inflammasome suppression in mice. Int J Mol Sci. 2020;21:3453.
26. Forhecz Z, Gombos T, Borgulya G, Pozsonyi Z, Prohaszka Z, Janoskuti L. Red cell distribution width in heart failure: prediction of clinical events and relationship with markers of ineffective erythropoiesis, inflammation, renal function, and nutritional state. Am Heart J. 2009;158:659–666. doi:10.1016/j.ahj.2009.07.024
27. Pavlakou P, Liakopoulos V, Eleftheriadis T, Mitsis M, Dounousi E. Oxidative stress and acute kidney injury in critical illness: pathophysiologic mechanisms-biomarkers-interventions, and future perspectives. Oxid Med Cell Longev. 2017;2017:6193694. doi:10.1155/2017/6193694
28. Aktas G, Sit M, Dikbas O, et al. Could red cell distribution width be a marker in Hashimoto’s thyroiditis? Exp Clin Endocrinol Diabetes. 2014;122:572–574. doi:10.1055/s-0034-1383564
29. Aktas G. Hematological predictors of novel coronavirus infection. Rev Assoc Med Bras. 2021;67(Suppl 1):1–2. doi:10.1590/1806-9282.67.suppl1.20200678
30. Cakir L, Aktas G, Enginyurt O, Cakir SA. Mean platelet volume increases in type 2 diabetes mellitus independent of HbA1c level. Acta Medica Mediterr. 2014;30:425–428.
31. Karagoz I, Aktas G, Yoldas H, et al. Association between hemogram parameters and survival of critically ill patients. J Intensive Care Med. 2019;34:511–513. doi:10.1177/0885066617703348
32. Bateman RMSharpe MD, Jagger JE, et al. 36th International symposium on intensive care and emergency medicine: Brussels, Belgium. 15–18 March 2016. Critical Care. 2016;20:94. doi:10.1186/s13054-016-1208-6
33. Cho AY, Yoon HJ, Lee KY, Sun IO. Clinical characteristics of sepsis-induced acute kidney injury in patients undergoing continuous renal replacement therapy. Ren Fail. 2018;40:403–409. doi:10.1080/0886022X.2018.1489288
34. Jeon H, Lee J, Ju JH, et al. Renal function deterioration is an independent mortality determinant in Koreans diagnosed with lupus nephritis. Lupus. 2021;30:1896–1905. doi:10.1177/09612033211038823
35. Mo M, Pan L, Huang Z, Liang Y, Liao Y, Xia N. Development and validation of a prediction model for survival in diabetic patients with acute kidney injury. Front Endocrinol. 2021;12:737996. doi:10.3389/fendo.2021.737996
36. Hoste EA, Bagshaw SM, Bellomo R, et al. Epidemiology of acute kidney injury in critically ill patients: the multinational AKI-EPI study. Intensive Care Med. 2015;41:1411–1423. doi:10.1007/s00134-015-3934-7
37. Di Lullo L, Reeves PB, Bellasi A, Ronco C. Cardiorenal syndrome in acute kidney injury. Semin Nephrol. 2019;39:31–40. doi:10.1016/j.semnephrol.2018.10.003
38. Kao CC, Yang WS, Fang JT, Liu KD, Wu VC. Remote organ failure in acute kidney injury. J Formos Med Assoc. 2019;118:859–866. doi:10.1016/j.jfma.2018.04.005
39. Rydzewska-Rosołowska A, Sroka N, Kakareko K, Rosołowski M, Zbroch E, Hryszko T. The links between microbiome and uremic toxins in acute kidney injury: beyond gut feeling-a systematic review. Toxins. 2020;12:788. doi:10.3390/toxins12120788
40. Udy AA, Roberts JA, Lipman J. Clinical implications of antibiotic pharmacokinetic principles in the critically ill. Intensive Care Med. 2013;39:2070–2082. doi:10.1007/s00134-013-3088-4
41. De Waele JJ, Lipman J, Akova M, et al. Risk factors for target non-attainment during empirical treatment with beta-lactam antibiotics in critically ill patients. Intensive Care Med. 2014;40:1340–1351. doi:10.1007/s00134-014-3403-8
 © 2022 The Author(s). This work is published and licensed by Dove Medical Press Limited. The
full terms of this license are available at https://www.dovepress.com/terms
and incorporate the Creative Commons Attribution
- Non Commercial (unported, 3.0) License.
By accessing the work you hereby accept the Terms. Non-commercial uses of the work are permitted
without any further permission from Dove Medical Press Limited, provided the work is properly
attributed. For permission for commercial use of this work, please see paragraphs 4.2 and 5 of our Terms.
© 2022 The Author(s). This work is published and licensed by Dove Medical Press Limited. The
full terms of this license are available at https://www.dovepress.com/terms
and incorporate the Creative Commons Attribution
- Non Commercial (unported, 3.0) License.
By accessing the work you hereby accept the Terms. Non-commercial uses of the work are permitted
without any further permission from Dove Medical Press Limited, provided the work is properly
attributed. For permission for commercial use of this work, please see paragraphs 4.2 and 5 of our Terms.