Back to Journals » Clinical Ophthalmology » Volume 14
Individual Macular Layer Evaluation with Spectral Domain Optical Coherence Tomography in Normal and Glaucomatous Eyes
Authors Fujihara FMF ![]() , de Arruda Mello PA
, de Arruda Mello PA ![]() , Lindenmeyer RL, Pakter HM, Lavinsky J, Benfica CZ
, Lindenmeyer RL, Pakter HM, Lavinsky J, Benfica CZ ![]() , Castoldi N, Picetti E
, Castoldi N, Picetti E ![]() , Lavinsky D, Finkelsztejn A
, Lavinsky D, Finkelsztejn A ![]() , Lavinsky F
, Lavinsky F ![]()
Received 8 April 2020
Accepted for publication 20 May 2020
Published 15 June 2020 Volume 2020:14 Pages 1591—1599
DOI https://doi.org/10.2147/OPTH.S256755
Checked for plagiarism Yes
Review by Single anonymous peer review
Peer reviewer comments 2
Editor who approved publication: Dr Scott Fraser
Fernanda Mari Fagundes Fujihara,1,2 Paulo Augusto de Arruda Mello,3 Rodrigo Leivas Lindenmeyer,1,4 Helena Messinger Pakter,1,4,5 Jaco Lavinsky,1,4 Camila Zanella Benfica,1 Nedio Castoldi,1 Egidio Picetti,5 Daniel Lavinsky,1,4 Alessandro Finkelsztejn,1,4 Fabio Lavinsky1,3
1Department of Ophthalmology, Hospital de Clínicas de Porto Alegre, Porto Alegre, RS, Brazil; 2Hospital Banco de Olhos de Porto Alegre, Porto Alegre, RS, Brazil; 3Department of Ophthalmology, Paulista School of Medicine, São Paulo Hospital, Federal University of São Paulo, São Paulo, SP, Brazil; 4Department of Ophthalmology, Federal University of Rio Grande do Sul, Porto Alegre, RS, Brazil; 5Department of Ophthalmology, Hospital Nossa Senhora da Conceição, Porto Alegre, RS, Brazil
Correspondence: Fabio Lavinsky Email [email protected]
Purpose: To evaluate differences in the thickness of the individual macular layers between early, moderate, and severe glaucomatous eyes and compare them with healthy controls.
Patients and Methods: Subjects with glaucoma presenting typical optic nerve head findings, high intraocular pressure with or without visual field (VF) damage and normal controls were included. All participants underwent 24– 2 perimetry and spectral-domain OCT. Patients were divided into three groups (early, moderate, and severe) based on the mean deviation of the VF and a healthy control group. The device segmented the layers automatically, and their measurements were plotted using the means of the sectors of the inner (3mm) and outer (6mm) circles of the ETDRS grid.
Results: A total of 109 eyes qualified for the study: 14 in the control group and 52, 18 and 25 in the early, moderate and severe groups, respectively. Mean age was 66.13 (SD=12.38). The mean thickness of the circumpapillary retinal nerve fiber layer (RNFL), total macular thickness (TMT), macular RNFL, ganglion cell layer (GCL) and inner plexiform layer (IPL) were significantly different between the 4 groups, with progressive decrease in thickness. Significant overall difference was found for the inner nuclear layer (INL), and the severe glaucoma group presented thicker measurements than controls and early glaucoma. Outer nuclear layer (ONL) was thinner in severe glaucoma group compared with early glaucoma group.
Conclusion: Individual macular layer measurement using the inner and outer circles of the ETDRS grid is useful to evaluate different stages of glaucoma. The INL thickening and ONL thinning in advanced glaucoma should be explored in the future studies.
Keywords: glaucoma, optical coherence tomography, macula, optic nerve, visual field
Introduction
Glaucoma is aprogressive optic nerve neuropathy and the leading cause of irreversible blindness worldwide.1,2 Glaucomatous damage affects retinal ganglion cells (RGCs) and their axons, leading to progressive thinning of the ganglion cell layer (GCL) and the retinal nerve fiber layer (RNFL) as well as to typical changes in the optic nerve head and defects in the visual field (VF).3,4
The increasing use of optical coherence tomography (OCT) in ophthalmology has played an important role in the diagnosis and monitoring of glaucoma.5–8 OCT can quantify at the micrometer level the structures involved in glaucomatous damage, namely the optic nerve, RNFL, and GCL, and can therefore be used to detect and monitor structural damage.9–11
Evaluation of macular thickness with OCT has been proposed as a parameter for diagnosis and monitoring of glaucoma, as the macula has the highest RGC density.12,13 Although central vision is often preserved until the late stages of glaucoma, it is known that glaucomatous damage can affect the macula in the early stages of the disease, preceding the onset of a glaucomatous VF defect.14–20 At the opposite end of the spectrum, in advanced glaucoma, circumpapillary RNFL (cRNFL) reaches a thickness at which no more thinning is evident – the floor effect.21,22 This limits the usefulness of cRNFL measurement in detecting glaucoma and monitoring progression in advanced disease, notwithstanding monitoring the macula has been demonstrated to be useful in this subset.23–27
The first reports of the role of the macula in glaucoma were with the use of time domain OCT, which could only measure total macular thickness (TMT) and showed poorer glaucoma diagnostic ability than cRNFL thickness measurement.28–32 However, with the use of spectral domain OCT (SD-OCT) to measure macular inner retinal layers, the macular RNFL (mRNFL), GCL, ganglion cell-inner plexiform layer (GCIPL), and ganglion cell complex (GCC) (composed of mRNFL and GCIPL) have shown a diagnostic ability comparable to cRNFL in detecting glaucoma,5,33,34 especially in early,35–40 but also in preperimetric41 and moderate to severe stages.42,43 The macular inner layers have also shown ability to detect and monitor progression.25–27
Recently, an SD-OCT device with a segmentation software that allows users to segment all retinal layers has been made commercially available. It is possible to analyze each individual retinal layer, including mRNFL, GCL, inner plexiform layer (IPL), inner nuclear layer (INL), and outer retinal layers, and determine their thickness across the glaucoma spectrum. Different thinning and thickening patterns of the macular layers according to disease severity may provide important insights for further research on the individual role of retinal cells in the mechanism of glaucoma. Therefore, the aim of this study was to assess individual differences in the thickness of each macular layer between early, moderate, and severe glaucoma and compare them with healthy controls.
Patients and Methods
The study was approved by the Ethics Committees of Hospital de Clínicas de Porto Alegre and Universidade Federal de São Paulo and was registered at Plataforma Brasil, the Brazilian national research directory. Written informed consent was obtained from all participants. The study followed the tenets of the Declaration of Helsinki.
This was a prospective non-interventional cross-sectional study of patients evaluated for open-angle glaucoma at Hospital de Clínicas de Porto Alegre. All patients were evaluated according to an established clinical protocol that includes a broad review of medical history and a comprehensive ophthalmic examination.
Participants
Patients were recruited if they had a diagnosis of primary open-angle glaucoma, defined as the presence of typical optic disc and retinal changes, such as neuroretinal rim thinning, RNFL defect, localized notching, and splinter hemorrhage; at least 1 intraocular pressure (IOP) measurement >21 mm Hg; and open angle in gonioscopic examination. Patients with pre-perimetric glaucoma were also included. Participants with ocular or systemic conditions that could affect the optic nerve or examination results were excluded. Exclusion criteria for glaucoma cases were cognitive impairment, other eye diseases (including diabetic retinopathy, retinal vein occlusion, and macular diseases), trauma, dense cataract, and previous ocular surgery that could influence the results of standard automated perimetry (SAP) or the measurements made with OCT.
Patients with glaucoma were divided into 3 groups based on VF mean deviation (MD): patients with an MD better than −6 dB were included in the early glaucoma group; patients with an MD between −6 and −12 dB were included in the moderate glaucoma group; and patients with an MD worse than −12 dB were included in the severe glaucoma group.
Controls were recruited if they had an IOP between 10 and 21 mm Hg, normal SAP results, optic disc within normal limits, and normal appearing iridocorneal angles. Inclusion criteria for controls were age between 18 and 60 years, clear media, and good cooperation during examination. Exclusion criteria were an IOP >21 mm Hg, optic discs suspected of having glaucoma (with one of the following conditions: cup-to-disc ratio >0.55, hemorrhage, or RNFL defect evaluated clinically), glaucomatous VF defects, or any previous ocular disease or ocular surgery.
Study Protocol
All participants provided a detailed medical and ophthalmic history and underwent ophthalmic examination including slit lamp biomicroscopy, IOP measurements using applanation tonometry, gonioscopy, and dilated fundus examination. VFs were tested with SAP using Humphrey Field Analyzer (HFA, Carl Zeiss Meditec AG, Jena, Germany) with the Swedish Interactive Threshold Algorithm (SITA) standard strategy and 24–2 program. Glaucomatous SAP defects were determined if one of the following was present:44 at least 3 contiguous non-edge points depressed on the pattern deviation plot at a P<5% level and 1 of which is depressed at a P<1% level; pattern standard deviation <5%; or glaucoma hemifield test outside normal limits. Unreliable SAP measurements were defined as fixation loss, false-negative and false-positive responses ≥33% and were disqualified. All included participants with glaucoma had undergone SAP before the one in the dataset of this study.
All patients underwent SD-OCT imaging (Spectralis OCT; Heidelberg Engineering GmbH, Dossenheim, Germany). The SD-OCT protocol included a 3.45-mm circular scan to determine cRNFL thickness, and mean cRNFL was recorded. For the macular scans, automated segmentation of the layers was performed. The segmentation of each macular layer was checked by one blinded examiner, and small errors were manually adjusted if necessary.
The macula was then divided into 9 regions, as defined by the Early Treatment Diabetic Retinopathy Study (ETDRS) grid provided by the software of the SD-OCT: 3 concentric circles centered at the fovea with diameters of 1 mm (center), 3 mm (inner circle), and 6 mm (outer circle) and 2 diagonal lines that divided the inner and outer circles into 4 regions each: superior, nasal, inferior, and temporal (Figure 1).
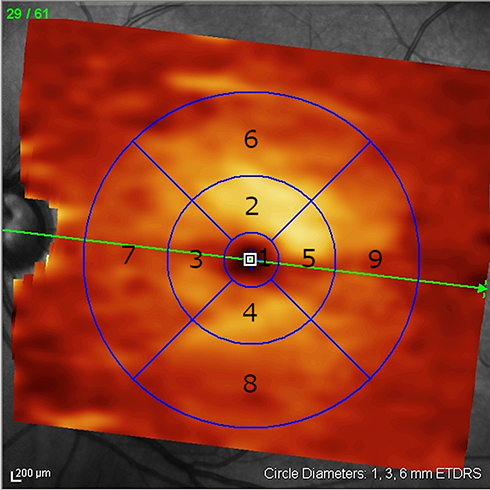 |
Figure 1 Retinal layer thickness is provided for each of the 9 regions of the Early Treatment Diabetic Retinopathy Study (ETDRS) grid. The inner circle (3 mm) was calculated as the average of regions 2, 3, 4, and 5. The outer circle (6 mm) was calculated as the average of regions 6, 7, 8, and 9. |
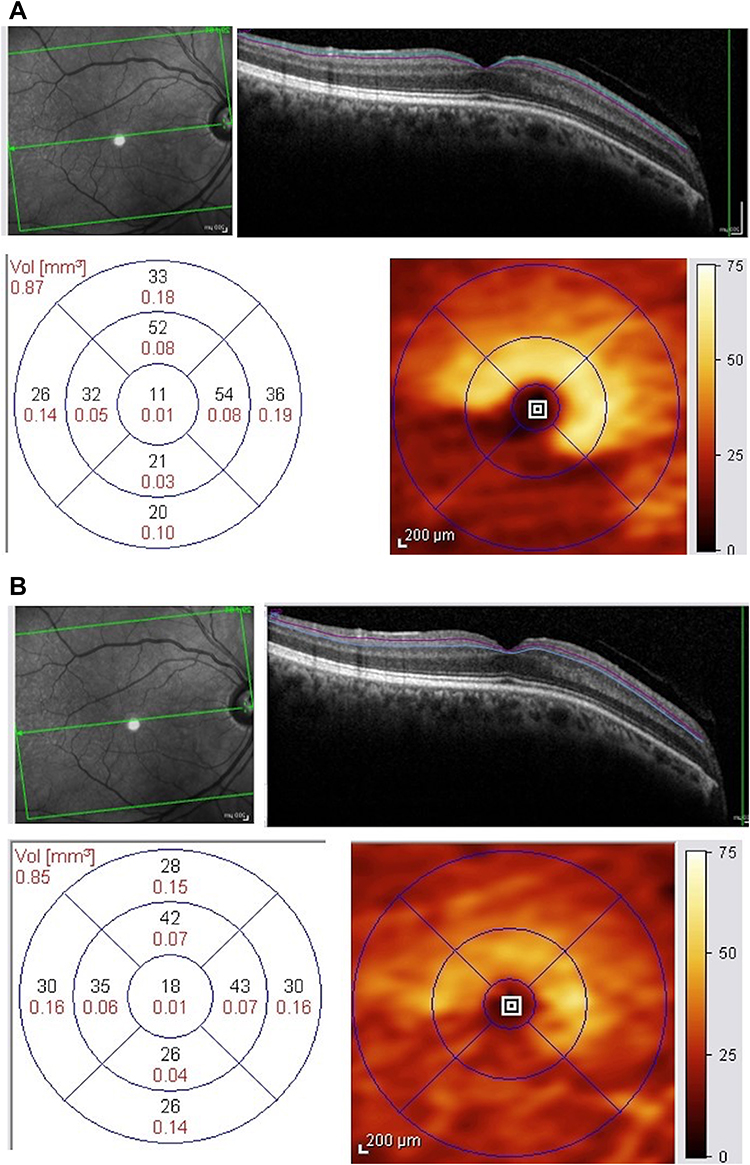 |
Figure 2 (A and B) – Measurements of the ganglion cell layer (A) and inner plexiform layer (B) in a patient with moderate glaucoma. The segmentation is shown in the upper right portion of the figures. The lower portion depicts the ETDRS grid (left) showing the values for each sector (µm) and a density map of layer (right). |
Seven parameters were measured and recorded in each of the 9 regions: TMT, mRNFL, GCL, IPL, INL, outer plexiform layer (OPL), and outer nuclear layer (ONL). GCIPL and GCC were also used in the analysis and correspond to the combination of GCL and IPL and of mRNFL, GCL, and IPL, respectively. The inner and outer circle average thicknesses were calculated as the mean of the inferior, superior, nasal, and temporal sectors in their respective areas. Images with a Q score <20, with artifacts or with incorrigible segmentation failures were disqualified. SAP and OCT were performed within a 3-month period.
Statistical Analysis
Patient age and sex were compared between groups using Student’s t-test and Fisher’s exact test, respectively. Generalized estimating equations (GEE), which consider the correlation between both eyes of the same individual, were used to compare the thickness of each layer across the groups. The structure-function correlation between cRNFL and the macular parameters and with the SAP MD was performed with Pearson (R) correlation coefficient. The mean thickness in the inner and outer circles of the ETDRS grid were used in the analysis. A pairwise analysis was also performed. The sample has shown a power >99% to detect a difference with a significance level of 1%. A P-value <0.05 was considered statistically significant. Statistical analyses were done using SPSS, version 22.0 (IBM Corporation, Armonk, NY, USA).
Results
A total of 109 eyes of 67 participants were included in the study. Fourteen eyes were included in the control group, while 52, 18, and 25 eyes were included in the early, moderate, and severe glaucoma groups, respectively. Mean age was 44.86 years for controls and 68.62 years for patients with glaucoma (P = 0.003). The majority of participants was female, and the groups did not differ in sex (P = 0.178). Additional demographic data are summarized in Table 1. The average MD and visual field index (VFI) of the population were −7.01 dB (range −29.59 to 0.94) and 81.39% (range 7.00 to 100%), respectively.
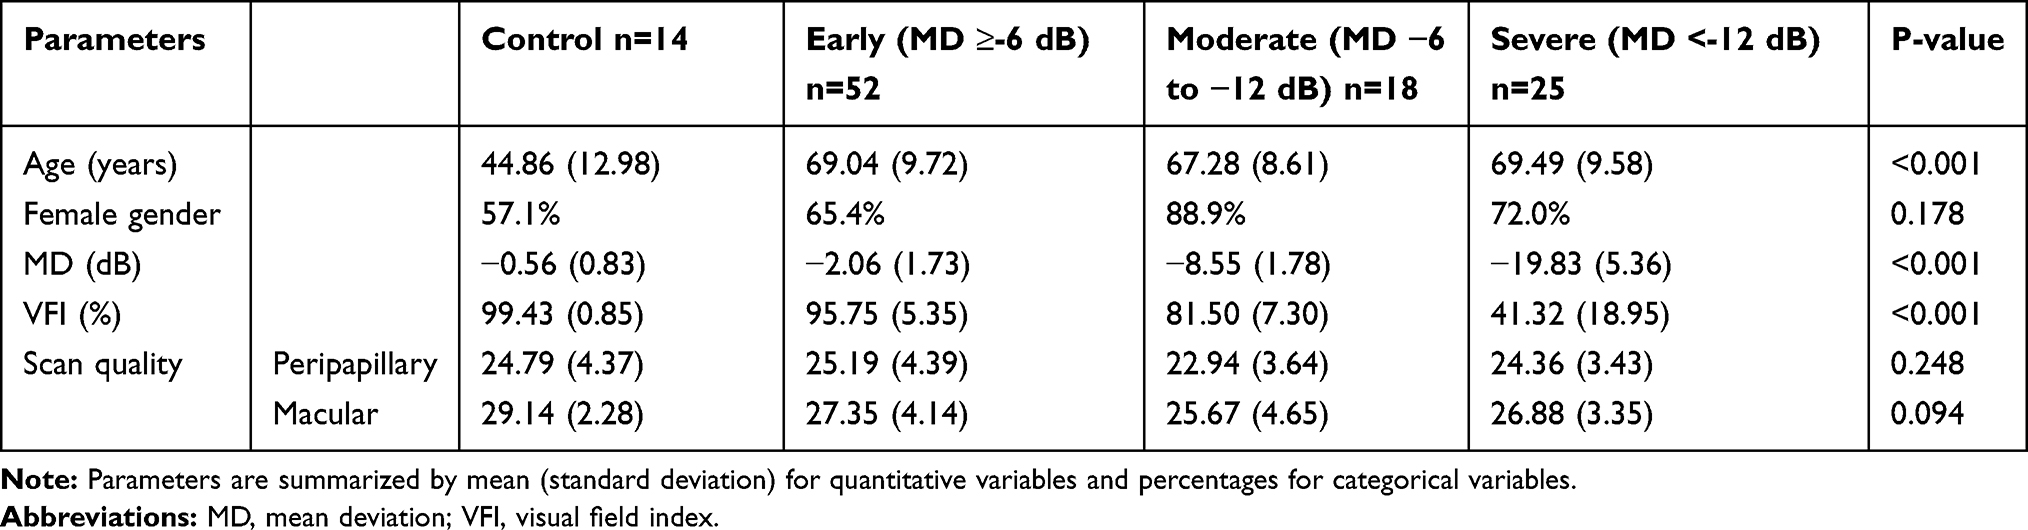 |
Table 1 Demographic, Visual Field and OCT Characteristics of Study Participants |
The comparisons of the mean thickness of cRNFL, mRNFL, GCL, IPL, GCIPL, and GCC in the inner and outer circles are described in Table 2. The mean thickness of the layers aforementioned were significantly different between the 4 groups (P < 0.001), with progressively decreasing mean thicknesses from the control group to the severe glaucoma group. These parameters were significantly different across groups in the pairwise analysis of control vs early, moderate, and severe; early vs severe; and moderate vs severe. The early and moderate glaucoma groups, when paired, did not differ significantly in inferior cRNFL, mRNFL, GCL, IPL, GCIPL, and GCC (inner and outer circles). The inner circle of mRNFL was not significantly different between the moderate and control groups, while the outer circle of IPL was not significantly different between the early and control groups. Measurements of the GCL and IPL in a representative patient with moderate glaucoma are depicted in Figure 2.
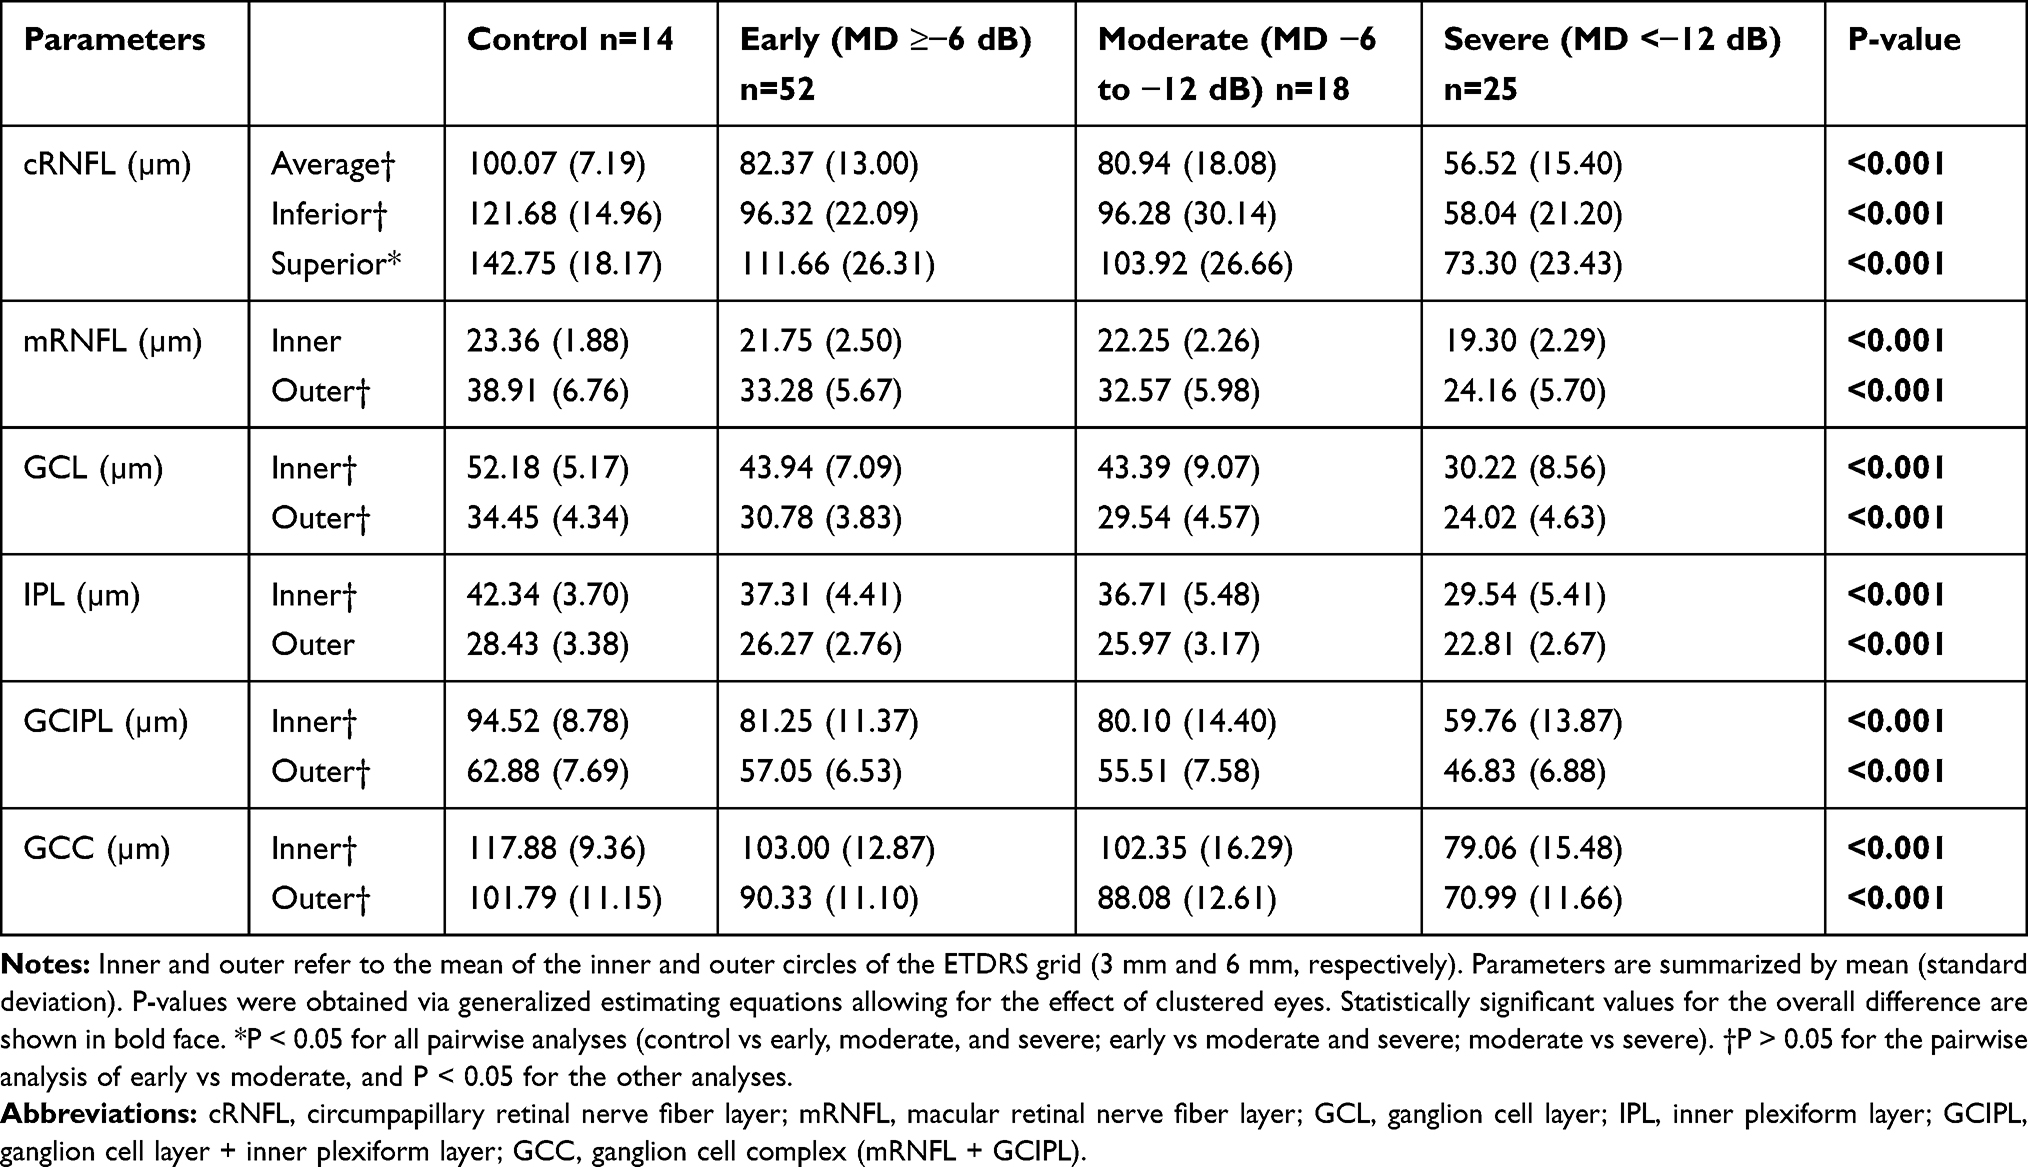 |
Table 2 Comparison of Circumpapillary Retinal Nerve Fiber Layer, Macular Retinal Nerve Fiber Layer, Ganglion Cell Layer, and Inner Plexiform Layer Thicknesses Between Control and Glaucoma Groups |
The additional macular retinal layer thicknesses in the inner and outer circles are described in Table 3. TMT was significantly thicker in controls than in the early, moderate, and severe glaucoma groups (P < 0.001). INL showed a significant overall difference between the 4 groups, but the inner and outer circles of INL were thicker in the severe glaucoma group than in the control (P = 0.405 and P = 0.012, respectively) and early glaucoma groups (P = 0.001 and P < 0.001, respectively). ONL thickness showed a significant overall difference in the inner circle (P = 0.020), but in the pairwise analysis, a significant difference was found only between the early and severe glaucoma groups (P = 0.003). The structure-function correlations of the cRNFL and macular parameters with the SAP MD are described in Table 4.
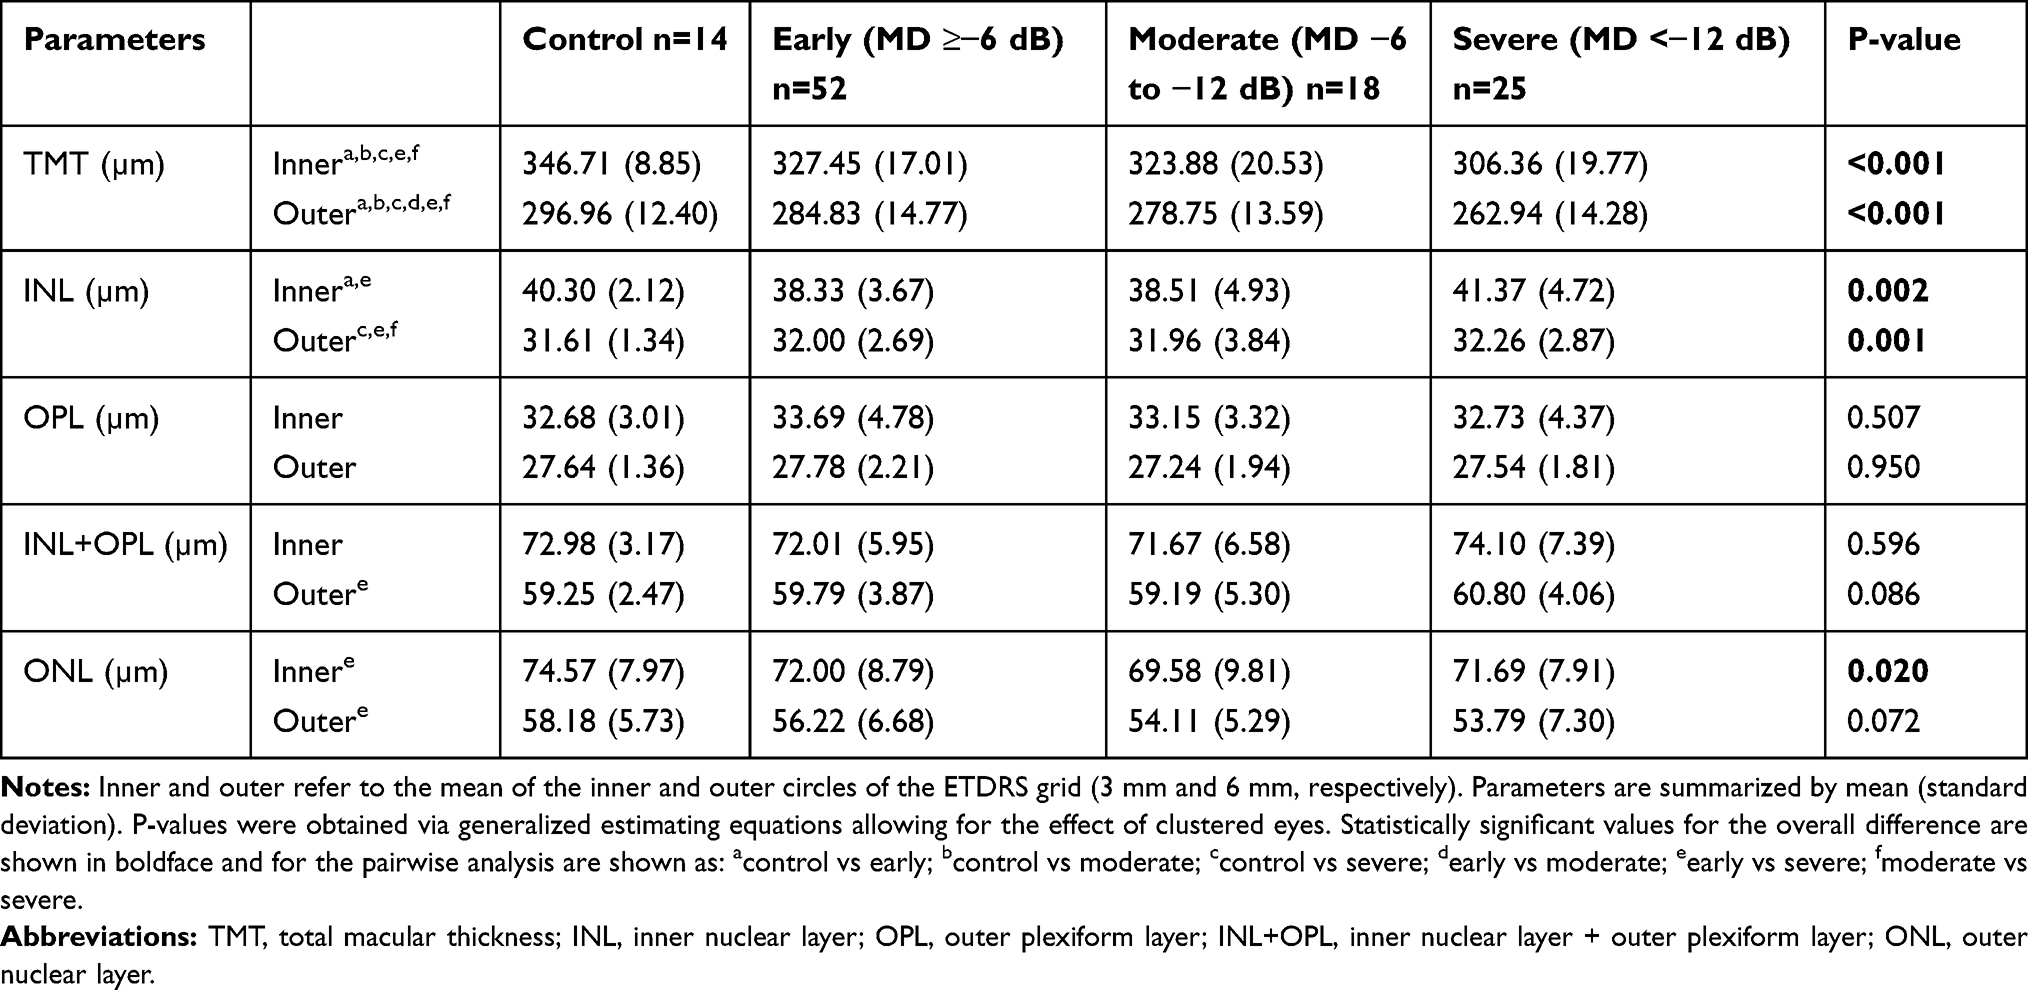 |
Table 3 Comparison of Additional Macular Layers Thicknesses Between Control and Glaucoma Groups |
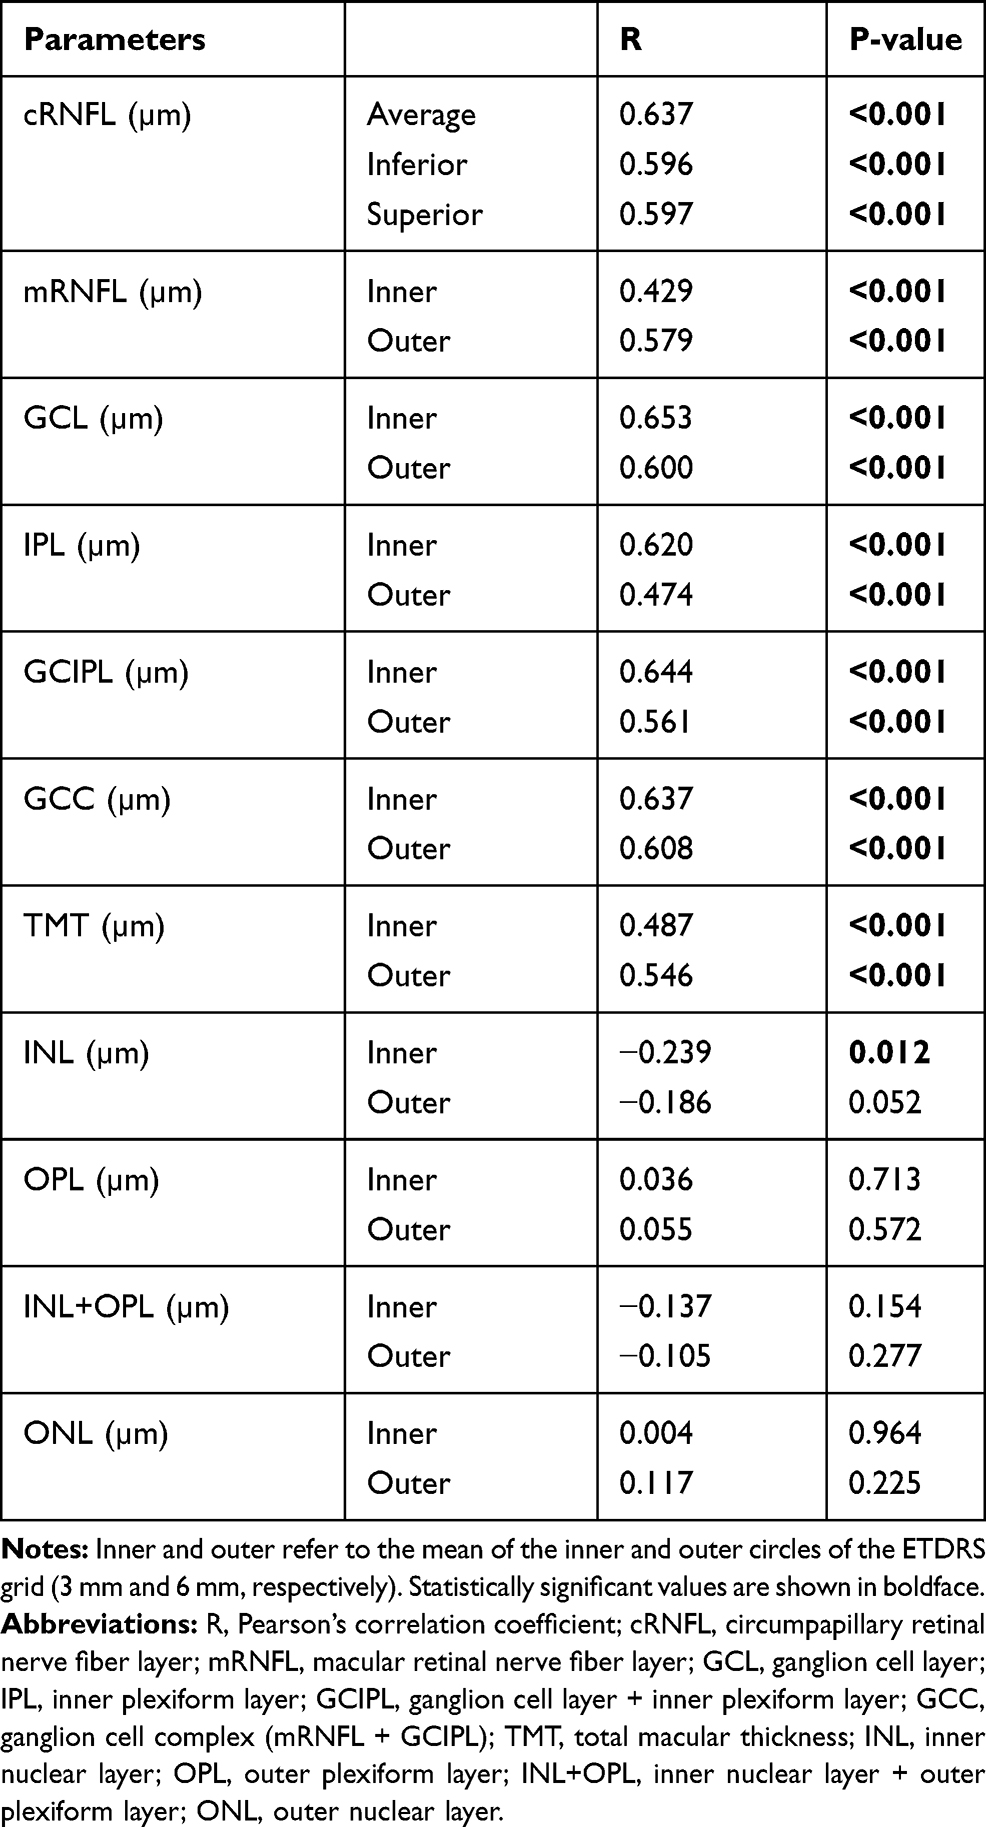 |
Table 4 Correlation Between the Circumpapillary RNFL and Macular Retinal Layer Thicknesses with the Mean Deviation of the Standard Automated Perimetry |
Discussion
The present study evaluated individual macular layer thicknesses in patients with different stages of glaucoma and compared them with data from controls. We demonstrated that mRNFL, GCL, and IPL in the inner and outer circles were thinner in patients with glaucoma than in controls, and that these layers became thinner with increasing severity of glaucoma. We also demonstrated a significantly thicker INL and a significantly thinner ONL in severe vs early glaucoma.
Glaucoma diagnosis and monitoring rely on typical findings of the optic nerve, on perimetry, and more recently on OCT structural changes both in the optic nerve head, peripapillary region and macula.3,4,7,11,31 In a meta-analysis of the use of OCT in glaucoma diagnosis, the diagnostic ability of cRNFL was superior to that of TMT and similar to that of GCC and GCIPL, but individual macular layer measurements and comparison across severity groups was not evaluated.5
In a previous study using the ETDRS grid Pazos et al compared the mean thickness of each layer in each ETDRS sector between normal and early glaucomatous eyes and, similar to our study, reported differences in cRNFL, mRNFL, GCL, IPL, and total retinal thickness.36 Another study also divided the macula into 9 regions and compared normal with early glaucomatous eyes, but only total retinal thickness was analyzed—statistically significant differences were found in all regions, except for the fovea.35 In our analysis, the central macular circle (1 mm) was excluded. This region has the highest density of cones and is mostly composed of them.45 Therefore, including it in the analysis could underestimate the other layers.
Macular layer evaluation in glaucoma with SD-OCT have shown that the mRNFL, GCL, GCIPL and GCC have comparable diagnostic ability to cRNFL in detecting glaucoma.5,34 In severe stages, there is limited use of cRNFL due to the floor effect and visual field changes are more common than OCT’s.22,23,46 Macular inner layers have been demonstrated to be useful for evaluating severe stages of glaucoma.25–27 Similar to our study, Unterlauft et al showed that in advanced disease, the macular RNFL, GCL and IPL were thinner than in controls. However, they found no difference in the ONL and OPL thickness.47
In the present study, INL was thicker in the severe glaucoma group than in the control (P > 0.05) and early glaucoma groups (P < 0.01). Microcystic INL lesions, similar to what is observed in other optic neuropathies, such as neuromyelitis optica and multiple sclerosis, have been reported to occur in glaucoma.48–51 In a study by Hasegawa et al, these lesions have been found to be more prevalent in eyes with advanced glaucoma and are associated with worse MD slope.52 Although no evident cysts were noted in the INL of patients included in our study, subclinical lesions might account for the INL thickening observed. The mechanism of microcyst formation is not yet fully understood, but retrograde transcellular degeneration, Muller cell dysfunction and vitreous traction may play a role in the development of these microcysts.53–55
In our sample, the inner sector of ONL was significantly thinner in severe than in early glaucomatous eyes (71.69 vs 72.00 µm, P = 0.003), but it did not differ from the controls (71.69 vs 74.57 µm, P = 0.782). This might not have been significant due to the low number of patients in the control group. When comparing normal with early glaucomatous eyes, no difference was found in ONL thickness, which is consistent with the findings of a previous study.36
Involvement of the ONL and the outer layers of the retina in glaucoma remains controversial. Increased ONL thickness in the fovea has been reported and might be a manifestation of enlargement of the cone nuclei and swelling of the somata.56,57 In the parafoveal region, some studies found no significant difference in ONL thickness between normal and glaucomatous eyes,58,59 but one study60 reported thicker outer retinal complex (ONL + photoreceptor layer) in glaucoma, which was attributed probably to the inclusion of more structural elements than intended. Losses in cone density and thinning of the photoreceptor outer segments have been reported in patients with glaucoma manifesting long-term VF loss.61,62
This study has some limitations. First, we excluded patients with diabetic macular edema and age-related macular degeneration, common comorbidities in the age group of the participants. We also excluded patients with macular conditions that could affect the segmentation of individual macular layers. Thus, the results of this study may not be generalizable to patients with other ocular diseases. In addition, the controls in our study were significantly younger than the patients with glaucoma, and the age-related loss of neural tissue in older patients might bias the results. A reproducibility study to assess the repeatability of the segmentation method was not performed, because the data were obtained by using the automated segmentation tool within a commercially available device. Nevertheless, segmentation was checked in every scan of every layer in all eyes. Finally, the lack of a normative database of the macular layers for the Spectralistm software using the ETDRS grid does not allow us to calculate how many patients are within the normal range.
In conclusion, our findings indicate that individual macular layer evaluation with the segmentation tool and the sectors of the ETDRS grid within the commercially available SD-OCT can be used to evaluate different stages of glaucoma. The INL thickening and ONL thinning found in advanced glaucoma in our study should be further validated and explored in basic science research settings. Longitudinal studies of these parameters are needed to determine their usefulness in the diagnosis and monitoring of glaucoma.
Acknowledgments
This study was partially presented as a poster at the Association of Research in Vision and Ophthalmology (ARVO) meeting 2019 in Vancouver, Canada.
Disclosure
The authors have no conflicts of interest to disclose.
References
1. Pascolini D, Mariotti SP. Global estimates of visual impairment: 2010. Br J Ophthalmol. 2012;96(5):614. doi:10.1136/bjophthalmol-2011-300539
2. Quigley HA. The number of people with glaucoma worldwide in 2010 and 2020. Br J Ophthalmol. 2006;90(3):262. doi:10.1136/bjo.2005.081224
3. Kotowski J, Wollstein G, Ishikawa H, Schuman JS. Imaging of the optic nerve and retinal nerve fiber layer: an essential part of glaucoma diagnosis and monitoring. Surv Ophthalmol. 2014;59(4):458–467. doi:10.1016/j.survophthal.2013.04.007
4. Quigley HA. Glaucoma. The Lancet. 2011;377(9774):1367–1377. doi:10.1016/S0140-6736(10)61423-7
5. Kansal V, Armstrong JJ, Pintwala R, Hutnik C. Optical coherence tomography for glaucoma diagnosis: an evidence based meta-analysis. PLoS One. 2018;13(1):e0190621. doi:10.1371/journal.pone.0190621
6. Leung CK-S. Diagnosing glaucoma progression with optical coherence tomography. Curr Opin Ophthalmol. 2014;25(2):104–111. doi:10.1097/ICU.0000000000000024
7. Grewal DS, Tanna AP. Diagnosis of glaucoma and detection of glaucoma progression using spectral domain optical coherence tomography. Curr Opin Ophthalmol. 2013;24(2):150–161. doi:10.1097/ICU.0b013e32835d9e27
8. Schuman J, Hee M, Arya A, et al. Optical Coherence Tomography: A New Tool for Glaucoma Diagnosis. 1995.
9. Huang D, Swanson E, Lin C, et al. Optical coherence tomography. Science. 1991;254(5035):1178. doi:10.1126/science.1957169
10. Yang Z, Tatham AJ, Weinreb RN, et al. Diagnostic ability of macular ganglion cell inner plexiform layer measurements in glaucoma using swept source and spectral domain optical coherence tomography. PLoS One. 2015;10(5):e0125957. doi:10.1371/journal.pone.0125957
11. Sharma P, Sample PA, Zangwill LM, Schuman JS. Diagnostic tools for glaucoma detection and management. Surv Ophthalmol. 2008;53(6):S17–S32. doi:10.1016/j.survophthal.2008.08.003
12. Zeimer R, Asrani S, Zou S, et al. Quantitative detection of glaucomatous damage at the posterior pole by retinal thickness mapping. Ophthalmology. 1998;105(2):224–231. doi:10.1016/S0161-6420(98)92743-9
13. Sung KR, Wollstein G, Kim NR, et al. Macular assessment using optical coherence tomography for glaucoma diagnosis. Br J Ophthalmol. 2012;96(12):1452. doi:10.1136/bjophthalmol-2012-301845
14. Traynis I, De Moraes CG, Raza AS, et al. Prevalence and nature of early glaucomatous defects in the central 10° of the visual field. JAMA Ophthalmol. 2014;132:291–297. doi:10.1001/jamaophthalmol.2013.7656
15. Heijl A, Lundqvist L. The frequency distribution of earliest glaucomatous visual field defects documented by automatic perimetry. Acta Ophthalmol (Copenh). 1984;62(4):658–664. doi:10.1111/j.1755-3768.1984.tb03979.x
16. Drance SM. The early field defects in glaucoma. Invest Ophthalmol Vis Sci. 1969;8:84–91.
17. Schiefer U, Papageorgiou E, Sample PA, et al. Spatial pattern of glaucomatous visual field loss obtained with regionally condensed stimulus arrangements. Invest Ophthalmol Vis Sci. 2010;51(11):5685–5689. doi:10.1167/iovs.09-5067
18. Hood DC, Raza AS, de Moraes CGV, et al. Initial arcuate defects within the central 10 degrees in glaucoma. Invest Ophthalmol Vis Sci. 2011;52(2):940–946. doi:10.1167/iovs.10-5803
19. Harwerth RS, Carter-Dawson L, Shen F, et al. Ganglion cell losses underlying visual field defects from experimental glaucoma. Invest Ophthalmol Vis Sci. 1999;40(10):2242–2250.
20. Hood DC, Raza AS, de Moraes CGV, et al. Glaucomatous damage of the macula. Prog Retin Eye Res. 2013;32:1–21. doi:10.1016/j.preteyeres.2012.08.003
21. Chan CKM, Miller NR. Peripapillary nerve fiber layer thickness measured by optical coherence tomography in patients with no light perception from long-standing nonglaucomatous optic neuropathies. J Neuroophthalmol. 2007;27(3):176–179. doi:10.1097/WNO.0b013e31814b1ac4
22. Mwanza J-C, Budenz DL, Warren JL, et al. Retinal nerve fibre layer thickness floor and corresponding functional loss in glaucoma. Br J Ophthalmol. 2015;99(6):732. doi:10.1136/bjophthalmol-2014-305745
23. Bowd C, Zangwill LM, Weinreb RN, et al. Estimating optical coherence tomography structural measurement floors to improve detection of progression in advanced glaucoma. Am J Ophthalmol. 2017;175:37–44. doi:10.1016/j.ajo.2016.11.010
24. de Moraes CG, Liebmann JM, Medeiros FA, Weinreb RN. Management of advanced glaucoma: characterization and monitoring. Surv Ophthalmol. 2016;61(5):597–615. doi:10.1016/j.survophthal.2016.03.006
25. Lavinsky F, Wu M, Schuman JS, et al. Can macula and optic nerve head parameters detect glaucoma progression in eyes with advanced circumpapillary retinal nerve fiber layer damage? Ophthalmology. 2018;125:1907–1912.
26. Belghith A, Medeiros FA, Bowd C, et al. Structural change can be detected in advanced-glaucoma eyes. Invest Ophthalmol Vis Sci. 2016;57(9):511–518. doi:10.1167/iovs.15-18929
27. Shin JW, Sung KR, Lee GC, et al. Ganglion cell–inner plexiform layer change detected by optical coherence tomography indicates progression in advanced glaucoma. Ophthalmology. 2017;124(10):1466–1474. doi:10.1016/j.ophtha.2017.04.023
28. Wollstein G, Schuman JS, Price LL, et al. Optical coherence tomography (OCT) macular and peripapillary retinal nerve fiber layer measurements and automated visual fields. Am J Ophthalmol. 2004;138(2):218–225. doi:10.1016/j.ajo.2004.03.019
29. Guedes V, Schuman JS, Hertzmark E, et al. Optical coherence tomography measurement of macular and nerve fiber layer thickness in normal and glaucomatous human eyes. Ophthalmology. 2003;110(1):177–189. doi:10.1016/S0161-6420(02)01564-6
30. Leung CKS, Chan W-M, Yung W-H, et al. Comparison of macular and peripapillary measurements for the detection of glaucoma. Ophthalmology. 2005;112(3):391–400. doi:10.1016/j.ophtha.2004.10.020
31. Medeiros FA, Zangwill LM, Bowd C, et al. Evaluation of retinal nerve fiber layer, optic nerve head, and macular thickness measurements for glaucoma detection using optical coherence tomography. Am J Ophthalmol. 2005;139(1):44–55. doi:10.1016/j.ajo.2004.08.069
32. Ojima T, Tanabe T, Hangai M. Measurement of retinal nerve fiber layer thickness and macular volume for glaucoma detection using optical coherence tomography. Jpn J Ophthalmol. 2007;51:197–203. doi:10.1007/s10384-006-0433-y
33. Mori S, Hangai M, Sakamoto A, Yoshimura N. Spectral-domain optical coherence tomography measurement of macular volume for diagnosing glaucoma. J Glaucoma. 2010;19:528–534. doi:10.1097/IJG.0b013e3181ca7acf
34. Kim HJ, Lee S-Y, Park KH, et al. Glaucoma diagnostic ability of layer-by-layer segmented ganglion cell complex by spectral-domain optical coherence tomography. Invest Ophthalmol Vis Sci. 2016;57(11):4799–4805. doi:10.1167/iovs.16-19214
35. Nakatani Y, Higashide T, Ohkubo S, et al. Evaluation of macular thickness and peripapillary retinal nerve fiber layer thickness for detection of early glaucoma using spectral domain optical coherence tomography. J Glaucoma. 2011;20(4):252–259. doi:10.1097/IJG.0b013e3181e079ed
36. Pazos M, Dyrda AA, Biarnés M, et al. Diagnostic accuracy of spectralis SD OCT automated macular layers segmentation to discriminate normal from early glaucomatous eyes. Ophthalmology. 2017;124(8):1218–1228. doi:10.1016/j.ophtha.2017.03.044
37. Seong M, Sung KR, Choi EH, et al. Macular and peripapillary retinal nerve fiber layer measurements by spectral domain optical coherence tomography in normal-tension glaucoma. Invest Ophthalmol Vis Sci. 2010;51(3):1446–1452. doi:10.1167/iovs.09-4258
38. Mwanza J-C, Durbin MK, Budenz DL, et al. Glaucoma diagnostic accuracy of ganglion cell–inner plexiform layer thickness: comparison with nerve fiber layer and optic nerve head. Ophthalmology. 2012;119(6):1151–1158. doi:10.1016/j.ophtha.2011.12.014
39. Mayama C, Saito H, Hirasawa H, et al. Diagnosis of early-stage glaucoma by grid-wise macular inner retinal layer thickness measurement and effect of compensation of disc-fovea inclinationdiagnosis of early-stage glaucoma. Invest Ophthalmol Vis Sci. 2015;56(9):5681–5690. doi:10.1167/iovs.15-17208
40. Kotowski J, Folio LS, Wollstein G, et al. Glaucoma discrimination of segmented cirrus spectral domain optical coherence tomography (SD-OCT) macular scans. Br J Ophthalmol. 2012;96(11):1420. doi:10.1136/bjophthalmol-2011-301021
41. Chen M-J, Yang H-Y, Chang Y-F, et al. Diagnostic ability of macular ganglion cell asymmetry in Preperimetric Glaucoma. BMC Ophthalmol. 2019;19(1):12. doi:10.1186/s12886-018-1019-4
42. Jeoung JW, Choi YJ, Park KH, Kim DM. Macular ganglion cell imaging study: glaucoma diagnostic accuracy of spectral-domain optical coherence tomography. Invest Ophthalmol Vis Sci. 2013;54(7):4422–4429. doi:10.1167/iovs.12-11273
43. Kim NR, Lee ES, Seong GJ, et al. Structure–function relationship and diagnostic value of macular ganglion cell complex measurement using fourier-domain OCT in glaucoma. Invest Ophthalmol Vis Sci. 2010;51(9):4646–4651. doi:10.1167/iovs.09-5053
44. Anderson DR, Patella VM. Automated Static Perimetry.
45. Jonas JB, Schneider U, Naumann GO. Count and density of human retinal photoreceptors. Graefes Arch Clin Exp Ophthalmol. 1992;230(6):505–510. doi:10.1007/BF00181769
46. Nguyen AT, Greenfield DS, Bhakta AS, et al. Detecting glaucoma progression using guided progression analysis with OCT and visual field assessment in eyes classified by international classification of disease severity codes. Ophthalmol Glaucoma. 2019;2(1):36–46. doi:10.1016/j.ogla.2018.11.004
47. Unterlauft JD, Rehak M, Böhm MRR, Rauscher FG. Analyzing the impact of glaucoma on the macular architecture using spectral-domain optical coherence tomography. PLoS One. 2019;13(12):e0209610. doi:10.1371/journal.pone.0209610
48. Barboni P, Carelli V, Savini G, et al. Microcystic macular degeneration from optic neuropathy: not inflammatory, not trans-synaptic degeneration. Brain. 2013;136(7):e239–e239. doi:10.1093/brain/awt014
49. Saidha S, Sotirchos ES, Ibrahim MA, et al. Microcystic macular oedema, thickness of the inner nuclear layer of the retina, and disease characteristics in multiple sclerosis: a retrospective study. Lancet Neurol. 2012;11(11):963–972. doi:10.1016/S1474-4422(12)70213-2
50. Gelfand JM, Cree BA, Nolan R, et al. Microcystic inner nuclear layer abnormalities and neuromyelitis optica. JAMA Neurol. 2013;70(5):629–633. doi:10.1001/jamaneurol.2013.1832
51. Kaufhold F, Zimmermann H, Schneider E, et al. Optic neuritis is associated with inner nuclear layer thickening and microcystic macular edema independently of multiple sclerosis. PLoS One. 2013;8(8):e71145. doi:10.1371/journal.pone.0071145
52. Hasegawa T, Akagi T, Yoshikawa M, et al. Microcystic inner nuclear layer changes and retinal nerve fiber layer defects in eyes with glaucoma. PLoS One. 2015;10(6):e0130175. doi:10.1371/journal.pone.0130175
53. Abegg M, Zinkernagel M, Wolf S. Microcystic macular degeneration from optic neuropathy. Brain. 2012;135(12):e225–e225. doi:10.1093/brain/aws215
54. Balk LJ, Killestein J, Polman CH, et al. Microcystic macular oedema confirmed, but not specific for multiple sclerosis. Brain. 2012;135(12):e226–e226. doi:10.1093/brain/aws216
55. Lujan BJ, Horton JC. Microcysts in the inner nuclear layer from optic atrophy are caused by retrograde trans-synaptic degeneration combined with vitreous traction on the retinal surface. Brain. 2013;136(11):e260–e260. doi:10.1093/brain/awt154
56. Fan N, Huang N, Lam DSC, Leung CK-S. Measurement of photoreceptor layer in glaucoma: a spectral-domain optical coherence tomography study. J Ophthalmol. 2011;2011:264803. doi:10.1155/2011/264803
57. Nork TM, Ver Hoeve JN, Poulsen GL, et al. Swelling and loss of photoreceptors in chronic human and experimental glaucomas. JAMA Ophthalmol. 2000;118:235–245.
58. Kendell KR, Quigley HA, Kerrigan LA, et al. Primary open-angle glaucoma is not associated with photoreceptor loss. Invest Ophthalmol Vis Sci. 1995;36:200–205.
59. Wygnanski T, Desatnik H, Quigley HA, Glovinsky Y. Comparison of ganglion cell loss and cone loss in experimental glaucoma. Am J Ophthalmol. 1995;120(2):184–189. doi:10.1016/S0002-9394(14)72606-6
60. Ishikawa H, Stein DM, Wollstein G, et al. Macular segmentation with optical coherence tomography. Invest Ophthalmol Vis Sci. 2005;46:2012–2017. doi:10.1167/iovs.04-0335
61. Choi SS, Zawadzki RJ, Lim MC, et al. Evidence of outer retinal changes in glaucoma patients as revealed by ultrahigh-resolution in vivo retinal imaging. Br J Ophthalmol. 2011;95(1):131. doi:10.1136/bjo.2010.183756
62. Werner JS, Keltner JL, Zawadzki RJ, Choi SS. Outer retinal abnormalities associated with inner retinal pathology in nonglaucomatous and glaucomatous optic neuropathies. Eye Lond Engl. 2011;25:279–289.
 © 2020 The Author(s). This work is published and licensed by Dove Medical Press Limited. The
full terms of this license are available at https://www.dovepress.com/terms
and incorporate the Creative Commons Attribution
- Non Commercial (unported, 3.0) License.
By accessing the work you hereby accept the Terms. Non-commercial uses of the work are permitted
without any further permission from Dove Medical Press Limited, provided the work is properly
attributed. For permission for commercial use of this work, please see paragraphs 4.2 and 5 of our Terms.
© 2020 The Author(s). This work is published and licensed by Dove Medical Press Limited. The
full terms of this license are available at https://www.dovepress.com/terms
and incorporate the Creative Commons Attribution
- Non Commercial (unported, 3.0) License.
By accessing the work you hereby accept the Terms. Non-commercial uses of the work are permitted
without any further permission from Dove Medical Press Limited, provided the work is properly
attributed. For permission for commercial use of this work, please see paragraphs 4.2 and 5 of our Terms.