Back to Journals » Journal of Pain Research » Volume 18
Individual Autonomic Profiles Influence Brain–Heart Connectivity in Tonic Pain
Authors Aulenkamp JL ![]() , Nedergaard RB
, Nedergaard RB ![]() , Niazi IK
, Niazi IK ![]() , Liao D
, Liao D ![]() , Kuhlmann L
, Kuhlmann L ![]() , Rojas F
, Rojas F ![]() , Rasool K
, Rasool K ![]() , Phillips AE
, Phillips AE ![]() , Yadav D, De-Madaria E, Hegyi P, Garg P, Olesen SS, Jagannath S, Hagn-Meincke R, Hajnády Z, Brock C
, Yadav D, De-Madaria E, Hegyi P, Garg P, Olesen SS, Jagannath S, Hagn-Meincke R, Hajnády Z, Brock C ![]() , Drewes AM
, Drewes AM
Received 18 May 2025
Accepted for publication 29 September 2025
Published 11 November 2025 Volume 2025:18 Pages 6023—6036
DOI https://doi.org/10.2147/JPR.S526855
Checked for plagiarism Yes
Review by Single anonymous peer review
Peer reviewer comments 2
Editor who approved publication: Dr Karina Gritsenko
Jana Luisa Aulenkamp,1– 3 Rasmus B Nedergaard,1 Imran Khan Niazi,4,5 Donghua Liao,1 Louise Kuhlmann,1 Fredy Rojas,4 Kamran Rasool,4 Anna Evans Phillips,6 Dhiraj Yadav,6 Enrique De-Madaria,7,8 Peter Hegyi,9– 11 Pramod Garg,12 Søren Schou Olesen,1 Soumya Jagannath,12 Rasmus Hagn-Meincke,1 Zoltán Hajnády,9,11 Christina Brock,1 Asbjørn M Drewes1
1Department of Gastroenterology and Hepatology, Centre for Pancreatic Diseases and Mech-Sense, Aalborg University Hospital, Aalborg, Denmark; 2Department of Anesthesiology and Intensive Care Medicine, University Hospital Essen, University Duisburg-Essen, Essen, Germany; 3Department of Neurology, Center for Translational Neuro- and Behavioral Sciences (C-TNBS), University Hospital Essen, University of Duisburg-Essen, Essen, Germany; 4Centre for Chiropractic Research, New Zealand College of Chiropractic, Auckland, 1060, New Zealand; 5Department of Health Science and Technology, Aalborg University, Aalborg, Denmark; 6Division of Gastroenterology, Hepatology & Nutrition, Department of Medicine, University of Pittsburgh, Pittsburgh, PA, USA; 7Hospital General Universitario Dr. Balmis-ISABIAL, Alicante, Spain; 8Department of Clinical Medicine, Miguel Hernández University, Elche, Spain; 9Institute of Pancreatic Diseases, Semmelweis University, Budapest, Hungary; 10Centre for Translational Medicine, Semmelweis University, Budapest, Hungary; 11Institute for Translational Medicine, Medical School, University of Pecs, Pecs, Hungary; 12Department of Gastroenterology, All India Institute of Medical Science, New Delhi, India
Correspondence: Jana Luisa Aulenkamp, Mech-Sense, Aalborg University Hospital, Department of Gastroenterology and Hepatology, Mølleparkvej 4, Aalborg, Denmark, Tel +49 201 723 – 84423, Fax +49 201/723-5949, Email [email protected]
Introduction: Acute pain elicits distinct autonomic responses. Electroencephalography (EEG) and heart rate variability (HRV) provide insights into autonomic and cortical activity to pain, but they often fail to capture the integrated dynamics of brain–heart connectivity. This exploratory study used raw electrocardiogram (ECG) and EEG signals to investigate brain–heart coherence during resting and tonic experimental pain, aiming to detect direct electrical coupling patterns, and explored the influence of individual autonomic response in healthy participants.
Methods: EEG, raw ECG data and HRV were collected from 33 healthy participants under two conditions: rest and a cold pressor test where subjects immersed their hand into ice water (tonic pain). HRV parameters were extracted to quantify autonomic dynamics in response to pain. Magnitude-squared coherence (MSC) quantified brain–heart connectivity across frequency bands (delta, theta, alpha, beta, gamma), and participants were stratified into subgroups based on changes in periodic repolarization dynamics (PRD), a marker of sympathetic modulation.
Results: Brain–heart coherence remained stable across conditions, reflecting robust coupling, particularly in delta bands, for both conditions. On group-level HRV analysis revealed increased sympathetic response to pain, evidenced by decreased normal-to-normal interval (p < 0.001) and faster heart rates (p < 0.001). In an exploratory analysis, elevated MSC values (all p< 0.05) were seen in theta (Fp1, Cz), alpha-2 (T3, P4), and gamma (Fp1, Pz, T3, P4, O2) bands in the group where PRD decreased (n=16) compared to the group where it increased (n=17).
Discussion: These findings highlight the stability of brain–heart coherence during resting and tonic pain in healthy individuals. However, individual autonomic profiles influenced coherence, with enhanced synchronization in the PRD-decreased group and reduced synchronization in the PRD-increased group. These preliminary findings, limited by the exploratory nature and sparse setup, require validation in studies with denser electrode arrays. Coherence analysis provides nuanced insights into brain–heart dynamics, advancing the understanding beyond single-system measures.
Keywords: heart rate variability, electrocardiogram, electroencephalogram, interoception
Introduction
Pain poses a substantial burden to patients and elicits distinct physiological changes, including alterations in cortical activity and autonomic nervous system regulation.1–4 The underlying mechanisms of the sensory integration and autonomic responses to pain remain incompletely understood. While the connectivity between brain and heart has been studied in response to physiological and pathological conditions,5–8 its role in response to acute pain remains underexplored.
This bidirectional brain–heart communication is mediated through distinct pathways, neural, mechanical, and biochemical, each contributing uniquely to sensory and autonomic integration.9 Mechanical pathways involve mechanosensitive Piezo channels transducing mechanical forces into electrical signals, while biochemical pathways comprise endogenous compounds mediating cardiovascular–neural interactions.9
The neural pathway involves the autonomic nervous system, which is regulated by the central autonomic network10,11 and maintains homeostasis by modulating functions such as heart rate and digestion.12 The central autonomic network encompasses key integration centers including the hypothalamus, nucleus tractus solitarius, and ventrolateral medulla, which coordinate autonomic responses and integrate visceral afferent information. Comprising the sympathetic, parasympathetic and somatosensory pathways, it plays a central role in brain–heart connectivity, with the vagus nerve facilitating communication between the heart, the brainstem and from there to cortical areas.11,13,14 Enhanced vagal activity can inhibit nociceptive pathways at the spinal cord and lower brainstem, suggesting that pain processing involves coordinated autonomic modulation.15
Contrary to earlier views of unidirectional brain control, brain and heart engage in reciprocal signaling, regulating bodily functions and integrating interoceptive information.16 With each heartbeat, arterial baroreceptors transduce mechanical stretch into neural signals, which ascend to the nucleus tractus solitarius, where cardiovascular and nociceptive inputs converge.13,17 This pathway modulates cortical excitability and pain processing across the cardiac cycle, with reduced pain sensitivity during the systole when baroreceptor activity is maximal, shaped by cognitive–affective factors such as expectancy.18–21
Electrocardiography (ECG) and electroencephalography (EEG) are widely used methods for studying autonomic responses due to their temporal precision and non-invasiveness.2,22,23 EEG directly measures cortical electrical activity and modulation across multiple frequency bands reflects changes, eg, in nociceptive processing.3,4 Heart rate variability, calculated from ECG, quantifies autonomic activity and is influenced by both sympathetic and parasympathetic activity.1,23,24 Advanced measures such as periodic repolarization dynamics (PRD), offer additional insights into modulation, which likely reflects the instantaneous instability of repolarization, on the ventricular myocardium associated with the sympathetic nervous system.23,25 While both methods have documented changes in response to pain, inconsistent findings – such as contradictory changes in ECG parameters – highlight their limitations as standalone biomarkers of pain.2,22,26
Similarities in oscillatory alterations of EEG and ECG, encouraged the application of frequency EEG-ECG coherence analysis use methods such as magnitude-squared coherence (MSC27,28) This technique quantifies the degree of connection between EEG and ECG signals at specific frequencies, revealing functional coupling between the brain and heart.27 MSC has been widely used to explore interactions in contexts such as sleep, stress, and pathological conditions, eg, sepsis,16,29–31 demonstrating its utility in identifying patterns of connectivity that traditional measures may overlook.32,33 By measuring shared oscillatory activity, MSC provides a framework to investigate how tonic pain alters brain–heart connectivity.32,33
Considering previous EEG-ECG coherence studies30,31 and the capacity of healthy individuals to maintain adaptive mechanisms under acute pain,34 we hypothesized that1 brain–heart coherence would remain stable across rest and tonic pain conditions, however2 the presence of a sympathetic response, as exhibited in acute pain, determines whether coherence at the individual level is increased or decreased. To test theses hypothesis, our aim was to compare brain–heart connectivity between rest and tonic pain conditions in healthy individuals using EEG-ECG coherence designed for clinical feasibility. Secondly, we examined how individual autonomic response patterns influence brain–heart coherence during tonic pain by stratifying participants into subgroups based on changes in PRD, a marker of sympathetic modulation, allowing for a group-level comparison of coherence patterns relative to sympathetic modulation.
Methods
Participants
Healthy adult volunteers recruited from four centres of the International Pancreatic Pain Consortium (described in detail elsewhere35) were included in this analysis: University of Pittsburgh Medical Center (Pittsburgh, PA, USA), All India Institute of Medical Sciences (New Delhi, India), Semmelweis University (Budapest, Hungary), and Miguel Hernández University (Alicante, Spain). The Institutional Review Board approval was obtained at each site individually: Institutional Review Board of the University of Pittsburgh Medical Center (PRO17060648); Institute Ethics Committee of the All India Institute of Medical Sciences, New Delhi (IECPG-670/2255.1.11.2.2002200); National Center for Public Health and Pharmacy, Budapest (OGYÉI/58632-6/2023); and Ethics Committee for Drug Research of Alicante Health Department – General University Hospital (CEIm PI2023-093/ISABIAL 2023–0245).
The standardized screening process and exclusion criteria for pain studies in healthy volunteers followed our established procedures. All research procedures were conducted in accordance with the Declaration of Helsinki, and written informed consent was obtained from each participant prior to their inclusion in the study. In brief, any medical condition, current medication use, gastrointestinal complaints, or current symptoms of anxiety or depression led to exclusion. For the present analysis, data from a total of 33 healthy volunteers were available for analyses of EEG and HRV (see Table 1 for sample characteristics).
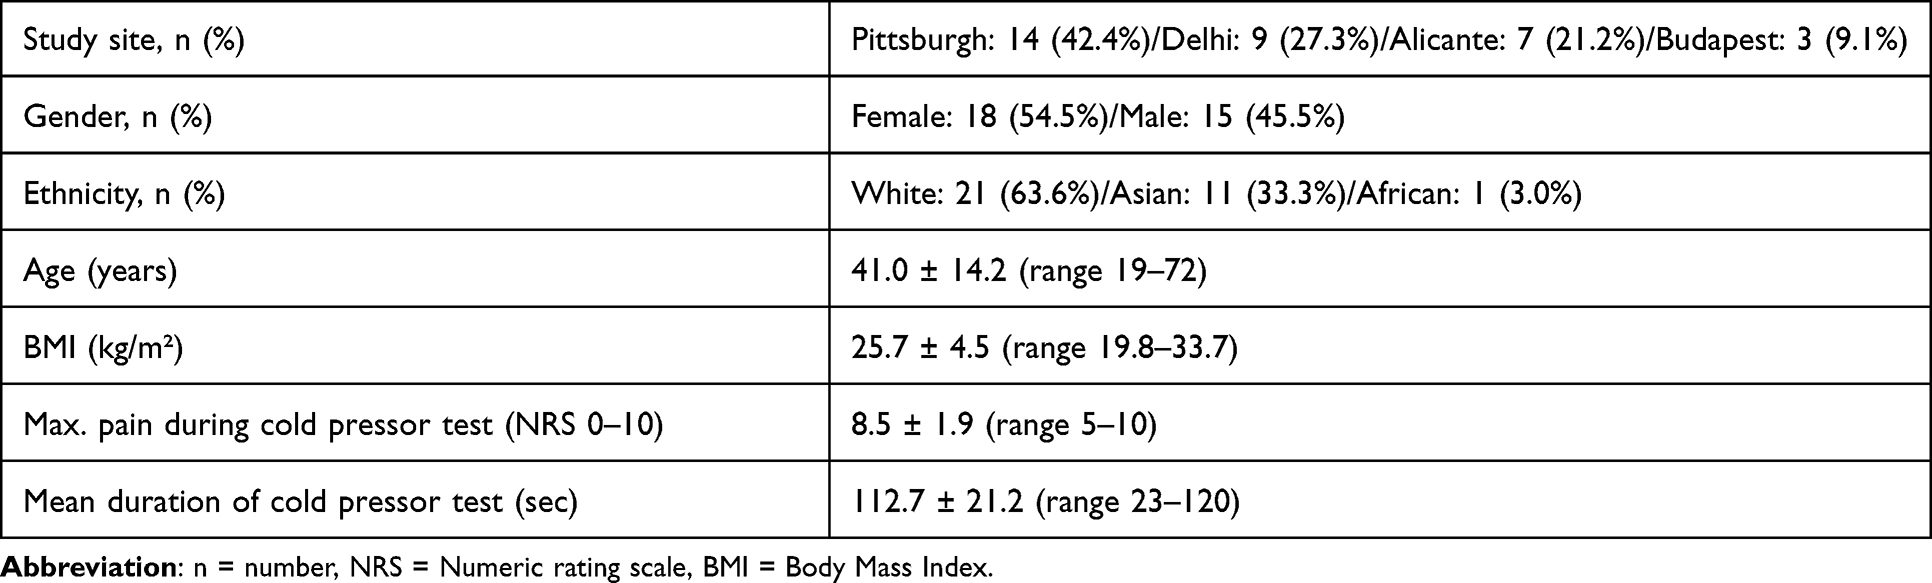 |
Table 1 Demographic and Experimental Pain Testing Characteristics of Included Healthy Participants |
Experimental Procedure
For EEG and ECG recordings (Figure 1), all participants were seated comfortably with their eyes closed and instructed to minimize movements. Each participant performed two recordings: resting state no pain and pain elicited by the cold pressor test (CPT). During CPT, the participants immersed their non-dominant hand in ice water, to induce tonic pain. This method, which elicits a clinically relevant acute pain, is associated with a strong sympathovagal response36,37 and has been used to investigate brain–heart connectivity.5,7 An initial baseline phase, no pain without any painful stimuli was a recording of two minutes in length, during which the subject was instructed to rest but not sleep. The tonic pain phase consisted of participants having their non-dominant hands submerged in cold water at 2 degrees Celsius and keeping their hands in the water for as long as possible, but no longer than 120 seconds. If the subject was not able to maintain their hand for the full 120 seconds, the time they were able to hold their hand was noted (n=6), and the EEG and ECG recording were stopped at the withdrawal of the hand. Participants rated the maximum pain during the “pain” condition on a Numeric Rating Scale (NRS) with the endpoints 0 = “no pain at all” to 10 = “the strongest pain imaginable”.
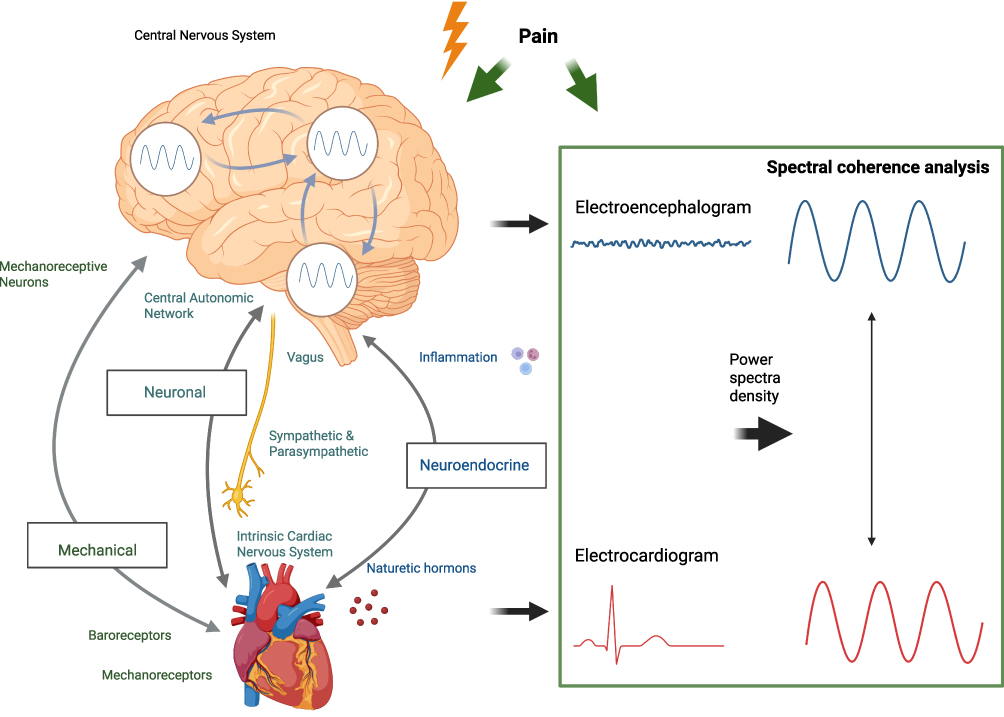 |
Figure 1 Illustration of the brain-heart connection and the process of spectral coherence analysis between electroencephalogram (EEG) and electrocardiogram (ECG) signals. On the left side, the brain represents the central nervous system, with the neural, mechanical and neuroendocrine pathways showing the reciprocal interaction between brain areas (not part of the analysis), which influences heart activity. Arrows denote the bidirectional communication pathways involved in brain-heart connection. On the right side, the spectral coherence analysis workflow is shown. EEG signals, representing brain electrical activity, and ECG signals, indicating heart rate variability, are captured and transformed into power spectral densities. These spectra are then used to assess coherence, shown as synchronized waveforms, which quantify the degree of coupling between EEG and ECG signals. This figure was created using biorender.org. |
Data Recording System
The skin was prepared with alcohol, and the area was shaved if needed for the ECG electrodes. For EEG recordings, a gel was used to bridge the connection between the scalp and electrodes. This study used a custom-built system from Norteklabs (WIBCI 16T) relying on two 8-channel Texas Instruments ADS1299 Analog-to-Digital Converters for biopotential measurements and data acquisition.23,38–40 These 8-channel chips were combined to create a 16-channel recording platform. The ECG was recorded using Wilson Tetrahedron 4‐leads ECG system.41,42
In a translational approach, this system has been successfully tested in EEG and ECG recording5,19 and offers the potential to be easily implemented in a clinical context. EEG was recorded using 10 EEG channels (FP1, FP2, Cz, P3, Pz, P4, T3, T4, O1, and O2) placed according to the 10–20 system using a 19-channel sintered EEG Electrode Cap (OpenBCI: Brooklyn, NY) at a sampling rate of 250 Hz with 24-bit resolution. The online reference electrode was positioned at CPz, while the ground/bias electrode was placed at AFz for noise cancellation and common grounding. No online filters were applied during acquisition to preserve raw signal characteristics. ECG was recorded using four ECG Ag/AgCl leads (20mm Blue Sensor, AMBU A/S, Denmark) placed in the EASI lead system, which consists of three electrodes placed horizontally along the line of the transverse level of the ventricles (the fifth thoracic interspace) and the last electrode is placed at the centre of the manubrium sternum (for details see Liao et al 2023). Data acquisition was performed using the WIBCI 16T mobile application (available at: https://play.google.com/store/apps/details?id=ai.risetech.wibci16tandpli=1).
Preprocessing
All data from both the resting no pain and pain condition were recorded and subsequently stored for offline analysis using custom subroutines implemented in Python 3.8.8. A zero-phase finite impulse response bandpass filter ranging from 0.1 Hz to 45 Hz was applied using a Hamming window. Following manual inspection for bad channels, removed channels were reconstructed using inverse weighting distances to combine signals from neighbouring EEG electrodes. EEG recordings were analysed for Magnitude-Squared Coherence (MSC) across frequencies ranging from 0.1 Hz to 45 Hz. Morlet wavelets and the Welch method were used for MSC analysis to quantify brain–heart connectivity using raw ECG signals, prioritizing high temporal resolution to capture direct electrical coupling between cardiac and cortical activity.23,27 For the ECG analysis, the trace was produced by subtracting the left-side ECG lead from the right-side ECG lead. R-peaks from the QRS complexes were detected in each phase (no pain and pain), for details see Liao et al 2023.23
To address potential cardiac field artifacts (CFA) due to volume conduction, which could contaminate EEG signals and inflate MSC values, we relied on bandpass filtering (0.1–45 Hz) and manual channel inspection to minimize artifacts, excluding line noise to focus on narrowband signals. Independent Component Analysis (ICA) was not applied due to the limited effectiveness with only 10 EEG channels, which risks altering signal morphology or removing meaningful brain activity.43 The low MSC values (<0.26) suggest minimal ECG contamination, supporting the effectiveness of our preprocessing approach.
Heart-Rate-Variability Parameters (HRV)
HRV parameters were calculated using combinations of custom MATLAB subroutines (R2022a, MathWorks, Inc., Natick, MA, USA) and EEGLAB (SCCN, Institute for Neural Computation, University of California San Diego, San Diego, CA, USA) as described in previous studies (eg,2,23,24). We derived both time- and frequency-domain parameters of the HRV. We calculated the following time-domain parameters: intervals between R-R peaks as normal-to-normal (NN), the standard deviation between the NNs (SDNN, described in44), heartbeat rate (HR) and the root mean square of successive differences (RMSSD). While HR and SDNN reflect both sympathetic and parasympathetic cardiac regulation,45,46 RMSSD is closely correlated with parasympathetic regulation of the heart.
For frequency-domain parameters, the spectral power in three frequency bands computed as output parameters in the spectral domain HRV analysis comprised the low-frequency component (LF: 0.04–0.15 Hz), representing both sympathetic and parasympathetic regulation, the high-frequency component (HF: 0.15–0.4 Hz) representing primarily parasympathetic regulation, and the LF/HF ratio, sometimes used as a proxy for sympathovagal balance, though this interpretation has been questioned.47
Deceleration capacity (DC) was included to assess the heart’s ability to decelerate in response to parasympathetic (vagal) activation. It was calculated using the phase-aligned signal averaging method, which identifies anchor points (RR intervals longer than the previous one), averages RR intervals over a window of 24 samples (12 before and 12 after the anchor) and quantifies the deceleration of the heart rate as the mean difference between the intervals immediately before and after the anchor points (for details see: 23).
Additionally, the PRD, quantifying low-frequency (less than 0.1 Hz) oscillations was calculated. PRD was determined by analysing the dynamic changes in the angle between consecutive T-waves in vectorcardiography. T waves were automatically identified and then manually refined to account for any inaccuracies. Phase-locked signal averaging was used to identify anchors based on specific conditions in the T wave angle time series. Windows of 40 values (20 before and 20 after each anchor) were then analysed. PRD was calculated as the difference between the maximum and minimum values of the averaged T-wave angle time series, thus capturing low-frequency repolarisation variability (for details see: 23).
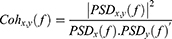
Heart Brain Index
Magnitude-squared coherence quantifies the degree of connection between two signals (in our case EEG and ECG) at specific frequencies based on their power spectra. According to the Equation below (2), PSDX(f) and PSDy(f)′represent the power spectral densities estimated at the specified frequencies for each signal, and PSDX,y(f) refers to the cross-signal PSD, where the power spectral density is calculated using the welsh method. The process of squaring and normalizing (dividing by the product of the auto-spectral densities) yields a measure normalized between 0 and 1. This indicates the proportion of power at a particular frequency that is shared between two signals, where zero indicates no coupling and one reflects a perfect linear relationship between the signals.48 MSC was calculated for epochs of five-second length without overlapping. The MSC for each epoch is averaged across all epochs to provide a single value representing the MSC for each source pair at the specified frequency. For our analysis, the MSC values were aggregated into the: Delta, theta, alpha 1, alpha 2, beta, and gamma frequency bands.
Subgroup Analysis Based
To investigate the relationship between autonomic responses and brain–heart coherence, participants were divided into two subgroups based on the observed changes in PRD from the no pain to the tonic pain condition. Based on prior results, PRD was selected as a valuable biomarker for pain-evoked responses due to its demonstrated ability to detect cold pressor-induced sympathetic activation.23 PRD differs from conventional HRV parameters, ie, it is not affected by respiratory activity25 and offers superior insights by integrating spatiotemporal data into T-wave vectors. This approach allows for a more comprehensive characterisation of beat-to-beat repolarisation dynamics, and provides valuable information on ventricular repolarisation heterogeneity, which is relevant to cardiac arrhythmias.23,25
The subgroups were defined as follows:
- DOWN: comprises participants whose PRD decreased from the no pain to the tonic pain condition, thereby indicating a relative reduction in sympathetic activity.
- UP: Participants whose PRD increased from the no pain to the tonic pain condition, indicating an elevation in sympathetic activation.
Statistical Analysis
Statistical analyses for HRV measures focused on elucidating differences between the resting condition, no pain, and the tonic pain condition. Given that data were not normally distributed based on difference scores, non-parametric rank-based Wilcoxon test was used to analyze differences in HRV parameters between both conditions. These statistical analyses were computed using IBM SPSS Statistics software, version 29.0 (IBM Corporation, Armonk, NY, USA).
Statistical analyses focused on identifying differences in mean spectral power across frequency bands between no-pain and pain conditions for different EEG-ECG channel combinations. Given the non-normal distribution of the data, the non-parametric two-sample Kolmogorov–Smirnov test was employed to compare the spectral power distributions between the two conditions. To address the risk of Type I errors due to multiple comparisons across 10 EEG channels and six frequency bands, we evaluated false discovery rate (FDR) correction as a less conservative alternative to Bonferroni.49 However, as this is an exploratory study with a sparse 10-channel EEG setup, we prioritized sensitivity to detect potential brain–heart connectivity patterns. FDR correction resulted in no significant findings, likely due to limited statistical power.49 Thus, we retained uncorrected p-values for primary analysis, as supported by Rothman (1990) for exploratory research,50 while reporting FDR-corrected results for transparency. Cluster-based permutation testing (CBPT) was not used due to its dependence on spatial resolution, which is limited in our sparse setup, increasing Type II error risk.51
The Kolmogorov–Smirnov test was applied to the averaged mean spectral power values calculated across predefined frequency bands (delta, theta, alpha1, alpha2, beta, gamma) for each participant. The independent assumption of the test was satisfied by averaging spectral power values for each participant across epochs within each condition. For each combination of frequency band and channel pair, the test statistic D, representing the maximum difference between the cumulative distribution functions (CDFs) of the two groups, was computed as follows:

where F(x) and G(x) are the empirical CDFs of the no-pain and pain groups, respectively. The null hypothesis assumes that the distributions of the two groups are identical (F(x) = G(x) for all x), with an alternative hypothesis that they are different. A significance level of = 0.05 was set for all analyses.
These analyses were performed for each frequency band and channel combination using custom scripts in Python. Mean spectral power values were calculated by averaging power within the specified frequency range for each band, and statistical significance was determined for each combination of interest. To ascertain potential differences in brain–heart coherence between the two subgroups in the tonic pain condition, MSC values were compared between the two subgroups using the Kolmogorov–Smirnov test.
Given the physiological interdependence of EEG signals and inherent spatial-spectral correlations between channels and frequency bands, statistical significance was evaluated using uncorrected p-values to avoid overly conservative Type II error control in this exploratory analysis, with FDR-corrected results reported to address the risk of Type I errors.49,50 Statistical significance was set at α = 0.05, acknowledging that the observed effects warrant further validation in confirmatory studies.50,52
Results
Heart Rate Variability
For time-domain parameters, SDNN and HR, we observed significant increases during the pain condition compared to no pain condition, potentially reflecting an increased sympathetic response, although not reflected in the LF/HF ratio (all p < 0.05, see Table 2). Additionally, NN was decreased in the pain condition compared to no pain (p < 0.001). No difference was observed for RMSSD, spectral-domain parameters and DC (Table 2). Bidirectional PRD changes, with increases in half the participants (n=17, sympathetic activation) and decreases in the other half (n=16, compensatory vagal response), likely explain the lack of an overall significant difference between conditions.
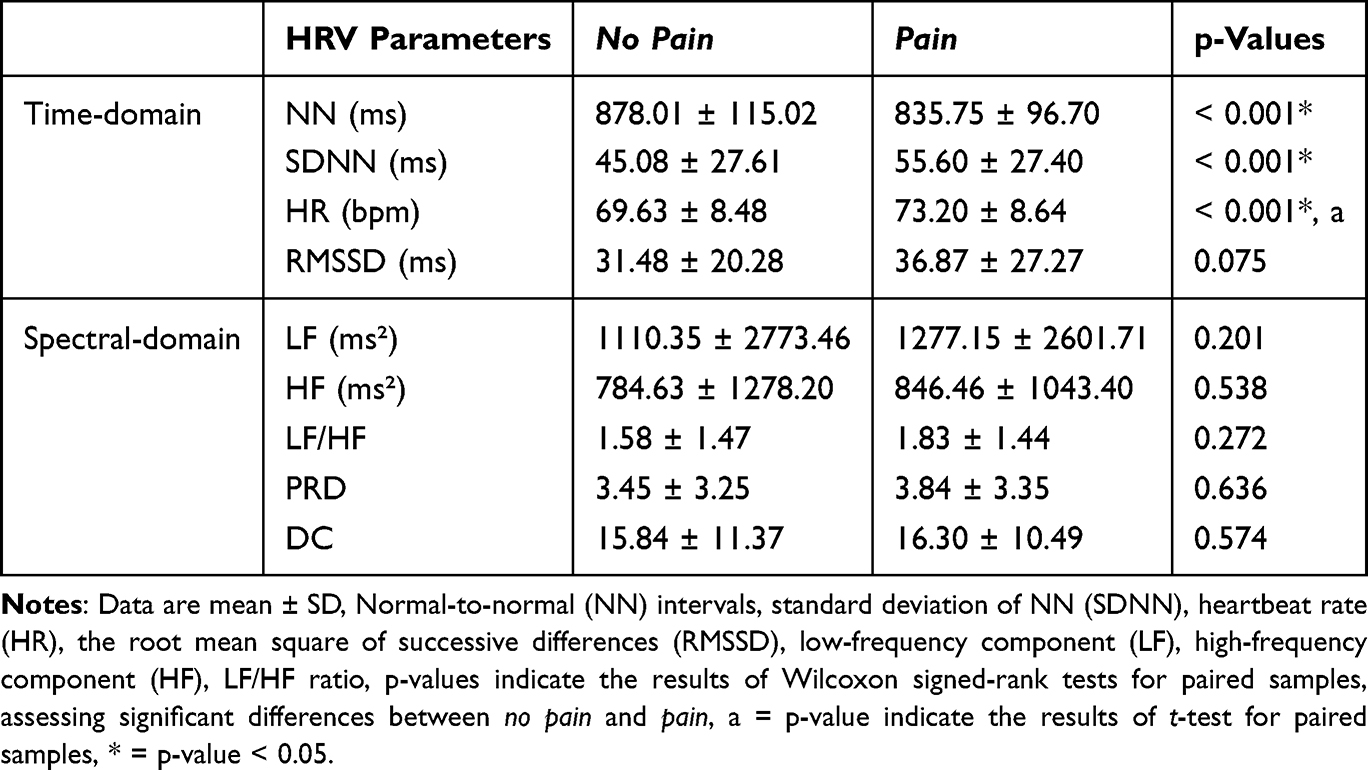 |
Table 2 Group Level of Heart Rate Variability (HRV) Parameters Between No Pain and Pain Conditions |
Heart Brain Index Between No Pain and Pain
The mean MSC across frequencies and channels in healthy participants is visualized in Figure 2A (no pain condition) and Figure 2B (pain condition). Elevated MSC values were consistently observed in the delta bands across all EEG channels for both conditions. Additionally, increased MSC values were noted in the theta and beta bands, particularly in the occipital regions. Enhanced coherence in beta was also observed in the temporal and frontoparietal channels. However, the comparative analysis using the Kolmogorov–Smirnov test revealed only two significant reductions in MSC values during the pain condition compared to no pain in specific frequency-channel pairs: the T3 channel in the alpha-2 band (p = 0.027) and the Pz channel in the gamma band (p = 0.005) using uncorrected p-values. FDR correction applied to these comparisons yielded no significant results (eg, adjusted p = 0.204 for T3 in alpha-2, adjusted p = 0.132 for Pz in gamma), likely due to the limited statistical power of the sparse 10-channel EEG setup.
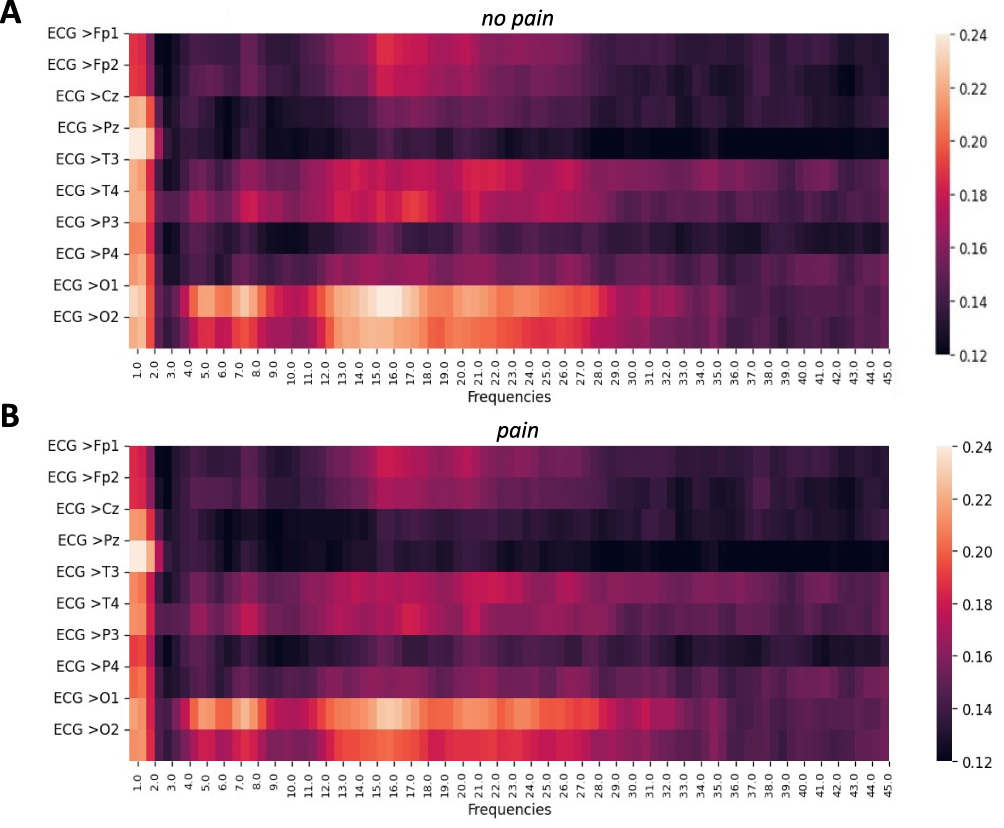 |
Figure 2 Heatmaps illustrating the mean Magnitude-Squared Coherence (MSC) across frequencies and EEG channels for healthy participants. (A) No pain condition; (B) Pain condition. The color bar indicates the average MSC values across subgroups. Comparative analysis based on frequency bands revealed only two significant reductions in MSC values during the pain condition compared to no pain in specific frequency-channel pairs: T3 channel in the alpha-2 band and the Pz channel in gamma band (p<0.05). |
Heart Brain Index – Subgroup Analysis Based on PRD
To investigate individual variability in brain–heart coherence, participants were stratified into subgroups based on changes in PRD from no pain to tonic pain. Figure 3A illustrates MSC patterns for PRD group DOWN (PRD decreased during tonic pain, n = 16), while Figure 3B depicts group UP (PRD increased during pain, n = 17). Both subgroups exhibited elevated MSC values in the delta band across most EEG channels. However, notable subgroup differences were observed in other frequency bands and regions using uncorrected p-values. Group DOWN demonstrated enhanced coherence in the theta (Fp1: p = 0.014, Cz: p = 0.005), alpha-2 (T3: p = 0.027, P4: p = 0.031), and gamma (Fp1: p = 0.007, Pz: p = 0.005, T3: p = 0.012, P4: p = 0.027, O2: p = 0.031) bands compared to group UP (all p < 0.05). FDR correction resulted in no significant findings (eg, adjusted p = 0.132 for Fp1 in gamma, adjusted p = 0.204 for P4 in alpha-2), reflecting the exploratory nature and limited power of the study. Group DOWN’s enhanced coherence, particularly in occipital and temporal regions, suggests stronger synchronization, while group UP exhibited decreased coherence, indicating potential impairment.
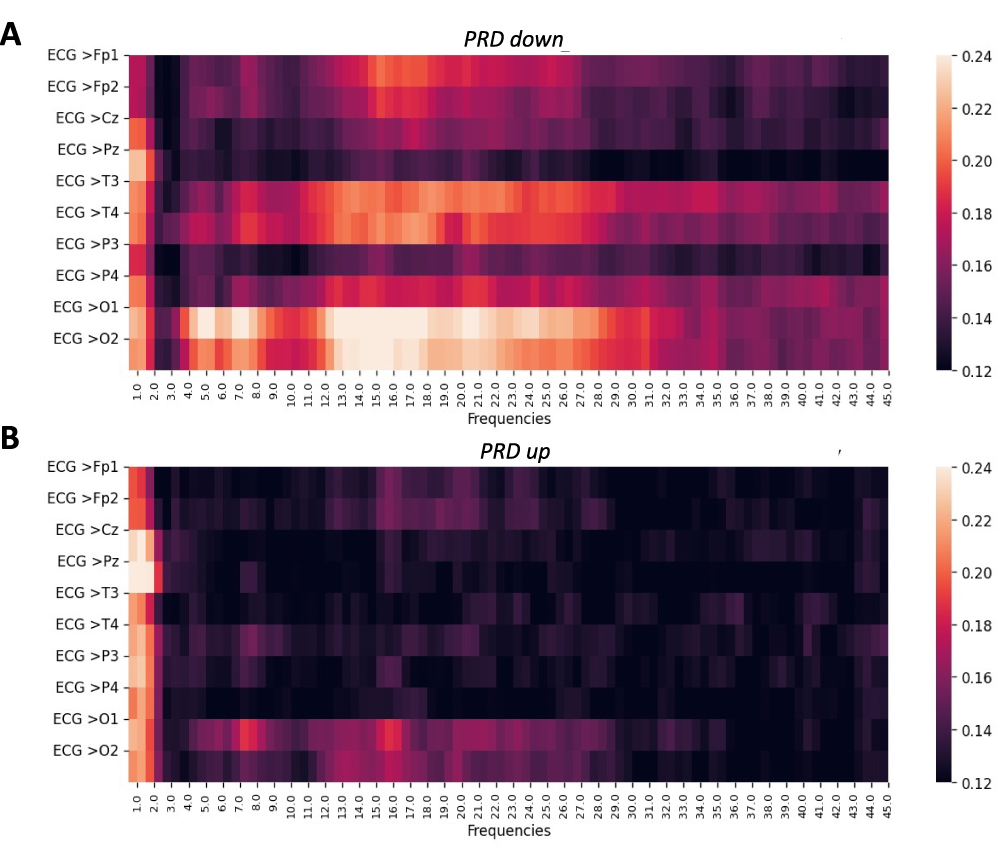 |
Figure 3 Heatmaps illustrating the MSC across frequencies and EEG channels for subgroups based on periodic repolarization dynamics (PRD) during tonic pain conditions. (A) Group DOWN (PRD decreases from no pain to tonic pain), n = 16, and (B) Group UP (PRD increases from no pain to pain), n = 17. |
Discussion
This study investigated brain–heart coherence during resting and tonic pain in healthy participants using spectral coherence analysis. Consistent with our hypothesis, brain–heart coherence, measured by MSC, remained stable across both conditions, indicating a robust coupling mechanism under tonic pain, while HRV parameters showed autonomic adaptation indicative of a sympathetic shift. However, subgroup analyses based on PRD—a specific marker of sympathetic modulation—revealed distinct coherence patterns during pain, with uncorrected p-values suggesting enhanced synchronization in the PRD-DOWN group and reduced synchronization in the PRD-UP group, highlighting the role of individual autonomic profiles in shaping brain–heart connectivity.
Stable Brain–Heart Coherence
Overall brain–heart coherence differed between frequency bands and channels; however, the same pattern was observed for pain and no pain conditions. Despite the significant autonomic demands of the cold pressor test,36,37 overall coherence did not demonstrate substantial differences between both conditions. This robust coherence is indicative of a stable feature of healthy physiology and suggests that healthy individuals can maintain brain–heart connectivity under transient stressors like tonic pain,5 likely mediated by the central autonomic network and its interaction with afferent cardiac pathways, ensuring homeostasis.10,28 These findings are consistent with prior research showing stable MSC patterns in healthy participants during resting and sleep conditions, where delta and theta coherence have been linked to regulatory functions.30,31 This stability contrasts with disruptions observed in pathological states, such as insomnia53 or sepsis,29 where brain–heart connectivity may be compromised due to altered autonomic regulation or structural brain changes.10,28
However, the use of raw ECG signals for MSC calculation, chosen to preserve high temporal resolution and capture direct electrical coupling, may limit the detection of autonomic-mediated dynamics compared to HRV or interbeat-interval metrics, which are more conventional for assessing sympathetic and parasympathetic influences.27 While HRV metrics are valuable for assessing autonomic modulation over longer time scales, they are less suitable for capturing the fast dynamics of brain–heart electrical coupling, which is our primary focus.
The low MSC values (<0.26) suggest minimal contamination from cardiac field artifacts, supporting the effectiveness of our preprocessing steps (bandpass filtering, manual channel inspection) in addressing volume conduction.54 However, the sparse 10-channel EEG setup limited the feasibility of advanced artifact removal methods like Independent Component Analysis (ICA), which requires more channels to avoid altering signal morphology.43 This limitation is of relevance to the present study, which prioritizes a simplified bedside system with minimal electrodes to ensure clinical feasibility. In view of the low observed coherence values, which suggest minimal ECG contamination, it was determined that the application of ICA might introduce more variability than benefit in the analysis.
Coherence in both conditions in the delta and theta bands, particularly in occipital regions possibly allowing exchange of information, aligns with earlier studies linking these bands to sensory integration and cortical-subcortical communication.55,56 Occipital dominance in these low-frequency bands may point to enhanced sensory and interoceptive processing, suggesting adaptive neural mechanisms at play. Delta activity, a key component of brain–heart networks, facilitates information transfer between central and peripheral systems, mediated by the brainstem.57,58 Such low-frequency oscillations, such as delta and theta, are thought to mediate brain–heart synchronization, reflecting foundational mechanisms of interoceptive signalling and autonomic input processing at cortical levels.30,58,59
Individual Autonomic Responses to Pain
Participants stratified by PRD changes from the pain-free to the tonic pain condition showed different patterns of brain-cardiac coherence during pain. It has previously been shown that the physiological response differs and is highly individual. As PRD is a marker of low-frequency oscillations in cardiac repolarisation that is associated with sympathetic modulation,23,25 it was selected to capture individual autonomic responses to pain. Brain–heart coherence varied significantly between PRD subgroups during the tonic pain condition using uncorrected p-values, suggesting that individual autonomic profiles influence connectivity. The PRD-DOWN group exhibited higher theta and gamma coherence in occipital and temporal regions (eg, Fp1, Cz in theta; Fp1, Pz, T3, P4, O2 in gamma, all p < 0.05) compared to the PRD-UP group, but these findings were not significant after FDR correction, likely due to the limited statistical power of the sparse setup.49
The enhanced coherence exhibited by the PRD DOWN group suggests potential mechanisms involving enhanced interoceptive and sensory integration through increased theta coherence, alongside possible cognitive regulatory processes associated with gamma activity.60 Though these exploratory observations require replication in larger studies, they align conceptually with previous research linking higher parasympathetic activity to improved self-regulation and pain inhibition.61
Similarly, the uncorrected statistical pattern in the PRD UP group might reflect altered brain–heart synchronization, potentially indicating different regulatory strategies during tonic pain rather than impaired function”. Alternatively, this could be indicative of a heightened sympathetic survival response, wherein minimal exchange of information is necessary, as all resources are allocated to perpetuate the fight and flight response to the threat.
These findings, though requiring careful interpretation, provide insights into the intricate interplay between autonomic responses and brain–heart connectivity and suggest how individual differences in sympathetic modulation influence physiological integration under stress and pain.
Heart Rate Variability
While brain–heart coherence remained stable, HRV analysis confirmed the autonomic effects of the cold pressor test, a long-lasting tonic stimulus with high pain intensity. Significant increases in NN and HR during the pain condition confirmed a sympathetic response to the CPT, consistent with previous findings.1,5,62 Similar to Konstantinou et al,62 we observed an increase in SDNN, reflecting changes in sympathovagal regulation, as this measure encompasses both sympathetic and parasympathetic influences. An increased SDNN indicates more significant heart rate variability, suggesting alterations in autonomic regulation and implying the potential for such regulation to adapt to pain. RMSSD, a specific parasympathetic marker, also showed a slight, though non-significant, increase consistent with their findings. However, only time-domain parameters were sensitive to pain. The variability in HRV responses across studies may reflect the interplay between sympathetic and parasympathetic branches,2,24,62,63 underscoring the limitations of HRV as a standalone measure of autonomic function during pain and emphasizing the need for complementary analyses like MSC to assess brain–heart connectivity.
Limitations and Future Directions
While this study provides novel insights into brain–heart coherence during tonic pain, several limitations warrant consideration. The use of raw ECG signals for MSC calculation, while preserving high temporal resolution, may not fully capture autonomic-mediated dynamics compared to HRV or interbeat-interval metrics.27 Spectral coherence measures, although robust, may not fully capture dynamic, context-specific interactions underlying functional coupling. Alternative methods, such as phase synchrony or information-theoretic measures, could provide a more comprehensive understanding of brain–heart interactions, particularly given the nonlinear nature of pain processing.57,64 Additionally, the reliance on scalp EEG limits the detection of subcortical processes critical to autonomic regulation, such as brainstem and limbic structures.65 Future studies employing source-localized EEG or functional magnetic resonance imaging could overcome these limitations and further elucidate the neural correlates of brain–heart coupling.
Another limitation concerns the exploratory nature of this brain–heart connectivity study, which necessarily involved trade-offs between clinical feasibility and methodology. The sparse 10-channel EEG configuration, while enabling practical implementation in clinical settings,43 constrained our ability to detect subtle neural connectivity patterns and reduced confidence in our preliminary findings. This design choice reflects the broader challenge in translational neuroscience of balancing methodological sophistication with real-world applicability. Future validation studies would benefit from denser electrode arrays to enhance spatial resolution and larger sample sizes to improve statistical power for detecting brain–heart interactions in pain processing.
Another limitation of the study is the statistical complexity arising from multiple group comparisons, particularly in the subgroup analyses. While these comparisons provided important insights, they also increase the risk of Type I errors. Although subgroup analyses based on PRD provided valuable insights into individual autonomic response patterns, it is noteworthy that no significant differences in PRD were observed between the no pain and tonic pain conditions on a group level in this small, healthy sample, emphasizing the individual responses. This lack of variation may reflect individual autonomic response to pain and could highlight the robustness of autonomic regulation in healthy participants or simply point to a limited sensitivity of PRD in detecting subtle changes in sympathetic activity under these experimental conditions. Future studies with larger, more diverse populations and refined autonomic markers may help address these limitations.
Finally, this study focused exclusively on healthy participants. While this allowed for the characterization of normative patterns, the findings may not generalize to clinical populations. Comparing coherence patterns across patient groups with pain conditions, especially visceral pain, where autonomic dysfunction is often reported, may reveal altered brain–heart dynamics. Subgroup analyses, as demonstrated here, could be particularly valuable in identifying individual differences in pain processing and autonomic regulation. These findings provide a baseline for understanding brain–heart connectivity in healthy individuals and may serve as a reference for identifying deviations in clinical populations. For example, altered PRD and coherence patterns might serve as biomarkers for dysregulated autonomic responses in chronic pain or visceral pain conditions.
Conclusion
The present study indicates that, in healthy individuals, brain–heart coherence remains stable during resting and tonic pain. However, subgroup analyses based on PRD—a marker of sympathetic modulation—revealed differences in coherence patterns, providing insights into the influence of individual autonomic responses on interoceptive regulation and connectivity. Participants with increased sympathetic activity during pain demonstrated reduced brain–heart coherence, suggesting impaired integration (less synchronization) of cortical and autonomic processes. Conversely, participants with reduced sympathetic modulation exhibited increased coherence, which may imply enhanced synchronization and compensatory mechanisms to support sensory and regulatory functions under pain.
These preliminary findings underscore the significance of individual autonomic profiles in shaping brain–heart connectivity during pain and the utility of PRD as a targeted marker for understanding these interactions. The integration of coherence metrics with autonomic markers has the potential to further elucidate the mechanisms that may underlie impaired brain–heart connectivity in clinical populations, where altered autonomic responses may contribute to maladaptive pain processing. These findings establish the foundation for personalized approaches to pain management that leverage brain–heart interactions as potential diagnostic and therapeutic targets, with future studies needed to validate these results using denser EEG setups and larger samples.
Acknowledgments
The study was supported by the “INPAIN grant”, sponsored by the Aalborg University Hospital (“ForskningsKUBE”). JLA is funded by the Clinician Scientist Program UMEA of the University Hospital Essen (FU 356/12-2).
Disclosure
The authors report no conflicts of interest in this work.
References
1. Meeus M, Goubert D, De Backer F, et al. Heart rate variability in patients with fibromyalgia and patients with chronic fatigue syndrome: a systematic review. Semin Arthritis Rheum. 2013;43(2):279–287. doi:10.1016/j.semarthrit.2013.03.004
2. Draganova R, Hartanto G, Jan Pawlik R, et al. Sex differences in the reactivity of gastric myoelectrical activity and heart rate variability as putative psychophysiological markers in human pain research. Front Neurosci. 2024;18:1502752. doi:10.3389/fnins.2024.1502752
3. Ferracuti S, Seri S, Mattia D, Cruccu G. Quantitative EEG modifications during the cold water pressor test: hemispheric and hand differences. Int J Psychophysiol. 1994;17(3):261–268. doi:10.1016/0167-8760(94)90068-X
4. Rho G, Callara AL, Bernardi G, Scilingo EP, Greco A. EEG cortical activity and connectivity correlates of early sympathetic response during cold pressor test. Sci Rep. 2023;13(1):1338. doi:10.1038/s41598-023-27480-z
5. Candia-Rivera D, Catrambone V, Barbieri R, Valenza G. Functional assessment of bidirectional cortical and peripheral neural control on heartbeat dynamics: a brain-heart study on thermal stress. Neuroimage. 2022;251.
6. Yu X, Zhang C, Su L, Zhang J, Rao N. Estimation of the cortico-cortical and brain-heart functional coupling with directed transfer function and corrected conditional entropy. Biomed Signal Process Control. 2018;43:110–116. doi:10.1016/j.bspc.2018.01.018
7. Catrambone V, Valenza G. Complex BRAIN–HEART MAPPING IN MENTAL AND PHYSICAL STREss. IEEE J Transl Eng Health Med. 2023;11:495. doi:10.1109/JTEHM.2023.3280974
8. Catrambone V, Messerotti Benvenuti S, Gentili C, Valenza G. Intensification of functional neural control on heartbeat dynamics in subclinical depression. Transl Psychiatry. 2021;11(1):1–10. doi:10.1038/s41398-021-01336-4
9. Valenza G, Matić Z, Catrambone V. The brain–heart axis: integrative cooperation of neural, mechanical and biochemical pathways. Nat Rev Cardiol. 2025;22(8):537–550. doi:10.1038/s41569-025-01140-3
10. Benarroch EE. Endogenous opioid systems: current concepts and clinical correlations. Neurology. 2012;79(8):807–814. doi:10.1212/WNL.0b013e3182662098
11. Thayer JF, Brosschot JF. Psychosomatics and psychopathology: looking up and down from the brain. Psychoneuroendocrinology. 2005;30(10):1050–1058. doi:10.1016/j.psyneuen.2005.04.014
12. Jänig W. The Integrative Action of the Autonomic Nervous System. 2006;1–610.
13. Shields RW. Functional anatomy of the autonomic nervous system. J Clin Neurophysiol. 1993;10(1):2–13. doi:10.1097/00004691-199301000-00002
14. Labanski A, Langhorst J, Engler H, Elsenbruch S. Stress and the brain-gut axis in functional and chronic-inflammatory gastrointestinal diseases: a transdisciplinary challenge. Psychoneuroendocrinology. 2020;111.
15. Mauskop A. Vagus nerve stimulation relieves chronic refractory migraine and cluster headaches. Cephalalgia. 2005;25(2):82–86. doi:10.1111/j.1468-2982.2005.00611.x
16. Raimondo F, Rohaut B, Demertzi A, et al. Brain-heart interactions reveal consciousness in noncommunicating patients. Ann Neurol. 2017;82(4):578–591. doi:10.1002/ana.25045
17. Dirlich G, Vogl L, Plaschke M, Strian F. Cardiac field effects on the EEG. Electroencephalogr Clin Neurophysiol. 1997;102(4):307–315. doi:10.1016/S0013-4694(96)96506-2
18. Gray MA, Minati L, Paoletti G, Critchley HD. Baroreceptor activation attenuates attentional effects on pain-evoked potentials. Pain. 2010;151(3):853–861. doi:10.1016/j.pain.2010.09.028
19. Catrambone V, Barbieri R, Wendt H, Abry P, Valenza G. Functional brain–heart interplay extends to the multifractal domain. Philos Trans a Math Phys Eng Sci. 2021;379(2212). doi:10.1098/rsta.2020.0260
20. Azzalini D, Rebollo I, Tallon-Baudry C. Visceral signals shape brain dynamics and cognition. Trends Cognit Sci. 2019;23(6):488–509. doi:10.1016/j.tics.2019.03.007
21. Edwards L, Inui K, Ring C, Wang X, Kakigi R. Pain-related evoked potentials are modulated across the cardiac cycle. Pain. 2008;137(3):488–494. doi:10.1016/j.pain.2007.10.010
22. Candia-Rivera D, Faes L, Fallani FDV, Chavez M. Measures and models of brain-heart interactions. 2024.
23. Liao D, Nedergaard RB, Unnisa M, et al. Electrocardiography assessment of sympatico–vagal balance during resting and pain using the texas instruments ADS1299. Bioengineering. 2023;10(2):205. doi:10.3390/bioengineering10020205
24. Wegeberg AM, Sejersgaard-Jacobsen TH, Brock C, Drewes AM. Prediction of pain using electrocardiographic-derived autonomic measures: a systematic review. Eur J Pain. 2024;28(2):199–213. doi:10.1002/ejp.2175
25. Rizas KD, Hamm W, Kääb S, Schmidt G, Bauer A. Periodic repolarisation dynamics: a natural probe of the ventricular response to sympathetic activation. Arrhythm Electrophysiol Rev. 2016;5(1):31–36. doi:10.15420/aer.2015:30:2
26. Rajan J, Gaur GS, Shanmugavel K, Adinarayanan S. Relation between heart rate variability and spectral analysis of electroencephalogram in chronic neuropathic pain patients. Korean J Physiol Pharmacol. 2024;28(3):253. doi:10.4196/kjpp.2024.28.3.253
27. Rajesh P, Umamaheswari K. Coherence analysis between heart and brain of healthy and unhealthy subjects.
28. Catrambone V, Valenza G. Nervous-system-wise functional estimation of directed brain-heart interplay through microstate occurrences. IEEE Trans Biomed Eng. 2023;70(8):2270–2278. doi:10.1109/TBME.2023.3240593
29. Admiraal MM, Gilmore EJ, Van Putten MJAM, Zaveri HP, Hirsch LJ, Gaspard N. Disruption of brain-heart coupling in sepsis. J Clin Neurophysiol. 2017;34(5):413–420. doi:10.1097/WNP.0000000000000381
30. Jurysta F, Lanquart JP, Van De Borne P, et al. The link between cardiac autonomic activity and sleep delta power is altered in men with sleep apnea-hypopnea syndrome. Am J Physiol Regul Integr Comp Physiol. 2006;291(4):1165–1171. doi:10.1152/ajpregu.00787.2005
31. Jurysta F, Van De Borne P, Lanquart JP, et al. Progressive aging does not alter the interaction between autonomic cardiac activity and delta EEG power. Clin Neurophysiol. 2005;116(4):871–877. doi:10.1016/j.clinph.2004.10.005
32. Polepogu R, Vaegae NK. Signal processing techniques for coherence analysis between ECG and EEG signals with a case study. In: Congress on Intelligent Systems. 2021:599–611.
33. Catrambone V, Greco A, Vanello N, Scilingo EP, Valenza G. Time-resolved directional brain–heart interplay measurement through synthetic data generation models. Ann Biomed Eng. 2019;47(6):1479–1489. doi:10.1007/s10439-019-02251-y
34. Arendt-Nielsen L, Morlion B, Perrot S, et al. Assessment and manifestation of central sensitisation across different chronic pain conditions. Eur J Pain. 2018;22(2):216–241. doi:10.1002/ejp.1140
35. Phillips AE, Faghih M, Kuhlmann L, et al. A clinically feasible method for the assessment and characterization of pain in patients with chronic pancreatitis. Pancreatology. 2020;20(1):25–34. doi:10.1016/j.pan.2019.11.007
36. Cui J, Shibasaki M, Low DA, Keller DM, Davis SL, Crandall CG. Heat stress attenuates the increase in arterial blood pressure during the cold pressor test. J Appl Physiol. 2010;109(5):1354–1359. doi:10.1152/japplphysiol.00292.2010
37. Staahl C, Olesen AE, Andresen T, Arendt-Nielsen L, Drewes AM. Assessing analgesic actions of opioids by experimental pain models in healthy volunteers - an updated review. Br J Clin Pharmacol. 2009;68(2):149–168. doi:10.1111/j.1365-2125.2009.03456.x
38. Jochumsen M, Khan Niazi I, Taylor D, Farina D, Dremstrup K. Detecting and classifying movement-related cortical potentials associated with hand movements in healthy subjects and stroke patients from single-electrode, single-trial EEG. J Neural Eng. 2015;12(5):056013. doi:10.1088/1741-2560/12/5/056013
39. Ghani U, Jochumsen M, Gyldenvang MB, Niazi IK. Can water-based EEG caps record robust movement-related cortical potentials (MRCPs) for single and multiple joint movements?
40. Rashid U, Niazi IK, Signal N, Taylor D. An EEG experimental study evaluating the performance of texas instruments ADS1299. Sensors. 2018;18(11):3721. doi:10.3390/s18113721
41. Feild DQ, Feldman CL, Horaácçek BM. Improved EASI coefficients: their derivation, values, and performance. J Electrocardiol. 2002;35(4):23–33. doi:10.1054/jelc.2002.37151
42. Dower GE, Yakush A, Nazzal SB, Jutzy RV, Ruiz CE. Deriving the 12-lead electrocardiogram from four (EASI) electrodes. J Electrocardiol. 1988;21:S182–S187. doi:10.1016/0022-0736(88)90090-8
43. Gratton G, Coles MGH, Donchin E. A new method for off-line removal of ocular artifact. Electroencephalogr Clin Neurophysiol. 1983;55(4):468–484. doi:10.1016/0013-4694(83)90135-9
44. Malik M, Hnatkova K, Huikuri HV, Lombardi F, Schmidt G, Zabel M. CrossTalk proposal: heart rate variability is a valid measure of cardiac autonomic responsiveness. J Physiol. 2019;597(10):2595. doi:10.1113/JP277500
45. Shaffer F, Ginsberg JP. An overview of heart rate variability metrics and norms. Front Public Health. 2017;5:1–17. doi:10.3389/fpubh.2017.00258
46. Umetani K, Singer DH, McCraty R, Atkinson M. Twenty-four hour time domain heart rate variability and heart rate: relations to age and gender over nine decades. J Am Coll Cardiol. 1998;31(3):593–601. doi:10.1016/S0735-1097(97)00554-8
47. Heathers JAJ. Sympathovagal balance from heart rate variability: an obituary. Exp Physiol. 2012;97(4):556. doi:10.1113/expphysiol.2011.063867
48. Waterstone TS, Niazi IK, Navid MS, et al. Functional connectivity analysis on resting-state electroencephalography signals following chiropractic spinal manipulation in stroke patients. Brain Sci. 2020;10(9):644. doi:10.3390/brainsci10090644
49. Benjamini Y, Hochberg Y. Controlling the false discovery rate: a practical and powerful approach to multiple testing. J R Stat Soc. 1995;57(1):289–300. doi:10.1111/j.2517-6161.1995.tb02031.x
50. Rothman KJ. Adjustments are needed for multiple comparisons. Epidemiology. 1990;1(1):43–46. doi:10.1097/00001648-199001000-00010
51. Maris E. Statistical testing in electrophysiological studies. Psychophysiology. 2012;49(4):549–565. doi:10.1111/j.1469-8986.2011.01320.x
52. Nakagawa S. A farewell to Bonferroni: the problems of low statistical power and publication bias. Behav Ecol. 2004;15(6):1044–1045. doi:10.1093/beheco/arh107
53. Jurysta F, Lanquart JP, Sputaels V, et al. The impact of chronic primary insomnia on the heart rate – EEG variability link. Clin Neurophysiol. 2009;120(6):1054–1060. doi:10.1016/j.clinph.2009.03.019
54. Nolte G, Bai O, Wheaton L, Mari Z, Vorbach S, Hallett M. Identifying true brain interaction from EEG data using the imaginary part of coherency. Clin Neurophysiol. 2004;115(10):2292–2307. doi:10.1016/j.clinph.2004.04.029
55. Kumar S, Shekhar S, Agarwal P. Cognitive capability identification in performing mental tasks using EEG-based coherence. Int J Syst Assur Eng Manage. 2023;14(1):334–342.
56. Chang PF, Arendt-Nielsen L, Chen ACN. Dynamic changes and spatial correlation of EEG activities during cold pressor test in man. Brain Res Bull. 2002;57(5):667–675. doi:10.1016/S0361-9230(01)00763-8
57. Faes L, Marinazzo D, Jurysta F, Nollo G. Linear and non-linear brain–heart and brain–brain interactions during sleep. Physiol Meas. 2015;36(4):683. doi:10.1088/0967-3334/36/4/683
58. Knyazev GG. EEG delta oscillations as a correlate of basic homeostatic and motivational processes. Neurosci Biobehav Rev. 2012;36(1):677–695. doi:10.1016/j.neubiorev.2011.10.002
59. Abdullah H, Maddage NC, Cosic I, Cvetkovic D. Cross-correlation of EEG frequency bands and heart rate variability for sleep apnoea classification. Med Biol Eng Comput. 2010;48(12):1261–1269. doi:10.1007/s11517-010-0696-9
60. Fries P. Rhythms for Cognition: communication through Coherence. Neuron. 2015;88(1):220–235. doi:10.1016/j.neuron.2015.09.034
61. Forte G, Troisi G, Pazzaglia M, De Pascalis V, Casagrande M. Heart rate variability and pain: a systematic review. Brain Sci. 2022;12(2):153. doi:10.3390/brainsci12020153
62. Konstantinou P, Trigeorgi A, Georgiou C, Gloster AT, Panayiotou G, Karekla M. Comparing apples and oranges or different types of citrus fruits? Using wearable versus stationary devices to analyze psychophysiological data. Psychophysiology. 2020;57(5):e13551–e13551. doi:10.1111/psyp.13551
63. Nahman-Averbuch H, Dayan L, Sprecher E, et al. Sex differences in the relationships between parasympathetic activity and pain modulation. Physiol Behav. 2016;154:40–48. doi:10.1016/j.physbeh.2015.11.004
64. Schiecke K, Schumann A, Benninger F, Feucht M, Baer KJ, Schlattmann P. Brain–heart interactions considering complex physiological data: processing schemes for time-variant, frequency-dependent, topographical and statistical examination of directed interactions by convergent cross mapping. Physiol Meas. 2019;40(11):114001. doi:10.1088/1361-6579/ab5050
65. Beissner F, Meissner K, Bär KJ, Napadow V. The autonomic brain: an activation likelihood estimation meta-analysis for central processing of autonomic function. J Neurosci. 2013;33(25):10503–10511. doi:10.1523/JNEUROSCI.1103-13.2013
 © 2025 The Author(s). This work is published and licensed by Dove Medical Press Limited. The
full terms of this license are available at https://www.dovepress.com/terms
and incorporate the Creative Commons Attribution
- Non Commercial (unported, 4.0) License.
By accessing the work you hereby accept the Terms. Non-commercial uses of the work are permitted
without any further permission from Dove Medical Press Limited, provided the work is properly
attributed. For permission for commercial use of this work, please see paragraphs 4.2 and 5 of our Terms.
© 2025 The Author(s). This work is published and licensed by Dove Medical Press Limited. The
full terms of this license are available at https://www.dovepress.com/terms
and incorporate the Creative Commons Attribution
- Non Commercial (unported, 4.0) License.
By accessing the work you hereby accept the Terms. Non-commercial uses of the work are permitted
without any further permission from Dove Medical Press Limited, provided the work is properly
attributed. For permission for commercial use of this work, please see paragraphs 4.2 and 5 of our Terms.