Back to Journals » Journal of Pain Research » Volume 11
Increased theta band EEG power in sickle cell disease patients
Authors Case M, Shirinpour S, Zhang H, Datta YH, Nelson SC, Sadak KT, Gupta K, He B
Received 5 July 2017
Accepted for publication 18 October 2017
Published 27 December 2017 Volume 2018:11 Pages 67—76
DOI https://doi.org/10.2147/JPR.S145581
Checked for plagiarism Yes
Review by Single anonymous peer review
Peer reviewer comments 4
Editor who approved publication: Dr Katherine Hanlon
Michelle Case,1 Sina Shirinpour,1 Huishi Zhang,1 Yvonne H Datta,2 Stephen C Nelson,3 Karim T Sadak,4 Kalpna Gupta,2 Bin He1,5
1Department of Biomedical Engineering, 2Department of Medicine, University of Minnesota, 3Pediatric Hematology-Oncology, Children’s Hospitals and Clinics of Minnesota, 4Pediatric Hematology-Oncology, University of Minnesota Masonic Children’s Hospital, 5Institute for Engineering in Medicine, University of Minnesota, Minneapolis, MN, USA
Objective: Pain is a major issue in the care of patients with sickle cell disease (SCD). The mechanisms behind pain and the best way to treat it are not well understood. We studied how electroencephalography (EEG) is altered in SCD patients.
Methods: We recruited 20 SCD patients and compared their resting state EEG to that of 14 healthy controls. EEG power was found across frequency bands using Welch’s method. Electrophysiological source imaging was assessed for each frequency band using the eLORETA algorithm.
Results: SCD patients had increased theta power and decreased beta2 power compared to controls. Source localization revealed that areas of greater theta band activity were in areas related to pain processing. Imaging parameters were significantly correlated to emergency department visits, which indicate disease severity and chronic pain intensity.
Conclusion: The present results support the pain mechanism referred to as thalamocortical dysrhythmia. This mechanism causes increased theta power in patients.
Significance: Our findings show that EEG can be used to quantitatively evaluate differences between controls and SCD patients. Our results show the potential of EEG to differentiate between different levels of pain in an unbiased setting, where specific frequency bands could be used as biomarkers for chronic pain.
Keywords: sickle cell disease, electroencephalography, chronic pain, electrophysiological source imaging, thalamocortical dysrhythmia
Introduction
Chronic pain is a health condition that costs $635 billion annually in the US alone.1 Treatment remains sub-par for chronic pain conditions, because chronic pain and its reciprocal effects on the brain are not well understood. Several studies have shown that chronic pain is associated with structural, functional, and chemical changes in the brain.2–6 Subtle differences have been observed in different chronic pain conditions,7–10 and disease-specific models of chronic pain are needed to explain the variance observed and to understand the specific neurophysiological changes from each disease type. Following this rationale, we examined how chronic pain affects electrophysiological signals in SCD.
SCD is a debilitating multisystem disorder in which the hemoglobin gene has a mutation that causes abnormal polymerization and solubility of hemoglobin, which leads to sickle-shaped red blood cells. Sickle red blood cells occlude blood vessels causing vasoocclusive crises impairing oxygen supply resulting in hypoxia, reperfusion injury, inflammation, end-organ damage, and pain.11–13 Recurrent acute and chronic pain are the most common symptoms in SCD.13–15 Efforts have been made in an attempt to find the best way to rate pain in SCD.16–20 Characterizing the pain accurately is imperative as treatments for chronic pain in SCD are limited and often unsuccessful. Opioids are the most common treatment for pain in SCD,14,21 but their kinetics vary in SCD patients; therefore, finding the right dose to effectively treat pain in SCD is challenging.22 Often, patients will receive suboptimal treatment, which causes SCD patients to suffer and potentially develop even more pain.15 Additional research is needed to better understand chronic pain in SCD and to address health care disparities for this often overlooked and underserved patient population in the US.
EEG is a noninvasive technique that records electrophysiological responses of the brain over the scalp in a relatively inexpensive and convenient manner compared to other imaging modalities. EEG has been used to monitor several types of chronic pain patients. An increase in spectral power in the lower frequencies has been observed in many studies for patients with neuropathic chronic pain.23–27 Additionally, a trend for the dominant peak in spectral power to shift to lower frequencies was seen in some of these studies.26,27 However, not all chronic pain patients have observable changes in EEG spectral power. A study of chronic back pain patients showed no significant differences in spectral peak power or peak frequency.28 The authors suggested that an explanation for these results might be that chronic back pain mainly involves nociceptive mechanisms, rather than neuropathic pain mechanisms.28 It has been shown that chronic pain does alter neurophysiological dynamics of SCD patients, using fMRI and multimodal imaging.29,30 Moreover, chronic pain in SCD is complex, and studies have shown that SCD pain likely involves nociceptive and neuropathic mechanisms.31,32 Given these findings, we hypothesized that SCD patients will have altered EEG spectral power.
The goal of the present study was to investigate how resting-state EEG is altered in SCD patients compared to healthy controls. ESI and EEG spectral power were used to assess differences between healthy controls and SCD patients and to test how clinical parameters related to chronic pain history and disease severity are related to EEG power and ESI imaging results. These relationships can be used to evaluate what factors in the EEG data have the potential to rate or predict chronic pain intensity.
Methods
Patients
This study was registered at clinicaltrials.gov as “Functional Neuroimaging of Pain Using EEG and fMRI” with the registration number NCT02212691. The patient group consisted of 24 patients who were recruited by local hematologists. The study was approved by the Institutional Review Board at the University of Minnesota, and all patients gave written informed consent before participating. As part of the study, patients were also asked if they would give permission to share certain clinical parameters from their medical history with researchers. All but one participant, who did not wish to share his health information with anyone besides his doctor, consented to provide this additional information to the research team. Participants under 18 years of age gave assent and their parent or legal guardian gave written informed consent as well. Of the initial patient group, three patients were excluded due to high impedance levels at the time of EEG recording during the experiment. The recruitment flowchart is shown in Figure 1. A summary of the clinical parameters of the patient group (n=20: eight females and twelve males; mean age 23±7 years) included in the study is shown in Table 1 and a list of medications used by the patients is shown in Table 2. On the day of the study, the patients verbally reported their pain, rated on a scale from 0 to 10, with 0 being no pain and 10 being the worst pain imaginable. The pain score reported was for the current pain felt on the day of study, and it did not reflect previous pain experiences.
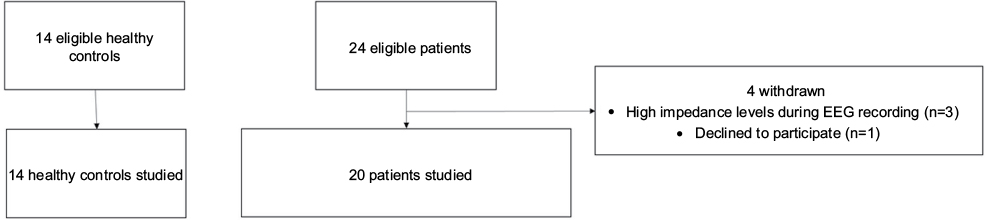 | Figure 1 Flowchart of subject recruitment. Healthy controls were recruited through fliers and patients were recruited through local hematologists. Four patients were excluded from the study because of poor quality of EEG recordings from three patients and one declined to participate. A total of fourteen healthy controls and twenty patients were analyzed in this study. Abbreviation: EEG, electroencephalography. |
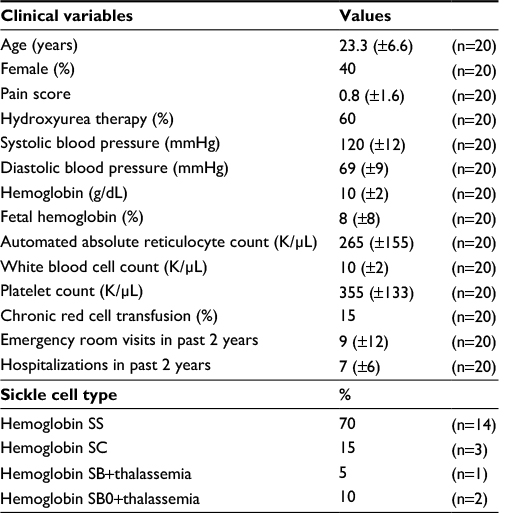 | Table 1 Group statistics of clinical characteristics of the sickle cell disease patients Notes: Summary of the clinical characteristics of the patients recruited for the study who were willing to disclose their medical information. The mean value is listed and the standard deviation is within the parentheses unless specified otherwise. A total of 20 patients were included in this summary. |
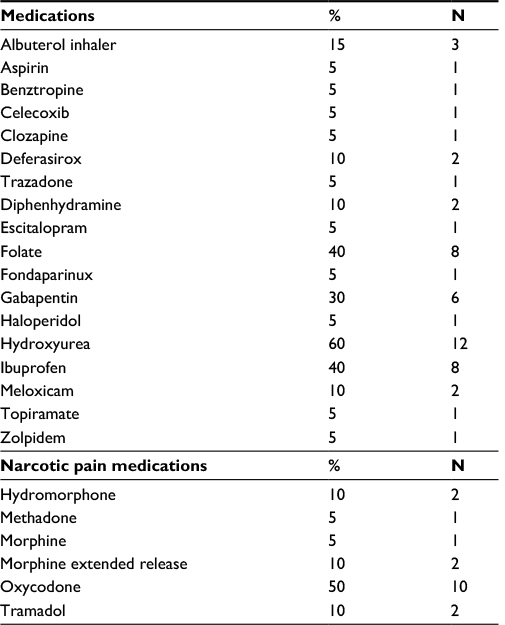 | Table 2 Group summary of all medications used by patients Notes: Summary of all the medications used by the patients recruited for the study. The percentage and the number of patients using a specific medication are listed, where N indicates the number of patients. Many patients were taking more than one type of medicine. The medications are separated to differentiate narcotic pain medications from other medications. |
Controls
The control group consisted of 14 (seven females, seven males; mean age 26±4 years) healthy controls who volunteered for the study. The ethnicity of the healthy subjects included six African Americans, five Caucasians, one Hispanic, and two Asians. The healthy controls had no neurological or psychiatric disease history and no pain or chronic pain conditions. All healthy subjects gave written informed consents to participate in the present study.
EEG recording and preprocessing
The EEG sessions were conducted in a private room where subjects were seated and asked to let their mind wander naturally, but to remain alert and awake. Participants had their eyes open during 10 minute sessions. All subjects had a minimum of two sessions of resting state recorded. Patients were allowed to continue taking their regular medications at the time of the study. The EEG data were measured using a 64-channel EEG system (BrainAmp MR 64 plus; Brain Products, Gilching, Germany). A summary of our analysis protocol is displayed in Figure 2. The EEG data were processed offline using the EEGLAB toolbox.33 ICA was used to decompose the EEG to remove artifacts. The EEG data were downsampled to 256 Hz and re-referenced to averaged reference. At least 5 minutes of artifact-free EEG was required for participants to be included in the final data analysis.
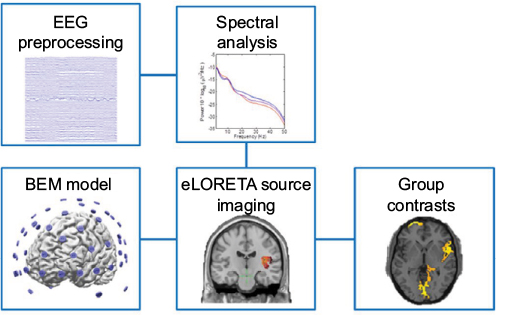 | Figure 2 Diagram of analysis protocols. The EEG data were preprocessed to remove artifacts and then filtered into different frequency bands to perform power spectral analysis and ESI. A BEM realistic-shaped generic head model was used to image sources using the eLORETA algorithm. Group contrast images were found from comparing source maps of the control and patient groups. Abbreviations: BEM, boundary element method; EEG, electroencephalography; ESI, electrophysiological source imaging. |
EEG power spectrum analysis
The preprocessed EEG data were bandpass filtered between 1 and 50 Hz and segmented into 10 second epochs. PSD was calculated for each epoch and estimated using the Welch’s method with a Hamming window that was 2 seconds long and with 50% overlap. The PSD results were averaged across the epochs in each subject. The group results were obtained by averaging the PSD results of all the subjects in the group. The PSD results obtained were separated into different frequency bands of interest, including delta (2–4 Hz), theta (4–8 Hz), alpha (8–12 Hz), beta1 (12–16 Hz), beta2 (16–30 Hz), and gamma (30–50 Hz) bands. For each frequency band and for every subject, the average power, maximum peak value, frequency location of the maximum peak, and COG (see the following text for definition) were calculated.24,28,34 The average power was obtained by averaging the PSD values across the frequency band range; maximum peak value was defined as the maximum PSD value within the specified frequency band range; frequency location was found by determining at which frequency the maximum peak was located for each frequency band; and COG was calculated using the following equation:34
|
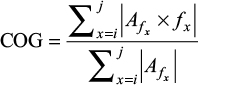
Where i is the lower bound of the frequency band, j is the upper bound of the frequency band, f is the frequency, and Af is the amplitude of PSD at a given frequency.
The parameters of power analysis including average power, maximum peak value, frequency location of the maximum peak, and COG were tested for significance for each frequency band using the software RStudio.35 The average values and standard deviations were found for all power analysis parameters. Significance was tested using two-sided non-parametric Wilcoxon tests. The Wilcoxon rank sum test was chosen due to the robustness of this method and the non-Gaussian distribution of the data.36 The results of the Wilcoxon tests had FDR correction applied to account for multiple comparisons.37 For these comparisons, the level of significance was set to be p<0.05 (FDR corrected). Furthermore, the effect size between the controls and patients was found for each power parameter. Effect size is a measure independent of sample size that determines the strength of differences between two groups.38 The effect size was found using the Cohen’s d method.39,40 Typically, an effect size above 0.80 is considered large.39 For this study, a more conservative threshold of 0.90 was used to have higher power.41 Only results above 0.90 are reported.
Additionally, the power results were tested against the clinical parameters of number of ED visits, number of hospitalizations, and percent fetal hemoglobin. These parameters were chosen because of their relation to the patient’s chronic pain history, where these values tend to reflect the frequency of vaso-occlusive pain crisis.30,42 A linear model was generated by assuming a linear relationship between the power parameter being tested and the clinical parameter being tested and by assuming that there was no y-intercept. RStudio was used to test the slope coefficient for significance. An FDR correction was applied to the results of these tests to account for multiple comparisons. The level of significance was set to be p<0.05 (FDR corrected).
EEG source imaging analysis
The preprocessed EEG data were filtered into different frequency bands used in the power analysis. EEG source imaging analyses were performed using the Fieldtrip toolbox.43 Individual MRI from each subject was used to create individual three-layer BEM models44,45 to separate the head volume conductor into brain, skull, and scalp with a conductivity ratio of 0.33, 0.0165, and 0.33 S/m, respectively.46,47 For the subjects with noisy MRI, we used the MRI of Colin2748 which is a realistic standard head model. A three-dimensional source grid with 5 mm resolution was defined and restricted to the gray matter of Colin27, which resulted in 13,527 grid points. The source grid generated from Colin27 was warped into each individual’s head model so that the forward problem could be solved to calculate individual lead fields. This method let us directly compare the source imaging results because all the subjects had equal numbers of grid points and corresponded to a common head model. EEG cross-spectra were calculated from the EEG signals in 2 second windows for each band. EEG cross-spectral matrix was fed into eLORETA49 algorithm to compute spectral density of the estimated current density signals for each voxel in each band.50 eLORETA provides unbiased localization and independence in choice of reference and has been evaluated in previous studies.51,52 Group comparison was performed in SPM12,53 where a second-level random-effect analysis was performed on normalized ESI solutions, and the control group was compared to the patient group. For each frequency band, the groups were compared to each other and contrast images were obtained to determine regions with significant differences for either “patient > control” or “control > patient”, with p<0.05 (FDR corrected).
Results
Patient statistics
Clinical variables used in this study are listed in detail in Table 1. Twenty patients with sickle cell anemia were included for analysis, among whom fourteen had hemoglobin SS, three had hemoglobin SC, one had hemoglobin SB+thalassemia, and two had hemoglobin SB0+thalassemia. The average pain score and standard deviation recorded for the current pain on the day of the study was 0.8±1.6. The average pain score was low for this study because sixteen of the patients reported a zero for their pain score. One reason for the lack of variability is that patients would not come in for the study if they had pain and would reschedule to a day when they felt better. Due to this lack of variability, this variable was not studied for further analysis. As stated earlier, the parameters analyzed in this study included percent fetal hemoglobin, number of ED visits, and number of hospitalizations. Percent fetal hemoglobin ranged between 0.3% and 27.2%, with an average and a standard deviation of 8±8%. The number of ED visits over the past 2 years ranged between 0 and 44, with an average and a standard deviation of 9±12. Number of hospitalizations over the past 2 years ranged between 0 and 19, with an average and a standard deviation of 7±6. The medications taken by the patients participating in this study varied greatly, as seen in Table 2. A majority of the patients were taking some dosage of hydroxyurea; half were using oxycodone for treating pain; and many were taking more than one type of medication at the time of the study.
Power spectrum analysis results
EEG power spectral analysis showed that the patient group tended to have more power at low-frequency bands (delta, theta, and alpha) and less power at high-frequency bands (beta1, beta2, and gamma), as shown in Figure 3A. The average power values showed that significant differences were found for theta band (−15±1.4 vs −14±1.1, p=0.02, d=−1.2) and for beta2 band between controls and patients (−21±2.2 vs −23±1.5, p=0.02, d=1.2), as shown in Figure 3B. No significant correlations between the three clinical parameters studied and average power were found.
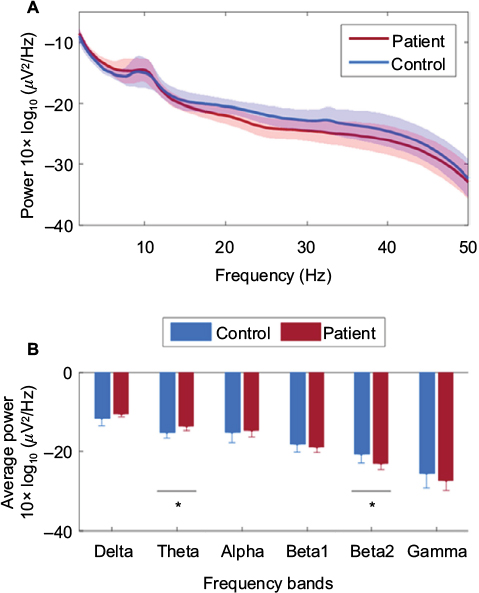 | Figure 3 Summary of average power results for each frequency band. (A) Plot showing continuous average power across frequency spectrum from 1 to 50 Hz. The average values are shown for the controls and patients. The standard deviation is shown by the shaded regions. (B) Bar plot showing group averages for specific frequency bands. The bars show the group mean value and the error bars show the standard deviation. *p<0.05. |
The other power spectral analysis metrics revealed differences between the control group and patient group. The maximum peak values showed differences between the control group and patients in theta (−13±0.9 vs −12±1.2, p=0.07, d=−0.9), beta2 (−20±1.4 vs −21±1.0, p=0.08, d=0.9), and gamma groups (−22±2.2 vs −24±2.0, p=0.08, d=1.0). The maximum peak values in the theta band showed a positive correlation with ED visits (p=0.03, R2=0.50) (Figure 4A). This correlation shows a strong relationship between theta power and ED visits, implying that the greater the maximum theta peak observed in patients the higher the frequency of visits to the ED. There were no statistical differences observed in the frequency location of the maximum peak. The COG showed significant differences in the gamma band between controls and patients (40.4±0.2 vs 40.3±0.1, p=0.05, d=1.0). The theta band showed a significantly negative correlation with COG values and ED visits (p<0.001, R2=0.72) (Figure 4B). This indicates that patients with more severity tend to have their power concentrated in lower frequencies.
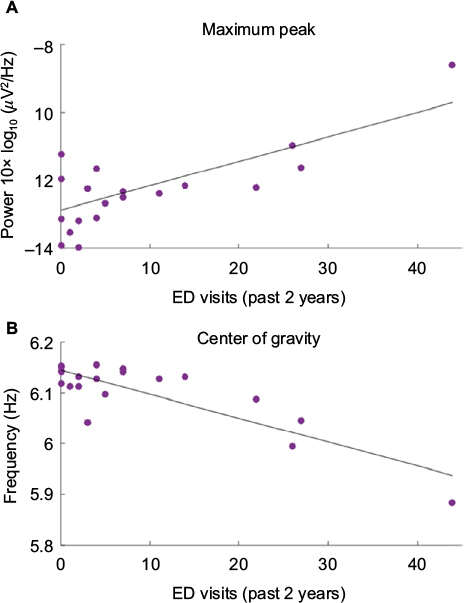 | Figure 4 Scatter plots describing significant correlations in theta band of the patient group. (A) Plot showing a positive correlation between maximum peak values of theta band and ED visits in the past 2 years. The p-value is 0.03 and R2 is 0.50. (B) Plot showing a negative correlation between the COG in theta band and the ED visits in the past 2 years. The p-value is <0.001 and R2 is 0.72. Abbreviations: ED, emergency department; COG, center of gravity. |
Source imaging results
ESI was performed on the theta and beta2 bands due to the significant differences observed in both patient groups assessed by power analysis. The ESI results were contrasted between the control group and patient population. The theta band results showed greater brain activity for the patient group in the prefrontal cortex, left rolandic operculum, left insula, left putamen, and caudate nucleus (Figure 5A). A majority of these regions are known to be active during pain processing.54,55 Controls had greater activity compared to patients in regions such as precuneus, cuneus, left angular gyrus, and occipital lobes. The beta2 results showed there were significant regions where patients had more activity compared to controls in the prefrontal cortex, anterior cingulate cortex, right superior temporal gyrus, and the right caudate nucleus. Regions where controls had significantly greater activity included the precuneus and cuneus lobes (Figure 5B).
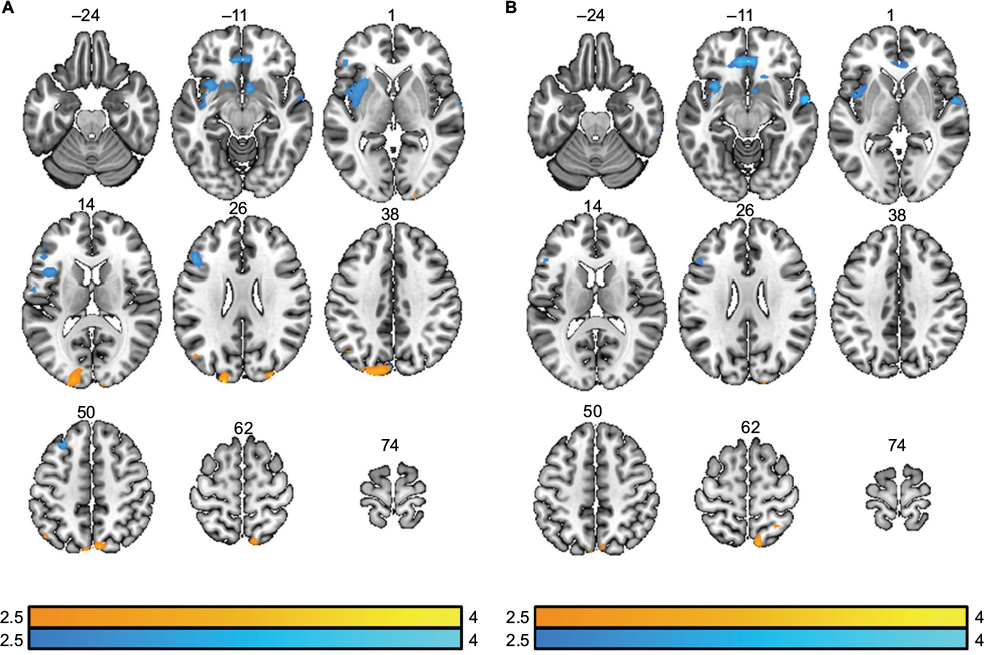 | Figure 5 Contrast images of ESI results. (A) Results of contrasts in the theta band. The contrast results of “control>patient” are shown in orange/yellow and the contrast results of “patient>control” are shown in blue. The t-values are shown in color bars. Results displayed are p<0.05 (FDR corrected). (B) Results of contrasts in the beta2 band. The contrast results of “control>patient” are shown in orange/yellow and the contrast results of “patient>control” are shown in blue. The t-values are shown in color bars. Results displayed are p<0.05 (FDR corrected). Abbreviations: ESI, electrophysiological source imaging; FDR, false discovery rate. |
Discussion
This study examined resting state data in SCD patients using EEG. There were statistically significant differences detected between the patient group and healthy controls, specifically in the theta and beta2 bands in EEG. The theta band showed correlations with a history of chronic pain, suggesting that high theta power may be associated with a more severe case of SCD. Furthermore, we used ESI to explore where these differences occur. The theta and beta2 band changes localized to several regions of the brain commonly involved in pain processing. To our knowledge, this is the first EEG resting state source imaging study that has been performed in SCD patients. This study shows a great potential for EEG to be used to assess disease severity in SCD patients.
The anterior cingulate cortex, insular cortex, and prefrontal cortex are all known to be active during pain processing. Both acute pain studies54,56,57 and studies of chronic pain5,58 have implicated these areas to be central to processing nociceptive input. Furthermore, these regions tend to be more heavily recruited for the emotional aspect of nociception.59,60 However, these areas are also involved in other functions such as emotional processing, attention, and learning.61–63 Our ESI results showed that patients have greater activation in the prefrontal cortex, insular cortex, and anterior cingulate cortex within the theta or beta2 band compared to controls. Neurogenic pain patients have shown that theta activity localizes to several pain regions, including insular cortex, anterior cingulate cortex, prefrontal, and somatosensory cortices.55 Based on the nature of our study, the increased activation in these areas is most likely caused by chronic pain or emotional strain that SCD patients experience.
Several studies have shown that chronic pain patients have increased power at low-frequency bands such as delta, theta, and alpha.24–26,64 The power results of our study showed patients tend to have higher power at lower frequencies and COG showed there was a shift observed in patients with more severe symptoms to have power concentrated at lower frequencies. This shift of power has been observed in chronic neurogenic pain patients as well.26 While our results do not reflect significant changes observed in alpha power, as is seen in other studies,24,26 we believe this is due to our experimental protocol where patients had their eyes open. Alpha power decreases when eyes are open.34,65 Our findings also support a relationship between EEG theta power and chronic pain events due to correlations observed in ED visits. Previous work has demonstrated that pain intensity can be reflected in ED and hospital visitations.30,66–69 Specifically, many longitudinal studies characterizing ED visits of SCD patients found that a majority of the time pain was the reason for the visit (ranging from 78% to 94%).66,68 Additionally, a study showed that patients who visit ED more often have more pain (reflected in pain diary data) and a higher clinical severity of SCD.67 Pain in SCD is chronic and severe and is described as the hallmark of the disease.13,67,68 The differences observed in the EEG data could be related to other complications of the disease, such as hypoxemia, but due to the correlations to ED visits, the differences are most likely related to the effects of enduring long-term chronic pain. A study with chronic back pain patients showed that EEG power results correlated with the average pain scores of the past 4 weeks but not with the pain scores obtained at the moment of the EEG recording.28
Shifts toward lower frequencies and increased power at lower frequencies in chronic pain patients are theorized to be caused by TCD. For certain neurological disorders, such as neurogenic pain, the neurons in the thalamus exhibit altered behavior, which disrupts the normal thalamocortical resonance.27,70 This mechanism has been supported by single unit recordings in the thalamus of neurogenic pain patients, showing a mean firing rate of 4 Hz.28 This disruption causes excessive theta power and results in cortical processing dynamics to be shifted in the frequency domain.27,28 Several types of chronic pain patients have shown increased power in theta or alpha band.24–27 Furthermore, patients who received a therapeutic lesion in the thalamus displayed pain relief and reduced theta power compared to before the therapeutic intervention.26,28 The increased power observed in SCD patients is most likely caused by this same TCD mechanism.
The limitations of our study include a small patient population, allowing patients to continue taking whatever medications they use on a regular basis, having them keep their eyes open during EEG recordings, and using an ethnically diverse control group. The small number of subjects restricts our analysis and makes it difficult to achieve significant differences. There is also an increased risk of errors with small sample sizes and a chance that outliers can dominate results. The small sample size may contribute as to why no correlations between hospitalizations and fetal hemoglobin were found. It is also challenging to determine how or whether the medications affected the neural signals and subsequent EEG data. It should be noted that recruiting SCD patients is challenging and SCD trials in general have poor accrual;71–73 for example, a study on pain treatment had to be concluded prematurely.21 The reasons for these problems are the unpredictable nature of pain in SCD patients and poor compliance due to many factors.74,75 We did not ask our patients to stop taking their medications because we wanted to retain the maximum number of patients. The control group did not match the ethnicity of the patient group. However, the control group was not dominant in any particular race, and no significant differences were found between the results of African-American controls and the other controls in an additional analysis. Other complications in interpreting our results include that sickled blood cells could cause alterations in neural behavior and that differences observed may not reflect chronic pain or TCD.76 However, several studies have shown that at rest SCD patients have comparable oxygen delivery to controls.29,77,78 Finally, EEG has limited spatial resolution, which makes it challenging to map deep brain structures such as the thalamus.79 This potentially limits our explanation of the TCD mechanism potentially being a factor in SCD patients’ neural activity. However, previous studies have shown that EEG can be used to map out the connectivity in the thalamocortical pathway in epilepsy patients, which shows that EEG is capable of detecting deep brain structure activity.80 Another limitation of this study is using ED visits to mark chronic pain. This is an imperfect marker; however, several clinical publications about pain in SCD have used ED visits and hospitalizations as a surrogate for pain severity.30,67,81,82 These markers of chronic pain are still valuable because they provide an objective measure of chronic pain history. Despite the limitations of our study, we still found significant differences between the patient and control groups, as well as significant correlations between the EEG results and the frequency of ED visits. However, results should be interpreted with caution as highlighted earlier. This was a preliminary study with many limitations, and future studies with increased sample sizes, racially matched controls, and better methods for measuring pain are needed to confirm our preliminary results.
EEG is an important tool, especially in this cohort, because it is noninvasive, economical, easy to use, and can provide an objective measurement for assessing pain. In addition to our findings, EEG has also been shown to find altered activity between controls and SCD patients in processing acute pain.83 Other imaging modalities, such as fMRI or diffusion tensor imaging, require a larger burden on patients to complete data recording due to potential risks and the bulk of instrumentation. Acquiring data sets using MRI techniques can be limited due to the unpredictability of pain. EEG is far more flexible because it is portable and can be brought to the patient’s home, hence can be utilized for more detailed studies that include longitudinal follow-up.84,85 Recent advancements in ESI using high-density EEG have revealed significantly enhanced capability of imaging brain sources that were not available before.79,86,87 Thus, EEG is a feasible tool to use on SCD patients, because it is an inexpensive and convenient way to address the lack of unbiased pain measurements for chronic pain patients and it can provide new insightful knowledge about how SCD pain affects neurophysiology.
In summary, this study provides a foundation to show that EEG data can be used to assess chronic pain in SCD patients and has provided insights into why TCD is a possible mechanism behind chronic pain in SCD. Using EEG to monitor SCD patients is an important finding because other types of noninvasive imaging, such as fMRI, are expensive and burdensome for patients, providers, and health care systems. Further research is needed to validate these findings in a larger cohort of patients and to further develop EEG methods that assess pain intensity in SCD patients.
Abbreviations
BEM, boundary element method; SCD, sickle cell disease; EEG, electroencephalography; ICA, independent component analysis; PSD, power spectral density; COG, center of gravity; FDR, false discovery rate; ED, emergency department; TCD, thalamocortical dysrhythmia; fMRI, functional magnetic resonance imaging; ESI, electrophysiological source imaging; MRI, magnetic resonance imaging; NIH, National Institutes of Health; NSF, National Science Foundation.
Acknowledgments
This work was supported in part by NIH U01 HL117664, NS096761, EB021027, AT009263, MH114233, EB008389, S10OD021721, and by NSF DGE-1069104 and CBET-1450956.
Disclosure
The authors report no conflicts of interest in this work.
References
Gaskin DJ, Richard P. The economic costs of pain in the United States. J Pain. 2012;13(8):715–724. | ||
Apkarian AV, Baliki MN, Geha PY. Towards a theory of chronic pain. Prog Neurobiol. 2009;87(2):81–97. | ||
Ceko M, Bushnell MC, Fitzcharles M-A, Schweinhardt P. Fibromyalgia interacts with age to change the brain. NeuroImage Clin. 2013;3:249–260. | ||
Gustin SM, Peck CC, Cheney LB, Macey PM, Murray GM, Henderson LA. Pain and plasticity: is chronic pain always associated with somatosensory cortex activity and reorganization? J Neurosci. 2012;32(43):14874–14884. | ||
Lee MC, Tracey I. Imaging pain: a potent means for investigating pain mechanisms in patients. Br J Anaesth. 2013;111(1):64–72. | ||
Maeda Y, Kettner N, Sheehan J, et al. Altered brain morphometry in carpal tunnel syndrome is associated with median nerve pathology. NeuroImage Clin. 2013;2:313–319. | ||
Apkarian AV, Sosa Y, Sonty S, et al. Chronic back pain is associated with decreased prefrontal and thalamic gray matter density. J Neurosci. 2004;24(46):10410–10415. | ||
Baliki MN, Mansour AR, Baria AT, Apkarian AV. Functional reorganization of the default mode network across chronic pain conditions. PLos One. 2014;9(9):e106133. | ||
Geha PY, Baliki MN, Harden RN, Bauer WR, Parrish TB, Apkarian AV. The brain in chronic CRPS pain: abnormal gray-white matter interactions in emotional and autonomic regions. Neuron. 2008;60(4):570–581. | ||
May A. Chronic pain may change the structure of the brain. Pain. 2008;137(1):7–15. | ||
Minniti CP, Lu K, Groninger H. Pain in sickle cell disease #270. J Palliat Med. 2013;16(6):697–699. | ||
Platt OS, Thorington BD, Brambilla DJ, et al. Pain in sickle cell disease. N Engl J Med. 1991;325(1):11–16. | ||
Smith WR, Penberthy LT, Bovbjerg VE, et al. Daily assessment of pain in adults with sickle cell disease. Ann Intern Med. 2008;148(2):94–101. | ||
Ballas SK, Gupta K, Adams-Graves P. Sickle cell pain: a critical reappraisal. Blood. 2012;120(18):3647–3656. | ||
Benjamin LJ, Swinson GI, Nagel RL. Sickle cell anemia day hospital: an approach for the management of uncomplicated painful crises. Blood. 2000;95(4):1130–1136. | ||
Brandow AM, Panepinto JA. Clinical interpretation of quantitative sensory testing as a measure of pain sensitivity in patients with sickle cell disease. J Pediatr Hematol Oncol. 2016;38(4):288–293. | ||
Campbell CM, Carroll CP, Kiley K, et al. Quantitative sensory testing and pain-evoked cytokine reactivity: comparison of patients with sickle cell disease to healthy matched controls. Pain. 2016;157(4):949–956. | ||
Keller SD, Yang M, Treadwell MJ, Werner EM, Hassell KL. Patient reports of health outcome for adults living with sickle cell disease: development and testing of the ASCQ-Me item banks. Health Qual Life Outcomes. 2014;12:125. | ||
McClish DK, Levenson JL, Penberthy LT, et al. Gender differences in pain and healthcare utilization for adult sickle cell patients: the PiSCES project. J Womens Health. 2006;15(2):146–154. | ||
Treadwell MJ, Hassell K, Levine R, Keller S. Adult Sickle Cell Quality-of-Life Measurement Information System (ASCQ-Me): conceptual model based on review of the literature and formative research. Clin J Pain. 2014;30(10):902–914. | ||
Dampier CD, Smith WR, Wager CG, et al. IMPROVE trial: a randomized controlled trial of patient-controlled analgesia for sickle cell painful episodes: rationale, design challenges, initial experience, and recommendations for future studies. Clin Trials. 2013;10(2):319–331. | ||
Ballas SK. Sickle cell disease: current clinical management. Semin Hematol. 2001;38(4):307–314. | ||
Boord P, Siddall PJ, Tran Y, Herbert D, Middleton J, Craig A. Electroencephalographic slowing and reduced reactivity in neuropathic pain following spinal cord injury. Spinal Cord. 2007;46(2):118–123. | ||
Van den Broeke EN, Wilder-Smith OHG, van Goor H, Vissers KCP, van Rijn CM. Patients with persistent pain after breast cancer treatment show enhanced alpha activity in spontaneous EEG. Pain Med. 2013;14(12):1893–1899. | ||
Jensen MP, Sherlin LH, Gertz KJ, et al. Brain EEG activity correlates of chronic pain in persons with spinal cord injury: clinical implications. Spinal Cord. 2013;51(1):55–58. | ||
Sarnthein J, Stern J, Aufenberg C, Rousson V, Jeanmonod D. Increased EEG power and slowed dominant frequency in patients with neurogenic pain. Brain. 2006;129(1):55–64. | ||
de Vries M, Wilder-Smith OHG, Jongsma MLA, et al. Altered resting state EEG in chronic pancreatitis patients: toward a marker for chronic pain. J Pain Res. 2013;6:815–824. | ||
Schmidt S, Naranjo JR, Brenneisen C, et al. Pain ratings, psychological functioning and quantitative EEG in a controlled study of chronic back pain patients. PLos One. 2012;7(3):e31138. | ||
Case M, Zhang H, Mundahl J, et al. Characterization of functional brain activity and connectivity using EEG and fMRI in patients with sickle cell disease. NeuroImage Clin. 2017;14:1–17. | ||
Darbari DS, Hampson JP, Ichesco E, et al. Frequency of hospitalizations for pain and association with altered brain network connectivity in sickle cell disease. J Pain. 2015;16(11):1077–1086. | ||
Wang ZJ, Wilkie DJ, Molokie R. Neurobiological mechanisms of pain in sickle cell disease. Hematology Am Soc Hematol Educ Program. 2010;2010(1):403–408. | ||
Wilkie DJ, Molokie R, Boyd-Seal D, et al. Patient-reported outcomes: descriptors of nociceptive and neuropathic pain and barriers to effective pain management in adult outpatients with sickle cell disease. J Natl Med Assoc. 2010;102(1):18–27. | ||
Delorme A, Makeig S. EEGLAB: an open source toolbox for analysis of single-trial EEG dynamics including independent component analysis. J Neurosci Methods. 2004;134(1):9–21. | ||
Klimesch W. EEG alpha and theta oscillations reflect cognitive and memory performance: a review and analysis. Brain Res Rev. 1999;29(2–3):169–195. | ||
RStudio Team. RStudio: Integrated Development for R. Boston, MA: RStudio, Inc.; 2015. Available from: http://www.rstudio.com/. Accessed September 03, 2015. | ||
Krzywinski M, Altman N. Points of significance: nonparametric tests. Nat Methods. 2014;11(5):467–468. | ||
Benjamini Y, Hochberg Y. Controlling the false discovery rate: a practical and powerful approach to multiple testing. J R Stat Soc Ser B Methodol. 1995;57(1):289–300. | ||
Olejnik S, Algina J. Generalized eta and omega squared statistics: measures of effect size for some common research designs. Psychol Methods. 2003;8(4):434–447. | ||
Cohen J. Statistical Power Analysis for the Behavioral Sciences. Hillsdale, NJ: Lawrence Earlbaum Associates; 1988:20–26. | ||
Sawilowsky S. New effect size rules of thumb. J Mod Appl Stat Methods. 2009;8(2):597–599. | ||
Lakens D. Calculating and reporting effect sizes to facilitate cumulative science: a practical primer for t-tests and ANOVAs. Front Psychol. 2013;4:863 | ||
Darbari DS, Onyekwere O, Nouraie M, et al. Markers of severe vaso-occlusive painful episode frequency in children and adolescents with sickle cell anemia. J Pediatr. 2012;160(2):286–290. | ||
Oostenveld R, Fries P, Maris E, Schoffelen J-M. FieldTrip: open source software for advanced analysis of MEG, EEG, and invasive electrophysiological data. Comput Intell Neurosci. 2011;2011:156869 | ||
Hamalainen MS, Sarvas J. Realistic conductivity geometry model of the human head for interpretation of neuromagnetic data. IEEE Trans Biomed Eng. 1989;36(2):165–171. | ||
He B, Musha T, Okamoto Y, Homma S, Nakajima Y, Sato T. Electric dipole tracing in the brain by means of the boundary element method and its accuracy. IEEE Trans Biomed Eng. 1987;34(6):406–414. | ||
Lai Y, van Drongelen W, Ding L, et al. Estimation of in vivo human brain-to-skull conductivity ratio from simultaneous extra- and intra-cranial electrical potential recordings. Clin Neurophysiol. 2005;116(2):456–465. | ||
Oostendorp TF, Delbeke J, Stegeman DF. The conductivity of the human skull: results of in vivo and in vitro measurements. IEEE Trans Biomed Eng. 2000;47(11):1487–1492. | ||
Holmes CJ, Hoge R, Collins L, Woods R, Toga AW, Evans AC. Enhancement of MR images using registration for signal averaging. J Comput Assist Tomogr. 1998;22(2):324–333. | ||
Pascual-Marqui RD. Discrete, 3D distributed, linear imaging methods of electric neuronal activity. Part 1: exact, zero error localization. ArXiv07103341 (math-ph) . 2007. Available from: http://arxiv.org/abs/0710.3341. Accessed May 12, 2017. | ||
Frei E, Gamma A, Pascual-Marqui R, Lehmann D, Hell D, Vollenweider FX. Localization of MDMA-induced brain activity in healthy volunteers using low resolution brain electromagnetic tomography (LORETA). Hum Brain Mapp. 2001;14(3):152–165. | ||
Jatoi MA, Kamel N, Malik AS, Faye I, Begum T. A survey of methods used for source localization using EEG signals. Biomed Signal Process Control. 2014;11:42–52. | ||
Pascual-Marqui RD, Lehmann D, Koukkou M, et al. Assessing interactions in the brain with exact low-resolution electromagnetic tomography. Philos Trans R Soc Lond Math Phys Eng Sci. 2011;369(1952):3768–3784. | ||
Ashburner J, Barnes G, Chen C, et al.. SPM8 Manual. London, UK: Wellcome Trust Centre for Neuroimaging Institute of Neurology; 2012 | ||
Apkarian AV, Bushnell MC, Treede R-D, Zubieta J-K. Human brain mechanisms of pain perception and regulation in health and disease. Eur J Pain. 2005;9(4):463–484. | ||
Stern J, Jeanmonod D, Sarnthein J. Persistent EEG overactivation in the cortical pain matrix of neurogenic pain patients. NeuroImage. 2006;31(2):721–731. | ||
Huishi Zhang C, Sohrabpour A, Lu Y, He B. Spectral and spatial changes of brain rhythmic activity in response to the sustained thermal pain stimulation. Hum Brain Mapp. 2016;37(8):2976–2991. | ||
Roberts K, Papadaki A, Gonçalves C, et al. Contact heat evoked potentials using simultaneous EEG and fMRI and their correlation with evoked pain. BMC Anesthesiol. 2008;8:8. | ||
Farmer MA, Baliki MN, Apkarian AV. A dynamic network perspective of chronic pain. Neurosci Lett. 2012;520(2):197–203. | ||
Emmert K, Breimhorst M, Bauermann T, Birklein F, Van De Ville D, Haller S. Comparison of anterior cingulate vs. insular cortex as targets for real-time fMRI regulation during pain stimulation. Front Behav Neurosci. 2014;8:350. | ||
Stancak A, Fallon N. Emotional modulation of experimental pain: a source imaging study of laser evoked potentials. Front Hum Neurosci. 2013;7:552. | ||
Bush G, Luu P, Posner MI. Cognitive and emotional influences in anterior cingulate cortex. Trends Cogn Sci. 2000;4(6):215–222. | ||
Dolan RJ. Emotion, cognition, and behavior. Science. 2002;298(5596):1191–1194. | ||
Miller EK, Cohen JD. An integrative theory of prefrontal cortex function. Annu Rev Neurosci. 2001;24(1):167–202. | ||
Olesen SS, Hansen TM, Graversen C, Steimle K, Wilder-Smith OHG, Drewes AM. Slowed EEG rhythmicity in patients with chronic pancreatitis: evidence of abnormal cerebral pain processing? Eur J Gastroenterol Hepatol. 2011;23(5):418–424. | ||
Chen ACN, Feng W, Zhao H, Yin Y, Wang P. EEG default mode network in the human brain: spectral regional field powers. NeuroImage. 2008;41(2):561–574. | ||
Yang YM, Shah AK, Watson M, Mankad VN. Comparison of costs to the health sector of comprehensive and episodic health care for sickle cell disease patients. Public Health Rep. 1995;110(1):80–86. | ||
Aisiku IP, Smith WR, McClish DK, et al. Comparisons of high versus low emergency department utilizers in sickle cell disease. Ann Emerg Med. 2009;53(5):587–593. | ||
Yusuf HR, Atrash HK, Grosse SD, Parker CS, Grant AM. Emergency department visits made by patients with sickle cell disease: a descriptive study, 1999–2007. Am J Prev Med. 2010;38(Suppl 4): S536–S541. | ||
Woods K, Karrison T, Koshy M, Patel A, Friedmann P, Cassel C. Hospital utilization patterns and costs for adult sickle cell patients in Illinois. Public Health Rep. 1997;112(1):44–51. | ||
Pascoal-Faria P, Yalcin N, Fregni F. Neural markers of neuropathic pain associated with maladaptive plasticity in spinal cord injury. Pain Pract. 2015;15(4):371–377. | ||
Daniel LC, Li Y, Smith K, et al. Lessons learned from a randomized controlled trial of a family-based intervention to promote school functioning for school-age children with sickle cell disease. J Pediatr Psychol. 2015;40(10):1085–1094. | ||
Nimmer M, Czachor J, Turner L, et al.; for the sickle cell working group of the Pediatric Emergency Care Applied Research Network (PECARN). The benefits and challenges of preconsent in a multisite, pediatric sickle cell intervention trial. Pediatr Blood Cancer. 2016;63(9):1649–1652. | ||
Nottage KA, Hankins JS, Faughnan LG, et al. Addressing challenges of clinical trials in acute pain: the Pain Management of Vaso-occlusive Crisis in Children and Young Adults with Sickle Cell Disease Study. Clin Trials. 2016;13(4):409–416. | ||
Patterson CA, Chavez V, Mondestin V, Deatrick J, Li Y, Barakat LP. Clinical trial decision making in pediatric sickle cell disease: a qualitative study of perceived benefits and barriers to participation. J Pediatr Hematol Oncol. 2015;37(6):415–422. | ||
Stevens EM, Patterson CA, Li YB, Smith-Whitley K, Barakat LP. Mistrust of pediatric sickle cell disease clinical trials research. Am J Prev Med. 2016;51(Suppl 1):S78–S86. | ||
Zou P, Helton KJ, Smeltzer M, et al. Hemodynamic responses to visual stimulation in children with sickle cell anemia. Brain Imaging Behav. 2011;5(4):295–306. | ||
Bush AM, Borzage MT, Choi S, et al. Determinants of resting cerebral blood flow in sickle cell disease. Am J Hematol. 2016;91(9):912–917. | ||
Jordan LC, Gindville MC, Scott AO, et al. Non-invasive imaging of oxygen extraction fraction in adults with sickle cell anaemia. Brain. 2016;139(Pt 3):738–750. | ||
He B, Yang L, Wilke C, Yuan H. Electrophysiological imaging of brain activity and connectivity – challenges and opportunities. IEEE Trans Biomed Eng. 2011;58(7):1918–1931. | ||
Zhang CH, Sha Z, Mundahl J, et al. Thalamocortical relationship in epileptic patients with generalized spike and wave discharges — a multimodal neuroimaging study. NeuroImage Clin. 2015;9:117–127. | ||
Shankar SM, Arbogast PG, Mitchel E, Cooper WO, Wang WC, Griffin MR. Medical care utilization and mortality in sickle cell disease: a population-based study. Am J Hematol. 2005;80(4):262–270. | ||
Ballas SK, Bauserman RL, McCarthy WF, Castro OL, Smith WR, Waclawiw MA. Hydroxyurea and acute painful crises in sickle cell anemia: effects on hospital length of stay and opioid utilization during hospitalization, outpatient acute care contacts, and at home. J Pain Symptom Manage. 2010;40(6):870–882. | ||
Colombatti R, Ermani M, Rampazzo P, et al. Cognitive evoked potentials and neural networks are abnormal in children with sickle cell disease and not related to the degree of anaemia, pain and silent infarcts. Br J Haematol. 2015;169(4):597–600. | ||
Caviness JN, Hentz JG, Belden CM, et al. Longitudinal EEG changes correlate with cognitive measure deterioration in Parkinson’s disease. J Park Dis. 2015;5(1):117–124. | ||
Hardmeier M, Hatz F, Penner IK, et al. Graph measures to characterize resting state connectomes in MS patients: an EEG-study over two years. Clin Neurophysiol. 2016;127(3):e38. | ||
He B, Sohrabpour A. Imaging epileptogenic brain using high density EEG source imaging and MRI. Clin Neurophysiol. 2016;127(1):5–7. | ||
Sohrabpour A, Lu Y, Worrell G, He B. Imaging brain source extent from EEG/MEG by means of an iteratively reweighted edge sparsity minimization (IRES) strategy. NeuroImage. 2016;142:27–42. |
 © 2017 The Author(s). This work is published and licensed by Dove Medical Press Limited. The
full terms of this license are available at https://www.dovepress.com/terms
and incorporate the Creative Commons Attribution
- Non Commercial (unported, 3.0) License.
By accessing the work you hereby accept the Terms. Non-commercial uses of the work are permitted
without any further permission from Dove Medical Press Limited, provided the work is properly
attributed. For permission for commercial use of this work, please see paragraphs 4.2 and 5 of our Terms.
© 2017 The Author(s). This work is published and licensed by Dove Medical Press Limited. The
full terms of this license are available at https://www.dovepress.com/terms
and incorporate the Creative Commons Attribution
- Non Commercial (unported, 3.0) License.
By accessing the work you hereby accept the Terms. Non-commercial uses of the work are permitted
without any further permission from Dove Medical Press Limited, provided the work is properly
attributed. For permission for commercial use of this work, please see paragraphs 4.2 and 5 of our Terms.