Back to Journals » Nature and Science of Sleep » Volume 12
Increased Global PSQI Score Is Associated with Depressive Symptoms in an Adult Population from the United States
Received 2 April 2020
Accepted for publication 17 June 2020
Published 16 July 2020 Volume 2020:12 Pages 487—495
DOI https://doi.org/10.2147/NSS.S256625
Checked for plagiarism Yes
Review by Single anonymous peer review
Peer reviewer comments 2
Editor who approved publication: Dr Sutapa Mukherjee
Ying Huang,1 Meilan Zhu2
1Department of Cardiovascular Medicine, The Second Affiliated Hospital of Nanchang University, Nanchang, Jiangxi 330006, People’s Republic of China; 2Department of Rehabilitation, The Second Affiliated Hospital of Nanchang University, Nanchang, Jiangxi 330006, People’s Republic of China
Correspondence: Meilan Zhu
Department of Rehabilitation, The Second Affiliated Hospital of Nanchang University, No. 1 Minde Road, Donghu District, Nanchang City, Jiangxi 330006, People’s Republic of China
Email [email protected]
Background: Although sleep problems are associated with a wide range of mental problems, it remains uncertain whether the global Pittsburgh Sleep Quality Index (PSQI) score is related to depressive symptoms in an adult population.
Patients and Methods: Data from the Midlife in the United States (MIDUS) study, including a general adult population, were obtained. A total of 1002 individuals (aged 34– 84 years) were included in this study. Linear regression and logistic regression analyses were performed to investigate the association between sleep parameters from the PSQI score and depressive symptoms.
Results: The median age of all participants was 53.0 years old, and 45.2% of them were male. After adjustments were made for sociodemographic characteristics, lifestyle factors, currently diagnosed diseases and inflammatory markers, global PSQI score was significantly associated with depression score in the linear regression model (0.298 [0.207– 0.389], P< 0.001; Model 3). A higher global PSQI score was independently and significantly associated with depressive symptoms (score ≥ 16) in the logistic regression model (1.235 [1.150– 1.325], P< 0.001; Model 3). Stratified analysis showed that the independent association between global PSQI score and depressive symptoms was affected by hypnotics use, but not antidepressants use.
Conclusions: A higher global PSQI score is significantly associated with a higher risk of depressive symptoms in an adult population from the United States. Future longitudinal and interventional studies are warranted to assess whether reducing the global PSQI score may improve symptoms of depression.
Keywords: Pittsburgh Sleep Quality Index, depression, cross-sectional study
Introduction
Depression is a common disease worldwide. More than three hundred million people around the world were suffer from it, which causes a heavy medical burden and serious disability.1,2 Depression is predicted to be the world’s leading cause of disability and/or suicide in the 10 years after 2020.3 In developed countries, the percentage of depression is more than 15% among the general population.4 Although accumulating studies have been conducted in the past few decades, the etiologies for depression are not understood clearly. Therefore, finding effective methods or modifiable risk factors is necessary to predict depression and then prevent it.
Sleep disorders, such as shorter or longer sleep time, poor sleep quality and others, have gradually become serious public health problems owing to various social factors.5,7 Studies have found close associations between poor sleep status and adverse health outcomes, including hypertension, coronary heart disease, stroke, diabetes mellitus and obesity.8,11 Besides the relationship with these diseases, poor sleep status is also related to psychological problems.12 Existing studies have reported bidirectional associations between sleep disorders and depression. For instance, several studies have demonstrated that poor sleep can exacerbate mood disturbance and the disorder might be alleviated after improved sleep quality.13,14 Sleep-related problems, including short sleep duration, sleep disturbance, long sleep latency, low sleep efficiency and excessive daytime sleepiness, among teenagers or adults are associated with increased depressive symptoms, which include sadness, irritability, worthlessness, low motivation, difficulty concentrating and thoughts of self-harm/suicide.15,20 However, the mechanisms that may clarify the association between bad sleep status and depression are still unclear. A popular view is that inflammation may have intermediate effects on the association between sleep and depression.15,20 Increasing evidence has demonstrated that impaired sleep independently contributes to an increased risk of chronic inflammatory diseases such as cardiovascular diseases (CVDs).21 We have previously suggested that poor sleep quality is associated with proinflammatory responses in the general population.22 Importantly, depression is also a chronic inflammatory disease, which may provide a pathway linking impaired sleep to depressive symptoms.
Considering the common role of inflammation in poor sleep and depression, it was hypothesized that bad sleep status is associated with depressive symptoms. So far, there have been few studies on the association of the global Pittsburgh Sleep Quality Index (PSQI) score, consisting of seven sleep parameters for assessing different sleep problems, with depressive symptoms in general adult populations. It would be very valuable and practical for general populations to predict the depressive symptoms by the comprehensive sleep score. This study aimed to estimate global PSQI score in all participants from a general US population and to examine the association between global PSQI score and depressive symptoms, independent of confounding factors, including sociodemographic characteristics, lifestyle factors and other relevant variables. Moreover, we further evaluated the value of the global sleep score (global PSQI score) in predicting the risk of depressive symptoms.
Patients and Methods
Study Population
The data for this study were obtained from the Midlife in the United States (MIDUS) study, with the national sample (US) consisting of a general adult population. Associations between behavioral, psychological and social factors and public health problems were investigated in the MIDUS study. As a subgroup of the MIDUS study, 1255 participants completed the Biomarkers Project, which provided sociodemographic, behavioral, psychological and biological assessments for all participants. This produced sufficient data to be assessed by multivariate analysis.23 For the purpose of our study, data for the remaining 1002 participants (age 34–84 years) included in our study were further analyzed owing to the missing data (global PSQI score and depression score) for 253 participants.
Full details of the Biomarkers Project protocol from the MIDUS study are available elsewhere.23,24 Complete data and specific codebooks are also available at http://www.midus.wisc.edu/. To sum up, participants in the MIDUS study were originally recruited in 1995–1996. They were followed up using e-mail and follow-up phone calls. All living participants in the first MIDUS survey who could safely go to the clinic were considered eligible for participation in the Biomarkers Project. Data were collected at one of three affiliated General Clinical Research Centers of the MIDUS study (University of California–Los Angeles; University of Wisconsin–Madison; Georgetown University). Using a standardized protocol that was consistent across the three sites, participants completed detailed self-administered questionnaires, and underwent medical history interviews and the collection of blood specimens during a 2-day visit. Each participant was remunerated $200 for participating, and traveling expenses were covered. Serum samples from all participants were collected and tested during the 2-day visit. Serum inflammatory markers, including C-reactive protein (CRP), interleukin-6 (IL-6) and tumor necrosis factor-ɑ (TNF-ɑ), were measured. According to Declaration of Helsinki guidelines, the Ethics Committee of the three affiliated General Clinical Research Centers of the MIDUS study approved this prospective study and all patients gave written informed consent.
Global PSQI Score Assessment
Sleep quality was measured using the PSQI score.25 The PSQI is widely used and is a reliable indicator that can reflect global sleep status in different populations, including general populations and individuals with sleep problems or mental disorders, over the past month. The 19 items are divided into seven component scores that reflect the severity of various sleep problems in the following aspects: subjective sleep quality, sleep latency, sleep duration, habitual sleep efficiency, sleep disturbance, use of sleep medication and daytime dysfunction. The global PSQI score, ranging from 0 to 21, can be collected by summing the seven components after weighting them on a scale ranging from 0 to 3 [ɑ=0.74]. For each component, as well as the global PSQI score, higher sleep scores show worse sleep quality.25,26
Depression Assessment
The Center for Epidemiological Studies Depression (CES-D) scale was used for assessing depressive symptoms in the MIDUS study.27 The standard cut-off point for CES-D is 16, and a score of 16 or higher has been defined as indicative of clinically significant depressive symptoms.27 The CES-D scale has been used widely in epidemiological studies and is a well-validated measure with reliability in ethnically diverse populations.28
Covariates
Results in this study need to be adjusted because some variables are known for their associations with sleep or depressive symptoms. Sociodemographic characteristics and lifestyle factors, including age, gender, race, education, marital status, smoking status, number of drinking years and exercise, were obtained from self-evaluation questionnaires. The questionnaires also collected data on self-reported comorbidities, including currently diagnosed heart disease, hypertension, transient ischemic attack (TIA) or stroke, diabetes mellitus, cholesterol problems, asthma, emphysema/chronic obstructive pulmonary disease (COPD), cancer and arthritis. Marital status was defined as “currently married” or “not currently married”. Education was defined as “with bachelor’s degree or higher” or “high-school education and lower”. The participants were categorized as normal weight (body mass index [BMI] <25 kg/m2), overweight (25≤ BMI <30 kg/m2) and obese (BMI ≥30 kg/m2). Smoking status was classified as “current smoker” or “not current smoker”. Exercise was defined as “whether or not has the frequency of exercise ≥3 times/week”. Self-reported comorbidities, antidepressants use and hypnotics use were each dichotomized as “yes” or “no”.
The Perceived Stress Scale (PSS) is a 10-item measure that can assess the degree of pressure on participants in their lives.29 Each item (eg, “In the past month, how often have you been upset because of something that happened unexpectedly?”) uses a five-point scale ranging from 1 (never) to 5 (very often). All items were reverse-coded as needed, so that a higher score shows heavier perceived stress [ɑ=0.84].
Statistical Analysis
Analyses were performed using SPSS 24.0 and R 3.4. The normality of the data was analyzed by the Kolmogorov–Smirnov test combined with Q-Q plots. All continuous variables in the study were not normally distributed and are expressed as the median (interquartile range [IQR]). The categorical variables are expressed as n (%). Multivariate linear regression was used to examine the relationship between global PSQI score and depression score. Logistic regression was performed to examine the association between global PSQI score and depressive symptoms (score ≥16). Adjustments were made for age, gender, race, education, BMI, currently married, current smoker, number of drinking years, exercise, perceived stress score, self-reported comorbidities (currently diagnosed heart disease, hypertension, TIA or stroke, diagnosed diabetes, cholesterol problems, asthma, emphysema/COPD, cancer and arthritis) and serum inflammatory markers (IL-6, TNF-ɑ and CRP). Stratified analyses were performed by adding “hypnotics use” and “antidepressants use” as the stratification variables to examine whether medications impacted the association between global PSQI score and depressive symptoms. In addition, a restricted cubic spline model was performed to evaluate the odds ratios (ORs) of depressive symptoms with global sleep score (global PSQI score). P values ≤0.05 were considered statistically significant.
Results
Characteristics of All Participants
Table 1 presents the characteristics of the 1002 participants included in the study. The median age of all participants in this study was 53.0 years. The sociodemographic characteristics were as follows: 453 participants (45.2%) were males; 927 participants (92.5%) were white; 211 participants (21.1%) were currently married; 413 participants (41.2%) had a bachelor’s degree or higher; 154 participants (15.4%) were current smokers; and 774 (77.2%) participants had a frequency of exercise ≥3 times/week. The median number of drinking years was 5. The medians of global PSQI score, depression score and perceived stress score were 5, 7 and 22, respectively.
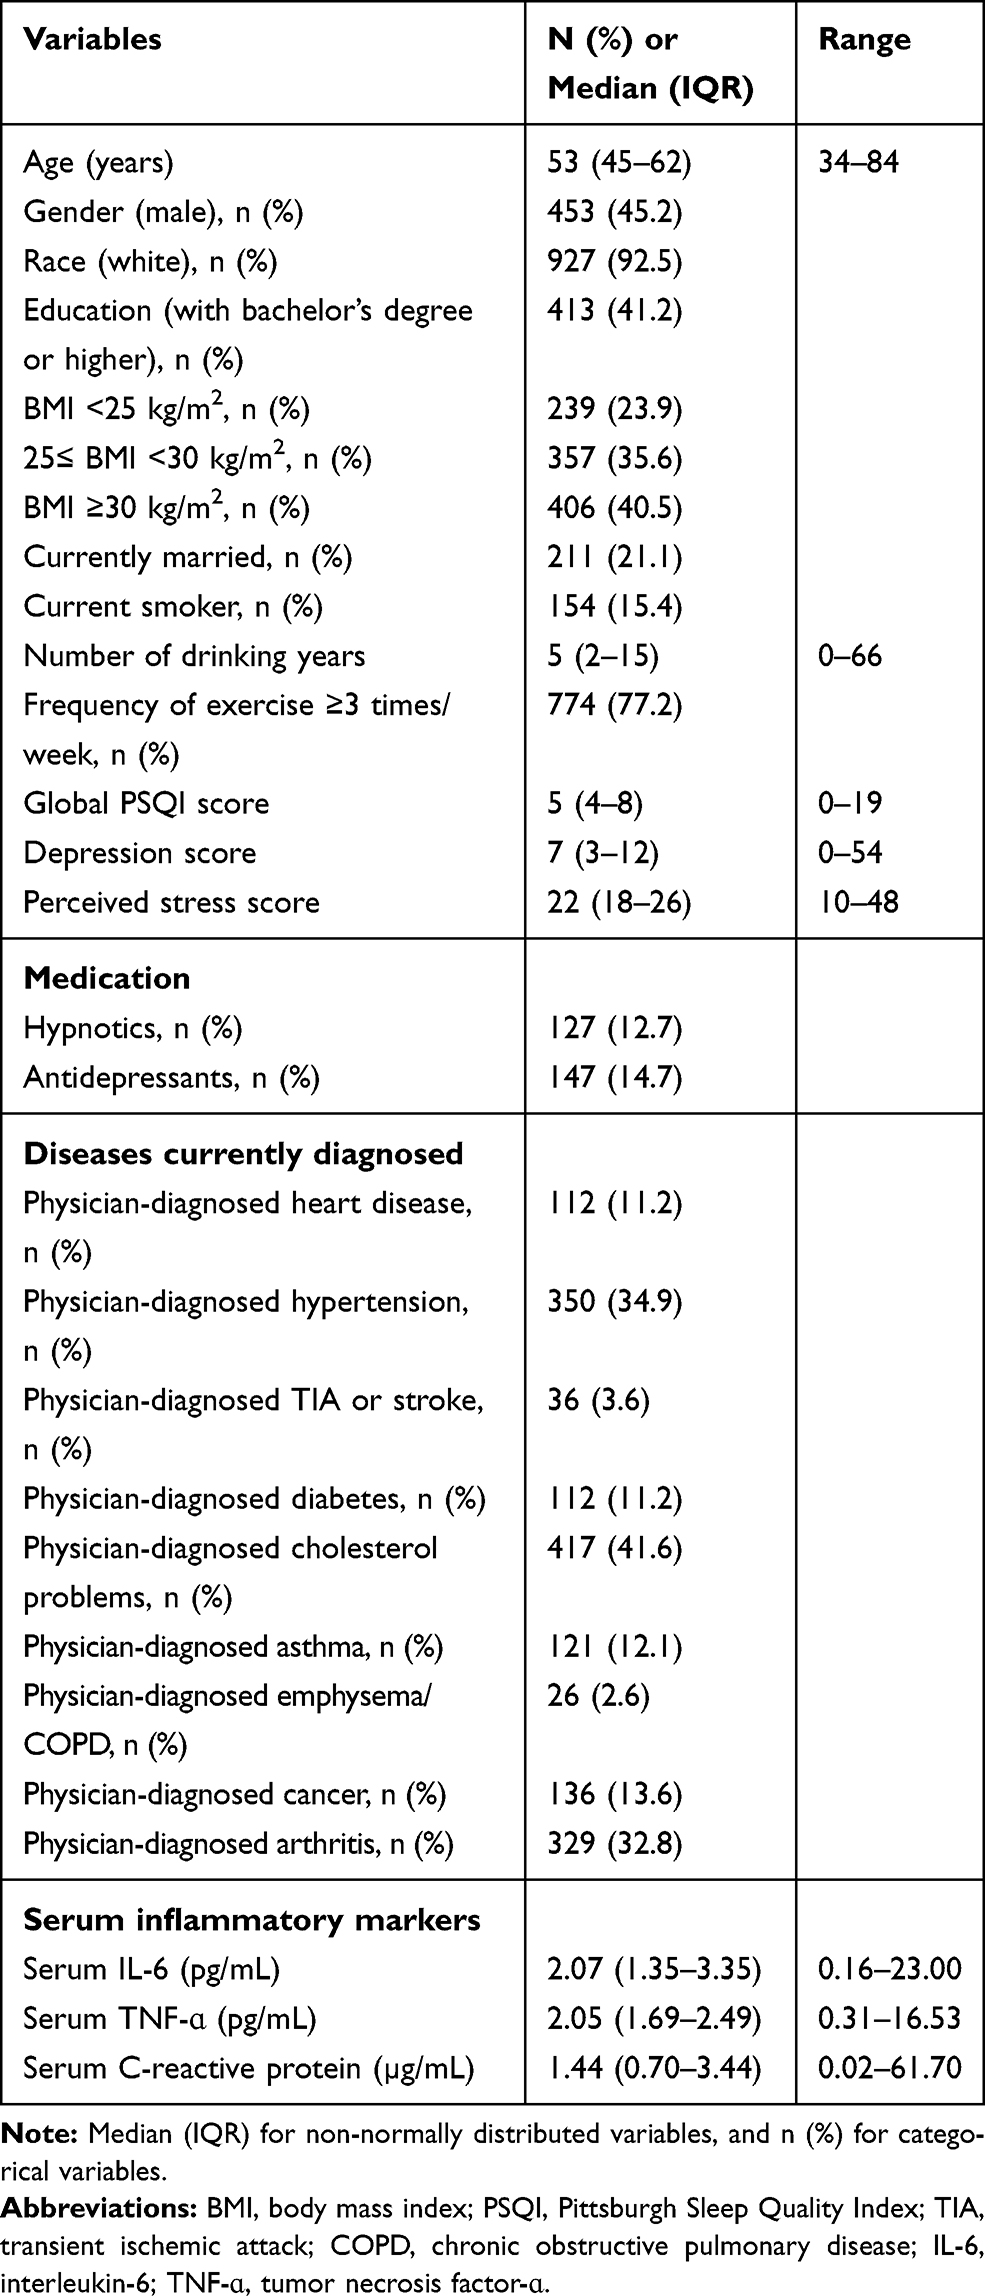 |
Table 1 Characteristics of Participants (N=1002) |
Poor Sleep Status Is Associated with Higher Depression Score by Multivariate Linear Regression Analysis
The regression coefficient with the 95% confidence interval (CI) of 0.301 (0.210–0.391) in Model 2 (Table 2) indicated that global PSQI score was significantly associated with the depression score after adjusting for age, gender, race, education, BMI, currently married, current smoker, number of drinking years, exercise, perceived stress score and currently diagnosed diseases. Model 3 suggested that a higher global PSQI score was still significantly related to a higher depression score after adding serum inflammatory markers (IL-6, TNF-ɑ and C-RP) to Model 2, with a regression coefficient (95% CI) of 0.298 (0.207–0.389). We also found that subjective sleep quality (0.542 [0.063–1.021]), sleep latency (0.678 [0.338–1.017]), sleep duration (0.714 [0.324–1.104]), habitual sleep efficiency (0.592 [0.294–0.890]), sleep disturbances range (0.936 [0.385–1.488]), sleeping medication (0.609 [0.329–0.890]) and daytime dysfunction (1.155 [0.648–1.662]) were significantly associated with depression score after these same confounding factors were fully adjusted in Model 3 (Table 2).
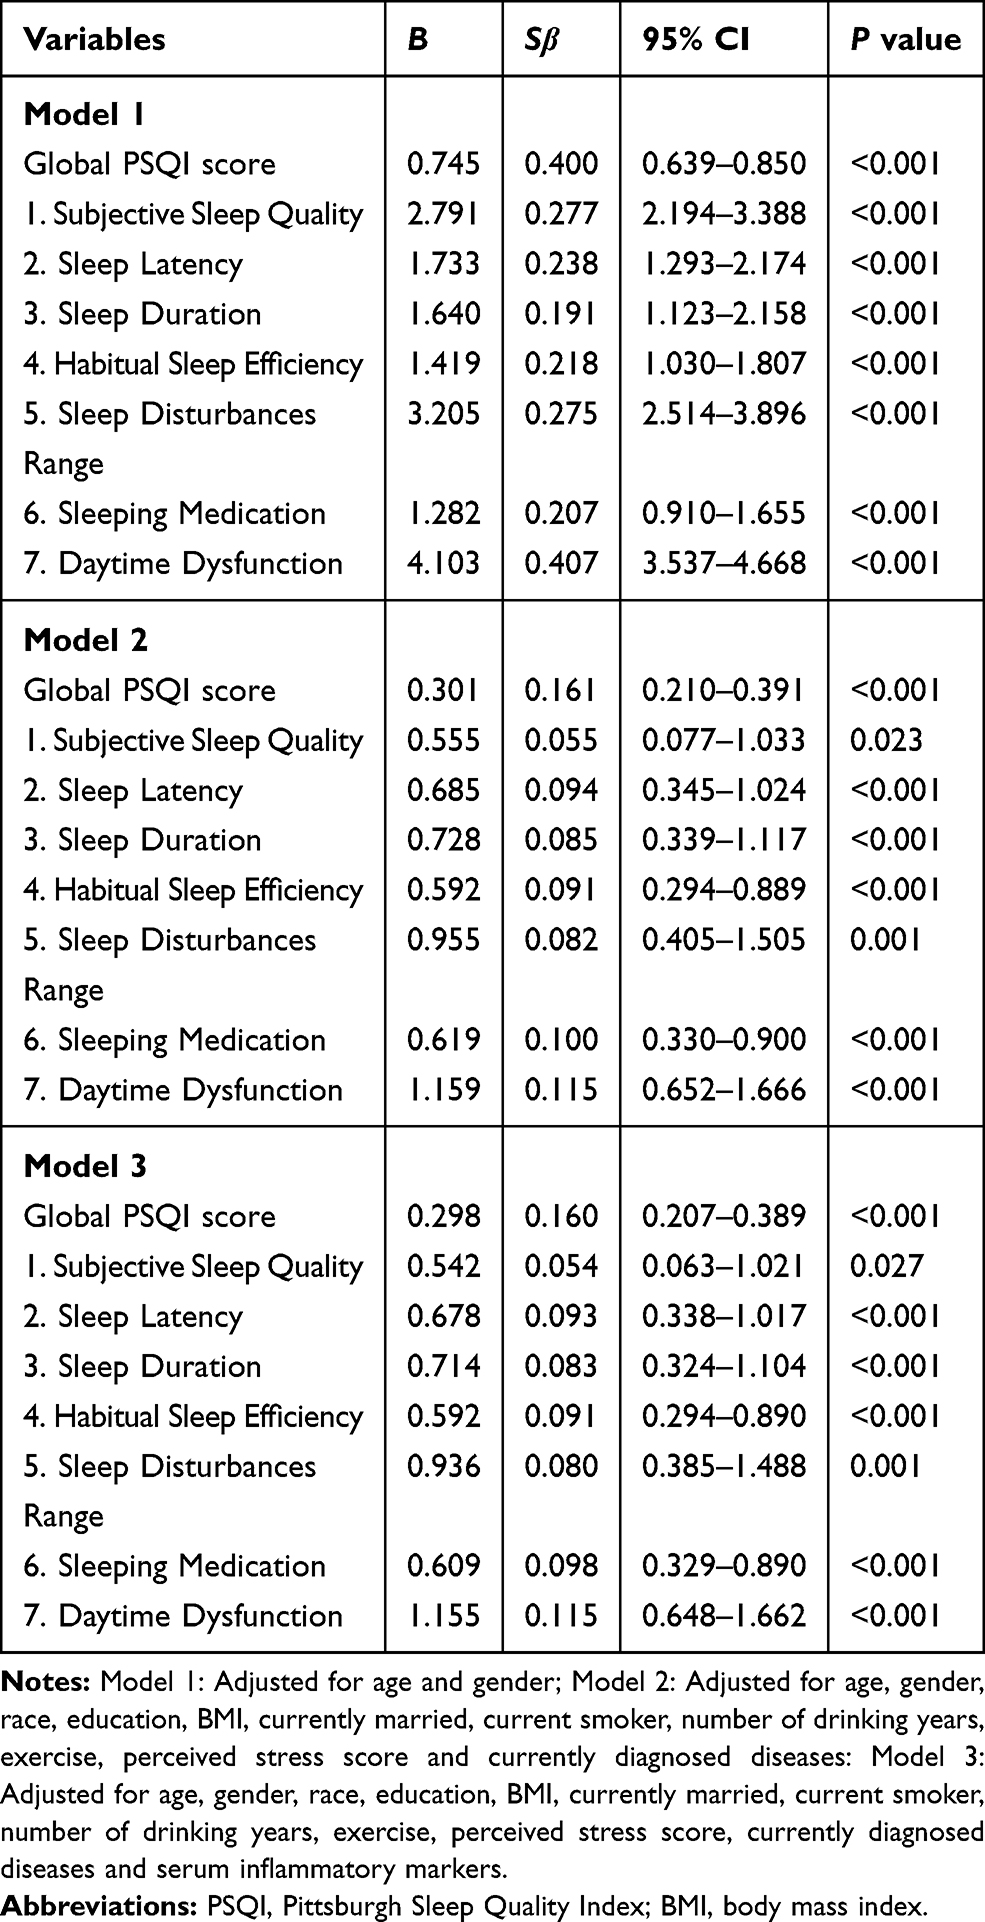 |
Table 2 Multiple Linear Regression Analysis for Relationship Between Sleep Parameters and Depression Score |
Global PSQI Score Is Associated with Depressive Symptoms (Score ≥16) by Multivariate Logistic Regression Analysis
Table 3 presents the ORs and 95% CIs of depressive symptoms for global PSQI score. Model 1 indicated that higher global PSQI score was associated with depressive symptoms (1.310 [1.247–1.376]) after adjusting for age and gender. The association (1.232 [1.149–1.321]) was similar to those of Model 1 after adjustments were made for age, gender, race, education, BMI, currently married, current smoker, number of drinking years, exercise, perceived stress score and currently diagnosed diseases (Model 2). The results in Model 3 remained statistically significant and changed little when serum inflammatory markers (IL-6, TNF-ɑ and CRP) were added to Model 2. The fully adjusted OR of depressive symptoms in Model 3 was 1.235 (1.150–1.325), which suggested that a one-point increase in the global PSQI score increased the risk of depressive symptoms by 23.5% in these participants.
 |
Table 3 Multiple Logistic Regression Analysis for Relationship Between Global PSQI Score and Depressive Symptoms (Score ≥16) |
The association between global sleep score (PSQI score) and depressive symptoms was further determined using restricted cubic spline analysis (Figure 1). The results, suggesting an upward curve association, showed that higher global sleep score (global PSQI score) was strongly associated with increasing risk of depressive symptoms. The risk of depressive symptoms was significantly elevated after the global PSQI score reached a critical value (score=5).
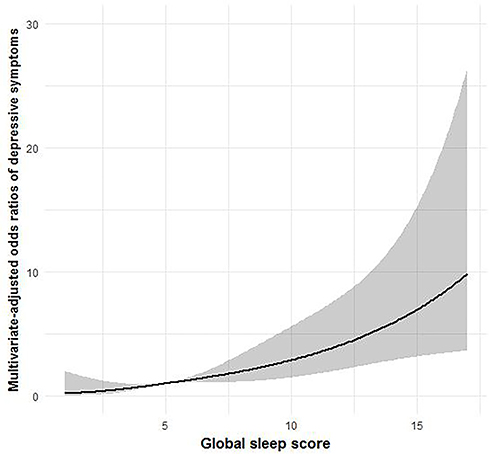 |
Figure 1 Restricted cubic spline model of the odds ratios of depressive symptoms (score ≥16) with global sleep score (global PSQI score). The gray area represents the 95% confidence intervals. |
Global PSQI Score Is Associated with Depressive Symptoms by Stratified Analysis
Table 4 presents a stratified analysis by antidepressants use. Model 3 indicated that global PSQI score was still independently associated with depressive symptoms (1.226 [1.310–1.329]) in participants without antidepressants use. This association remained significant in participants with antidepressants use in Model 3 (1.324 [1.066–1.643]). In addition, hypnotics use was added as a stratified variable for analyzing the association of global PSQI score with depressive symptoms (Table 5). The results showed that global PSQI score was independently associated with depressive symptoms (1.258 [1.159–1.366]) in participants without hypnotics use in Model 3. However, the significant association did not exist in participants with hypnotics use (1.110 [0.847–1.454]).
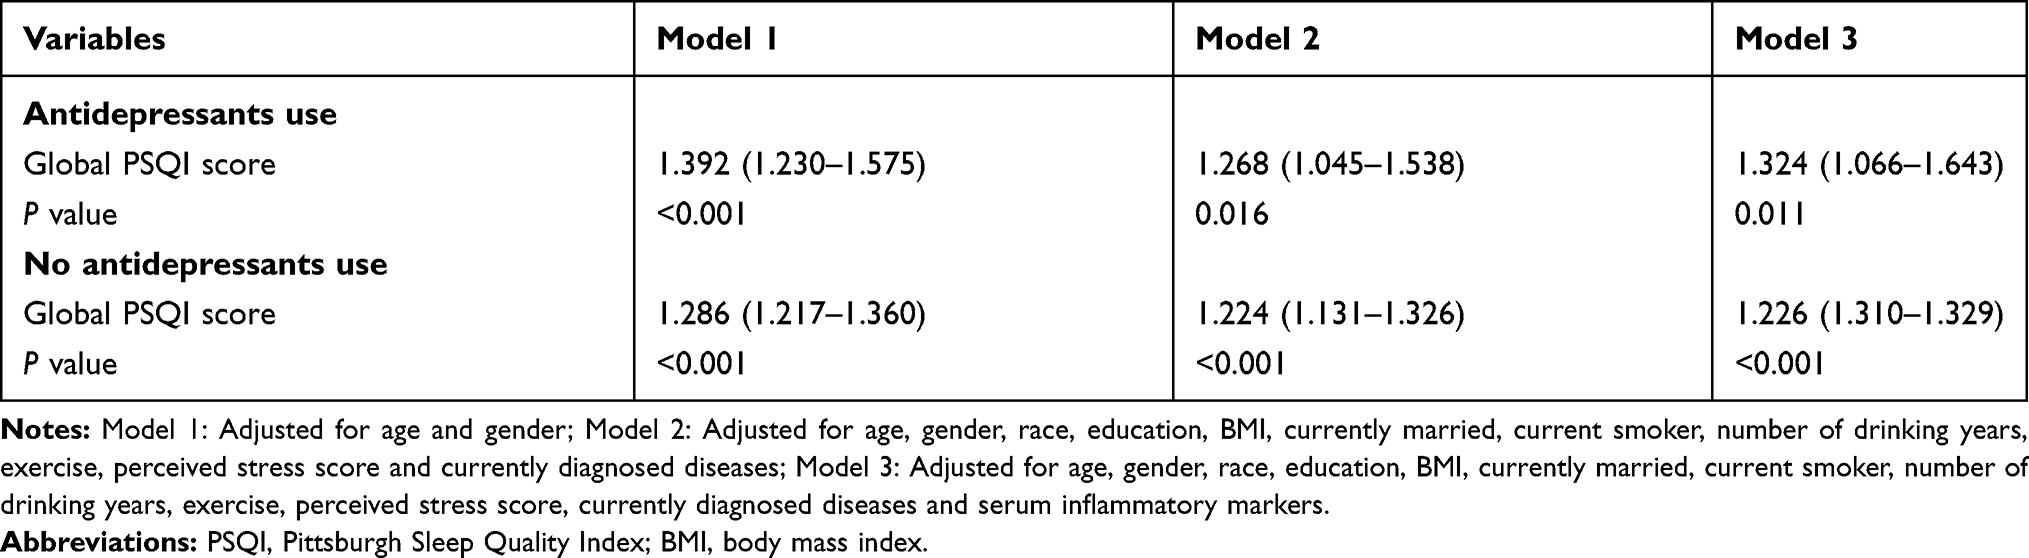 |
Table 4 Multiple Logistic Regression Analysis for Relationship Between Global PSQI Score and Depressive Symptoms (Score ≥16) Stratified by Antidepressants Use |
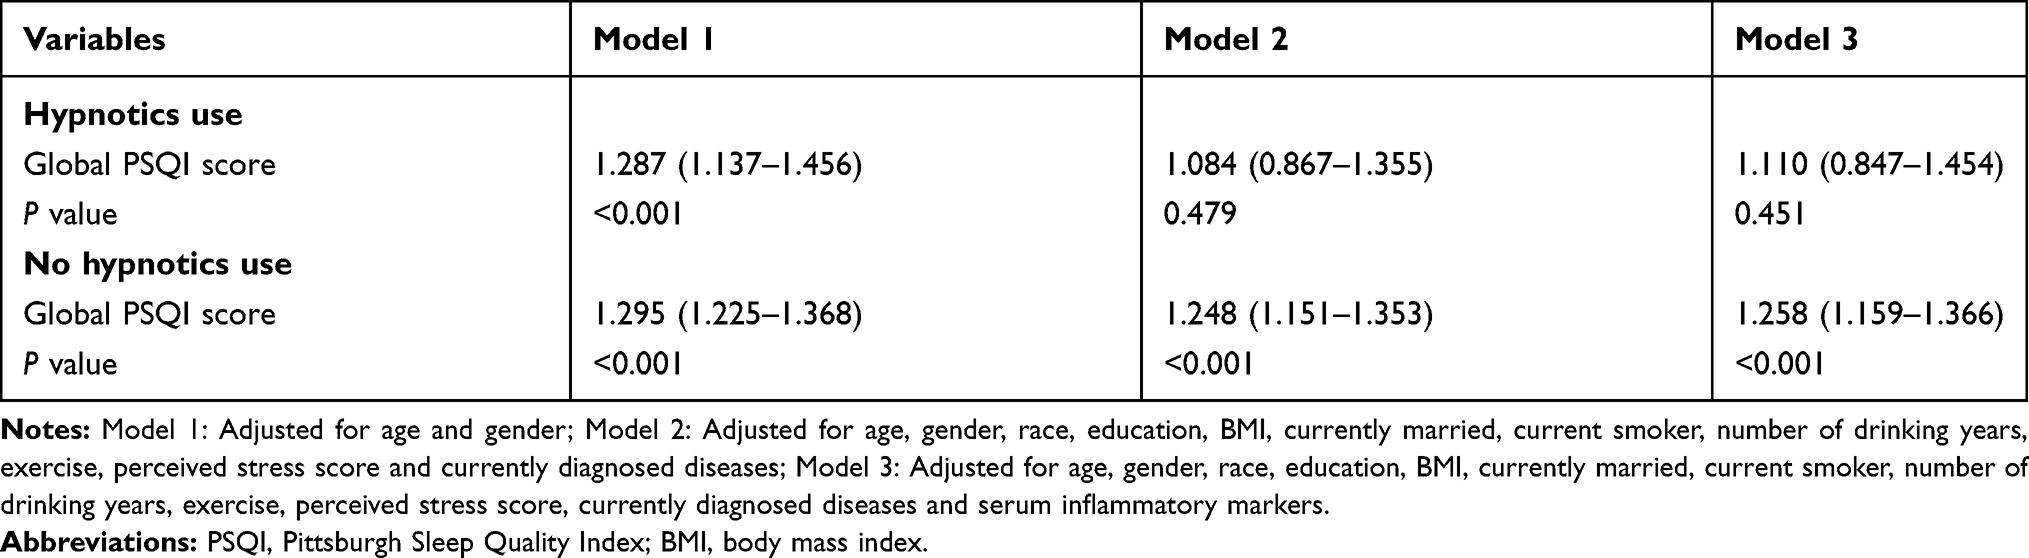 |
Table 5 Multiple Logistic Regression Analysis for Relationship Between Global PSQI Score and Depressive Symptoms (Score ≥16) Stratified by Hypnotics Use |
Discussion
This study suggested that global PSQI score is strongly associated with an increased risk of depressive symptoms (score ≥16). Each sleep parameter from the PSQI was also strongly associated with depression score by multivariate linear regression analysis. Furthermore, global PSQI score was independently associated with depressive symptoms in participants without hypnotics use, but not in participants with hypnotics use by the stratified analysis. However, the association between global PSQI score and depressive symptoms was not affected by antidepressants use.
Sleep-related research has been carried out for decades. Poor sleep status is an important risk factor for chronic health problems such as CVDs and psychological problems.30,31 The relationships between sleep problems and depression have been reported in different populations.12,20 For example, short sleep duration among teenagers was associated with increased depressive symptoms including sadness, irritability, worthlessness, low motivation, difficulty concentrating and thoughts of self-harm/suicide.15 Long-term sleep disturbance was associated with severity of depressive symptoms in adult patients with obstructive sleep apnea.16 Poor subjective sleep quality was strongly associated with depression, leading to a poor quality of life among obese patients.17 Children with excessive daytime sleepiness tended to have parent-reported symptoms of depression.18 In addition, the relationships between depression and other sleep problems, including sleep latency and sleep efficiency, have been previously examined.19,20,32,33 Consistent with these previous studies, the results in this study showed a strong correlation between poor sleep status (global PSQI score ≥8) and depressive symptoms (depression score ≥16) after adjustments were made for sociodemographic characteristics, lifestyle factors, currently diagnosed diseases and serum inflammatory markers. Our findings suggested that global PSQI score, as a well-established indicator of sleep status, may be a reliable tool to assess the risk of depressive symptoms in the general population. When the cut-off of global PSQI score reached 5, the risk of depressive symptoms increased significantly, which suggested that individuals may suffer from depression when the global PSQI score is more than 5 (Figure 1). Our study subjects were from the general adult population, which may cause some differences in the results compared with previous studies.
Over one-quarter of people from the United States suffer from sleep disorders, and about one-third of adults suffer from at least one insomnia complaint.34 Importantly, most patients with depression experience impaired sleep and nearly 80% experience insomnia.35,36 Patients with depression can show characteristic changes on sleep electroencephalogram (EEG), including prolonged sleep latency, disinhibition of rapid eye movement (REM) sleep and changes in non-REM sleep.36,38 Some studies have shown that REM latency may indicate depression, and most antidepressants suppress REM sleep.39,40 Hence, it was hypothesized that REM suppression is the mechanism of action of antidepressants.41 However, our results suggested that global PSQI score was still independently associated with depressive symptoms in participants with antidepressants use (Table 4). Treatment for depression did not appear to have a significant effect on the association of global PSQI score with depressive symptoms. The inflammatory mechanism may also partly explain the independent relationship. Existing evidence has suggested that poor sleep independently contributes to risk of chronic inflammatory diseases such as CVDs.21 Our previous study suggested that poor sleep quality was associated with proinflammatory responses in the general population.22 Depression is also a chronic inflammatory disease and inflammatory response may provide a pathway linking impaired sleep to depressive symptoms, although the exact reason remains to be further investigated. In addition, considering the impact of hypnotics use on sleep, stratified analysis (Table 5) revealed that the association between global PSQI score and depressive symptoms was affected by hypnotics use. Global PSQI score was not significantly associated with depressive symptoms in participants with hypnotics use. We thought that this may be accounted for by sleep quality being improved by hypnotics use in participants with poor sleep.
This study had many strengths, including the general population-based samples and the large sample size. The results of our study contribute to the literature in three main aspects. First, the data analyzed in this study were from the MIDUS study, a national (US) sample of the adult population. This study proved that global PSQI score was closely associated with depressive symptoms, which expanded research on the associations between sleep problems and depression. The global PSQI score may be a reliable indicator for predicting depressive status in the future. Second, we used a measure of calculating the global PSQI score to assess individuals’ overall sleep status. This global sleep score from PSQI represents a stable sleep status over a long period. The sleep assessment tool is very simple and convenient for general populations. Third, independent correlation between global PSQI score and depression score was proven after adjustments were made for sufficient confounding factors, including sociodemographic characteristics, lifestyle factors, age-related comorbidities and serum inflammatory markers. Given the potential link between depression and inflammation, we collected related biochemistry data, including inflammatory markers, in this study. However, the biochemical data were not adjusted in previous studies.
There were a few limitations to the present study. To begin with, this was a cross-sectional study and it was not possible to make causal inferences. Moreover, to participate in this study, all participants needed to be healthy enough to go to a MIDUS study research center, which may lead to the potential for bias. Finally, the global PSQI score is used for assessing participants’ self-reported sleep status. A more objective tool, such as sleep EEG, is a better way to assess the association between sleep status and depressive symptoms.
Conclusions
Good sleep quality may be particularly important for adult populations to prevent chronic health problems. Higher global PSQI scores are significantly associated with an increased risk of depressive symptoms among the general adult population in the US. The global sleep score from PSQI may provide a predictive value for detecting early depressive symptoms.
Acknowledgments
We thank all individuals who were responsible for the planning and administering of the MIDUS study and making the datasets of MIDUS available on their website. We also acknowledge the reviewers and editors for viewing our work.
Disclosure
The authors declare no conflicts of interest and have nothing to disclose.
References
1. Li Z, Wang W, Xin X, et al. Association of total zinc, iron, copper and selenium intakes with depression in the US adults. J Affect Disord. 2017;S016503271731128X.
2. Vancampfort D, Stubbs B, Mugisha J, et al. Correlates of sedentary behavior in 2,375 people with depression from 6 low- and middle-income countries. J Affect Disord. 2018;234:97–104. doi:10.1016/j.jad.2018.02.088
3. Ferrari AJ, Charlson FJ, Norman, et al. Burden of depressive disorders by country, sex, age, and year: findings from the global burden of disease study 2010. PLoS Med. 2013;10(11):e1001547. doi:10.1371/journal.pmed.1001547
4. Bromet E, Andrade LH, Hwang I, et al. Cross-national epidemiology of DSM-IV major depressive episode. BMC Med. 2011;9(1):90. doi:10.1186/1741-7015-9-90
5. Drapeau CW, Nadorff MR, McCall WV, et al. Screening for suicide risk in adult sleep patients. Sleep Med Rev. 2019;46:17–26. doi:10.1016/j.smrv.2019.03.009
6. Sun W, Ling J, Zhu X, et al. Associations of weekday-to-weekend sleep differences with academic performance and health-related outcomes in school-age children and youths. Sleep Med Rev. 2019;46:27–53. doi:10.1016/j.smrv.2019.04.003
7. Patel SR. Social and demographic factors related to sleep duration. Sleep. 2007;30(9):1077–1078. doi:10.1093/sleep/30.9.1077
8. Cappuccio FP, Cooper D, D’Elia L, et al. Sleep duration predicts cardiovascular outcomes: a systematic review and meta-analysis of prospective studies. Eur Heart J. 2011;32(12):1484–1492. doi:10.1093/eurheartj/ehr007
9. Cappuccio FP, Taggart FM, Kandala NB, et al. Meta-analysis of short sleep duration and obesity in children and adults. Sleep. 2008;31(5):619–626. doi:10.1093/sleep/31.5.619
10. Cappuccio FP, Lanfranco D, Strazzullo P, et al. Quantity and quality of sleep and incidence of type 2 diabetes. Diabetes Care. 2009;33(2):414–420. doi:10.2337/dc09-1124
11. Cappuccio FP, Stranges S, Kandala NB, et al. Gender-specific associations of short sleep duration with prevalent and incident hypertension: the whitehall II study. Hypertension. 2007;50(4):693–700. doi:10.1161/HYPERTENSIONAHA.107.095471
12. Hamilton NA, Nelson CA, Kitzman NS. Sleep and psychological well-being. Soc Indic Res. 2007;82(1):147–163. doi:10.1007/s11205-006-9030-1
13. Gruber R, Wiebe C. Sleep patterns and the risk for unipolar depression: a review. Nat Sci Sleep. 2012.
14. Jansson-Frojmark M, Lindblom K. A bidirectional relationship between anxiety and depression, and insomnia? A prospective study in the general population. J Psychosom Res. 2008;64:443–449. doi:10.1016/j.jpsychores.2007.10.016
15. Yeo SC, Jos AM, Erwin C, et al. Associations of sleep duration on school nights with self-rated health, overweight, and depression symptoms in adolescents: problems and possible solutions. Sleep Med. 2018.
16. Bjorvatn B, Rajakulendren N, Lehmann S, et al. Increased severity of obstructive sleep apnea is associated with less anxiety and depression. J Sleep Res. 2017.
17. Hosseini AM, Alison J, Iraida N, et al. The complex associations among sleep quality, anxiety-depression, and quality of life in patients with extreme obesity. Sleep. 12:12.
18. Calhoun SL, Vgontzas AN, Julio FM, et al. Prevalence and risk factors of excessive daytime sleepiness in a community sample of young children: the role of obesity, asthma, anxiety/ depression, and sleep. Sleep. 4:4.
19. Plante DT. Sleep propensity in psychiatric hypersomnolence: a systematic review and meta-analysis of multiple sleep latency test findings. Sleep Med Rev. 2016;S1087079216000071.
20. Palagini L, Baglioni C, Ciapparelli A, et al. REM sleep dysregulation in depression: state of the art. Sleep Med Rev. 2013;17(5):377–390. doi:10.1016/j.smrv.2012.11.001
21. Irwin MR, Opp MR. Sleep-health: reciprocal regulation of sleep and innate immunity. Neuropsychopharmacology. 2016.
22. Huang Y, Jiang Y, Zhu M. The relationship between global sleep score and inflammatory markers in obese adults from the United States. Nat Sci Sleep. 2019;11:317–324. doi:10.2147/NSS.S220436
23. Dienberg Love G, Seeman TE, Weinstein M, et al. Bioindicators in the MIDUS national study: protocol, measures, sample, and comparative context. J Aging Health. 2010;22(8):1059–1080. doi:10.1177/0898264310374355
24. Gruenewald TL, Karlamangla AS, Hu P, et al. History of socioeconomic disadvantage and allostatic load in later life. Soc Sci Med. 2012;74(1):75–83. doi:10.1016/j.socscimed.2011.09.037
25. Buysse DJ, Iii CFR, Monk TH, et al. The Pittsburgh sleep quality index: A new instrument for psychiatric practice and research. Psychiatry Res. 1989;28(2):193–213. doi:10.1016/0165-1781(89)90047-4
26. Shahid A, Wilkinson K, Marcu S, et al. Pittsburgh Sleep Quality Index (PSQI)[M]//STOP, That and One Hundred Other Sleep Scales. New York: Springer; 2011.
27. Radloff LS. The CES-D scale: a self-report depression scale for research in the general population. Appl Psychol Meas. 1977;1:385–401. doi:10.1177/014662167700100306
28. Karim J, Weisz R, Bibi Z. Validation of the eight-item Center for Epidemiologic Studies Depression Scale (CES-D) among older adults. Current Psychol. 2015;34:681–692. doi:10.1007/s12144-014-9281-y
29. Cohen S. A global measure of perceived stress. J Health Soc Behav. 1983;24.
30. Meisinger C, Heier M, Löwel H, et al. Sleep duration and sleep complaints and risk of myocardial infarction in middle-aged men and women from the general population: the MONICA/KORA Augsburg Cohort study. Sleep. 2007;30(9):1121–1127. doi:10.1093/sleep/30.9.1121
31. Shankar A, Koh WP, Yuan JM, et al. Sleep duration and coronary heart disease mortality among chinese adults in singapore: a population-based cohort study. Am J Epidemiol. 2008;168(12):1367–1373. doi:10.1093/aje/kwn281
32. Grandner MA, Hale L, Moore M, et al. Mortality associated with short sleep duration: the evidence, the possible mechanisms, and the future. Sleep Med Rev. 2010;14(3):0–203. doi:10.1016/j.smrv.2009.07.006
33. Gallicchio L, Kalesan B. Sleep duration and mortality: a systematic review and meta-analysis. J Sleep Res. 2010;18(2):148–158. doi:10.1111/j.1365-2869.2008.00732.x
34. Ohayon MM. Epidemiology of insomnia: what we know and what we still need to learn. Sleep Med Rev. 2002;6(2):0–111. doi:10.1053/smrv.2002.0186
35. None. Extended sleep (hypersomnia) in young depressed patients. Am J Psychiatry. 1985;142(8):905–910. doi:10.1176/ajp.142.8.905
36. Armitage R. Sleep and circadian rhythms in mood disorders. Acta Psychiatr Scand. 2007;115(s433):104–115. doi:10.1111/j.1600-0447.2007.00968.x
37. Reynolds CF, Kupfer DJ. Sleep research in affective illness: state of the art circa 1987. Sleep. 1987;10(3):199–215. doi:10.1093/sleep/10.3.199
38. Benca RM, Okawa M, Uchiyama M, et al. Sleep and mood disorders. Sleep Med Rev. 1997;1(1):45–56. doi:10.1016/S1087-0792(97)90005-8
39. Kupfer D, Foster FG. Interval between onset of sleep and rapid-eye-movement sleep as an indicator of depression. Lancet. 1972;300(7779):684–686. doi:10.1016/S0140-6736(72)92090-9
40. Todd B. Depression and antidepressants. Geriatr Nurs. 1987;8(4):203–204. doi:10.1016/S0197-4572(87)80226-4
41. Vogel GW, Thurmond A, Gibbons P, et al. REM sleep reduction effects on depression symptoms. Arch Gen Psychiatry. 1975;32(6):765–777. doi:10.1001/archpsyc.1975.01760240093007
 © 2020 The Author(s). This work is published and licensed by Dove Medical Press Limited. The
full terms of this license are available at https://www.dovepress.com/terms
and incorporate the Creative Commons Attribution
- Non Commercial (unported, 3.0) License.
By accessing the work you hereby accept the Terms. Non-commercial uses of the work are permitted
without any further permission from Dove Medical Press Limited, provided the work is properly
attributed. For permission for commercial use of this work, please see paragraphs 4.2 and 5 of our Terms.
© 2020 The Author(s). This work is published and licensed by Dove Medical Press Limited. The
full terms of this license are available at https://www.dovepress.com/terms
and incorporate the Creative Commons Attribution
- Non Commercial (unported, 3.0) License.
By accessing the work you hereby accept the Terms. Non-commercial uses of the work are permitted
without any further permission from Dove Medical Press Limited, provided the work is properly
attributed. For permission for commercial use of this work, please see paragraphs 4.2 and 5 of our Terms.