Back to Journals » Neuropsychiatric Disease and Treatment » Volume 12
Increased frontal electroencephalogram theta amplitude in patients with anorexia nervosa compared to healthy controls
Authors Hestad K, Weider S, Nilsen KB, Indredavik MS ![]() , Sand T
, Sand T
Received 26 May 2016
Accepted for publication 30 June 2016
Published 21 September 2016 Volume 2016:12 Pages 2419—2423
DOI https://doi.org/10.2147/NDT.S113586
Checked for plagiarism Yes
Review by Single anonymous peer review
Peer reviewer comments 2
Editor who approved publication: Dr Roger Pinder
Knut A Hestad,1–3 Siri Weider,3,4 Kristian Bernhard Nilsen,5–7 Marit Sæbø Indredavik,8,9 Trond Sand7,10
1Department of Research, Innlandet Hospital Trust, Brumunddal, Norway; 2Department of Public Health, Hedmark University of Applied Sciences, Elverum, Norway; 3Department of Psychology, Faculty of Social Sciences and Technology Management, Norwegian University of Science and Technology (NTNU), Trondheim, Norway; 4Department of Psychiatry, Specialised Unit for Eating Disorder Patients, Levanger Hospital, Health Trust Nord-Trøndelag, Levanger, Norway; 5Department of Neuroscience, Norwegian University of Science and Technology (NTNU), Trondheim, Norway; 6Department of Work Psychology and Physiology, National Institute of Occupational Health, Oslo, Norway; 7Department of Neurology, Section for Clinical Neurophysiology, Oslo University Hospital, Ullevål, Oslo, Norway; 8Regional Centre for Child and Youth Mental Health and Child Welfare, Faculty of Medicine, Norwegian University of Science and Technology (NTNU), Trondheim, Norway; 9Department of Child and Adolescent Psychiatry, St Olavs Hospital, Trondheim University Hospital, Trondheim, Norway; 10Department of Neurology and Clinical Neurophysiology, St Olavs Hospital, Trondheim University Hospital, Trondheim, Norway
Objective: To conduct a blind study of quantitative electroencephalogram-band amplitudes in patients with anorexia nervosa (AN) and healthy controls.
Methods: Twenty-one patients with AN and 24 controls were examined with eyes-closed 16-channel electroencephalogram. Main variables were absolute alpha, theta, and delta amplitudes in frontal, temporal, and posterior regions.
Results: There were no significant differences between the AN patients and controls regarding absolute regional band amplitudes in µV. Borderline significance was found for anterior theta (P=0.051). Significantly increased left and right frontal electrode theta amplitude was found in AN patients (F3, P=0.014; F4, P=0.038) compared to controls. Significant differences were also observed for secondary variables: lower values for relative parietooccipital delta and frontocentral alpha activity among AN patients than among controls.
Conclusion: We observed slight excess frontal theta and lower relative alpha and delta amplitudes among AN patients than among controls. This pattern is possibly related to a slight frontal lobe dysfunction in AN, or it may reflect increased attention/vigilance or another state-related change in patients with AN compared to healthy controls.
Keywords: anorexia, EEG, frontal theta, alpha, delta, eating disorders
Introduction
Anorexia nervosa (AN) is a severe disorder strongly associated with the female sex and with a number of neurobiological correlates. A review of twin studies suggests a strong genetic vulnerability, with heritability rates ranging from 28% to 74%.1 Furthermore, the disorder is associated with several obstetric and perinatal factors.2,3 In addition, patients suffering from AN have frequently been found to share personality and temperamental features such as perfectionism, rigidity, obsessive–compulsiveness, introversion, and neuroticism.4,5 AN is also associated with a number of cognitive difficulties,6,7 especially low set-shifting abilities8 and poor central coherence.9,10
Structural brain alterations have been described in AN patients.11 Electrophysiological alterations have also been reported, but these studies are few in number and the methods have varied considerably. Although many AN patients seem to have normal electroencephalograms (EEGs),12 a substantial number of patients may have abnormal slowing of background activity or even atypical spike discharges.13
With a quantitative EEG (qEEG), it is possible to localize areas with abnormal brain activity in relation to different frequency bands,14 but few studies have reported resting qEEG in AN patients. In previous AN studies, reduced 8–13 Hz alpha rhythm amplitude has been reported to occur in posterior regions;13,15 anterior regions;16 or across frontal, temporal, and parietal areas.17 Results regarding 4–7 Hz theta activity are variable, as either increased posterior theta16 or normal theta levels15 have been reported in relaxed wakefulness in AN patients. Slow 0–3 Hz delta activity in wakefulness, an EEG sign of more severe brain dysfunction, has seldom been reported in AN outpatients. In this context, it is important to clarify if reproducible qEEG signs of brain dysfunction can be confirmed, because such data can clarify the importance of organic compared to psychological factors in AN.
The major aim of this study was to examine regional absolute EEG delta, theta, and alpha amplitudes in patients with AN, and, employing a blind study, to contrast these EEG data with results from a group of comparable healthy controls. Secondary variables – relative regional EEG amplitudes – were also explored for possible differences.
Materials and methods
Participants
Inclusion criteria for the patient group were: AN as the primary diagnosis at the time of recruitment, Norwegian as the first language, and the patient’s somatic ability to complete the assessment. Exclusion criteria included confirmed brain damage, psychosis, diabetes, chronic fatigue syndrome, neurological disease, and neuropsychiatric disorders. A total of 22 female patients with AN fulfilled the criteria. One patient had to be excluded because she was a demographic outlier with no comparable healthy control, leaving a group of 21 patients with AN. At the time of recruitment, 19 of the patients were inpatients and two were outpatients. All patients were in a weight-restoration phase, and to the best of our knowledge, none of them were in a state of starvation. The patients were in different stages of their treatment, and at the time of recruitment, three patients weighed above the weight criterion for AN, according to the criteria of the Diagnostic and Statistical Manual of Mental Disorders, 4th Edition, Text Revision.18 The included patients were using their regular medication. At the time of recruitment, 16 patients used either nontricyclic antidepressants (n=14) or antipsychotics (n=6).
A control group of 25 participants of the same age and sex and with the same educational characteristics were recruited for comparison. Exclusion criteria were the same for the control group and patients, with the following supplementary criteria: current or prior eating disorder or eating problems, being on a diet for weight reduction, a body mass index <19 kg/m2 or >26 kg/m2, and/or currently having a psychiatric diagnosis. One control met the exclusion criteria and was therefore excluded. The demographic and clinical characteristics of the sample are presented in Table 1. Written informed consent was acquired from all participants in accordance with the Declaration of Helsinki.
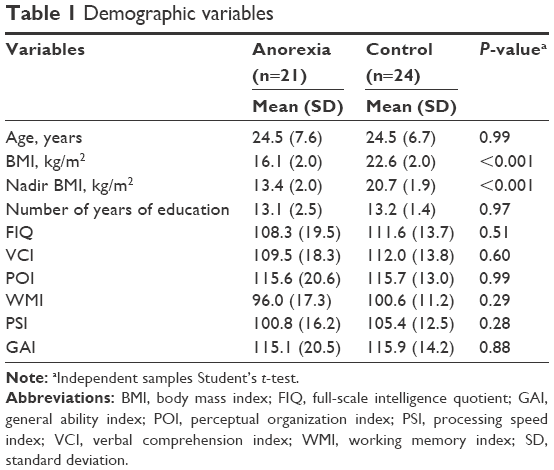 | Table 1 Demographic variables |
Procedure
EEG was recorded (NicOne Nervus 5.11, Natus Medical Incorporated Pleasanton, CA, USA) and digitized (256 Hz sample rate) from 16 scalp electrodes according to the 10–20 system, with the participant in supine position and relaxed with closed eyes. All EEGs were scheduled for the morning; one was recorded at 9 am and the rest at approximately 10 am. Participants were asked to open and close their eyes every minute to avoid drowsiness, and eye movements were recorded. EEG sequences without artifacts were selected and analyzed using Harmonie software (Stellate Systems, Quebec, Canada) by a clinical neurophysiologist who was blind to the participants’ clinical status prior to the qEEG analysis.
A fast Fourier transform was applied to source-derivation referenced 4-second sections after cosine tapering (no overlap). For each EEG narrow band – delta (0.75–3.75 Hz), theta (4.00–7.75 Hz), alpha (8.00–12.75 Hz), and beta (13.00–30.00 Hz) bands – and EEG electrode, we calculated the average absolute amplitude (from the square root of the power in μV2). Regional averages within the frontocentral (EEG locations F3, F4, C3, and C4), temporal (T3, T4, T5, and T6), and parietooccipital (P3, P4, O1, and O2) regions were calculated as main variables, followed by single-electrode testing within regions of interest (defined as regional P-values below 0.10). A custom-made peak-finding algorithm for the O1 and O2 combined mean spectral curve also calculated occipital alpha peak frequency.
As secondary variables for exploratory analysis, we also calculated relative band amplitudes (narrow band amplitude/total 0.75–30 Hz band amplitude) for each EEG band and region.
A normalizing transformation was applied to all variables (square root for band amplitudes), followed by two-group Student’s t-test (pooled variance). A P-value below 0.05 was considered significant.
Participants also underwent neuropsychological testing and evaluation, including the Wechsler Adult Intelligence Scale, 3rd Edition (WAIS-III).19 The majority of patients and controls belonged to a larger study group examined for neuropsychological performance in previous publications.20,21 The study was approved by the Regional Committees for Medical and Health Research Ethics (reference 4.2007.2229).
Results
Participant characteristics are presented in Table 1. There was no difference between the AN group patients and controls in age, years of education, full-scale IQ, or any of the WAIS-III indexes.19 Both groups were in the upper intelligence quotient (IQ) range, as measured by the general ability index22 derived from the WAIS-III.19
No epileptiform EEG activity was observed. Occipital alpha peak frequency was mean (standard deviation [SD]) =10.55 (0.93) Hz in AN and 10.25 (0.85) Hz in controls (Student’s t-test, P=0.26). Regarding the main qEEG variables (absolute amplitude), no difference in delta or alpha bands was observed. A strong trend toward increased regional frontocentral theta (P=0.051) was observed in AN patients. AN subjects had significantly increased theta activity at both the left (F3; P=0.014) and right (F4; P=0.038) frontal electrodes (Figure 1). This difference was preserved when patients on antipsychotics were excluded (P=0.012 and 0.022, respectively).
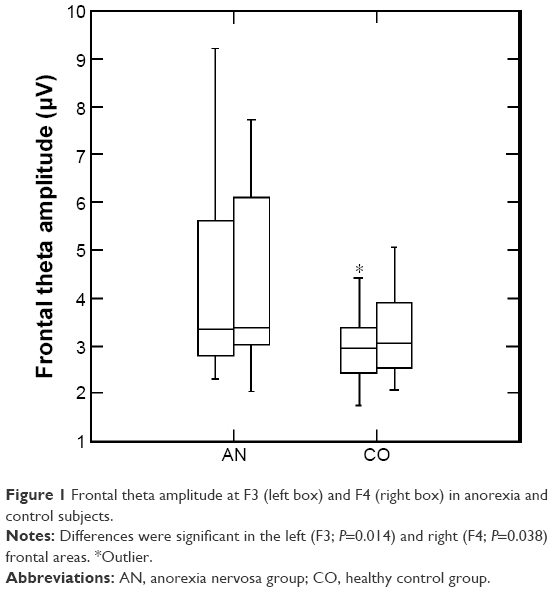 | Figure 1 Frontal theta amplitude at F3 (left box) and F4 (right box) in anorexia and control subjects. |
There were also a few significant “relative” amplitude differences between the two groups (Table 2) in parietooccipital delta and frontocentral alpha activity. A borderline significant difference was found in relative temporal delta activity. We found no significant group differences, however, in absolute frontocentral alpha or temporal and parietooccipital delta amplitude from either regional variables (Table 2) or single EEG electrodes.
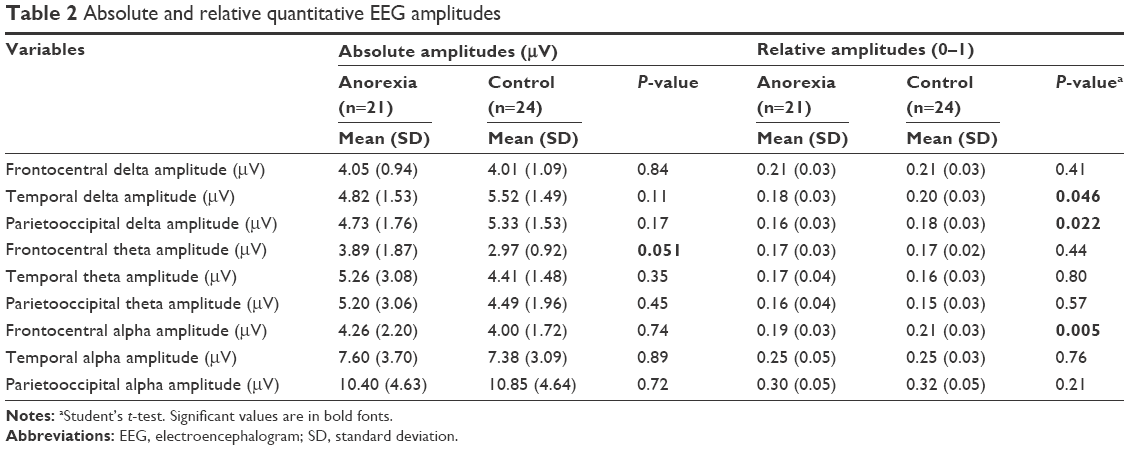 | Table 2 Absolute and relative quantitative EEG amplitudes |
Discussion
Anorexia subjects in this study had increased absolute theta amplitudes in both the right and left frontal regions. Theta activity was normal over the posterior frontal lobe margin close to the central sulcus, possibly because this central EEG activity is also influenced by anterior parietal lobe activity. Hence, a more middle/anterior frontal lobe EEG disturbance may be present in AN patients. Grunwald et al23 also mentioned that AN subjects had an increase in frontal theta during “haptic exploration”. Rodriguez et al15 did not report theta abnormalities in AN subjects, but their method (amplitude of low-resolution brain electromagnetic tomography [LORETA] sources) is not comparable to ours.
Increased frontal theta activity is an unspecific finding. Drowsiness can probably be ruled out, given that subjects were activated during recording, epochs with drowsiness were not included in the fast Fourier transform, occipital alpha was not slowed, and theta was not increased in the parietooccipital area. Frontal theta is reported to occur in young adults in a highly emotional state,24 as a frontal arousal rhythm,25 or while performing mental tasks,26,27 possibly related to retrieval of episodic memory information in the anterior limbic system.28,29 It should be emphasized that in the majority of cases, frontal theta is to be regarded as a normal EEG phenomenon.30
Reduced functional activation of various parts of the frontal cortex has been reported in AN patients. Phillipou et al31 made a systematic review of the research to date, which consisted of typically small studies with relatively variable results. They found that a number of structural and functional changes have been reported in various parts of the brain in AN patients, including enlargement of cortical sulci and ventricles, changes in the gray and white matter, and changes in the basal ganglia. A reduction in volume and gray matter in the anterior cingulate cortex and reduced functional activation of various parts of the frontal cortex have also been reported in AN patients. Accordingly, it is possible that our main EEG findings reflect a slightly disturbed frontal lobe dysfunction in AN.
There were no differences in regional absolute amplitude values between AN subjects and controls for either delta or alpha activity, although frontocentral relative alpha and parietooccipital relative delta were slightly lower in AN subjects compared to controls. Because low relative alpha power has been reported by others,15–17 and mean alpha frequency tended to be higher in AN subjects than in controls, we suggest that the present EEG pattern can be related to increased attention among AN patients. Increased attention may, in addition to increased frontal theta, explain reduction of relative alpha and delta amplitude,32 as demonstrated in various event-related desynchronization protocols.33 Prominent theta power enhancement over frontal regions during various working memory and episodic memory tasks has been consistently reported, but the functional significance of these oscillations in memory processes remains unclear.34 EEG-based neurofeedback has also been explored recently as a possible treatment option for AN.35
Frontal midline theta is most pronounced during the performance of mental tasks, even though it may occur at rest.36 It has also been suggested that personality traits and platelet monoamine oxidase (MAO) activity may be related to frontal midline theta activity.36 This possibility has not yet been examined for AN, however.
The suspected mechanism leading to the more severe EEG changes previously reported among inpatients with anorexia may start with malnutrition leading to inadequate brain metabolism, particularly related to decreased electrolyte and glucose levels.13 This, in turn, can produce neuronal and synaptic dysfunction reflected by excessive slowing, spikes, instable EEG-hyperventilation responses,13 and reduction of the alpha rhythm amplitude. Our study, however, was performed in subjects in treatment with a relatively high average IQ. The mean general ability index of the participants in both groups was more than 1 SD above the normative mean. Hence, no evidence of clinically significant higher-order brain dysfunction was found in our AN cohort, either from a neuropsychological or an EEG point of view. Although the association between EEG and IQ is weak and variable,32,37 this high IQ also suggests that excess frontal theta does not reflect established brain dysfunction in our AN subjects.
Limitation
A limitation of this study was the symptomatic psychotropic medication that the majority of AN patients had to use. Because it can, at least with large doses, cause EEG slowing,38 drug effects cannot be ruled out completely. Because the frontal theta difference was not weakened by excluding the subgroup using the (most potent) antipsychotic medications, however, drugs might probably not explain our main finding.
Conclusion
Our blind study suggests that frontal lobe EEG theta activity is increased in AN. This EEG pattern, with frontal theta and slight alpha and delta changes, may suggest a different average level of arousal (vigilance) or attention. It could also reflect different mental state or trait in the AN group compared to the matched control group, possibly related to a frontal lobe dysfunction. Longitudinal studies are required to follow patients over time, in order to decide whether EEG is stable or changes as a result of AN severity fluctuations or other less disease-specific factors, such as emotional instability, mood changes, or metabolic or nutritional factors.
Disclosure
The authors report no conflicts of interest in this work.
References
Thornton LM, Mazzeo SE, Bulik CM. The heritability of eating disorders: methods and current findings. Curr Top Behav Neurosci. 2011;6:141–156. | ||
Favaro A, Tenconi E, Santonastaso P. Perinatal factors and the risk of developing anorexia nervosa and bulimia nervosa. Arch Gen Psychiatry. 2006;63(1):82–88. | ||
Tenconi E, Santonastaso P, Monaco F, Favaro A. Obstetric complications and eating disorders: a replication study. Int J Eat Disord. 2015;48(4):424–430. | ||
Polivy J, Herman CP. Causes of eating disorders. Annu Rev Psychol. 2002;53:187–213. | ||
Vitousek K, Manke F. Personality variables and disorders in anorexia nervosa and bulimia nervosa. J Abnorm Psychol. 1994;103(1):137–147. | ||
Duchesne M, Mattos P, Fontenelle LF, Veiga H, Rizo L, Appolinario JC. Neuropsychology of eating disorders: a systematic review of the literature. Rev Bras Psiquiatr. 2004;26(2):107–117. | ||
Lena SM, Fiocco AJ, Leyenaar JK. The role of cognitive deficits in the development of eating disorders. Neuropsychol Rev. 2004;14(2):99–113. | ||
Wu M, Brockmeyer T, Hartmann M, Skunde M, Herzog W, Friederich HC. Set-shifting ability across the spectrum of eating disorders and in overweight and obesity: a systematic review and meta-analysis. Psychol Med. 2014;44(6):3365–3385. | ||
Lang K, Lopez C, Stahl D, Tchanturia K, Treasure J. Central coherence in eating disorders: an updated systematic review and meta-analysis. World J Biol Psychiatry. 2014;15(8):586–598. | ||
Lopez C, Tchanturia K, Stahl D, Treasure J. Central coherence in eating disorders: a systematic review. Psychol Med. 2008;38(10):1393–1404. | ||
Titova OE, Hjorth OC, Schioth HB, Brooks SJ. Anorexia nervosa is linked to reduced brain structure in reward and somatosensory regions: a meta-analysis of VBM studies. BMC Psychiatry. 2013;13(1):110. | ||
Grebb JA, Yingling CD, Reus VI. Electrophysiologic abnormalities in patients with eating disorders. Compr Psychiatry. 1984;25(2):216–224. | ||
Crisp AH, Fenton GW, Scotton L. A controlled study of the EEG in anorexia nervosa. Br J Psychiatry. 1968;114(514):1149–1160. | ||
Teplan M. Fundamentals of EEG measurement. Meas Sci Rev. 2002;2(2):1–11. | ||
Rodriguez G, Babiloni C, Brugnolo A, et al. Cortical sources of awake scalp EEG in eating disorders. Clin Neurophysiol. 2007;118(6):1213–1222. | ||
Hatch A, Madden S, Kohn MR, et al. EEG in adolescent anorexia nervosa: impact of refeeding and weight gain. Int J Eat Disord. 2011;44(1):65–75. | ||
Toth E, Tury F, Gati A, Weisz J, Kondakor I, Molnar M. Effects of sweet and bitter gustatory stimuli in anorexia nervosa on EEG frequency spectra. Int J Psychophysiol. 2004;52(3):285–290. | ||
American Psychiatric Association. Diagnostic Criteria from DSM-IV-TR. Washington, D.C: American Psychiatric Association; 2000. | ||
Wechsler D. The Wechsler Adult Intelligence Scale. 3rd ed. San Antonio, TX: Psychological Corporation; 1997. | ||
Weider S, Indredavik MS, Lydersen S, Hestad K. Intellectual function in patients with anorexia nervosa and bulimia nervosa. Eur Eat Disord Rev. 2014;22(1):15–24. | ||
Weider S, Indredavik MS, Lydersen S, Hestad K. Neuropsychological function in patients with anorexia nervosa or bulimia nervosa. Int J Eat Disord. 2015;48(4):397–405. | ||
Tulsky DS, Saklofske DH, Wilkins C, Weiss LG. Development of a general ability index for the Wechsler Adult Intelligence Scale – Third Edition. Psychol Assess. 2001;13(4):566–571. | ||
Grunwald M, Ettrich C, Assmann B, et al. Deficits in haptic perception and right parietal theta power changes in patients with anorexia nervosa before and after weight gain. Int J Eat Disord. 2001;29(4):417–428. | ||
Mundy-Castle AC. Theta and beta rhythm in the electroencephalograms of normal adults. Electroencephalogr Clin Neurophysiol. 1951;3(4):477–486. | ||
Westmoreland BF, Klass DW. Unusual EEG patterns. J Clin Neurophysiol. 1990;7(2):209–228. | ||
Mizuki Y, Tanaka M, Isozaki H, Nishijima H, Inanaga K. Periodic appearance of theta rhythm in the frontal midline area during performance of a mental task. Electroencephalogr Clin Neurophysiol. 1980;49(3–4):345–351. | ||
Gartner M, Grimm S, Bajbouj M. Frontal midline theta oscillations during mental arithmetic: effects of stress. Front Behav Neurosci. 2015;9:96. | ||
Mitchell DJ, McNaughton N, Flanagan D, Kirk IJ. Frontal-midline theta from the perspective of hippocampal “theta”. Prog Neurobiol. 2008;86(3):156–185. | ||
Klimesch W. Memory processes, brain oscillations and EEG synchronization. Int J Psychophysiol. 1996;24(1–2):61–100. | ||
Kellaway P. Orderly approach to visual analysis. In: Pedley TA, Ebersole JS, editors. Current Practice of Clinical Electroencephalography. 3rd ed. Philadelphia, PA: Lippincott Williams & Wilkins; 2003:100–159. | ||
Phillipou A, Rossell SL, Castle DJ. The neurobiology of anorexia nervosa: a systematic review. Aust N Z J Psychiatry. 2014;48(2):128–152. | ||
Markand ON. Alpha rhythms. J Clin Neurophysiol. 1990;7(2):163–189. | ||
Pfurtscheller G, Stancak A Jr, Neuper C. Event-related synchronization (ERS) in the alpha band – an electrophysiological correlate of cortical idling: a review. Int J Psychophysiol. 1996;24(1–2):39–46. | ||
Klimesch W, Doppelmayr M, Schwaiger J, Auinger P, Winkler T. ‘Paradoxical’ alpha synchronization in a memory task. Brain Res Cogn Brain Res. 1999;7(4):493–501. | ||
Lackner N, Unterrainer HF, Skliris D, et al. EEG neurofeedback effects in the treatment of adolescent anorexia nervosa. Eat Disord. 2016;24(4):354–374. | ||
Inanaga K. Frontal midline theta rhythm and mental activity. Psychiatry Clin Neurosci. 1998;52(6):555–566. | ||
Posthuma D, Neale MC, Boomsma DI, de Geus EJ. Are smarter brains running faster? Heritability of alpha peak frequency, IQ, and their interrelation. Behav Genet. 2001;31(6):567–579. | ||
Blume WT. Drug effects on EEG. J Clin Neurophysiol. 2006;23(4):306–311. |
 © 2016 The Author(s). This work is published and licensed by Dove Medical Press Limited. The
full terms of this license are available at https://www.dovepress.com/terms
and incorporate the Creative Commons Attribution
- Non Commercial (unported, 3.0) License.
By accessing the work you hereby accept the Terms. Non-commercial uses of the work are permitted
without any further permission from Dove Medical Press Limited, provided the work is properly
attributed. For permission for commercial use of this work, please see paragraphs 4.2 and 5 of our Terms.
© 2016 The Author(s). This work is published and licensed by Dove Medical Press Limited. The
full terms of this license are available at https://www.dovepress.com/terms
and incorporate the Creative Commons Attribution
- Non Commercial (unported, 3.0) License.
By accessing the work you hereby accept the Terms. Non-commercial uses of the work are permitted
without any further permission from Dove Medical Press Limited, provided the work is properly
attributed. For permission for commercial use of this work, please see paragraphs 4.2 and 5 of our Terms.