Back to Journals » Cancer Management and Research » Volume 11
Increased expression of TMED2 is an unfavorable prognostic factor in patients with breast cancer
Authors Lin X ![]() , Liu J, Hu SF, Hu X
, Liu J, Hu SF, Hu X
Received 31 October 2018
Accepted for publication 19 February 2019
Published 18 March 2019 Volume 2019:11 Pages 2203—2214
DOI https://doi.org/10.2147/CMAR.S192949
Checked for plagiarism Yes
Review by Single anonymous peer review
Peer reviewer comments 3
Editor who approved publication: Dr Antonella D'Anneo
Xia Lin,1 Jian Liu,2 Shu Fang Hu,2 Xun Hu1
1Cancer Institute (a Key Laboratory for Cancer Prevention & Intervention, China National Ministry of Education), the Second Affiliated Hospital, Zhejiang University School of Medicine, Hangzhou, People’s Republic of China; 2The Department of Breast Surgery, Affiliated Hangzhou First People’s Hospital, Zhejiang University School of Medicine, Hangzhou, People’s Republic of China
Background: We obtained 2 types of clones which were termed SC (sphere-shaped clone) and NSC (non-sphere-shaped clone) from 4T1 cells by monoclonal culture. SC and NSC were distinct in morphology, surface marker, metabolism and proliferation rate. With the transcriptome sequencing data analysis, we found TMED2 expressed higher in SCs. TMED2 was a member of the transmembrane emp24 domain and might play roles in cancer cell proliferation. However, its prognostic roles in breast cancer remained unknown. We aimed to investigate the prognostic values of TMED2 in patients with breast cancer.
Methods: We used UALCAN (http://ualcan.path.uab.edu) and the Human Protein Atlas (www.proteinatlas.org) to explore the TMED2 expression level and DNA methylation data between breast cancer and normal breast tissue. With Oncomine (www.oncomine.org), we investigated the copy number of TMED2 in breast cancer sample and normal breast tissue. We used the Kaplan–Meier Plotter database (http://kmplot.com/analysis) to analyze prognostic values of TMED2 mRNA expression in all breast cancers and in different intrinsic subtypes. Moreover, protein expression levels of TMED2 were confirmed by Western blot in breast cancer tissues and normal mammary tissue as well as SCs and NSCs.
Results: TMED2 significantly upregulated in breast cancer patients compared to normal mammary samples. Meanwhile, the increased expression of TMED2 mRNA was closely associated with reduced overall survival (OS) in all breast cancers, and with reduced OS in patients with ER-positive, Luminal A or Luminal B breast cancer subtypes. Moreover, western blot confirmed that TMED2 increased expressed was correlated with the reduced OS at protein levels.
Conclusion: Increased expression of TMED2 was significantly related to unfavorable outcomes in patients with breast cancer. Thus, we supposed TMED2 is oncogenic and a potential target for breast cancer therapy and these preliminary findings require further study to determine whether TMED2-targeting reagents might be developed for clinical application in breast cancer.
Keywords: breast cancer, SC, NSC, TMED2, overall survival, KM plotter
A Letter to the Editor has been published for this article.
Introduction
Among malignancies, breast cancer has the highest morbidity rates and is the leading cause of cancer death in females worldwide.1 Metastasis is the major features of malignant tumors and lead to a poor prognosis of patients. And the aggressive ability of malignant cells is the vital parameters of the metastatic cascade.2 Thus, it’s important for us to explore mechanisms that result in the incidence of breast cancer metastasis and detect some prognosis and metastasis associated factors of breast cancer.
The mouse breast cancer 4T1 cells were highly tumorigenic and invasive, inoculation of 4T1 cells in the mammary pad of Balb/c mice produced primary tumors and could spontaneously metastasize to multiple distant organs, with the disease progression similar to human breast cancer.3,4
In our study, 4T1 cells were cultured in low density and we observed two kinds of phenotype: sphere-shaped clone (SC) and non-sphere-shaped clone (NSC). Additionally, SC was different from NSC in plenty of aspects like the metastasis competence, metabolic rate, growth rate. Balb/c female mice were used to investigate the metastatic ability SCs and NSCs. The results showed that SC had high metastasis ability. In order to investigate the intrinsic different of SCs and NSCs, we performed mRNA-seq analysis of SCs and NSCs. With the assistance of some bioinformatics web tools (GSEA, Kaplan–Meier (KM) plotter database, the Human Protein Atlas and UALCAN), we found that overexpression of TMED2 was an unfavorable prognostic factor in patients with breast cancer. Members of the transmembrane emp24 domain (Tmed)/p24 family of proteins were needed for the transport of proteins between the Golgi and the endoplasmic reticulum. TMED2 was one member of this family and its function during placental development in mice and normal development of the labyrinth layer had been reported.5 However, the role of TMED2 in the development of tumorigenesis had been rarely reported. Some reports had pointed out that TMED2 could promote the growth of epithelial ovarian cancer and TMED2 expressed in all gestational stages of human placentas and in choriocarcinoma cell lines.5,6 The role of TMED2 in breast cancer remains poorly understood.
Materials and methods
Cell culture
Murine breast cancer 4T1 cell line was obtained from The Cell Bank of Type Culture Collection of the Chinese Academy of Sciences (Shanghai). And the cell line used for the experiments was authenticated by SNP analysis within 6 months of receipt. The 4T1 cells were cultivated in complete RPMI-1640 (Life Technologies) with 10% FBS, 100 U/ml penicillin/streptomycin and 2 mM L-glutamine.
Sphere clone (SC) and nonsphere clone (NSC)
In vitro: 4T1 cells were trypinized and resuspended in culture medium at the concentration of 5 cells/ml, then 200 µl cell suspension was added into each well of 96-well plate at the average density of 1 cell/well. After standing for 6 hrs, the plate was placed under an inverted phase contrast microscope to observe the wells containing individual cells and well containing individual cell was marked. After 2 weeks of culture, the wells were observed under the microscope. The well containing a single colony of SC or NSC were counted. SC and NSC were separated for further study.
In vivo: in situ tumors produced by subcutaneous injection of 4T1 cells were removed from mice and prepared into suspensions in culture medium at the concentration of 5 cells/ml, then 200 µl cell suspension was added into each well of 96-well plate at the average density of 1 cell/well. After standing for 6 hrs, the plate was placed under an inverted phase contrast microscope to observe the wells containing individual cells and well containing individual cell was marked. After 2 weeks of culture, the wells were observed under the microscope. The well containing a single colony of SC or NSC were counted.
Immunofluorescent confocal laser microscopy
4T1 cells, NSCs had grown on coverslip and SCs centrifuged onto glass slides and then fixed with 3.7% paraformaldehyde for 15 min. Then 0.2% Triton X-100 was used to permeabilize cells for 15 min at room temperature. The cells were blocked with 3% BSA for 1 hr and incubated with CD44 antibody (1:100 dilution of ab119863, Abcam, UK), CD24 antibody (1:100 dilution of ab25657, Abcam, UK), EpCAM antibody (1:1000 dilution of ab71916, Abcam, UK), CD49f antibody (1:100 dilution of ab95703, Abcam, UK), TP63 antibody (1:50 dilution of ab735, Abcam, UK) or ASMA antibody (1:200 dilution of ab3280, Abcam, UK) according to the protocols of the suppliers, Nuclei were counterstained with DAPI. Zeiss LSM 710 laser confocal microscope (Carl Zeiss, Jena, Germany) was used to detect Fluorescence.
3-D culture, frozen section, hematoxylene and eosin staining
Three-dimensional (3D) on-top assay was conducted to observe the colony morphology of 4T1 cells, NSCs or SCs according to previous protocol:7 BD Matrigel™ Basement Membrane Matrix (BD 356234) was precooled at 4 °C overnight and the next day, 150–200 μl per well Matrigel was used to cover the prechilled culture surface (Millicell EZ SLIDE 8-well glass, PEZGS 0816); then the glass was cultured at 37 °C for 15–30 min to allow the Matrigel to get solid. 4T1 cells, NSCs or SCs were grown on slide 8-well glass at a concentration of ~100 cells/well. For frozen section, the 3D cell clones were harvested after 10–14 days culture and then embedded in O.C.T. Compound (4583, SAKURA Tissue-Tek). Subsequently, by using a cryostat (Leica CM1950; Leica, Wetzlar, Germany), 5 μm sections were cut and postfixed in methanol fixation solution for 10 min at room temperature. At last, frozen sections were stained with hematoxylene and eosin (HE) and then photographed with a Nikon Eclipse 50i microscope equipped with NIS-Elements software (version 3.22).
Measurement of glucose consumption, lactate generation and cell growth rate
Glucose and lactate in the culture medium were quantified based on our previous report.8 Cells were cultured in 12-well plate with the concentration of 1×10⁵ cells/well and 0.5 ml RPMI-1640 completed culture medium. After 6 hr incubation, glucose or lactate in the culture medium was quantified. Glucose was measured automatically by a HK colorimetric method using Olympus AU2700 system. Lactate was determined by VITROS Chemistry Product LAC Slides using the VITROS 5.1 FS system. As for cell growth rate, 1×10⁴ cells were cultured in per well and cell number was counted every 24 hrs.
Animal studies
The protocols for animal experiments were approved by the Committee of Animal Experimental Centre at the Zhejiang Chinese Medical University. All animal experiments were performed in accordance with the standard guidelines of the Zhejiang Chinese Medical University. 4–6 weeks old BALB/c female mice were housed in a standard polypropylene cage. Mice were randomly subcutaneously injected with 4T1 cells (1,000 cells per mouse), NSCs (1,000 cells from a single clone per mouse) or SCs (a single clone per mouse). Tumor volume was calculated following the formula V=(L×W2)×0.5, where L and W mean mid-axis length and width, respectively. On the day of sacrifice, pulmonary metastasis was assessed by counting the macroscopic metastatic nodules according to our previous report.9 All the metastasis related organs (lung specimens, heart and bone) were embedded in paraffin. For bone metastasis evaluation, leg bones (femora and tibiae) were decalcified with a decalcifying solution (BOSTER AR1071) for 20 days and embedded in paraffin. The incidence of bone metastasis was evaluated by the visible osteolysis or metastasis foci. Sections stained with H&E were evaluated and photographed.
Preparation of RNA for gene arrays
Three batches (each batch contained 10 clones) of SCs and NSCs from 3 independent experiments were collected. Total RNA was extracted by using the RNeasy kit (Qiagen, Germany) and the quality of the total RNA was checked with the BioAnalyzer (Agilent, Santa Clara, CA, USA).
Transcriptome sequencing data analysis
The whole expression files of SCs and NSCs were assessed with mRNA-Seq experiments performed by Novogene (Beijing, China). The mRNA-seq library is prepared for sequencing according to standard Illumina protocols. To investigate biologic characteristics of genes differently expressed between SCs and NSCs, we performed GSEA assay. The GSEA method is embodied in a freely available software package, together with an initial database of 1,325 biologically defined gene sets and was developed to help with the analysis and interpretation of the long lists of genes produced from high-throughput transcriptomic experiments.10,11 We chose the genes that related to metastasis pathway to analysis. The transcriptome sequencing data were uploaded to the GEO database (accession number GSE112038,
Analysis of the TMED2 expression level between breast cancer and normal breast sample
UALCAN (
Survival analysis of TMED2
The association between TMED2 expression and OS was analyzed with an online database that was established using gene expression data and survival information of breast cancer patients downloaded from the GEO.15 Currently, breast cancer,15 ovarian cancer,16 gastric cancer,17 and lung cancer18 databases have been generated. The database contains a collection of clinical data including histology, stage, grade, gender, and smoking history, and treatment groups include surgery, chemotherapy, and radiotherapy. Briefly, TMED2 was entered into the database (
Western blot analysis
Cells and specimens were lysed in freshly prepared protein extraction buffer (78501, Thermo Scientific) containing phosphatase inhibitors for 30 min on ice. Lysates were centrifuged and then collect the supernatant. The protein was applied to a 12% SDS-polyacrylamide gel, and transferred to polyvinylidene difluoride (PVDF) membranes. The membranes were blocked with 5% low-fat milk in TBST for 60 min and then incubated with the following primary antibodies overnight (4 °C): TMED2 (241213, Abcam,1:2000), β-actin (6276, Abcam,1:5000); The corresponding secondary antibodies (1:5000) were added and bands were visualized by enhanced chemiluminescence (PerkinElmer, MA, USA).
Statistical analysis and calculations
Data were expressed as the Mean ± SEM. All data were analyzed using the InStat software (GraphPad, CA, USA), and displayed as mean ± SEM. Unpaired T-test was used for the comparison between two mean values. Significance was defined at ***P<0.001, **P<0.01, *P<0.05.
Results
Solitary 4T1 cells could form two different phenotypes
When 4T1 cells were cultured at an average density of 1 cell per well in 96-well plate, two distinct phenotypes of clones were observed (Figure 1A). While one type of clones was sphere-shaped clone and the other was non-sphere-shaped clone. For clarity, we termed the first type sphere clones (SCs) and the second non-sphere clones (NSCs). The cells freshly prepared from 4T1 tumors passaged in vivo (Balb/c mice) could also generate SCs and NSCs (Figure 1B). Moreover, SCs and NSCs accounted for about 9.1±1.3% and 90.9±1.3% respectively (Figure 1B).
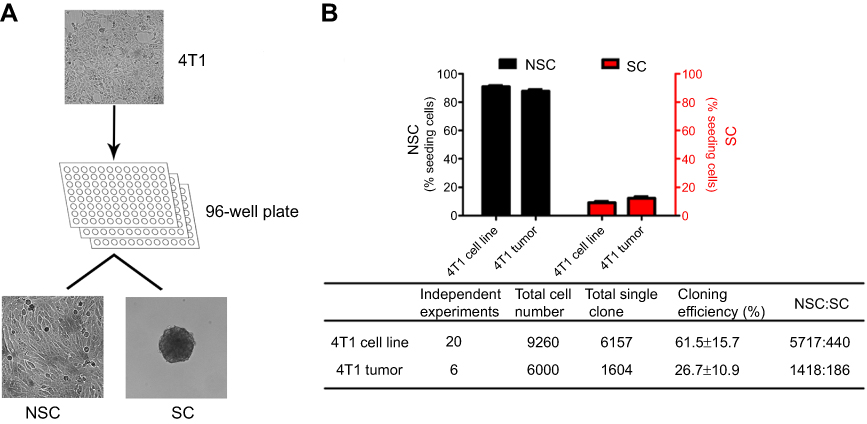 | Figure 1 The generation of SCs and NSCs. 4T1 cells passaged in flasks or in vivo (Balb/c mice) were cultured at an average density of 1 cell per well in 96-well plate, 2 distinct types of clones were observed and the percentage of SCs and NSCs were about 9.1±1.3% and 90.9±1.3% (Figure 1B), respectively. Data are from 20 independent experiments. |
The surface markers of SC and NSC
As SCs showed sphere-shaped morphology, we supposed that SCs may have stem cell-like features. Pece et al19 used 6 surface markers to distinguish mammary stem cells from others and they revealed that mammary stem cells are both CD44+/EpCAM+ (epithelial marker) and CD49F+/TP63+ (myoepithelial marker). Then we used these 6 markers to characterize SCs and NSCs (Figure 2A) and the result showed that the SCs were CD24+CD44+, while NSC clones were CD24+CD44− (Figure 2A). Moreover, both SCs and NSCs were TP63 negative and EpCAMC, CD49F positive (Figure 2A). Then we can draw the conclusion that SCs may have breast cancer stem cell characteristics, as identified by Pece et al19.
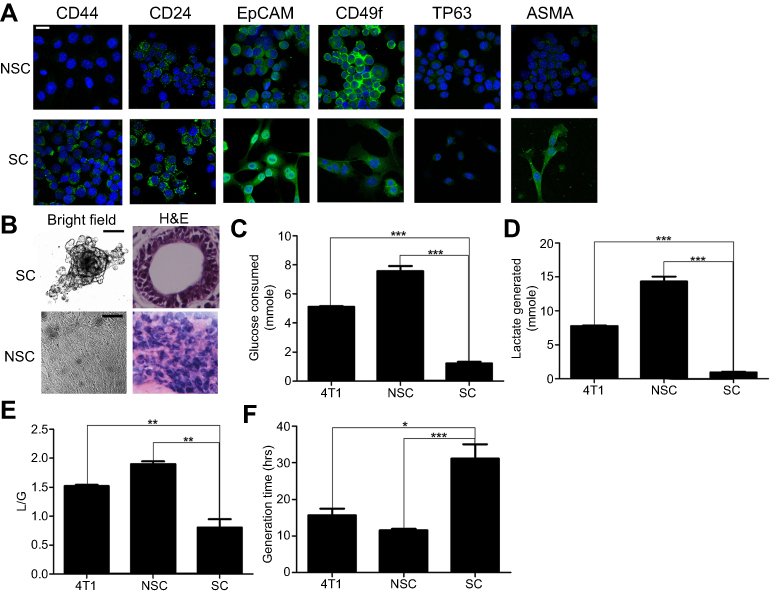 | Figure 2 The characters of SCs and NSCs. (A) The surface markers of SCs and NSCs. The results were confirmed by 3 independent experiments. The scale bar=50 μm. (B) Under 3D culture, SC cells formed acinar-like colony while NSC cells did not form such colonies. The results were confirmed by 3 independent experiments. The scale bar=50 μm. (C–F) Glycolysis and cell growth rate of bulky 4T1, NSCs, and SCs. Data are mean ± SEM, n=9, from 3 independent experiments. |
The differentiation capability of SC
Under 3D culture (Figure 2B), SCs formed acinar-like colonies containing tubular-like structures, whereas NSCs did not form such colonies, that means SCs had the ability of differentiation.
Glycolysis and cell growth rate of SC and NSC
NSCs showed a significantly higher glycolysis rate (Figure 2C) and generated more lactate (Figure 2D) than SCs. Moreover, the L/G ratios (the amount of lactate generated divided by the amount of glucose consumed) for NSCs and SCs were 1.9 and 0.8 (Figure 2E), indicating that NSCs waste significantly higher glucose carbon per unit of consuming glucose. Consistently, NSCs proliferated significantly faster than SCs (Figure 2F).
SCs showed a markedly higher metastatic ability than NSCs
We inoculated Balb/c mice with bulky 4T1 cells from regular culture, freshly isolated SCs, or NSCs. For SCs and NSCs, each mouse was inoculated with one clone of SC or NSC with monoclonal in nature. Then in 3 independent experiments, 30 clones of SC were separately inoculated into 30 mice, with each mouse receiving one clone, the same to NSCs. This guaranteed no cross contamination between different SCs, different NSCs, and between SCs and NSCs. There was no significant difference in the body weight between the 2 groups (Figure 3A). SCs grew slowly than NSCs (Figure 3B and C). SCs had markedly higher colonization ability of lung, bone, and heart than NSCs (Figure 3D–G).
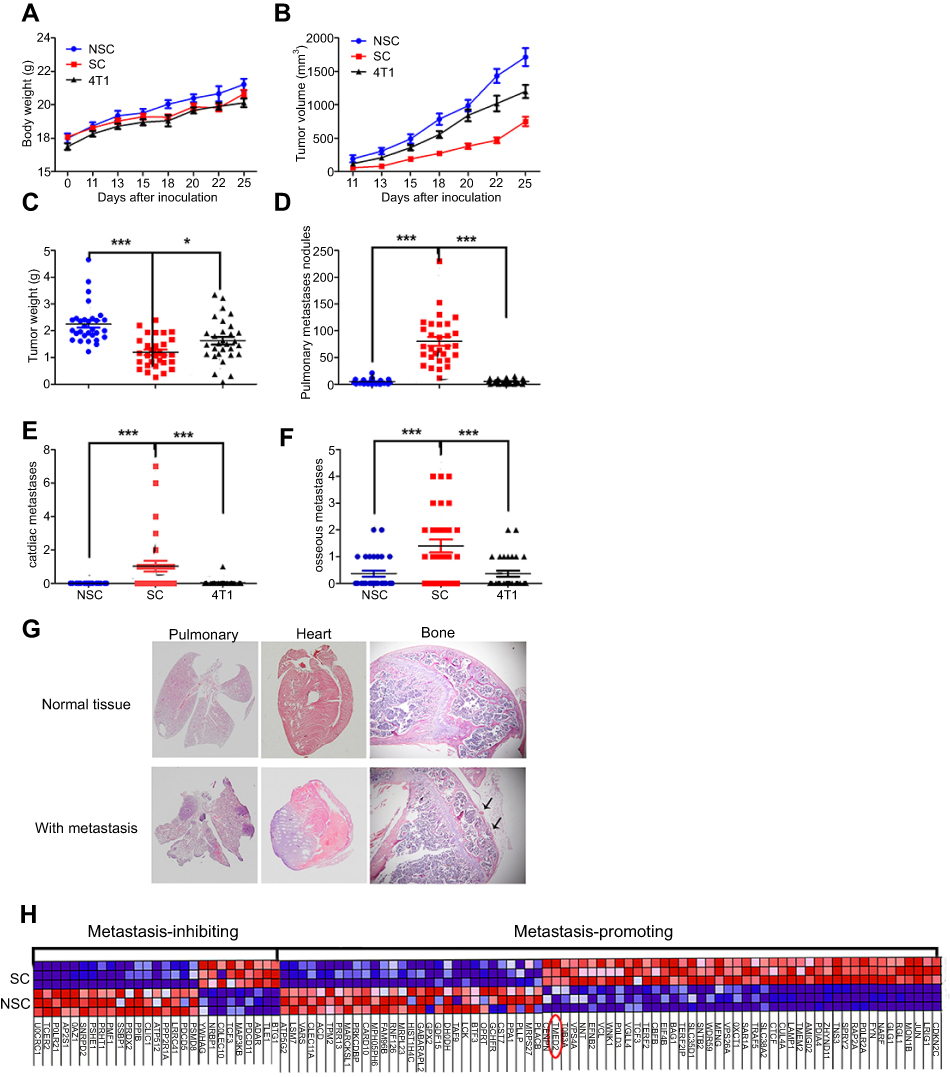 | Figure 3 SCs exhibit a higher metastatic competent than NSCs and bulky 4T1 cells. (A–C) The curves of body weight, tumor size, and tumor weight on the day of sacrifice. (D–G) Metastasis at lung, heart, and bone. Data are mean ± SEM from 3 independent experiments, n=30 for each group. (H) Heat map of the genes associated with metastasis among SCs and NSCs. Note: Significance was defined at ***P<0.001, **P<0.01, *P<0.05 |
Transcriptome of SC and NSC
To probe the gene expression of SCs and NSCs, we conducted mRNA-seq analysis of SCs and NSCs. The result displayed that there were 6,465 genes differentially expressed between SCs and NSCs. With the assistant of GSEA, we found that there were 100 genes associated with metastasis (Figure 3H), among which, 73 and 27 genes were pro- and anti-metastasis, respectively. 44 and 29 pro-metastatic genes were highly expressed in SC and NSC, respectively.
TMED2 generally increased expressed in breast cancer
We used UALCAN (
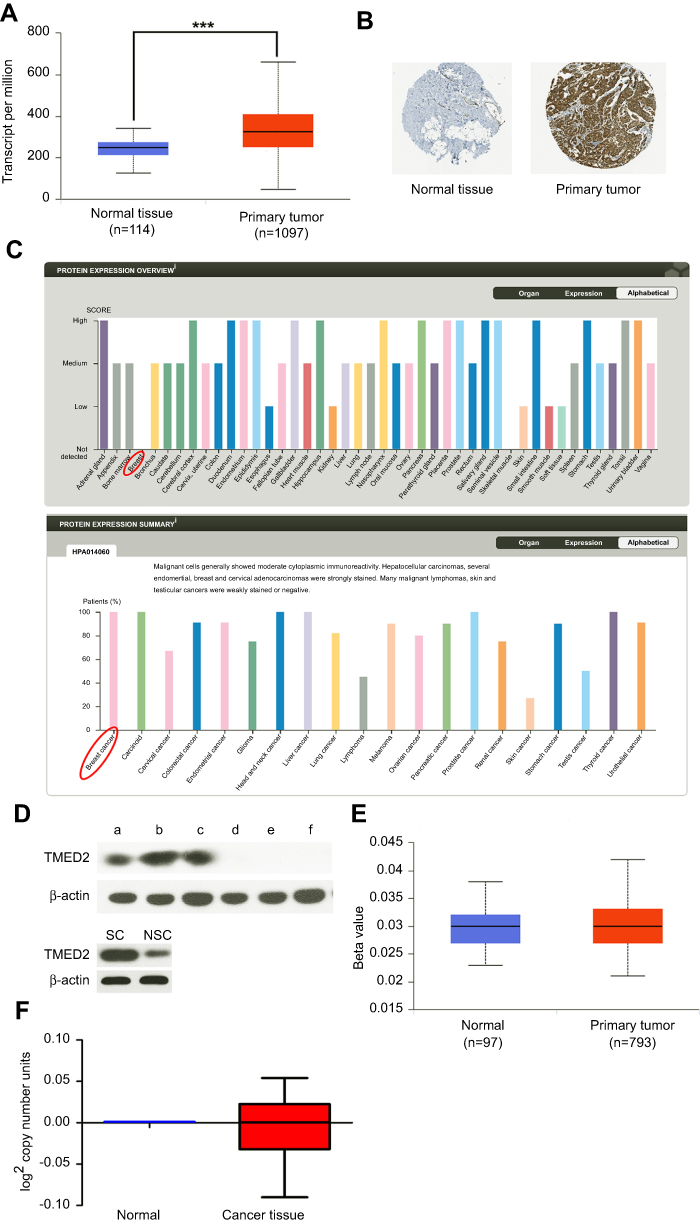 | Figure 4 The expression level of TMED2 in breast cancer and normal breast cancer. (A) The expression of TMED2 was elevated in breast cancer compared to normal breast tissues. Data derived from UALCAN database. (B–C) Immunohistochemical analysis of TMED2 expression in breast cancer and normal mammary tissue and overview of TMED2 protein levels in breast tumor tissues and normal breast tissues. Data derived from the Human Protein Atlas database. (D) The TMED2 protein expression of breast cancer tissue (a–c), breast normal tissue (d–f), SCs and NSCs were examined by Western Blot and β-actin was used as an internal reference. Data were from 3 independent experiments. (E) The DNA methylation level of breast cancer and normal breast tissue, the Beta value indicates level of DNA methylation ranging from 0 (unmethylated) to 1 (fully methylated). Different beta value cut-off has been considered to indicate hyper-methylation. Data derived from UALCAN database. (F) The DNA copy number of breast cancer and normal breast tissue and data derived from oncomine database and analyzed with GraphPad. |
High level of TMED2 was a poor prognostic factor in breast cancer
We checked the overall survival of mice injected with SCs and NSCs. The result showed that the overall survival of SC which higher expressed TMED2 was obviously shorter than NSC (Figure 5A, P=0.0003). To investigate the prognostic values of TMED2 in patients with breast cancer, the Kaplan–Meier plotter bioinformatics analysis platform (
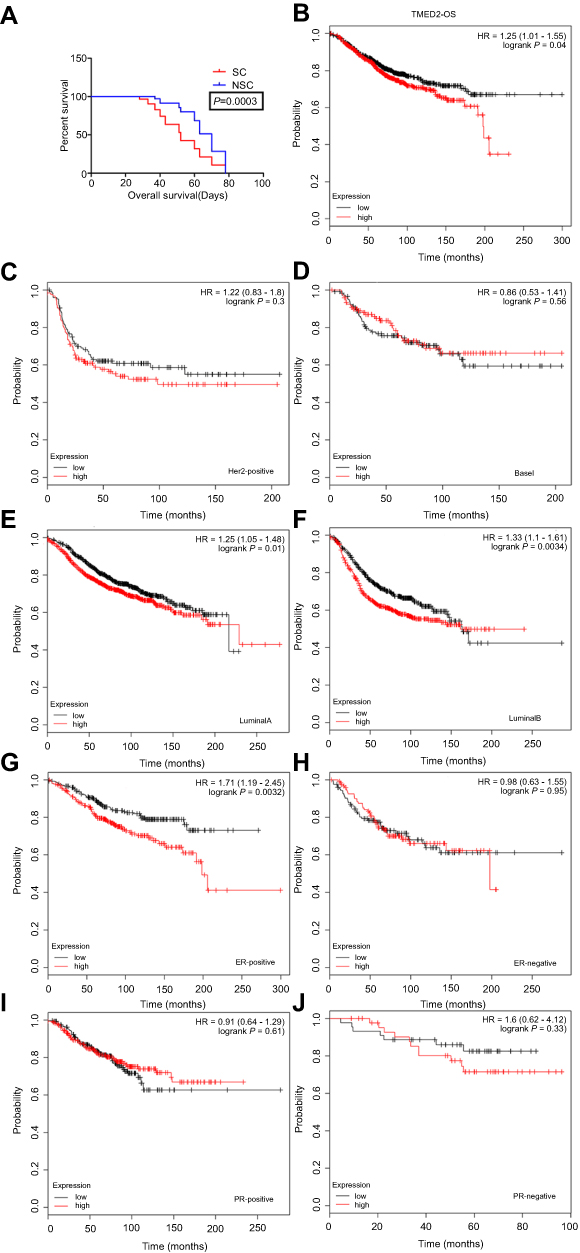 | Figure 5 Prognostic value of TMED2 expression in patients with breast cancer. (A) The overall survival of SCs and NSCs. Mice were randomly subcutaneously injected with 1×10⁴ SCs or NSCs. The day the mice died was recorded, n=10 for each group. (B–J) The expression level of TMED2 in breast cancer patients with different intrinsic subtypes included basal-like, HER2-positive, Luminal A and Luminal B breast cancer. Data derived from Kaplan–Meier (KM) plotter database. |
Prognosis in patients with mRNA expression of the TMED2 and patient clinicopathological characteristics
Patient clinicopathological characteristics included tumor ER status, PR status, positive lymph-node status, grade, and P53-mutation status et al. Increased TMED2 expression was significantly correlated with reduced patient OS in ER-positive breast cancer patients (HR=1.71, 95% CI 1.19–2.45; P-value=0.0032, Figure 5G). While mRNA expression levels of TMED2 and patients with ER-negative (HR=0.98, 95% CI 0.63–1.55; P-value=0.95, Figure 5H), PR-positive (HR=0.91, 95% CI 0.64–1.29; P-value=0.61, Figure 5I), PR-negative (HR=1.6, 95% CI 0.62–4.12; P-value=0.33, Figure 5J) breast cancer showed no significant prognostic associations.
As Table 1 showed, there was no significant correlation between mRNA-expression levels of TMED2 and histopathological grades of the breast cancers. As shown in Table 2, expression levels of mRNA for TMED2 had no relationship with lymph-node-positive (HR 1.14, 95% CI 0.78–1.68, P=0.5001) patients nor lymph-node-negative (HR1.28, 95% CI 0.88–1.85, P=0.19) patients. Table 3 showed that TMED2 expression level had no significantly associated with the outcome in mutant-p53-type breast cancer patients (HR 0.96, 95% CI 0.44–2.07; P=0.91) nor wild-p53-type breast cancer patients (HR 1.01, 95% CI 0.53–1.93; P=0.97).
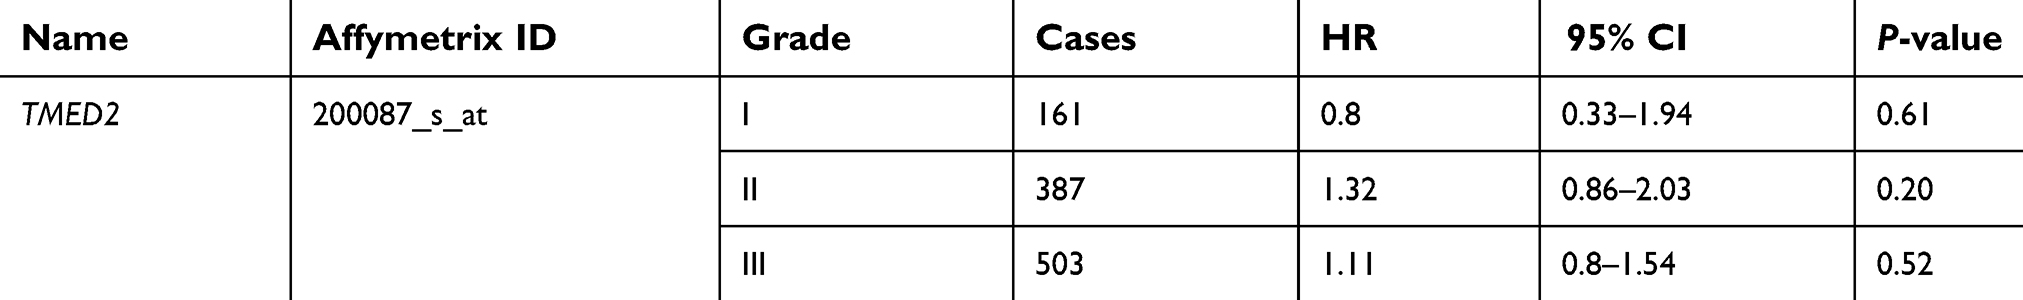 | Table 1 Correlation of TMED2 mRNA expression with OS in different grades of breast cancer patients |
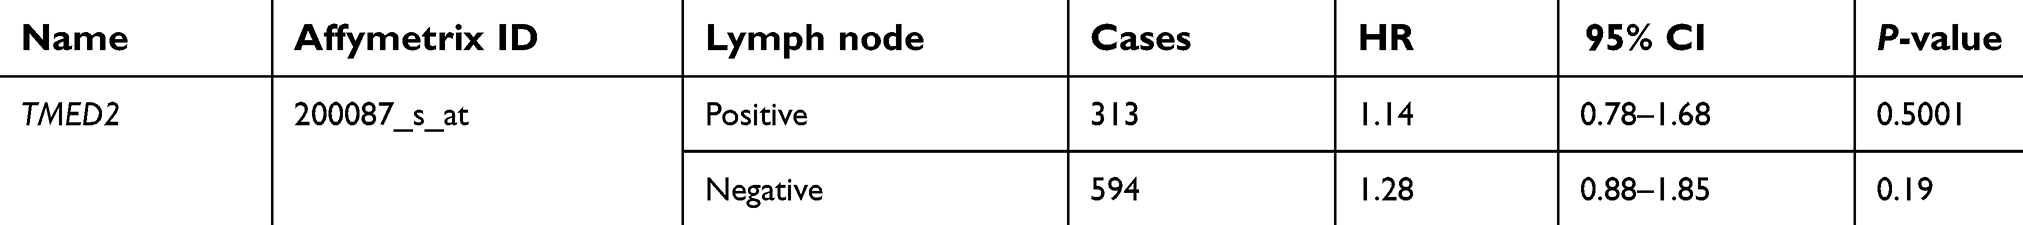 | Table 2 Correlation of TMED2 mRNA expression with OS in different lymph-node statuses of breast cancer patients |
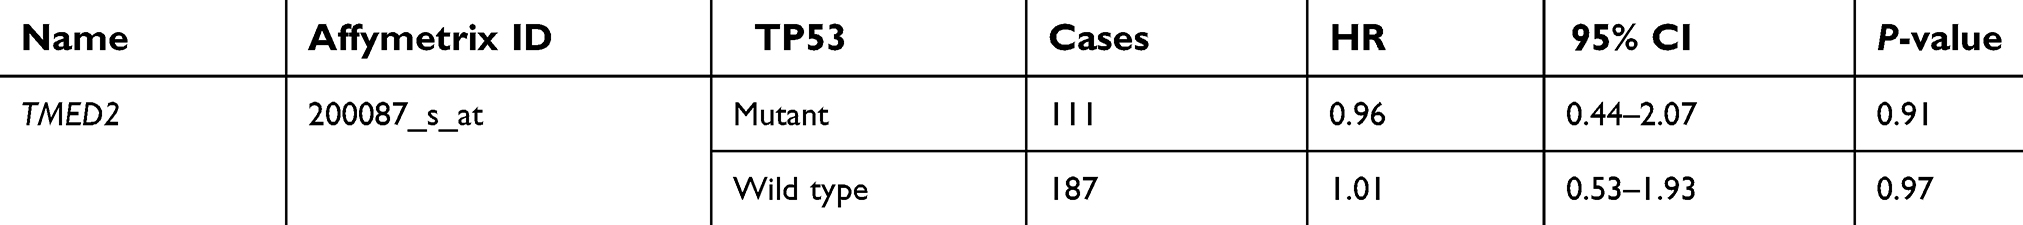 | Table 3 Correlation of TMED2 mRNA expression with OS in different TP53 statuses of breast cancer patients |
Discussion
Though TMED family had been discovered over twenty years, the function and mechanism of the TMED family still remained unclear. Some studies reported that disrupted expression of TMED proteins resulted in a great number of diseases ranging from cancer to Alzheimer’s.20 Some researches revealed that TMED3 was a tumor suppressor gene implicated in colon cancer, prostate cancer, and hepatocellular carcinoma progression.21–23 However, the function of TMED2 in cancer was rarely studied.
The oncogenesis of breast cancer is a synthesis of multifarious molecular events. Owing to the low rate for early diagnosis, frequent failures in conventional treatment strategies and drug resistant, the mortality of breast cancer still remains high.24 Therefore, it is basic and urgent to excavate some cancer-related molecular markers associated with the prognosis of breast cancer.
In our study, we discovered that SCs and NSCs were two different phenotypes of 4T1 cells. SCs corresponded to high metastatic competence, differentiation ability, low growth rate, and low metabolic rate features. Moreover, we got SCs and NSCs from 4T1 cells in normal culture condition with low density which was a new discovery (Figures 1–3). By performing transcriptome sequencing data analysis and western blot, we found TMED2 expressed higher in SCs (Figures 3H and 4D). And with the help of some bioinformatics web tools, we observed an increased expression of TMED2 in breast cancer compared to the normal mammary tissues (Figure 4). In order to explain the reason for TMED2 higher expressed in breast cancer sample, we analyzed the DNA copy number and DNA methylation level of breast cancer and normal breast tissue but did not find any significant difference (Figure 4E and F). There were many reasons for genes increased expressed in cancers. Such as gene amplification, the DNA copy number and DNA methylation level.25–30 Gene overexpression is a very complicated process, which may be caused by many factors. We were current unable to determine the cause of high expression of TMED2 in breast cancer. We also found that the elevated expression of TMED2 in breast cancer resulted in a poor outcome (Figure 5). Based on these results, we believed TMED2 could serve as a potential breast cancer biomarker and a potential cancer treatment target.
We also used limiting dilution method to clone human breast cancer cell lines (MDA-MB-231, Bcap37 and MCF7) and other cell lines (A549 and CT26), but we did not observe the phenotype of SCs and NSCs. It is possible that these cells underwent some other changes that were not identified by us.
In summary, to our knowledge, this is the first time to reveal the existence of SCs and NSCs under common cell culture condition and evaluate the association of TMED2 expression with breast cancer prognosis. Our study suggested that increased expression of TMED2 is associated with a poor result of breast cancer.
Acknowledgments
This work has been supported in part by the China National 973 project (2013CB911303), China Natural Sciences Foundation projects (81470126) and the Fundamental Research Funds for the Central Universities, National Ministry of Education, China, all to XH.
Disclosure
The authors declare no conflicts of interest in this work.
References
1. Bray F, Ferlay J, Soerjomataram I, Siegel RL, Torre LA, Jemal A. Global cancer statistics 2018: GLOBOCAN estimates of incidence and mortality worldwide for 36 cancers in 185 countries. CA Cancer J Clin. 2018;68(6):394–424. doi:10.3322/caac.21492
2. Yilmaz M, Christofori G. Mechanisms of motility in metastasizing cells. Mol Cancer Res. 2010;8(5):629–642. doi:10.1158/1541-7786.MCR-10-0139
3. Pulaski BA, Ostrand-Rosenberg S. Reduction of established spontaneous mammary carcinoma metastases following immunotherapy with major histocompatibility complex class II and B7.1 cell-based tumor vaccines. Cancer Res. 1998;58(7):1486–1493.
4. Lelekakis M, Moseley JM, Martin TJ, et al. A novel orthotopic model of breast cancer metastasis to bone. Clin Exp Metastasis. 1999;17(2):163–170. doi:10.1023/A:1006689719505
5. Zakariyah A, Hou W, Slim R, Jerome-Majewska L. TMED2/p24beta1 is expressed in all gestational stages of human placentas and in choriocarcinoma cell lines. Placenta. 2012;33(3):214–219. doi:10.1016/j.placenta.2011.12.009
6. Shi-Peng G, Chun-Lin C, Huan W, et al. TMED2 promotes epithelial ovarian cancer growth. Oncotarget. 2017;8(55):94151–94165. doi:10.18632/oncotarget.21593
7. Lee GY, Kenny PA, Lee EH, Bissell MJ. Three-dimensional culture models of normal and malignant breast epithelial cells. Nat Methods. 2007;4(4):359–365. doi:10.1038/nmeth1015
8. Wu H, Ding Z, Hu D, et al. Central role of lactic acidosis in cancer cell resistance to glucose deprivation-induced cell death. J Pathol. 2012;227(2):189–199. doi:10.1002/path.3978
9. Zhang B, Liu Z, Hu X. Inhibiting cancer metastasis via targeting NAPDH oxidase 4. Biochem Pharmacol. 2013;86(2):253–266. doi:10.1016/j.bcp.2013.05.011
10. Li Z, Li AD, Xu L, et al. SPARC expression in gastric cancer predicts poor prognosis: results from a clinical cohort, pooled analysis and GSEA assay. Oncotarget. 2016;7(43):70211–70222. doi:10.18632/oncotarget.12191
11. Subramanian A, Tamayo P, Mootha VK, et al. Gene set enrichment analysis: a knowledge-based approach for interpreting genome-wide expression profiles. Proc Natl Acad Sci U S A. 2005;102(43):15545–15550. doi:10.1073/pnas.0506580102
12. Chandrashekar DS, Bashel B, Balasubramanya SAH, et al. UALCAN: a portal for facilitating tumor subgroup gene expression and survival analyses. Neoplasia. 2017;19(8):649–658. doi:10.1016/j.neo.2017.05.002
13. Uhlen M, Fagerberg L, Hallstrom BM, et al. Proteomics. Tissue-based map of the human proteome. Science. 2015;347(6220):1260419. doi:10.1126/science.1260419
14. Rhodes DR, Yu J, Shanker K, et al. ONCOMINE: a cancer microarray database and integrated data-mining platform. Neoplasia. 2004;6(1):1–6.
15. Gyorffy B, Lanczky A, Eklund AC, et al. An online survival analysis tool to rapidly assess the effect of 22,277 genes on breast cancer prognosis using microarray data of 1,809 patients. Breast Cancer Res Treat. 2010;123(3):725–731. doi:10.1007/s10549-009-0674-9
16. Gyorffy B, Lanczky A, Szallasi Z. Implementing an online tool for genome-wide validation of survival-associated biomarkers in ovarian-cancer using microarray data from 1287 patients. Endocr Relat Cancer. 2012;19(2):197–208. doi:10.1530/ERC-11-0329
17. Szasz AM, Lanczky A, Nagy A, et al. Cross-validation of survival associated biomarkers in gastric cancer using transcriptomic data of 1,065 patients. Oncotarget. 2016;7(31):49322–49333. doi:10.18632/oncotarget.10337
18. Gyorffy B, Surowiak P, Budczies J, Lanczky A. Online survival analysis software to assess the prognostic value of biomarkers using transcriptomic data in non-small-cell lung cancer. PLoS One. 2013;8(12):e82241. doi:10.1371/journal.pone.0082241
19. Pece S, Tosoni D, Confalonieri S, et al. Biological and molecular heterogeneity of breast cancers correlates with their cancer stem cell content. Cell. 2010;140(1):62–73. doi:10.1016/j.cell.2009.12.007
20. Hou W, Gupta S, Beauchamp MC, Yuan L, Jerome-Majewska LA. Non-alcoholic fatty liver disease in mice with heterozygous mutation in TMED2. PLoS One. 2017;12(8):e0182995. doi:10.1371/journal.pone.0182995
21. Duquet A, Melotti A, Mishra S, et al. A novel genome-wide in vivo screen for metastatic suppressors in human colon cancer identifies the positive WNT-TCF pathway modulators TMED3 and SOX12. EMBO Mol Med. 2014;6(7):882–901. doi:10.15252/emmm.201303799
22. Vainio P, Mpindi JP, Kohonen P, et al. High-throughput transcriptomic and RNAi analysis identifies AIM1, ERGIC1, TMED3 and TPX2 as potential drug targets in prostate cancer. PLoS One. 2012;7(6):e39801. doi:10.1371/journal.pone.0039801
23. Zheng H, Yang Y, Han J, et al. TMED3 promotes hepatocellular carcinoma progression via IL-11/STAT3 signaling. Sci Rep. 2016;6:37070. doi:10.1038/srep37070
24. Siegel R, Naishadham D, Jemal A. Cancer statistics, 2012. CA Cancer J Clin. 2012;62(1):10–29. doi:10.3322/caac.20138
25. Santarius T, Shipley J, Brewer D, Stratton MR, Cooper CS. A census of amplified and overexpressed human cancer genes. Nat Rev Cancer. 2010;10(1):59–64. doi:10.1038/nrc2771
26. Ohshima K, Hatakeyama K, Nagashima T, et al. Integrated analysis of gene expression and copy number identified potential cancer driver genes with amplification-dependent overexpression in 1,454 solid tumors. Sci Rep. 2017;7(1):641. doi:10.1038/s41598-017-00219-3
27. Cuiyan Z, Jie H, Fang Z, et al. Overexpression of RhoE in Non-small Cell Lung Cancer (NSCLC) is associated with smoking and correlates with DNA copy number changes. Cancer Biol Ther. 2007;6(3):335–342. doi:10.4161/cbt.6.3.3663
28. Yung MK, Lo KW, Yip CW, et al. Copy number gain of granulin-epithelin precursor (GEP) at chromosome 17q21 associates with overexpression in human liver cancer. BMC Cancer. 2015;15:264. doi:10.1186/s12885-015-1584-3
29. Klutstein M, Nejman D, Greenfield R, Cedar H. DNA methylation in cancer and aging. Cancer Res. 2016;76(12):3446–3450. doi:10.1158/0008-5472.CAN-15-3278
30. Pan Y, Liu G, Zhou F, Su B, Li Y. DNA methylation profiles in cancer diagnosis and therapeutics. Clin Exp Med. 2018;18(1):1–14. doi:10.1007/s10238-017-0467-0
 © 2019 The Author(s). This work is published and licensed by Dove Medical Press Limited. The
full terms of this license are available at https://www.dovepress.com/terms
and incorporate the Creative Commons Attribution
- Non Commercial (unported, 3.0) License.
By accessing the work you hereby accept the Terms. Non-commercial uses of the work are permitted
without any further permission from Dove Medical Press Limited, provided the work is properly
attributed. For permission for commercial use of this work, please see paragraphs 4.2 and 5 of our Terms.
© 2019 The Author(s). This work is published and licensed by Dove Medical Press Limited. The
full terms of this license are available at https://www.dovepress.com/terms
and incorporate the Creative Commons Attribution
- Non Commercial (unported, 3.0) License.
By accessing the work you hereby accept the Terms. Non-commercial uses of the work are permitted
without any further permission from Dove Medical Press Limited, provided the work is properly
attributed. For permission for commercial use of this work, please see paragraphs 4.2 and 5 of our Terms.