Back to Journals » International Journal of Nanomedicine » Volume 13
In vitro cellular localization and efficient accumulation of fluorescently tagged biomaterials from monodispersed chitosan nanoparticles for elucidation of controlled release pathways for drug delivery systems
Authors Hassan UA, Hussein MZ ![]() , Alitheen NB
, Alitheen NB ![]() , Yahya Ariff SA
, Yahya Ariff SA ![]() , Masarudin MJ
, Masarudin MJ ![]()
Received 7 February 2018
Accepted for publication 25 April 2018
Published 5 September 2018 Volume 2018:13 Pages 5075—5095
DOI https://doi.org/10.2147/IJN.S164843
Checked for plagiarism Yes
Review by Single anonymous peer review
Peer reviewer comments 3
Editor who approved publication: Dr Thomas Webster
Ummu Afiqah Hassan,1 Mohd Zobir Hussein,2 Noorjahan Banu Alitheen,1 Syazaira Arham Yahya Ariff,1 Mas Jaffri Masarudin1,2
1Department of Cell and Molecular Biology, Faculty of Biotechnology and Biomolecular Sciences, Universiti Putra Malaysia, Serdang, Selangor, Malaysia; 2Material Synthesis and Characterization Laboratory, Institute of Advanced Technology, Universiti Putra Malaysia, Serdang, Selangor, Malaysia
Background: Inefficient cellular delivery and poor intracellular accumulation are major drawbacks towards achieving favorable therapeutic responses from many therapeutic drugs and biomolecules. To tackle this issue, nanoparticle-mediated delivery vectors have been aptly explored as a promising delivery strategy capable of enhancing the cellular localization of biomolecules and improve their therapeutic efficacies. However, the dynamics of intracellular biomolecule release and accumulation from such nanoparticle systems has currently remained scarcely studied.
Objectives: The objective of this study was to utilize a chitosan-based nanoparticle system as the delivery carrier for glutamic acid, a model for encapsulated biomolecules to visualize the in vitro release and accumulation of the encapsulated glutamic acid from chitosan nanoparticle (CNP) systems.
Methods: CNP was synthesized via ionic gelation routes utilizing tripolyphosphate (TPP) as a cross-linker. In order to track glutamic acid release, the glutamic acid was fluorescently-labeled with fluorescein isothiocyanate prior encapsulation into CNP.
Results: Light Scattering data concluded the successful formation of small-sized and monodispersed CNP at a specific volume ratio of chitosan to TPP. Encapsulation of glutamic acid as a model cargo into CNP led to an increase in particle size to >100 nm. The synthesized CNP exhibited spherical shape under Electron Microscopy. The formation of CNP was reflected by the reduction in free amine groups of chitosan following ionic crosslinking reactions. The encapsulation of glutamic acid was further confirmed by Fourier Transform Infrared (FTIR) analysis. Cell viability assay showed 70% cell viability at the maximum concentration of 0.5 mg/mL CS and 0.7 mg/mL TPP used, indicating the low inherent toxicity property of this system. In vitro release study using fluorescently-tagged glutamic acids demonstrated the release and accumulation of the encapsulated glutamic acids at 6 hours post treatment. A significant accumulation was observed at 24 hours and 48 hours later. Flow cytometry data demonstrated a gradual increase in intracellular fluorescence signal from 30 minutes to 48 hours post treatment with fluorescently-labeled glutamic acids encapsulated CNP.
Conclusion: These results therefore suggested the potential of CNP system towards enhancing the intracellular delivery and release of the encapsulated glutamic acids. This CNP system thus may serves as a potential candidate vector capable to improve the therapeutic efficacy for drugs and biomolecules in medical as well as pharmaceutical applications through the enhanced intracellular release and accumulation of the encapsulated cargo.
Keywords: drug delivery, nanotechnology, chitosan, glutamic acid, FITC
Introduction
The efficacy of many drugs and therapeutic moieties is dependent on their effective uptake and accumulation into a targeted area.1 Thus, several factors such as in vivo persistence, biologic barrier-crossing capacities, and precise local uptake in adequate concentrations are paramount for achieving meaningful therapeutic responses. Use of conventional pharmacotherapies has often been associated with poor in vivo stability, short in vivo persistence, decreased intestinal permeation, low cellular transport capacity, and nonselective delivery, which often compromise any biologic efficacies.2,3 Although the discovery of candidate therapeutic compounds remains exponential, herein lies a need to develop a system to increase their cellular accumulation and uptake for maximum therapeutic efficacy.
Nanotechnology has been spurring great research tractions in both biologic and medical fields, especially for drug delivery applications.4,5 Nanoparticle-based approaches for pharmaceutical and medical applications have been attributed as a novel platform to address and remedy limitations of conventional drug delivery strategy. The use of nanoparticles as efficient delivery carriers requires them to not only be able to permeate tissues and accumulate inside cell, but they must also be capable to efficiently release the payloads into the cells. The capacity of nanotherapeutics to passively or actively accumulate into many different cell types has been well reported in a few studies.4,10,12 These nanosized carriers provide a mechanism for local delivery of therapeutic molecules while controlling the impact of side effects.6 Nanoparticles have also been shown to possess unique properties and functions as delivery carriers owing to their “size effects”, which promote better penetration through various body compartments.7
In recent years, reports on the synthesis and development of chitosan-based nanoparticle systems for delivery of a multitude of therapeutic agents and biomolecules including gene, protein, and peptide drugs have increased.8–10 Recent focus has been shifted to the elucidation of cellular uptake mechanism of chitosan nanoparticles (CNPs).11–13 Regardless of nanoparticle entry, CNPs were found to efficiently accumulate in cells more than free drugs, where the accumulation suggested an enhanced therapeutic response of the carried cargo.14,15 However, there exists no report that tracks the eventual release of those molecules after uptake of the nanoparticles into cells. Additionally, the dynamic release properties of encapsulated biomolecules from CNPs at the cellular level has also yet to be elucidated in the literature. The therapeutic efficacy of drugs, which is dependent on their accumulation into cells, requires that its efficient release and accumulation into cells be assessed and confirmed. Therefore, there lies a need to study the release and localization of the encapsulated cargo for designing an efficient vector capable of improving drug potency through intracellular cargo release and accumulation.
In this study, chitosan-based nanoparticles were synthesized, characterized, and used as a delivery carrier for glutamic acid (GA) as a model biomolecule for encapsulation. To elucidate release mechanisms and dynamics of the system, fluorescently labeled GA as the cargo was synthesized. CNPs were synthesized through ionic gelation routes and optimized for encapsulation of fluorescently labeled GA (fGA). The resulting biomolecule-encapsulated nanoparticles were then characterized using various physicochemical methods. The potential of this nanoparticle system toward enhancing intracellular amino acid accumulation and release was then subsequently assessed using an in vitro cell line model, 786-O kidney cancer cells. Fluorescence microscopy was utilized to monitor the time-based release profiles and localization of the fGA from the nanoparticle system. Fluorescence-activated cell sorting (FACS) analysis was used to quantitatively assess the accumulation of fGA in 786-O cells, and thus subsequently verify the observations from fluorescence microcopy.
Materials and methods
Materials
Chitosan (low molecular weight), sodium tripolyphosphate (TPP), L-GA, fluorescein 5(6)-isothiocyanate (FITC), picrylsulfonic acid solution (5% w/v), sodium dodecyl sulfate, EDTA, 10× PBS, dimethyl sulfoxide (DMSO), thiazoyl blue tetrazolium bromide, and 4,6-diamidino-2-phenylindole dihydrochloride (DAPI) were purchased from Sigma-Aldrich, St. Louis, MO, USA and used without further purification. RPMI media 1640, antibiotic-antimycotic, 0.25% trypsin-EDTA (1×), and fetal bovine serum were purchased from Gibco, Life Technologies, Gaithersburg, MA, USA. Sodium hydroxide pellet, hydrochloric acid, 37% formaldehyde, and acetic acid glacial were obtained from Friendemann (Parkwood, WA, Australia). 786-O cells were purchased from American Type Culture Collection, VA, USA.
Synthesis of nanoparticles
CNPs were synthesized by ionic gelation route with TPP as a cross-linker, using methods modified from previous studies by Masarudin et al.16 Briefly, chitosan solution (CS) was prepared at a concentration of 1 mg/mL in deionized distilled water containing 1 mL acetic acid (1.0% v/v) and was stirred until the powder was fully dissolved. The CS was then diluted into three different working concentrations, as shown in Table 1. The resulting CSs were then adjusted to pH 5. TPP solution was prepared at a concentration of 1 mg/mL. Similarly, 25 mg/mL TPP powder was dissolved in 25 mL deionized water and subsequently diluted into working concentrations indicated in Table 1. The resulting TPP solutions were then adjusted to pH 2. All working chitosan and TPP solutions were centrifuged at 4,000 rpm for 45 minutes and the supernatant was collected. As shown in Table 1, three different formulations of CNPs were spontaneously formed by mixing 600 μL CS with increasing concentrations of TPP. The resulting CNPs were then centrifuged at 13,000 rpm for 20 minutes. The 40% of CNP-containing supernatant was then collected and diluted with 60% deionized distilled water for further analysis and experimentation.
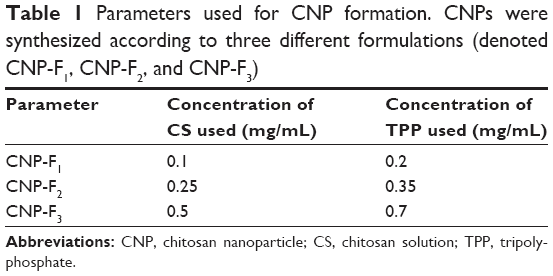 | Table 1 Parameters used for CNP formation. CNPs were synthesized according to three different formulations (denoted CNP-F1, CNP-F2, and CNP-F3) |
Synthesis of GA-encapsulated nanoparticles (GA-CNPs)
GA solution was prepared by dispersing GA powder in 10 mL deionized distilled water and was stirred at 80°C until fully dissolved. Concurrently, CS and TPP solutions were prepared according to the protocols described earlier. In this study, GA was encapsulated into CS using methods modified from a previous study by adding drugs to CS prior to addition of TPP.17 GA encapsulation was achieved by adding 250 μL GA at different concentrations to 600 μL CS (0.5 mg/mL) prior to the addition of TPP. The GA–CS mixture was then incubated at room temperature for 10 minutes, and GA-CNP formation was initiated by addition of 250 μL TPP (0.7 mg/mL). The resulting GA-CNP was used for further analyses and experimentation.
Encapsulation efficiency of GA within CNP
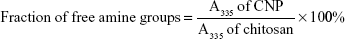
Trinitrobenzene sulfonic acid (TNBS) assay was used to evaluate the capacity of CNPs to encapsulate GA and to subsequently demonstrate their potential as a drug delivery vehicle. The optimized CNP parameter (CNP-F3) and GA-CNP were prepared as described earlier. The nanoparticles were centrifuged at 13,000 rpm for 40 minutes. The supernatant from each centrifuged sample was collected and mixed with 100 μL of 0.05% TNBS solution, before being incubated in a water bath at 37°C for 3 hours. Following incubation, 100 μL of the mixture was then transferred into a 96-well plate. A volume of 100 μL of 10% SDS and 75 μL of 1 M HCl were added into each well containing samples to terminate the reaction. The absorbance was then recorded at 335 nm and the amount of free GA expressed as the fraction of free amine groups was calculated using the following equation:
- A335 of free amine groups of GA = A335 of GA-CNP − A335 of CNP
- A335 of encapsulated GA = A335 of GA used − A335 of free amine groups of GA
- Encapsulation efficiency of GA (%) = (A335 of encapsulated GA)/(A335 of used) × 100%
Synthesis of FITC-labeled GA-CNPs
FITC solution was prepared by dispersing 1 mg FITC powder into 1 mL DMSO. Approximately 50 μL FITC was then added to 200 μL GA solution and was incubated for 20 minutes in the dark at 24°C. The mixture of FITC–GA was then added to 600 μL CS solution (0.5 mg/mL) and was further incubated for 15 minutes. A volume of 250 μL of TPP (0.7 mg/mL) was added to 850 μL of the total mixture and was thoroughly mixed to ensure that a homogeneous suspension was obtained. The FITC-GA-encapsulated CNP was then stored at 4°C for further analyses.
Analysis of nanoparticle size and distribution by dynamic light scattering
The size and distribution of synthesized CNP, GA-CNP, and FITC-labeled GA-CNP were analyzed by dynamic light scattering (DLS) using a Zetasizer Nano ZS (Malvern, PA, USA). The sample was directly loaded into a disposable cuvette provided and equilibrated for 90 seconds. Analysis was then performed at 25°C and repeated three times per analysis run to obtain a consistent reading.
Quantification of the percentage free primary amine groups in nanoparticles using TNBS assay
TNBS assay was conducted to determine the percentage of excess primary amine group (NH2) of chitosan, and to verify the role of primary amine groups in the formation of CNP. This method was modified from previous studies.16,31 Briefly, 100 μL of CNP samples was mixed with 100 μL of TNBS solution (0.05% v/v) and was incubated in a water bath at 37°C for 3 hours. Following incubation, 100 μL of the mixture was transferred into a 96-well plate. A volume of 100 μL of 10% (w/v) SDS and 75 μL (1.0 M) HCl were added into each well containing samples to terminate the reaction. The absorbance was monitored at 335 nm and the fraction of free amine groups was calculated using the following formula16:
|
Fourier transform infrared (FTIR) analysis of CNP
Liquid samples of CNP, GA-loaded CNP, and FITC-GA-encapsulated CNP were freeze dried for 3 days preceding FTIR analysis using a Scanvac, CoolSafe Freeze Dryer (Labogene, Lillerod, Denmark) at −90°C under 0.8–4.0 hPa pressure. The absorption spectra of all powder samples were recorded on a Perkin Elmer Spectrum 100 IR Instrument (Shelton, CT, USA), operating from 280 to 4,000 cm−1.
Morphologic analysis of CNP using electron microscopy
Morphologic features and particle size of CNP, GA-CNP, and FITC-labeled GA-CNP were observed under field emission scanning electron microscopy (FESEM) and transmission electron microscopy (TEM). All liquid samples were diluted prior to analysis using deionized distilled water. Approximately 20 μL of the samples was diluted into 500 μL deionized distilled water and sonicated for 1–2 minutes. An aluminum stub was then dropwise coated with the sample and dried at 55°C for 3 days. Preceding the analysis, samples were coated with gold and visualized using a FEI Nova Nanosem 230 FESEM (Kensington, Sydney, Australia). The magnification and voltage used were 100,000× and 5.00 kV, respectively. For TEM analysis, the samples were diluted into deionized distilled water. Few drops of the samples were diluted into 500 μL distilled water. A drop of the diluted samples was then coated onto a copper grid and was air dried at room temperature. The samples were then analyzed using a TECNAI G2 F20 (Pleasanton, CA, USA) transmission electron microscope utilizing voltages from 20 to 200 kV and standard magnification from 22× to 930 k×. Images were acquired using an SC1000 ORIUS CCD (Pleasanton, CA, USA) camera.
Establishment of cell lines and cytotoxicity evaluation of CNP by MTT assay
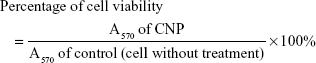
Human kidney cancer cells (786-O) were maintained in RPMI 1640 medium supplemented with 10% fetal bovine serum (FBS) and 1% antibiotic penicillin/streptomycin. Cells were stored in an incubator at 37°C with 5% CO2. MTT assay was performed to evaluate the in vitro cytotoxicity of the synthesized CNP using protocol modified from previous study.18 Briefly, 786-O kidney cancer cells were seeded into 96-well plates at a density of 0.8×10⁴ cells/well and incubated for 24 hours to reach 80% confluence. Prior to cellular treatment, CNP samples were serially diluted by a factor of 2. The following day, cells were treated with 100 μL CNP samples per well for 24 hours. At the end of the treatment period, media containing the samples were replaced with 150 μL fresh media. Prior to the assay, MTT solution was prepared by dissolving MTT powder in PBS at a concentration of 5 mg/mL and was sterile-filtered. Approximately 30 μL of the MTT solution was then pipetted into each well and incubated for 4 hours in order to allow the reaction to occur. After 4 hours, 150 μL of the total volume from each well was taken out and 100 μL of DMSO was pipetted into each well. The mixture was carefully pipetted up and down several times to solubilize the crystal formazan. The absorbance was then measured at 570 nm. The percentage of cell viability was calculated using the following equation16:
|
In vitro visualization of GA release and localization
FITC-labeled GA-CNPs were prepared following the steps described earlier. 786-O kidney cancer cells were seeded into six-well plates at a density of 5.0×10⁵ cells/well and were incubated for 24 hours. On the next day, cells were treated with 200 μL of the samples and incubated at different time points (30 minutes, 6 hours, 24 hours, and 48 hours). Prior to cell visualization, the medium from each well was discarded and the cells were washed once with 1× PBS. Approximately 2 mL of 4% formaldehyde was added into each well to fix the cells and incubated for 3–5 minutes in an incubator. The formaldehyde was then discarded and the cells were washed twice with 1× PBS. A volume of 2 mL DAPI solution (0.5 μg/mL) was added to each well to stain the cell nucleus. The cells were then further incubated for 5 minutes. Following incubation, DAPI was discarded and the cells were washed thrice with 1× PBS before fresh medium was added. The release and localization of GAs was observed under an IX3P2F/Olympus fluorescence inverted microscope (Olympus, Hamburg, Germany).
Detection of FITC signal from intracellular fGA through FACS analysis
Flow cytometry analysis was conducted to assess the accumulation of fGA in a single cell using FACS analysis. In this analysis, 786-O cells were seeded into six-well plates at a density of 5.0×10⁵ cells/well and allowed to grow for 24 hours. After 24 hours of incubation period, the cells were then treated with 150 μL of freshly prepared fGA-encapsulated CNP (fGA-CNP) and were incubated at 30 minutes, 6 hours, 24 hours, and 48 hours. Prior to the analysis, medium from each well was discarded and the cells were rinsed twice with 1× PBS. The cells were then subsequently harvested through trypsinization and centrifuged at 1,000 rpm for 5 minutes.
This method was modified from Xing et al.19 The cell pellet was then resuspended in 1 mL MACS buffer (10% FBS + 2 mM EDTA + 1× PBS). The fluorescence signal from each sample was then detected using a NovoCyte Flow Cytometry Instrument (Acea Biosciences Inc., San Diego, CA, USA). Cells were gated at 10,000 events per analysis of run. The number of cells showing positive FITC signal was then quantified and compared with the negative control (nontreated cells).
Results and discussion
Measurement of particle size and distribution by DLS
Particle size and distribution of CNP
CNPs were successfully formed through ionic cross-linking between the protonated amine groups of chitosan and the phosphate groups of TPP, using the previously described methods.16 Three sets of different CNP parameters were used, assigned CNP-F1, CNP-F2, and CNP-F3. Figures 1–3 indicate the smallest CNP size produced at 250 μL TPP addition to CS for all CNP formulations (70.64±1.04 nm for CNP-F1, 71.07±1.00 nm for CNP-F2, and 65.69±4.86 nm for CNP-F3). CNPs with the smallest polydispersity index (PDI) values were also produced at this TPP volume (0.17 for CNP-F1, 0.17 for CNP-F2, and 0.18 for CNP-F3). The PDI value reflects the size distribution of nanoparticles. Samples consisting of homogeneous and evenly sized particles would give smaller PDI value as an indicator of uniform particle distribution, while a sample having a wider range of particle sizes would give a higher PDI value. Following the addition of 50 μL TPP, particle size and PDI values showed a decreasing trend that was observed up to 250 μL TPP addition.
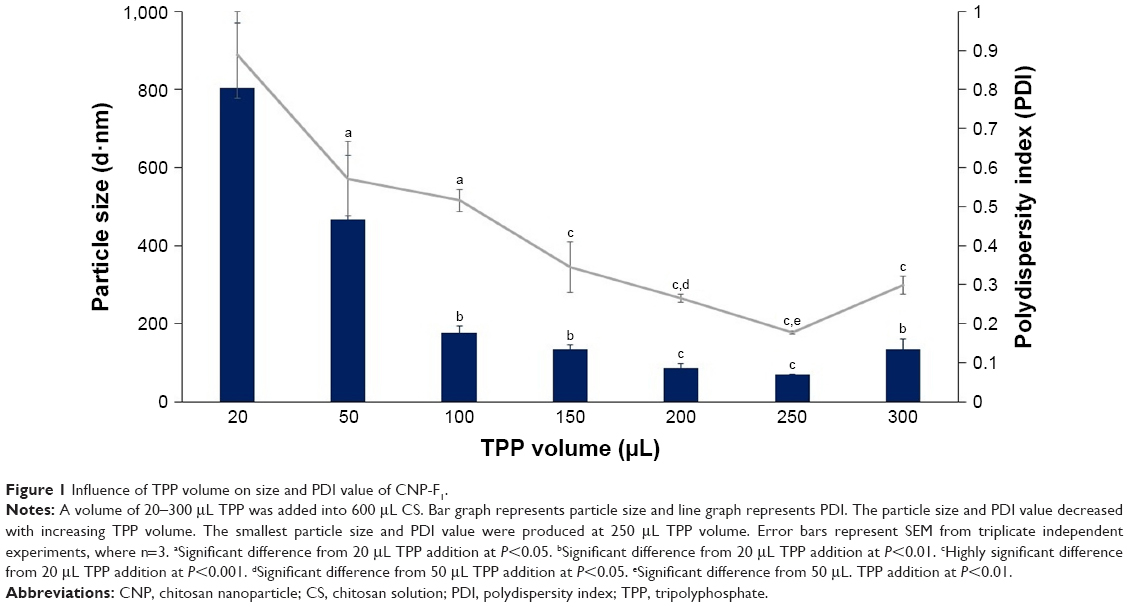 | Figure 1 Influence of TPP volume on size and PDI value of CNP-F1. |
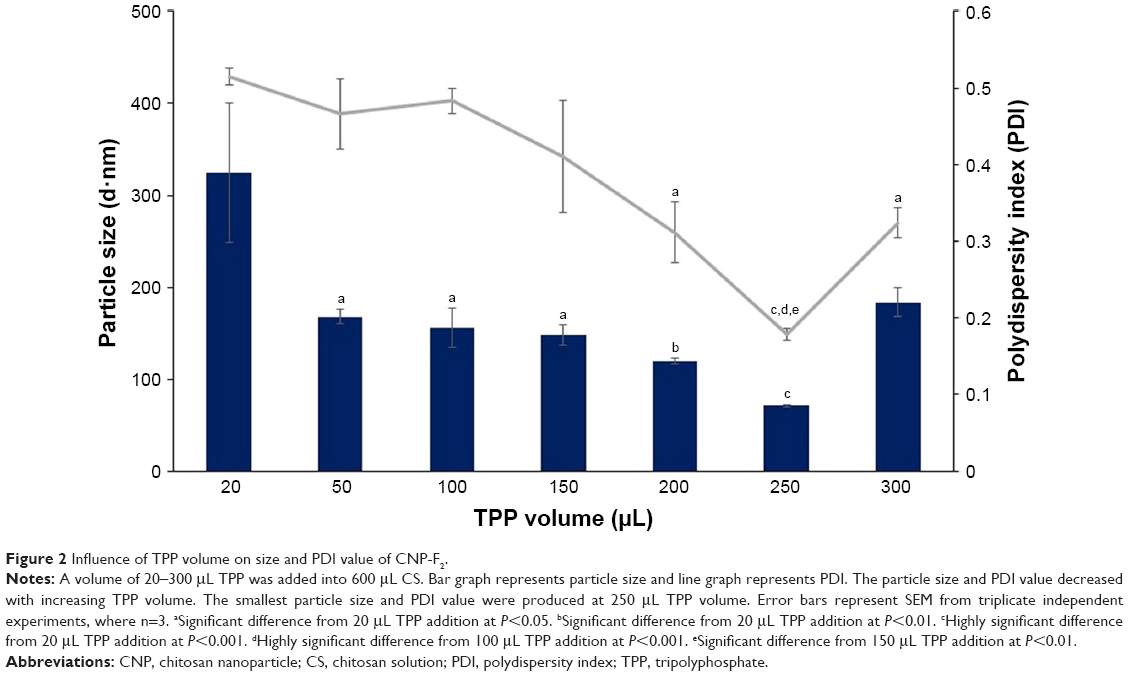 | Figure 2 Influence of TPP volume on size and PDI value of CNP-F2. |
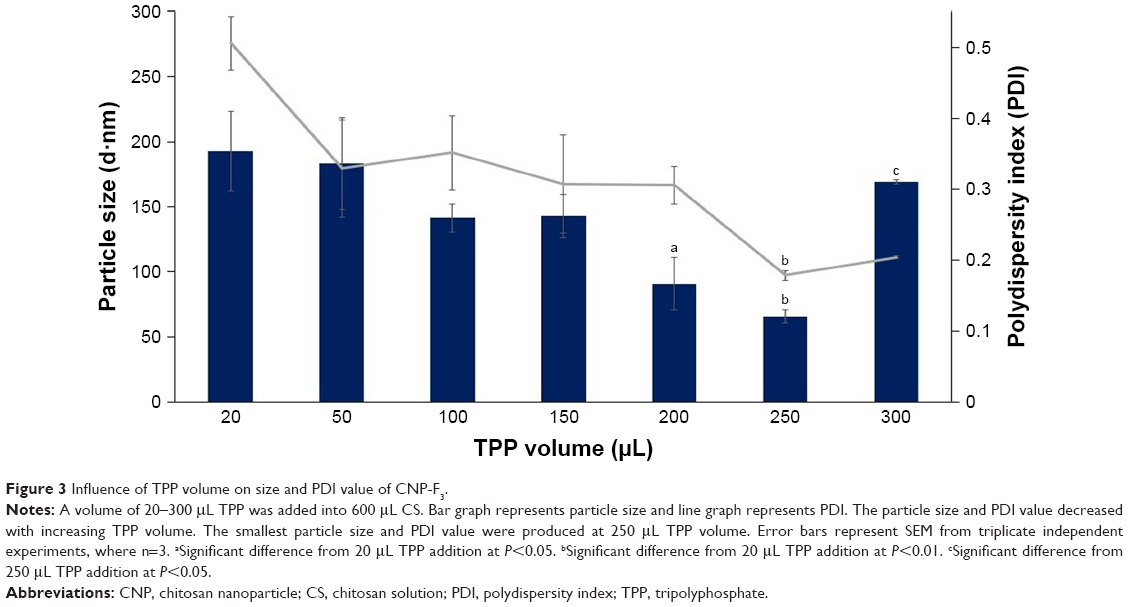 | Figure 3 Influence of TPP volume on size and PDI value of CNP-F3. |
The decrease in particle size and PDI value with TPP volume was consistent with the increased availability of TPP molecules to electrostatically interact with protonated amine groups of CS molecules.17 As more volume of TPP is added into CS, the degree of cross-linking between CS and TPP is increased because more anionic sites of TPP are available to be accessed by CS.20 The increase in intermolecular cross-linking of chitosan and TPP condensed the particles into more compact structure and smaller particle size with uniform distribution.21 Because cross-linking reduces the number of free amine groups on CS, the ionic interaction of TPP molecule with amine groups of already formed CNP is less likely to occur. Consequently, self-aggregation between different nanoparticles is prevented, which is consistent with the nanoparticles being uniformly distributed at addition of higher TPP volume.16 The low PDI value at 250 μL TPP volume for all CNP parameters inferred formation of nanoparticles with uniform and homogeneous distribution in the colloidal system. However, addition of higher TPP volumes (300 μL) caused particle size and PDI value to increase for all CNP formulations.
Several studies on fabrication of chitosan-TPP nanoparticles report that the formation of small-size and monodispersed CNP is governed by pH of both CS solution and TPP solution. In this study, CS at pH 5 was used to form CNP. Chitosan has a pKa of 6.5, which makes it soluble in acidic solvent.22 Below this pH value, the amine group of CS is protonated to give free −NH+3.23 Positively charged amine groups react with negatively charged TPP to form CS–TPP complex by ionic cross-linking.24 In this study, CS at pH 5 was used compared to more acidic or alkaline CS pH. CS at more acidic pH value exhibits extended conformation because of higher degree of amine protonation resulting in increased repulsive force of CS chain.25 Due to this strong electrostatic repulsion, CNPs prepared at more acidic CS pH are merely unstable and tend to form large particle size.26 CS at pH 5 has less extended CS chain because of lower degree of amine protonation. Due to compact CS chain and weakened electrostatic repulsion, the formation of small CNP size is favored at this pH value compared to more extended CS structure.21 Conversely, CS at pH above 6.5 starts to become insoluble, leading to deprotonation of −NH+3 to NH2.27 At this point, fewer −NH+3 are available to be accessed by TPP anion. The weak cross-linking density between −NH+3 and negatively charged TPP results in larger particle size.28
The pH of TPP plays a significant role in the formation of small and evenly sized CNP as well. In this study, TPP at pH 2 was used to cross-link the CS. TPP in aqueous solvent has an initial pH of 9.7 and dissociates to give both hydroxyl ion (OH−) and phosphoric ion.17 At this alkaline pH, TPP becomes more reactive to CS as both OH− and phosphoric ions may compete with each other to cross-link with free NH+3.29 Highly reactive TPP may cause the formation of aggregates and larger particles size. Additionally, the usage of TPP at alkaline pH to form CNP had, in turn, increased the pH of CS-TPP system as well, causing rapid deprotonation of amine groups, which was less favorable for the formation of smaller-sized particles.30 On the contrary, TPP at acidic pH produced only phosphoric ions, PO42−, which are readily available to ionically cross-link with the NH3+ of CS inducing formation of smaller-sized particles. Such an occurrence was also reported in previous studies,21 where larger-sized particles and higher PDI values were noticeable when utilizing TPP at pH 9.5, while those prepared at pH 5.5 produced particles with smaller size and lower PDI value. A separate study reports that the formation of smaller-sized CNP with homogeneous distribution was achieved by using TPP at pH 2.16 Therefore, in the present study, TPP at pH 2 was used to cross-link CS in the formation of CNPs.
However, addition of TPP at pH 2 was suggested to decrease the pH of CNP system, which had in turn increased the conductivity of CNP as a result of higher H+ ion concentrations.29 The increase in H+ ions causes the protonation of more amine groups within CS chain. At higher TPP volumes (>250 μL), this protonation may disrupt the intramolecular linkages between CS and TPP in already-formed CNP,16 which, therefore, caused the particle size to increase at 300 μL TPP addition, which were 133.63±26.88 nm for CNP-F1, 183.83±15.89 nm for CNP-F2, and 169.43±1.72 nm for CNP-F3.
It was noted that the formulation CNP-F3 (Figure 3) produced particles with smaller mean particle size distribution patterns as opposed to the other two CNP formulations: CNP-F1 and CNP-F2 (Figures 1 and 2). CNP-F3 produced particle size <200 nm at 20 μL TPP addition in comparison to CNP-F1 and CNP-F2, which yield much larger particle size, above 300 nm at the same TPP volume. Collectively, it can be inferred that CNP-F3 (0.5 mg/mL CS with 0.7 mg/mL TPP) had the best concentration of CS and TPP for CNP synthesis, whereas 250 μL was the optimum TPP volume needed for synthesis of smallest particles (<100 nm) with lowest PDI value. The synthesis of small-sized particles with uniform distribution was achieved at 250 μL TPP volume regardless the concentration of CS and TPP used. Therefore, it can be deduced that the efficient synthesis of CNPs was predominantly influenced by specific CS:TPP volume ratio.
Encapsulation of GA into CNP
The optimized CNP parameter (CNP-F3 at 250 μL TPP volume) was used to synthesize GA-CNPs. GA was encapsulated within CNP through initial electrostatic interaction between negatively charged GA with positively charged CS. As shown in Figure 4, a general expansion in particle size was recorded in GA-CNP samples synthesized at different molarities of GA. In comparison to CNP-F3, GA-CNP conferred an increase in particle size where the mean particle diameter increased with GA molarity (107.43±3.45 nm for 0.05 M GA, 121.33±2.25 nm for 0.1 M GA, and 184.60±1.11 nm for 0.2 M GA). It was thought that, as a higher concentration of GA was used, there were higher amounts of GA molecules accommodated into CNP causing the particle to further expand in size. However, regardless of the molarity of GA used, this observed expansion in particle size only occurred following the addition of GA, and was, therefore, evident of the successful GA accommodation into CNP where all other parameters used for synthesis of CNP and GA-CNP remained the same. Such an observation was consistent with previous study, where CNP size increased following encapsulation of molecules into the nanoparticle.24,32
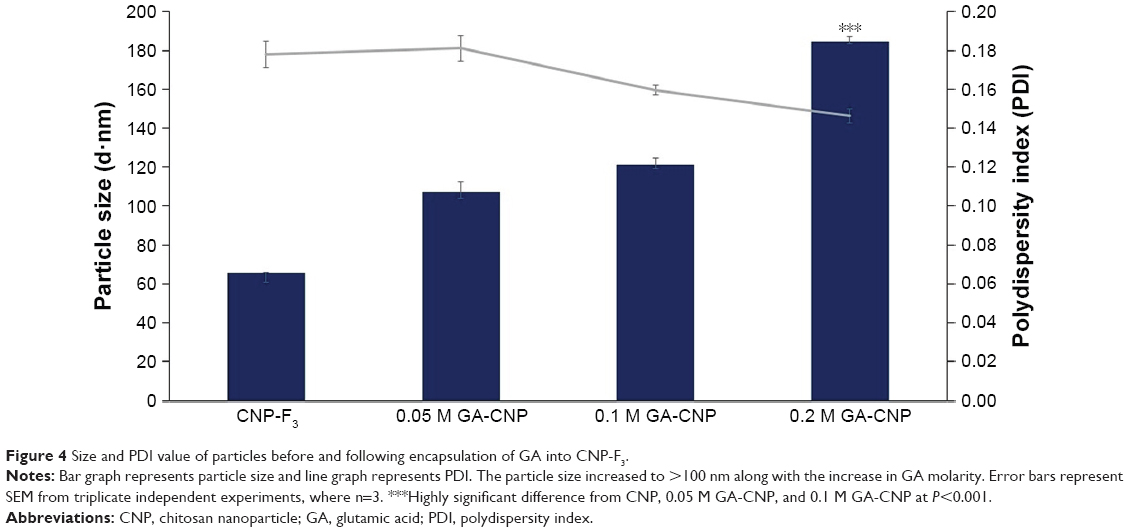 | Figure 4 Size and PDI value of particles before and following encapsulation of GA into CNP-F3. |
Encapsulation efficiency of GA within CNP
The encapsulation efficiency of GA was determined to verify the amount of GA in the CNP core. For this purpose, the TNBS assay was used to quantitatively determine the fraction of free primary amine group in GA. This fraction was subsequently used to determine the loading efficiency of GA by determining the amount of encapsulated GA within CNP. The amount of encapsulated GA in the synthesized GA-CNP was determined by calculating the absorbance difference between the total amounts of GA added during the nanoparticle synthesis against the amount of GA present in the supernatant after centrifugation. The amount of GA present in the supernatant was determined spectrophotometrically by reading the absorbance at 335 nm. Table 2 shows the percentage of encapsulation efficiency (% EE) of different GA concentrations used to synthesize GA-CNP. Approximately 67.49% of 0.05 M GA (0.034 M) was encapsulated into CNP, whereas about 64.15% (0.064 M) and 61.92% (0.124 M) of 0.1 and 0.2 M GA used were entrapped into CNP, respectively. Encapsulation was achieved as GA readily interacts ionically with CS prior to the TPP addition. GA, which is negatively charged, has a high affinity toward positively charged CS in the solution. Electrostatic interaction between these oppositely charged molecules was thought to allow GA to reside in close proximity to CS before CNP formation. The subsequent addition of TPP that cross-link with CS allows the GA to be physically entrapped within the forming CNP. As shown in Table 2, the encapsulation efficiency of GA decreased as the molarity of GA increased. This suggests that the encapsulation efficiency was not necessarily governed by how much GA is used for encapsulation, but by the occurrence of ionic interaction between both moieties. Because encapsulation of GA into CNP was driven by electrostatic interaction between positively charged CS and negatively charged GA, the availability of NH3+ of CS is an important factor that influences the interaction and, therefore, GA encapsulation efficiency. Upon addition of GA into CS, GA electrostatically interacts with NH3+ and assembles itself in close proximity to CS because of attractive forces that existed between these two oppositely charged molecules. Such an occurrence reduces the fraction of free NH3+ available for another incoming GA to interact with. The availability of free NH3+ further decreased with subsequent additions of GA. At this point, only a small fraction of GA can interact with the remaining NH3+. Consequently, addition of more GA did not further increase the encapsulation efficiency but led to a higher amount of free GA and lower encapsulation efficiency. A similar observation was reported in a study where the encapsulation efficiency of 5-fluorouracil (5-FU), a negatively charged chemotherapeutic drug, into CNP decreased as the amount of 5-FU used increased. The % EE reduced from 69.69 to 29.98 as the 5-FU concentration increased from 0.5 to 5.0 mg/mL.24 In this study, similar methods were not done to determine the encapsulation efficiency of fGA. Because the encapsulation process of fGA is thought to be similar with GA, we expect a similar data of encapsulation efficiency for both GA-CNP and fGA-CNP. Therefore, only encapsulation efficiency of GA was determined. The physical encapsulation of GA correlated well in relating to the expansion of particle size as measured by DLS. This observation, thus, inferred the potential of CNP as a drug delivery vehicle on the basis of its capacity to encapsulate GA.
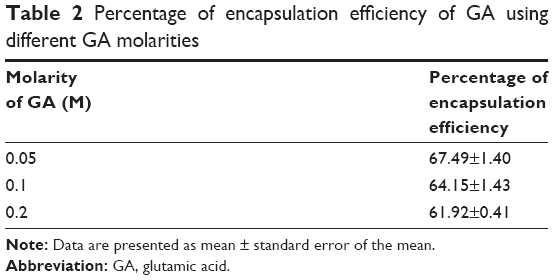 | Table 2 Percentage of encapsulation efficiency of GA using different GA molarities |
Encapsulation of fGA-CNP
To track the release of GA from CNP, GA was tagged with FITC through chemical conjugation of the isothiocyanate group to the N-terminal of GA. Three different GA concentrations (0.05, 0.1, and 0.2 M) were fluorescently labeled with FITC prior to encapsulation into CNP. As shown in Figure 5, the particle size of fGA-CNP was found to increase significantly from CNP for all concentrations of GA used, which were 182.7±23.73 nm for 0.05 M fGA-CNP, 270.40±1.55 nm for 0.1 M fGA-CNP, and 291.90±8.86 nm for 0.2 M fGA-CNP. This increase was a consequence of FITC being successfully tagged to the GA, thus increasing its molecular size. The subsequent accommodation of the labeled amino acid into CNP, therefore, led to the increase in size. Similarly, PDI values also increased to 0.305±0.015 for 0.05 M fGA-CNP, 0.20±0.009 for 0.1 M fGA-CNP, and 0.192±0.017 for 0.2 M fGA-CNP. However, only the PDI value in 0.05 M fGA-CNP showed significant increase from CNP. The significant increase inferred that there was a mixed population of nanoparticles in the colloidal system, where the smaller size corresponded to CNP, whereas the much larger particles corresponded to the presence of fGA-CNP. The increase in both particle size and PDI value was thought to occur as a transition of the fGA-CNP formation from CNP.
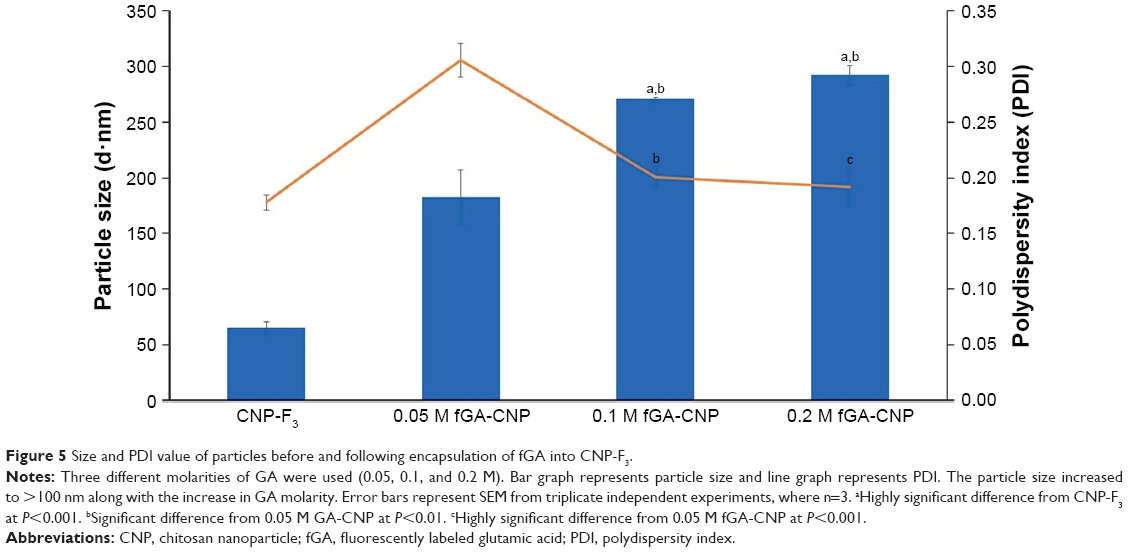 | Figure 5 Size and PDI value of particles before and following encapsulation of fGA into CNP-F3. |
Quantification of free amine groups of CNP by TNBS assay
The proposed mechanism for CNP formation was through ionic cross-linking between protonated amine groups of CS and TPP anion. During this interaction, NH3+ is utilized by phosphate ion of TPP to form CNPs. The reaction of TNBS with primary amines generates a yellow, highly chromogenic product readily measured at 335 nm.31 To verify the role of the amine group in the formation of CNPs, TNBS assay was utilized to quantify free amine groups in the samples. Figure 6 shows a gradual decreasing trend in free amine groups of CS from 50 to 300 μL TPP addition for all CNP parameters. The lowest fraction of free amine groups was obtained after addition of 300 μL TPP volume for all CNP formulations; 85.3% for CNP-F1, 81.1% for CNP-F2, and 76.1% for CNP-F3. These decreasing trends were suggested to occur as an evidence of utilization of amine groups by phosphate ions to form nanoparticles. Addition of more TPP volume was suggested to increase the cross-linking interaction between these two functional groups. The reduction of free amine groups with TPP cross-linking was reported in a previous study where TPP cross-linking not only reduced the crystallinity of the CS-TPP beads but also decreased the amino binding site on CS for metal ions uptakes, thus resulting in a decrease of copper (II) ion, Cu2+ adsorption.33 In a recent study, Masarudin et al16 described the utilization of amine group by TPP during CNP formation reflected by the TNBS assay where a decreasing trend in the fraction of free amine groups was observed following TPP addition. The free amine groups were found to gradually decrease following addition of 20 μL TPP up to 250 μL where the minimum fraction of free amine groups remaining was about 20%–30%.16 Therefore, the evidence of reduced amine groups with TPP cross-linking can be used to suggest the successful formation of CNP in this study.
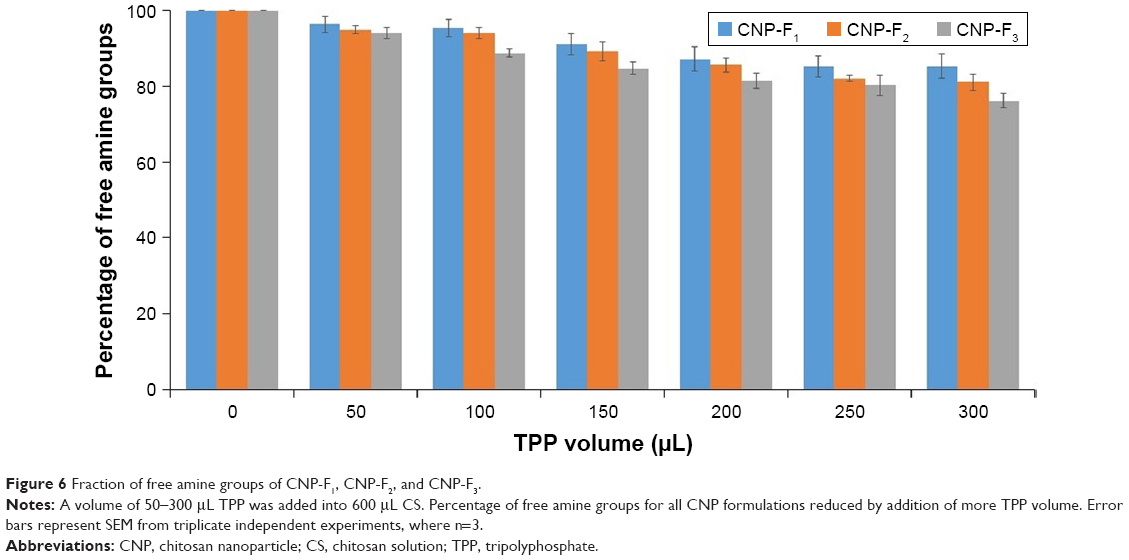 | Figure 6 Fraction of free amine groups of CNP-F1, CNP-F2, and CNP-F3. |
Morphology and size of CNP, GA-CNP, and fGA-CNP
Observations under FESEM
Morphologic analysis of CNPs under FESEM discerned a discrete and spherical shape of particles with diameters under 100 nm as shown in Figure 7. A similar appearance of CNPs was also observed in previous studies.40,41 The different surface characteristics and morphology of CNPs from CS and TPP molecules suggested that the nano-sized CNP system was formed through association between these molecules and constituted a population of spherical particles. The differences in surface characteristics of CNPs from CS and TPP molecules were significant, as smaller-sized CNPs can only be formed through cross-linking between CS and TPP molecules at a specific volume ratio as exhibited by DLS data. The size distribution of CNPs obtained from FESEM corresponds well to data obtained through DLS analysis, in which the mean particle size was in the range of 50–100 nm at the optimum CNP formulation. The particle size expanded above 100 nm following encapsulation of GA. The expansion in particle size reflects the successful incorporation of GA molecule into CNP. The particles existed in spherical shapes and were distributed as single particles without any sign of aggregation, consistent with a previous study.42 Following encapsulation of fGA, the particle size increased to over 100 nm. The system existed as a mixed population of nanoparticles having diameter above 100 nm, which corresponded to CNPs, and the much larger particles (>100 nm) corresponded to the GA-CNP and fGA-CNP. This observation was similar to the data elucidating particle size distribution patterns obtained through DLS analysis and thus reaffirmed our postulation on the successful loading of fGA molecules within CNP.
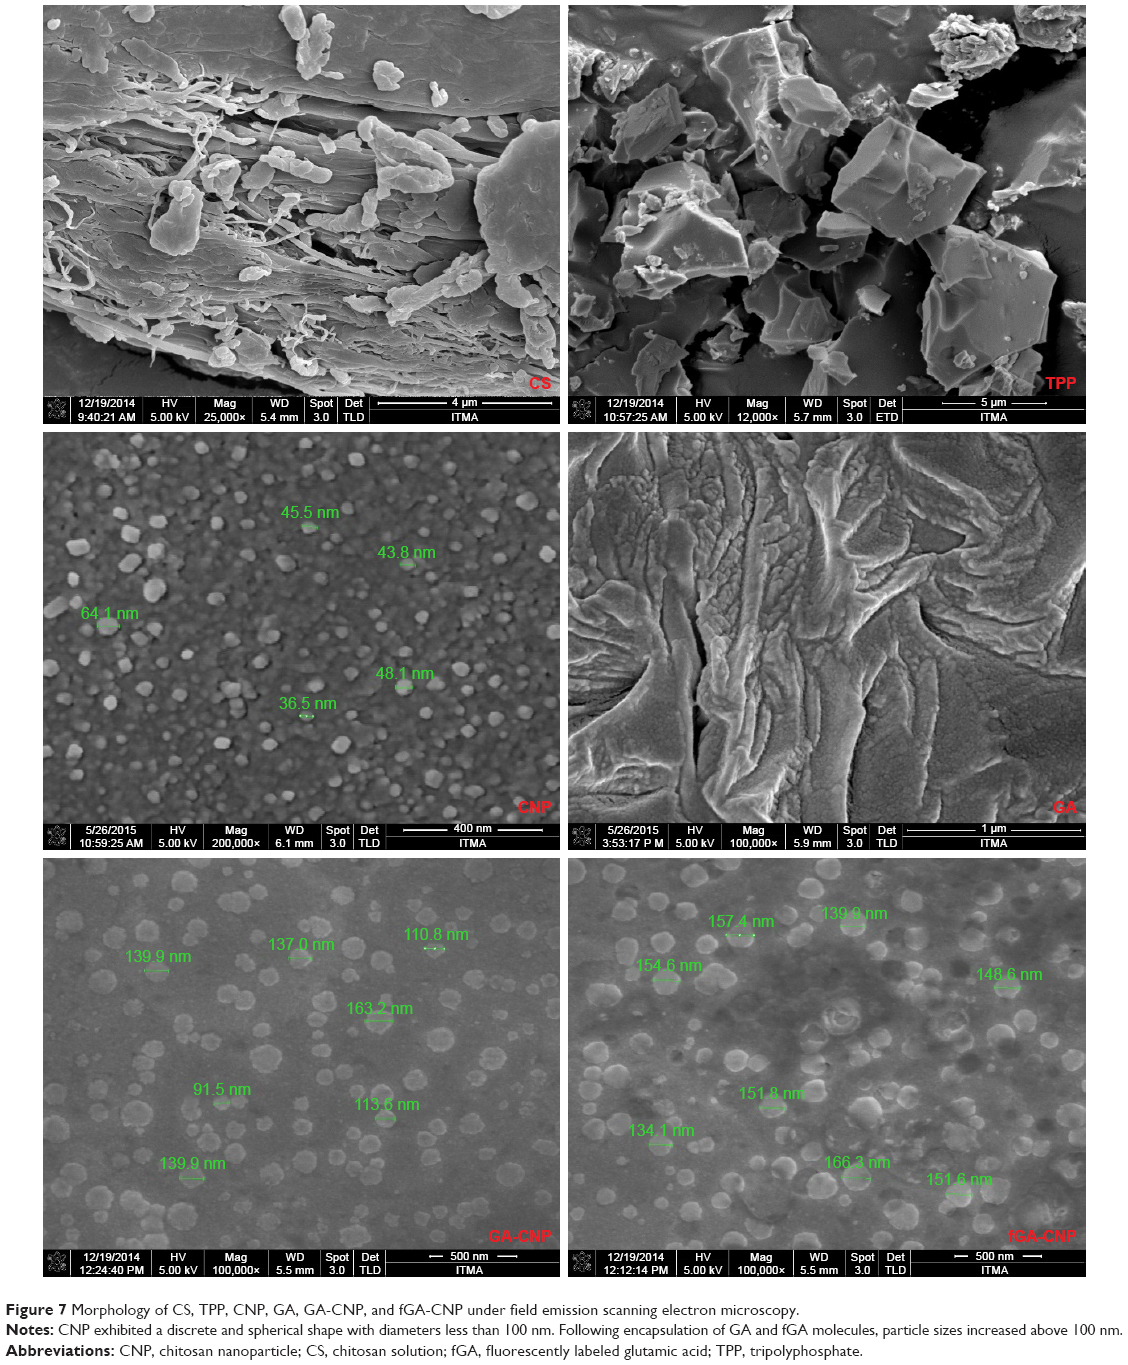 | Figure 7 Morphology of CS, TPP, CNP, GA, GA-CNP, and fGA-CNP under field emission scanning electron microscopy. |
Observations under TEM
TEM analysis revealed a dark and dense internal structure of CNPs, indicating the formation of compact particle structure, as shown in Figure 8. Similar appearances were also reported in previous studies.19,43,44 Before GA and fGA encapsulation, the particle sizes were about 30–50 nm in diameter and were uniformly distributed as spherical-shape particles without any sign of aggregation. The CNP size obtained from TEM was slightly smaller than the size obtained from DLS analysis and FESEM. A similar observation was reported where CNP viewed under TEM was found to be distinct and spherical in shape and smaller in size than those measured by DLS. This could be attributed to the dehydration of the nanoparticles during sample preparation for TEM imaging. Additionally, DLS measures the hydrodynamic layers that form around particles in colloidal system, leading to the overestimation of particle size.43,45–47 The incorporation of GA and fGA molecules let the particle expand further. The particles exhibited dense and dark structure as a result of the GA and fGA molecules being compactly fitted within the particles. These observations reinforce our postulation from previous DLS and FESEM analyses that the CNP system has successfully formed and the encapsulation of fGA into CNP has occurred. Similar observations were reported in previous studies where the encapsulation of drugs into CNP led to the expansion in particle size.43,47
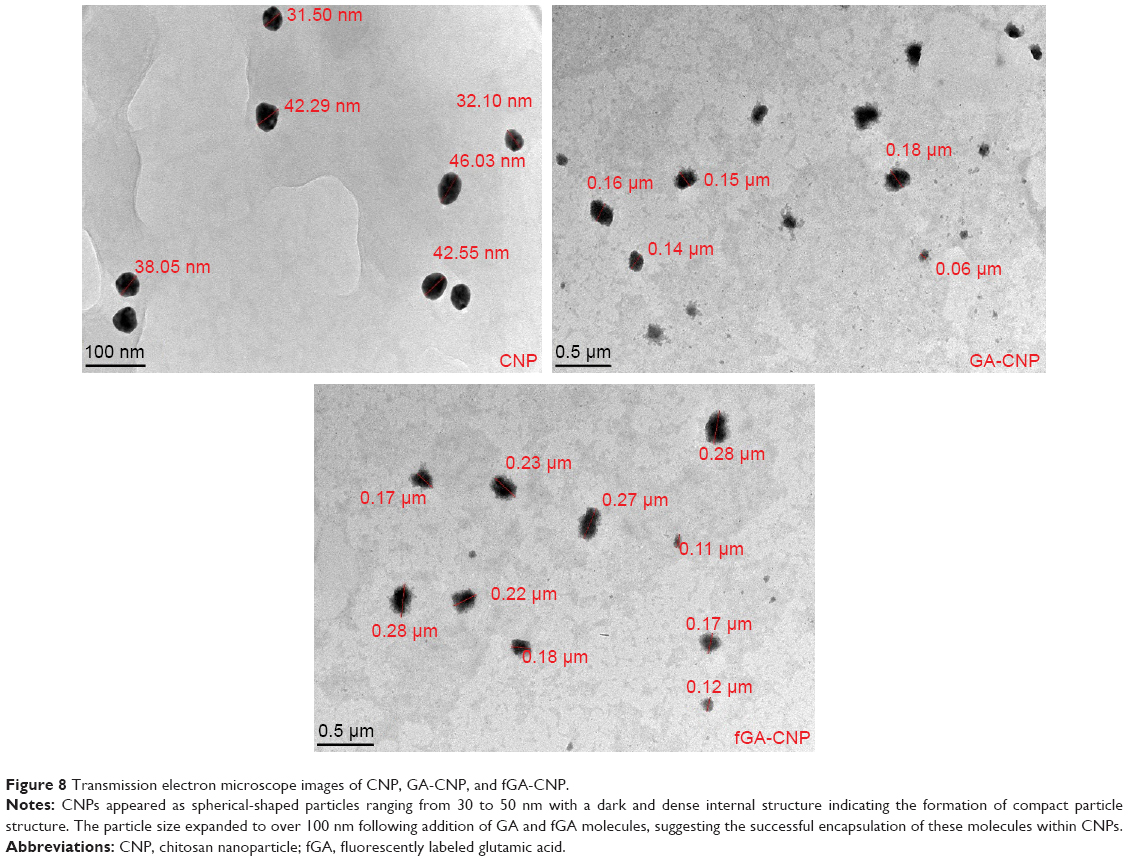 | Figure 8 Transmission electron microscope images of CNP, GA-CNP, and fGA-CNP. |
FTIR analysis of CNPs
FTIR is used to determine the presence of a variety of functional groups in a molecule or compound, and thus, can be used to deduce successful formation of the nanoparticle samples in this study. Figure 9A shows distinctive characteristic peaks for CS, TPP, and CNP. A broad peak at 3,353 cm−1 was identified in pure CS, corresponding to −NH stretching of NH2 group.34 In CNP, this peak was present at 3,334 cm−1 as a broad peak in regions between 3,300 and 3,400 cm−1 because of the overlapping of OH− ions stretching peak at the same region and due to the hydrogen bonding interaction.35 A sharp peak at 1,641 cm−1 was attributed to NH vibration in NH3+ ions36 and this peak was found at a similar region around 1,634 cm−1 in CNP. Meanwhile, the peak at 887 cm−1 attributed to P-O-P stretching was detected in pure TPP. This peak was found in cross-linked CNP as well at 896 cm−1 but at a lower intensity in comparison to pure TPP. Similar observations were also reported in previous studies.30,37 This confirmed the involvement of P-O-P groups in the formation of CNPs. As the nanoparticle formed, there was a less amount of free P-O-P groups that remained unreacted, which subsequently showed as a lower-intensity peak compared to pure TPP. Notably, the functional groups found in CS were not detectable in TPP and vice versa but CNPs displayed characteristic peaks of both CS and TPP. Thus, it can be inferred that formation of CNPs, a hybrid of CS and TPP molecules, has occurred.
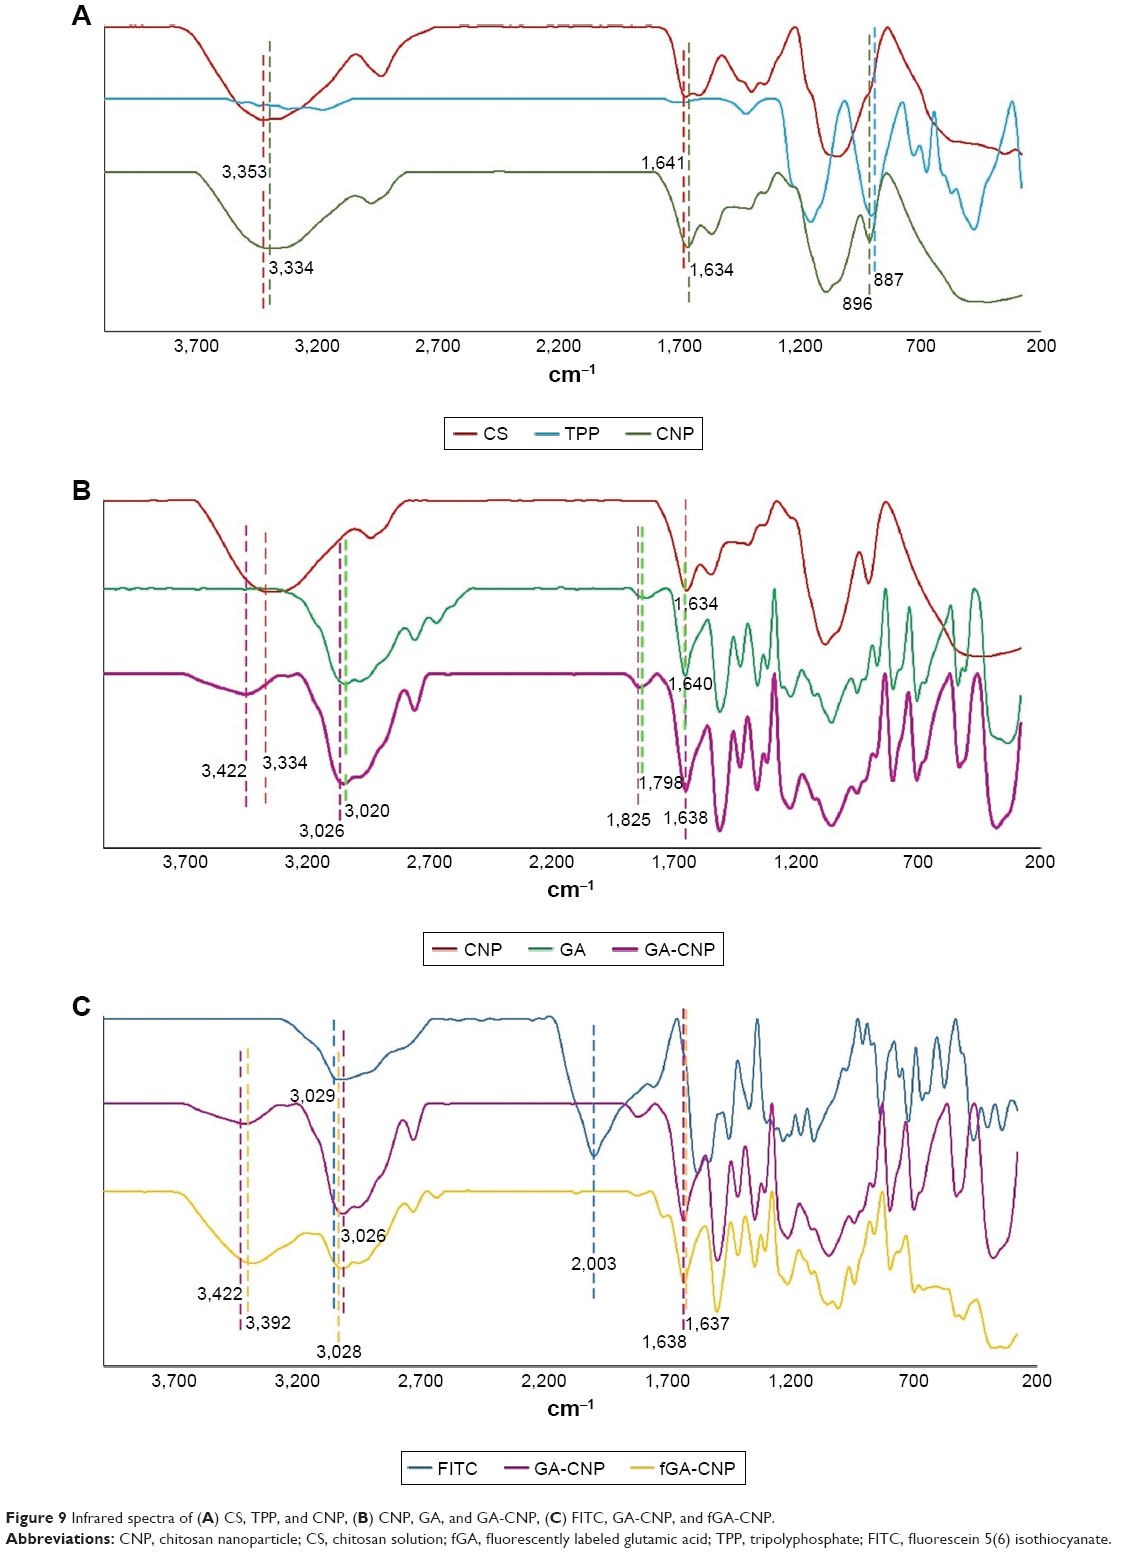 | Figure 9 Infrared spectra of (A) CS, TPP, and CNP, (B) CNP, GA, and GA-CNP, (C) FITC, GA-CNP, and fGA-CNP. |
The spectra patterns of GA and GA-CNP are shown in Figure 9B. There were few peaks of GA and CNP that existed in GA-CNP that can be used to show the occurrence of GA loading into CNP. The peaks at 1,640 and 3,020 cm−1 belong to NH bending of NH2 group and OH− ions of pure GA,38 while the peak of NH vibration in NH3+ of CNP was found at a similar region that was at 1,634 cm−1. Following GA encapsulation, the OH− ions peak was subsequently observed at 3,026 cm−1, whereas the peaks of both NH vibration in NH3+ and NH bending of NH2 group overlapped at 1,638 cm−1. The peak at 1,798 cm−1 was assigned to C=O stretching of GA39 and this peak shifted to 1,826.42 cm−1 in GA-CNP, indicating the suggested presence of GA in GA-CNP samples.
The sharp peak observed at 2,003 cm−1 denotes the strong absorption intensity of the freely moving and nonbonded isothiocyanate (NCS) group in pure FITC38 (Figure 9C). This peak disappeared following encapsulation of fGA into CNP. The loss of this peak in fGA-CNP was due to the NCS group being chemically bonded to GA to let the labeling reaction occur. At this point, the fGA became chemically inert and lost its ability to absorb energy and vibrate. Hence, there were no detectable peaks at the similar region around 2,000 cm−1 following encapsulation of fGA. The peak at 3,422 cm−1 belongs to NH stretching of NH2 group in CNP, whereas the peak at 1,638 cm−1 corresponds to NH bending of NH2 group of GA. The appearance of the similar peaks, at 3,392 and 1,637 cm−1, respectively, in fGA-CNP might suggest the successful loading of fGA into CNP.
In vitro cytotoxicity evaluation of CNP
For any nanoparticles to be an ideal drug delivery carrier, it is critical that their efficacy be evaluated for safe transport of various drugs and biomolecules in vivo and illicit low toxicity. Therefore, an evaluation on the potential toxic effects of these nanoparticles is required, given that the mechanisms through which nanoparticles may induce their toxic effects remain obscure. In this study, the potential cytotoxicity of CNP-F3 formulation as a delivery carrier for GA was evaluated using MTT assay. In this study, MTT assay was performed on 786-O human kidney cancer cell line to evaluate the toxicity of CNP. Figure 10 illustrates the percentage of cell viability following 24 hours of treatment of 786-O cells with CNP-F3 formulation. At the maximum treatment dosage of 0.5 mg/mL, CNP induced approximately 30% cell death. The low cytotoxicity properties of CNPs have been previously described in the current literature. A previous study reports that about 90% of A549 cells remained viable following 24 hours of treatment with 0.1 mg/mL PEGylated oligochitosan and PEGylated chitosan nanocomplexes.10 Separately, Richardson et al48 described that regardless of the different low molecular weights of CS used, CS was found to be nontoxic against L132 human embryonic lung cells and CCRF-CEM human lymphoblastic leukemia cells up to a concentration of 0.5 mg/mL where the percentage of viable cells was more than 80 and 70 for CCRF-CEM cells and L132 cells, respectively. As the CS concentration increased up to 1 mg/mL, the percentage of viable CCRF-CEM cells remained at 70, whereas the cell viability of L132 cells was slightly reduced to about 60.48 CNPs are generally reported as nontoxic to normal cells as well.49,50 On the basis of cell viability and ample evidence on low toxicity profile of CS from previously reported studies,16,49,50 the CNP formulation (CNP-F3) used in this study was found to be of low toxicity to the cells. This observation then inferred the feasibility and suitability of CNP as a candidate for drug delivery vehicle.
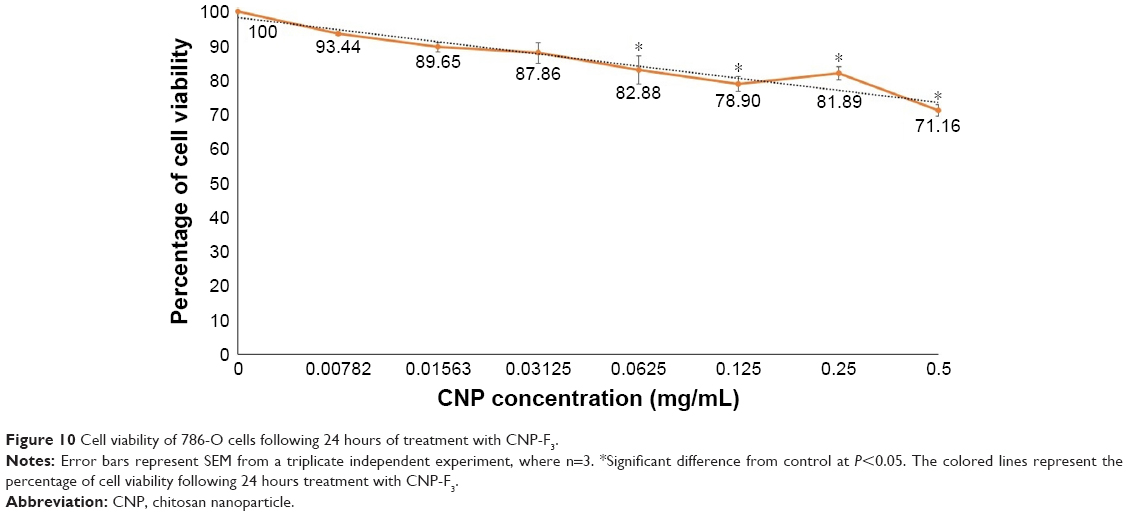 | Figure 10 Cell viability of 786-O cells following 24 hours of treatment with CNP-F3. |
Visualization of in vitro release and accumulation of FITC-GA from CNP using fluorescence microscopy
The release profile and accumulation of fGA as the encapsulated cargo model was visualized at four specific time intervals: 30 minutes, 6 hours, 24 hours, and 48 hours using fluorescence microscopy. Figure 11 shows the release and accumulation of fGA from CNP at different time points under fluorescence microscopy. No green fluorescence was observed in nontreated (control) and CNP-treated cells, indicating that no inherent autofluorescence was exhibited by the cells. The absence of fluorescence in FITC-treated cells after 24 hours indicated the incapacity of FITC to permeate into the cell without the aid of a delivery vector, similarly observed in a previous report.51 Interestingly, the presence of green fluorescence was only observed when cells were treated using fGA-CNP samples. It was observed that at 30 minutes posttreatment with fGA-CNP, intracellular fluorescence was barely detected. However, a stronger fluorescence was observed 6 hours posttreatment and this signal was observed to gradually increase 24 hours posttreatment with fGA-CNP. At 48 hours, the reduction in intracellular FITC signal was observed. Such occurrence is most likely because of a few reasons such as fast rates of FITC photobleaching upon exposure to excitation light and quenching of the FITC fluorescence under slightly acidic conditions.52 The absence of fluorescence after 24-hour treatment with fGA suggested that the physical encapsulation of GA within the CNP is a prerequisite for efficient accumulation and localization into cells, further showing the advantageous properties of CNP as a potent delivery vector. Because the green fluorescence was detectable inside the cells, it can be deduced that the observed fluorescence was caused by the release of the GA that was being tagged with FITC after taking into consideration that FITC and fGA were not able to permeate into the cells.
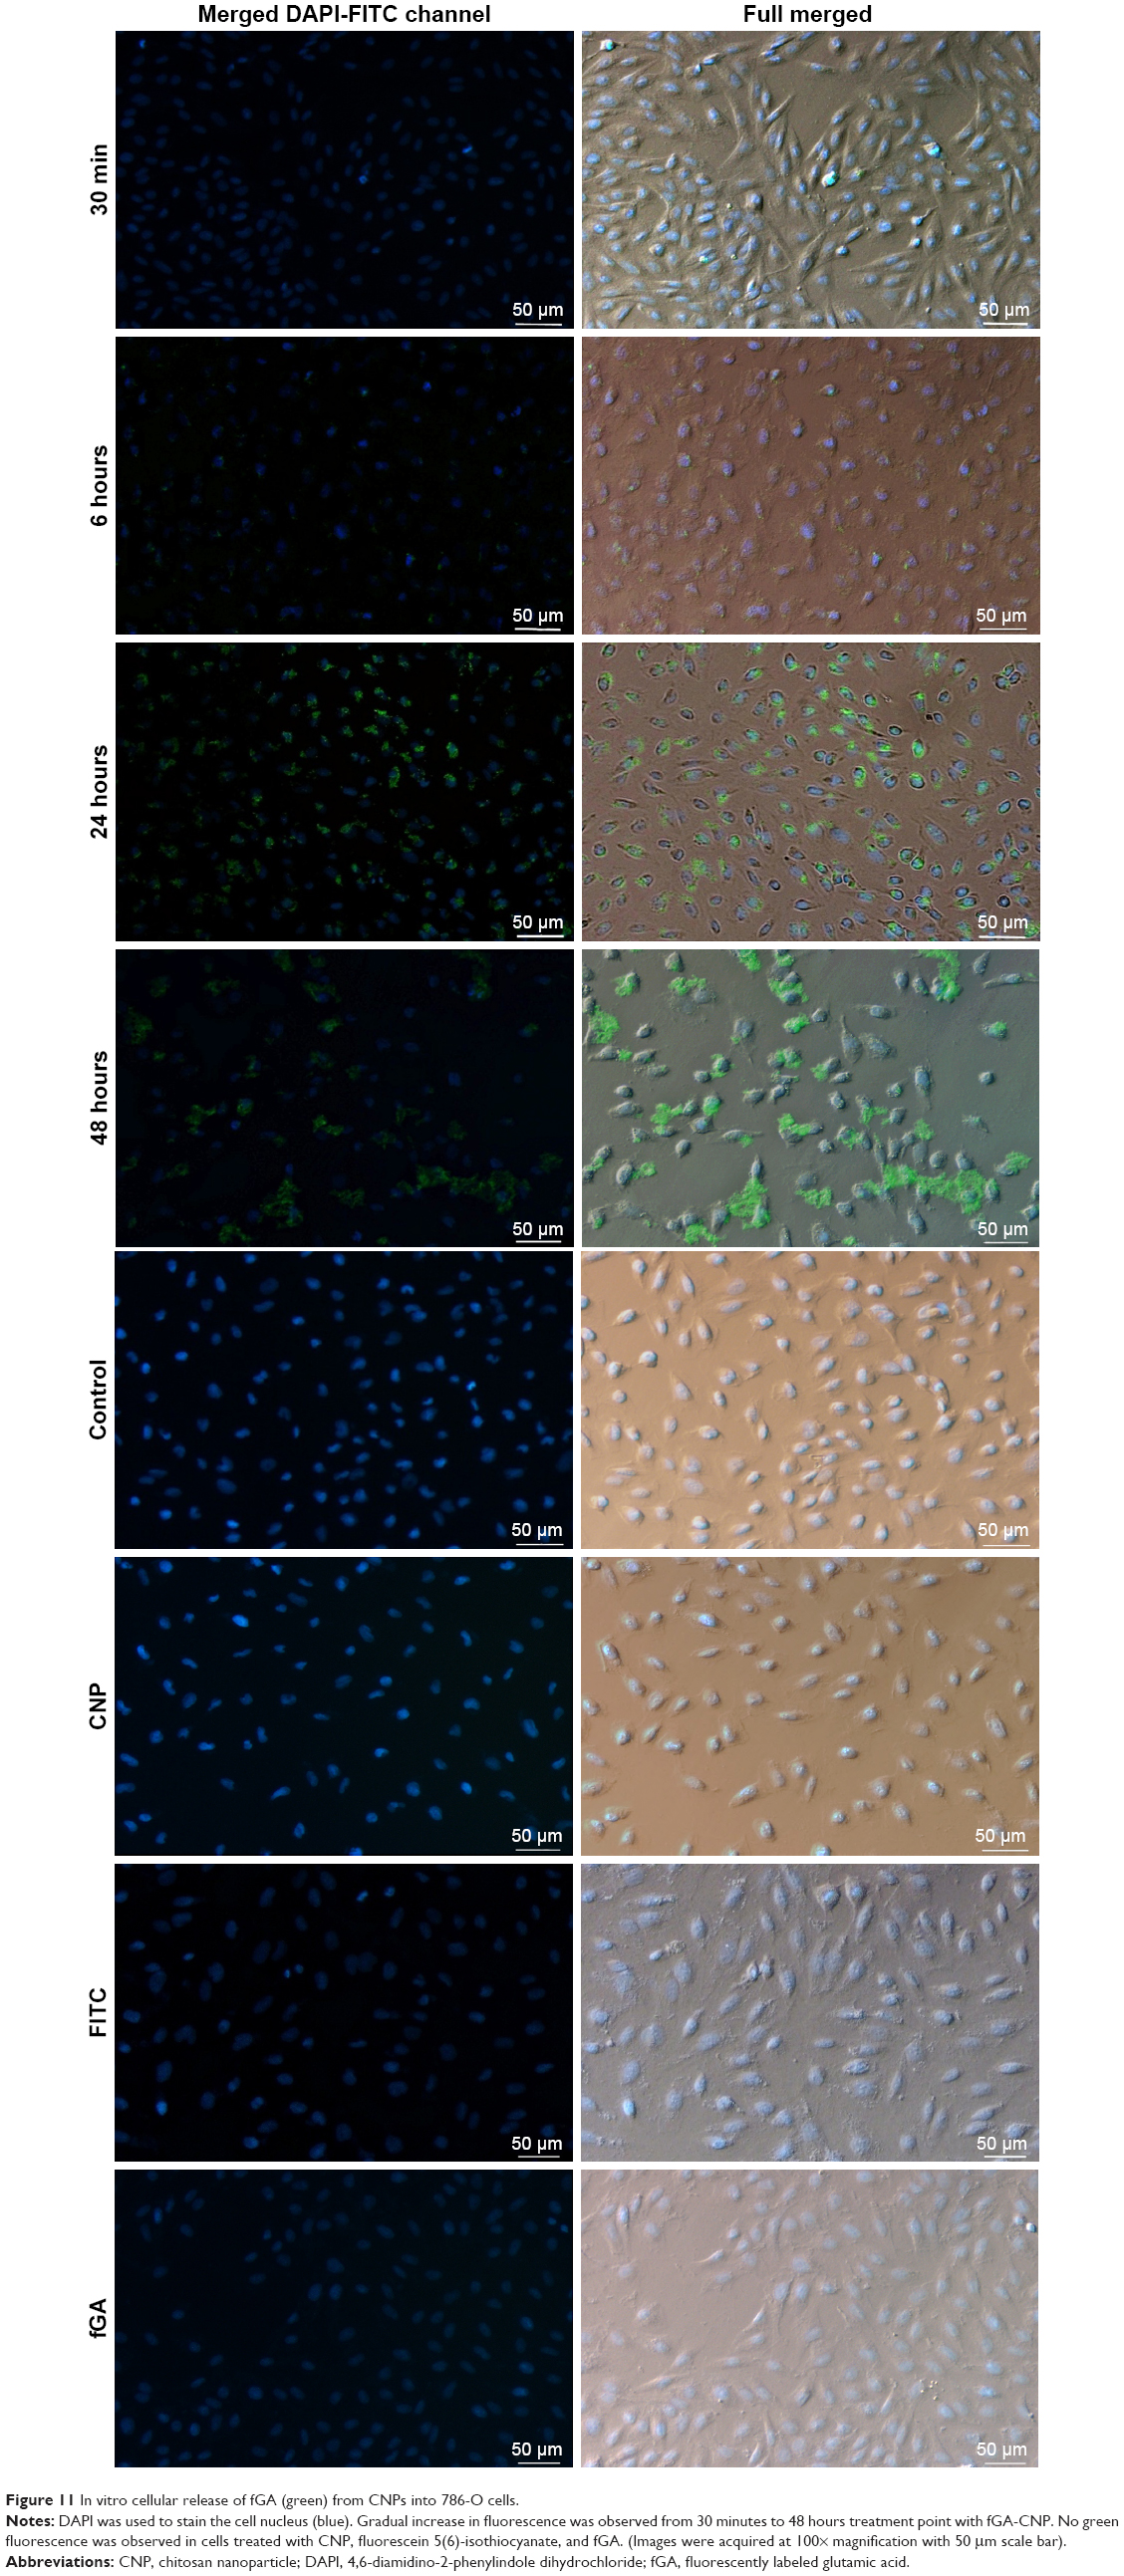 | Figure 11 In vitro cellular release of fGA (green) from CNPs into 786-O cells. |
A recent study by Masarudin et al16 demonstrated that cellular internalization of FITC-tagged CNP may occur as early as 30 minutes posttreatment. Therefore, it can be suggested that the cellular internalization of fGA-CNP had occurred prior to the release of fGA. At 6 hours posttreatment, the fGA was found to be released into the cellular membrane and the cytoplasm. A significant accumulation of fGA was observed 24 hours later. Drug release from CS-based nanoparticles is influenced by a few factors, mainly cross-linking density, pH, and enzymatic reactions taking place in the physiologic environment.53 In this study, we postulate that the release of fGA from CNP was through surface degradation of the nanoparticles based on sequential data obtained from the fluorescence microscopy (Figure S1). The fGA-CNP was thought to be internalized through nonspecific electrostatic interactions with the negatively charged cell membrane.51,54 Following cellular internalization, the fGA-CNP-enclosed vesicles were transited from early endosomes to late endosomes before finally fusing with the lysosome. As the fGA-CNPs are shuttled from endosome to lysosome, they experienced a drop in pH gradient, from a neutral (pH 7.4) to acidic pH (pH 4.5–5).34,55–57 This acidic environment was suggested to cause surface degradation of the CNP polymer. Additionally, the cleavage of β-1,4 glycosidic linkages between N-acetyl-D-glucosamine of CS monomers by glycoside hydrolase enzyme within lysosome initiated the degradation of CNP.58,59 As time progressed from 6 to 48 hours, the gradual and constant degradation resulted in a mass loss of CNP polymer, therefore inducing more GA release. This proposed mechanism of GA release may explain the occurrence of stronger fluorescence observed at 24 hours. The accumulation of CNP degradation products was thought to increase the osmolarity of lysosome, causing an ingress of water molecules, thus resulting in rupture of the lysosome membrane and subsequent release of their content into cytosol.60 The gradual increase in the green fluorescence from 30 minutes to 48 hours implies the time-dependent release and controlled accumulation of GA over time. These observations thus delineate the capacity of CNP to deliver the entrapped GA into cells prior to their intracellular release and controlled accumulation.
Detection of fluorescence signal of fGA through flow cytometry analysis
In this study, flow cytometry analysis was conducted to quantitatively analyze the presence of fluorescence signals from fGA released intracellularly, and to subsequently verify data on intracellular GA accumulation obtained from fluorescence microscopic analysis. Figure 12 shows the fluorescence signal profile of cells at different treatment time points. This histogram plots an FITC signal against the number of positive events (cells showed positive FITC signal) detected. Approximately 0.05% of the nontreated cells expressed a positive FITC signal, a negligible fluorescence signal most likely due to the presence of autofluorescing organelles or intracellular proteins. It was observed that the number of cells that showed positive FITC signal at 30 minutes posttreatment did not significantly differ from the control. This data corresponded well with the observations under fluorescence microscopy, where no fluorescence was detectable at this treatment time point. Following 6 hours of incubation period, 28.82% of the total cell population showed an occurrence of positive FITC signal. The number of positively expressed FITC signal cells increased up to 80.41% and 99.97% post 24 hours and 48 hours treatment points. Interestingly, the cells treated with CNP and FITC showed negative FITC signal, which was in accordance with the observations under fluorescence microscopy. Meanwhile, about 4.71% of the total cell count produced positive FITC signal following 24 hours of treatment with fGA. It can be suggested that fGA can still readily enter the cells by itself. However, the fluorescence signal was much weaker compared to that produced by the cells treated with fGA-CNP at the same 24-hour treatment. This observation implies that the efficient intracellular delivery and accumulation of GA was achieved through encapsulation of this molecule into CNP as a delivery vector.
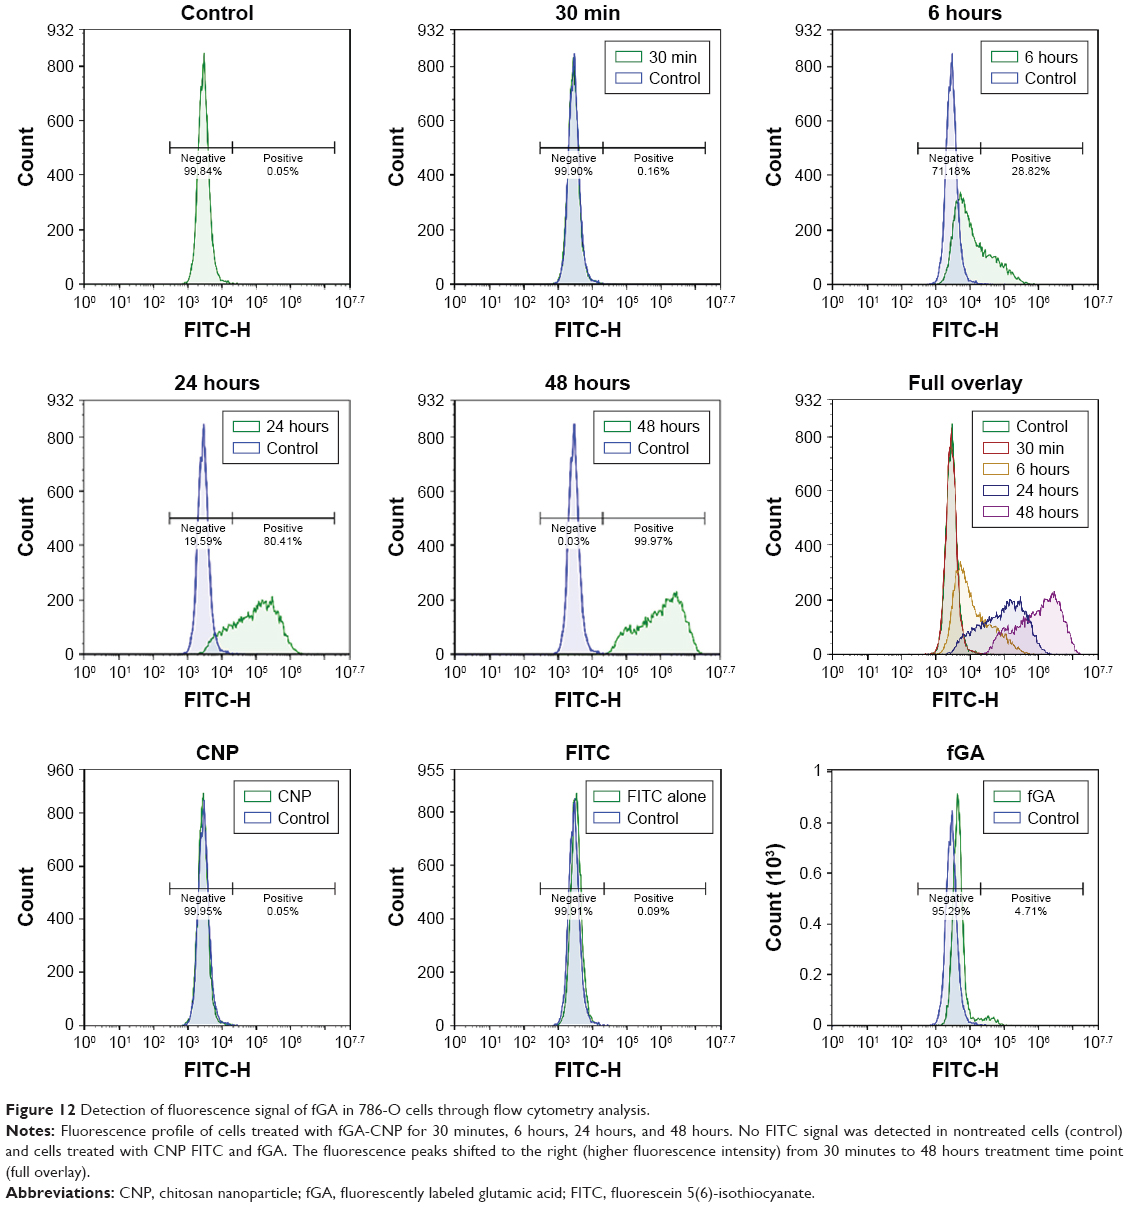 | Figure 12 Detection of fluorescence signal of fGA in 786-O cells through flow cytometry analysis. |
The number of positively expressed FITC signal cells at 6–48 hours of treatment appeared to be much higher compared to those observed under fluorescence microscopy mostly likely because of the higher sensitivity of flow cytometry in detecting fluorescence signal compared to the fluorescence microscope. However, it is noteworthy to mention that regardless the major number of cells showing positive FITC signal at every time point, there was a gradual increase in fluorescence intensity from 30 minutes to 48 hours post transfection. The shift to higher fluorescence signal (full overlay) at later time points was a result of GA being efficiently accumulated from CNP into cellular compartment over prolonged incubation period. The increase in fluorescence signal was consistent with the observations through fluorescence microscope. These observations, thus, reaffirm our postulation on the potential of CNP as a delivery vector capable of enhancing the intracellular delivery of GA and controlling their accumulation over a prolonged period of time.
Conclusion
Small and monodispersed CNP at a diameter <100 nm were successfully formed through simple ionic gelation route. The accommodation of GA into CNP core increased the particle sizes to >100 nm, which was confirmed by DLS and electron microscopy analysis. The formation of CNP and GA loading were verified through TNBS assay and FTIR analysis. CNP synthesized at 0.5 mg/mL CS was found to be nontoxic to the 786-O cells, suggesting the feasibility of this system as a drug delivery carrier. fGA was released from CNP and accumulated into cells as early as 6 hours posttreatment. The efficient accumulation of fGA was observed 24 and 48 hours later. As time went by, the green fluorescence increased from 30 minutes time point to 48 hours posttreatment, suggesting that the intracellular release and controlled accumulation of fGA were successfully achieved through the encapsulation of GA into this CNP system. In future, formulation of these CNP with conjugation of specific targeting ligand would be advantageous for in vivo selective delivery of drugs, proteins, or macromolecules.
Acknowledgments
UAH would like to thank the Ministry of Education, Malaysia, for the myBrain15 scholarship and Universiti Putra Malaysia for provisions of a Graduate Research Fellowship. MJM would like to acknowledge Universiti Putra Malaysia for research funding under the Inisiatif Putra Muda (IPM) scheme.
Disclosure
The authors report no conflicts of interest in this work.
References
Farokhzad OC, Langer R. Impact of nanotechnology on drug delivery. ACS Nano. 2009;3(1):16–20. | ||
Allen TM, Cullis PR. Drug delivery systems: entering the mainstream. Science. 2004;303(5665):1818–1822. | ||
Aungst BJ, Saitoh H, Burcham DL, Huang SM, Mousa SA, Hussain MA. Enhancement of the intestinal absorption of peptides and nonpeptides. J Control Release. 1996;41(1–2):19–31. | ||
de Jong WH, Borm PJ. Drug delivery and nanoparticles: applications and hazards. Int J Nanomed. 2008;3(2):133. | ||
Wang S, Zhao J, Yang H, et al. Bottom-up synthesis of WS22 nanosheets with synchronous surface modification for imaging guided tumor regression. Acta Biomater. 2017;58:442–454. | ||
Mahapatro A, Singh DK. Biodegradable nanoparticles are excellent vehicle for site directed in-vivo delivery of drugs and vaccines. J Nanobiotechnol. 2011;9:55–65. | ||
Xu T, Zhang N, Nichols HL, Shi D, Wen X. Modification of nanostructured materials for biomedical applications. Mater Sci Eng C. 2007;27(3):579–594. | ||
Artursson P, Lindmark T, Davis SS, Illum L. Effect of chitosan on the permeability of monolayers of intestinal epithelial cells (Caco-2). Pharm Res. 1994;11(9):1358–1361. | ||
Pan Y, Li YJ, Zhao HY, et al. Bioadhesive polysaccharide in protein delivery system: chitosan nanoparticles improve the intestinal absorption of insulin in vivo. Int J Pharm. 2002;249(1–2):139–147. | ||
Guzman-Villanueva D, El-Sherbiny IM, Vlassov AV, Herrera-Ruiz D, Smyth HD. Enhanced cellular uptake and gene silencing activity of siRNA molecules mediated by chitosan-derivative nanocomplexes. Int J Pharm. 2014;473(1–2):579–590. | ||
Plummer EM, Manchester M. Endocytic uptake pathways utilized by CPMV nanoparticles. Mol Pharm. 2013;10(1):26–32. | ||
Jia X, Chen X, Xu Y, Han X, Xu Z. Tracing transport of chitosan nanoparticles and molecules in Caco-2 cells by fluorescent labeling. Carbohydr Polym. 2009;78(2):323–329. | ||
Mao S, Germershaus O, Fischer D, Linn T, Schnepf R, Kissel T. Uptake and transport of PEG-graft-trimethyl-chitosan copolymer-insulin nanocomplexes by epithelial cells. Pharm Res. 2005;22(12):2058–2068. | ||
Ma Z, Lim TM, Lim LY. Pharmacological activity of peroral chitosan-insulin nanoparticles in diabetic rats. Int J Pharm. 2005;293(1–2):271–280. | ||
Hwang HY, Kim IS, Kwon IC, Kim YH. Tumor targetability and antitumor effect of docetaxel-loaded hydrophobically modified glycol chitosan nanoparticles. J Control Release. 2008;128(1):23–31. | ||
Masarudin MJ, Cutts SM, Evison BJ, Phillips DR, Pigram PJ. Factors determining the stability, size distribution, and cellular accumulation of small, monodisperse chitosan nanoparticles as candidate vectors for anticancer drug delivery: application to the passive encapsulation of [14C]-doxorubicin. Nanotechnol Sci Appl. 2015;8:67–80. | ||
Ravikumara NR, Madhusudhan B. Chitosan nanoparticles for tamoxifen delivery and cytotoxicity to MCF-7 and Vero cells. Pure Appl Chem. 2011;83(11):2027–2040. | ||
Nasti A, Zaki NM, de Leonardis P, et al. Chitosan/TPP and chitosan/TPP-hyaluronic acid nanoparticles: systematic optimisation of the preparative process and preliminary biological evaluation. Pharm Res. 2009;26(8):1918–1930. | ||
Xing Z, Gao S, Duan Y, et al. Delivery of DNAzyme targeting aurora kinase A to inhibit the proliferation and migration of human prostate cancer. Int J Nanomed. 2015;10:5715–5727. | ||
Fan W, Yan W, Xu Z, Ni H. Formation mechanism of monodisperse, low molecular weight chitosan nanoparticles by ionic gelation technique. Colloids Surf B Biointerfaces. 2012;90:21–27. | ||
Mattu C, Li R, Ciardelli G. Chitosan nanoparticles as therapeutic protein nanocarriers: The effect of pH on particle formation and encapsulation efficiency. Polym Compos. 2013;34(9):1538–1545. | ||
Bhumkar DR, Pokharkar VB. Studies on effect of pH on cross-linking of chitosan with sodium tripolyphosphate: A technical note. AAPS Pharm Sci Tech. 2006;7(2):E138–E143. | ||
Fini A, Orienti I. The role of chitosan in drug delivery. Am J Drug Deliv. 2003;1(1):43–59. | ||
Aydin R, Pulat M. 5-Fluorouracil encapsulated chitosan nanoparticles for pH-stimulated drug delivery: evaluation of controlled release kinetics. J Nanomater. 2012;2012:42–51. | ||
Wang X, Zheng C, Wu Z, et al. Chitosan-NAC nanoparticles as a vehicle for nasal absorption enhancement of insulin. J Biomed Mater Res B Appl Biomater. 2009;88(1):150–161. | ||
Goldberg M, Manzi A, Aydin E, et al. Development of a nanoparticle-embedded chitosan sponge for topical and local administration of chemotherapeutic agents. J Nanotechnol Eng Med. 2014;5(4):040905. | ||
Kaloti M, Bohidar HB. Kinetics of coacervation transition versus nanoparticle formation in chitosan-sodium tripolyphosphate solutions. Colloids Surf B Biointerfaces. 2010;81(1):165–173. | ||
Mattu C, Li R, Ciardelli G. Chitosan nanoparticles as therapeutic protein nanocarriers: the effect of pH on particle formation and encapsulation efficiency. Polym Compos. 2013;34(9):1538–1545. | ||
Bhumkar DR, Pokharkar VB. Studies on effect of pH on cross-linking of chitosan with sodium tripolyphosphate: a technical note. AAPS Pharm Sci Tech. 2006;7(2):E138–E143. | ||
Fl M, Shyu SS, Lee ST, Wong TB. Kinetic study of chitosan-tripolyphosphate complex reaction and acid-resistive properties of the chitosan-tripolyphosphate gel beads prepared by in-liquid curing method. J Polym Sci B Polym Phys. 1999;37:1551–1564. | ||
Sashidhar RB, Capoor AK, Ramana D. Quantitation of Σ-amino group using amino acids as reference standards by trinitrobenzene sulfonic acid. J Immunol Meth. 1994;167(1–2):121–127. | ||
Kuen CY, Fakurazi S, Othman SS, Masarudin MJ. Increased loading, efficacy and sustained release of silibinin, a poorly soluble drug using hydrophobically-modified chitosan nanoparticles for enhanced delivery of anticancer drug delivery systems. Nanomaterials. 2017;7(11):379–395. | ||
Lee S-T, Mi F-L, Shen Y-J, Shyu S-S. Equilibrium and kinetic studies of copper (II) ion uptake by chitosan-tripolyphosphate chelating resin. Polymer. 2001;42(5):1879–1892. | ||
Kafshgari MH, Khorram M, Khodadoost M, Khavari S. Reinforcement of chitosan nanoparticles obtained by an ionic cross-linking process. Iran Polym J. 2011;20:445–456. | ||
Zhang L, Kosaraju SL. Biopolymeric delivery system for controlled release of polyphenolic antioxidants. Eur Polym J. 2007;43(7):2956–2966. | ||
Gierszewska-Druzynska M, Ostrowska-Czubenko J. The effect of ionic crosslinking on thermal properties of hydrogel chitosan membranes. PCACD. 2010;15:25–32. | ||
Martins AF, de Oliveira DM, Pereira AG, Rubira AF, Muniz EC. Chitosan/TPP microparticles obtained by microemulsion method applied in controlled release of heparin. Int J Biol Macromol. 2012;51(5):1127–1133. | ||
Coates J. Interpretation of infrared spectra, a practical approach. Encyclopedia of analytical chemistry. Chichester: Wiley; 2000:1–23. | ||
Smith BC. Fourier transform infrared spectroscopy. Boca Raton, FL: CRC; 1996. | ||
Jafary F, Panjehpour M, Varshosaz J, Yaghmaei P. Stability improvement of immobilized alkaline phosphatase using chitosan nanoparticles. Braz J Chem Eng. 2016;33(2):243–250. | ||
Hosseini SF, Zandi M, Rezaei M, Farahmandghavi F. Two-step method for encapsulation of oregano essential oil in chitosan nanoparticles: preparation, characterization and in vitro release study. Carbohydr Polym. 2013;95(1):50–56. | ||
Ariff SAY, Yusoff K, Masarudin MJ. Encapsulation of miRNA in chitosan nanoparticles as a candidate for an anti-metastatic agent in cancer therapy. Malays Appl Biol. 2017;46:165–170. | ||
Wu Y, Yang W, Wang C, Hu J, Fu S. Chitosan nanoparticles as a novel delivery system for ammonium glycyrrhizinate. Int J Pharm. 2005;295(1–2):235–245. | ||
Calvo P, Remunan-Lopez C, Vila-Jato JL, Alonso MJ. Novel hydrophilic chitosan-polyethylene oxide nanoparticles as protein carriers. J Appl Polym Sci. 1997;63(1):125–132. | ||
Douglas KL, Tabrizian M. Effect of experimental parameters on the formation of alginate–chitosan nanoparticles and evaluation of their potential application as DNA carrier. J Biomater Sci Polym Ed. 2005;16:43–56. | ||
Prabha S, Zhou WZ, Panyam J, Labhasetwar V. Size-dependency of nanoparticle-mediated gene transfection: studies with fractionated nanoparticles. Int J Pharm. 2002;244(1–2):105–115. | ||
Ali SW, Rajendran S, Joshi M. Synthesis and characterization of chitosan and silver loaded chitosan nanoparticles for bioactive polyester. Carbohydr Polym. 2011;83(2):438–446. | ||
Richardson SC, Kolbe HV, Duncan R. Potential of low molecular mass chitosan as a DNA delivery system: biocompatibility, body distribution and ability to complex and protect DNA. Int J Pharm. 1999;178(2):231–243. | ||
Saravanabhavan SS, Bose R, Skylab S, Dharmalingam S. Fabrication of chitosan/TPP nano particles as a carrier towards the treatment of cancer. Int J Drug Deliv. 2013;5:35–42. | ||
Anitha A, Deepagan VG, Rani VVD, Menon D, Nair SV, Jayakumar R. Preparation, characterization, in vitro drug release and biological studies of curcumin loaded dextran sulphate–chitosan nanoparticles. Carbohydr Polym. 2011;84(3):1158–1164. | ||
Zhang J, Chen XG, Peng WB, Liu CS. Uptake of oleoyl-chitosan nanoparticles by A549 cells. Nanomedicine. 2008;4(3):208–214. | ||
Hermanson GT. Bioconjugate Techniques. Fluorescent Probes. 3rd ed. Cambridge, MA: Academic Press; 2013:395. | ||
Agnihotri SA, Mallikarjuna NN, Aminabhavi TM. Recent advances on chitosan-based micro- and nanoparticles in drug delivery. J Control Release. 2004;100(1):5–28. | ||
Schipper NG, Olsson S, Hoogstraate JA, Deboer AG, Vårum KM, Artursson P. Chitosans as absorption enhancers for poorly absorbable drugs 2: mechanism of absorption enhancement. Pharm Res. 1997;14(7):923–929. | ||
Sahay G, Alakhova DY, Kabanov AV. Endocytosis of nanomedicines. J Control Release. 2010;145(3):182–195. | ||
Khalil IA, Kogure K, Akita H, Harashima H. Uptake pathways and subsequent intracellular trafficking in nonviral gene delivery. Pharmacol Rev. 2006;58(1):32–45. | ||
Mellman I, Fuchs R, Helenius A. Acidification of the endocytic and exocytic pathways. Annu Rev Biochem. 1986;55:663–700. | ||
Freier T, Koh HS, Kazazian K, Shoichet MS. Controlling cell adhesion and degradation of chitosan films by N-acetylation. Biomaterials. 2005;26(29):5872–5878. | ||
Nordtveit RJ, Vårum KM, Smidsrød O. Degradation of fully water-soluble, partially N-acetylated chitosans with lysozyme. Carbohydr Polym. 1994;23(4):253–260. | ||
Regnström K, Ragnarsson EG, Fryknäs M, Köping-Höggård M, Artursson P. Gene expression profiles in mouse lung tissue after administration of two cationic polymers used for nonviral gene delivery. Pharm Res. 2006;23(3):475–482. |
Supplementary material
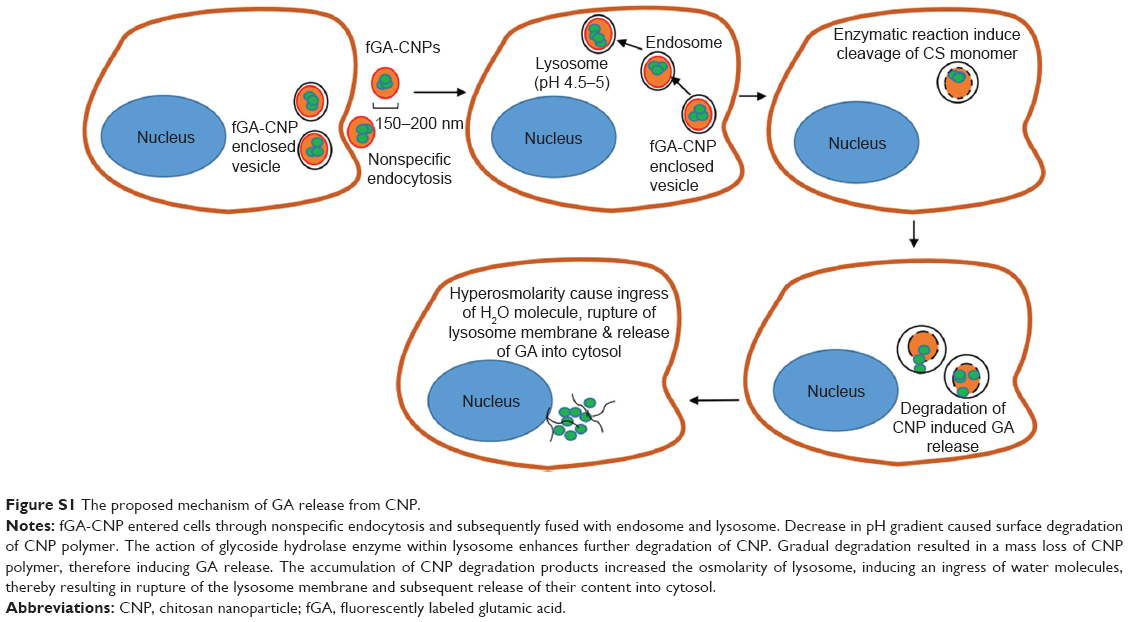 | Figure S1 The proposed mechanism of GA release from CNP. |
 © 2018 The Author(s). This work is published and licensed by Dove Medical Press Limited. The
full terms of this license are available at https://www.dovepress.com/terms
and incorporate the Creative Commons Attribution
- Non Commercial (unported, 3.0) License.
By accessing the work you hereby accept the Terms. Non-commercial uses of the work are permitted
without any further permission from Dove Medical Press Limited, provided the work is properly
attributed. For permission for commercial use of this work, please see paragraphs 4.2 and 5 of our Terms.
© 2018 The Author(s). This work is published and licensed by Dove Medical Press Limited. The
full terms of this license are available at https://www.dovepress.com/terms
and incorporate the Creative Commons Attribution
- Non Commercial (unported, 3.0) License.
By accessing the work you hereby accept the Terms. Non-commercial uses of the work are permitted
without any further permission from Dove Medical Press Limited, provided the work is properly
attributed. For permission for commercial use of this work, please see paragraphs 4.2 and 5 of our Terms.