Back to Journals » International Journal of Nanomedicine » Volume 14
In situ graphene liquid cell-transmission electron microscopy study of insulin secretion in pancreatic islet cells
Authors Firlar E ![]() , Ouy M
, Ouy M ![]() , Covnot L
, Covnot L ![]() , Xing Y, Lee D
, Xing Y, Lee D ![]() , Chan A
, Chan A ![]() , He Y, Song B, Afelik S, Wang Y, Shahbazian-Yassar R
, He Y, Song B, Afelik S, Wang Y, Shahbazian-Yassar R ![]() , Oberholzer J, Shokuhfar T
, Oberholzer J, Shokuhfar T ![]()
Received 28 March 2018
Accepted for publication 4 October 2018
Published 7 January 2019 Volume 2019:14 Pages 371—382
DOI https://doi.org/10.2147/IJN.S169506
Checked for plagiarism Yes
Review by Single anonymous peer review
Peer reviewer comments 2
Editor who approved publication: Dr Thomas Webster
Emre Firlar,1,2 Meagan Ouy,1 Leigha Covnot,1 Yuan Xing,3 Daniel Lee,1,4 Alessandro Chan,1,4 Yi He,3 Boao Song,2 Solomon Afelik,4 Yong Wang,3 Reza Shahbazian-Yassar,2 Jose Oberholzer,1,3 Tolou Shokuhfar1
1Department of Bioengineering, University of Illinois at Chicago, Chicago, IL, USA; 2University of Illinois at Chicago, Department of Mechanical and Industrial Engineering, Chicago, IL, USA; 3University of Virginia, Department of Surgery, Charlottesville, VA, USA; 4University of Illinois at Chicago, Department of Surgery, Chicago, IL, USA
Background: Islet cell transplantation is one of the key treatments for type 1 diabetes. Understanding the mechanisms of insulin fusion and exocytosis are of utmost importance for the improvement of the current islet cell transplantation and treatment of diabetes. These phenomena have not been fully evaluated due either to the lack of proper dynamic imaging, or the lack of proper cell preservation during imaging at nanoscales.
Methods: By maintaining the native environment of pancreatic β-cells between two graphene monolayer sheets, we were able to monitor the subcellular events using in situ graphene liquid cell (GLC)-transmission electron microscopy (TEM) with both high temporal and high spatial resolution.
Results: For the first time, the nucleation and growth of insulin particles until the later stages of fusion were imaged at nanometer scales. The release of insulin from plasma membrane involves the degradation of plasma membrane and drastic reductions in the shorter axis of the insulin particles. Sequential exocytosis results indicated the nucleation, growth and attachment of the new insulin particles to the already anchored ones, which is thermodynamically favorable due to the reduction in total surface, further reducing the Gibbs free energy. The retraction of the already anchored insulin toward the cell is also monitored for the first time live at nanoscale resolution.
Conclusion: Investigation of insulin granule dynamics in β-cells can be investigated via GLC-TEM. Our findings with this technology open new realms for the development of novel drugs on pathological pancreatic β-cells, because this approach facilitates observing the effects of the stimuli on the live cells and insulin granules.
Keywords: transmission electron microscopy, graphene liquid cell, insulin secretion, exocytosis
Introduction
While most of the pancreas is composed of exocrine cells for food digestion, endocrine cells are responsible for the release of insulin and glucagon hormones to the blood stream for the regulation of blood sugar.1 Endocrine cells also have delta cells in islets are composed of α- and β-cells producing glucagon and insulin, respectively.2 β-cell is the key factor in insulin secretion, which lowers blood glucose levels.3 Insulin secretion happens by the entrance of glucose to the β-cells (Figure 1A), which triggers conversion of ADP to ATP (Figure 1B).4 Furthermore, this closes the potassium channel, causing membrane depolarization that leads to the opening of the calcium channel and the increase of calcium concentration inside the cell.4 This process results in fusion of insulin granules and insulin exocytosis (Figure 1C and D). Basically, type 1 diabetes is the destruction of insulin-producing cells by the immune system, resulting in a lack of insulin in the body.5 Type 2 diabetes is the improper usage of insulin by the pancreas, causing insulin deficiency.6
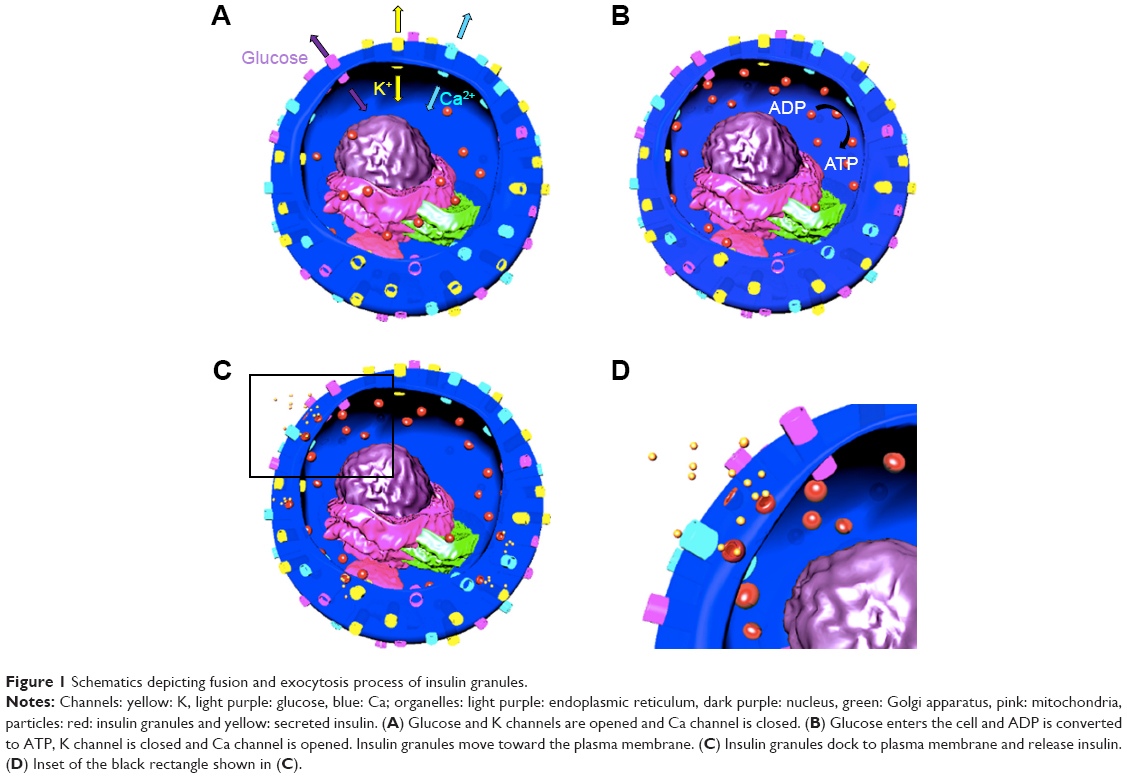 | Figure 1 Schematics depicting fusion and exocytosis process of insulin granules. |
There are four different modes of exocytosis reported, spanning full fusion, kiss-and-run, sequential, and multivesicular, where full fusion, reportedly, is the most frequent insulin secretion process (92%).7 This led to investigating subcellular activities of live β-cells using live imaging.8,9 Membrane capacitance measurement was used to estimate granule diameters and fusion pore properties.10,11 However, it is difficult to distinguish concurrent exocytosis, to detect interaction between endocytosis and exocytosis, or to discriminate between fusion and actual release insulin. Another technique used was fiber amperometry, which monitors exocytosis by first introducing serotonin, where then the insulin granules will be taken up.12 Then, the electrode detects serotonin that is co-released with insulin;12 however, it only measures content release, not fusion event.13 Furthermore, there is variability of the results between cells due to the uneven uptake of serotonin,14 and serotonin can be toxic to β-cells.15 Another technique used is total internal reflectance fluorescent (TIRF) microscopy, which significantly increases sensitivity and spatial resolution reaching 100 nm with time-lapse visualization for insulin granule dynamics. Due to their limited penetration, docking or fusion events are often much less quantified, and compound exocytosis is often undetectable.16,17 Ohara-Imaizumi et al used TIRF to study the functions of t-SNAREs (soluble NSF attachment protein receptor) in docking and fusion of insulin granules in physiological β-cells, and compared them to diabetic β-cells.18,19 However, when using TIRF, kiss-and-run exocytosis is more commonly seen,20 whereas in confocal microscopy, full fusion is mainly seen.21,22 This discrepancy is due to the fact that when using TIRF, the cell is in contact with the glass cover slip, and this may cause the process of exocytosis to differ significantly.21 Two-photon extracellular polar tracer imaging with sulforhodamine B and FM1-43 allows for better estimation of granule diameter and tracking of vesicle after exocytosis. However, it often causes observational bias for a subset of granules that are not well labeled. In addition, such labeling often causes changes in secretion kinetics.23,24 Finally, confocal microscopy has been used to study regulation and movement of insulin granules, the effect of different chemicals on insulin granule size and trafficking, and analysis of various components in the β-cells that are involved in the insulin secretion process.25–27 However, this method relies on fluorescence labeling, which has several disadvantages including toxicity28 and photobleaching.29
Electron microscopy (EM) has been widely used to study the structure of β-cells, specifically for the comparison of insulin granules in physiological β-cells and diabetic β-cells.30,31 Studies were carried out mainly to locate, visualize, and measure the size of the insulin and glucagon secreting granules.32–34 In a recent work carried out by Pfeifer et al, 3D reconstruction of islets were carried out by removing thin sections of the conventionally fixed samples via a microtome, which is housed in the scanning electron microscope (SEM). Three-dimensional tomography was conducted by serial imaging of the block face via SEM, which exhibits the distribution of the insulin granules.35 Correlative light and electron microscopy studies were carried out to investigate islets without dissociating them with the self-labeling proteins on Tokuyasu sections via high pressure freezing, freeze substitution, OsO4 staining and Epon embedding, which prevents some of the drawbacks of the conventional fluorescence staining after conventional fixation and embedding.36 Current EM observations of β-cells have been limited to cryogenic techniques that prevent monitoring of dynamic phenomena within these cells.37 The ambiguity surrounding insulin granule exocytosis and other characteristics of insulin granules calls for EM techniques with the ability to monitor such events in native environment. Recent development in liquid-cell transmission electron microscopy (TEM) imaging has provided new opportunities to study biological structures at unprecedented resolutions by which whole cells or granules can be encapsulated between two electron transparent windows with a hermetical seal, which is achieved by using either thick silicon nitride (SiN) or thin graphene monolayers. Imaging samples in liquid state via SiN windows has an advantage where liquids can be delivered while imaging, but the extra thickness of the two SiN windows deteriorates the imaging resolution. This technique has been used frequently to observe the growth mechanism of nanoparticles,38–42 nanostructures,43 and metal-organic frameworks.44 Woehl et al used in situ liquid TEM to image Magnetospirillum magneticum to determine the effects of the radiation caused by the electron beam on the live bacteria.45 They were able to verify that the bacteria did not undergo drastic radiation damage and stayed viable mostly during electron imaging. Kennedy et al conducted a similar experiment, but with Escherichia coli and bacteriophages, and saw similar results where they were able to determine the average dose of electrons that is needed to damage the bacteria.46 In numerous studies, visualization of fibroblast cells labeled with epidermal growth factor conjugated gold nanoparticles were carried out, and the penetration of gold nanoparticles on the surface of the cell was visualized.47–49 These all had the drawback of low imaging resolution due to the excessive thickness of SiN. Graphene liquid cell (GLC)-TEM imaging was introduced very recently during which liquid samples are encapsulated between two monolayers of electron transparent, strong and biocompatible graphene sheets.50–52 These graphene sheets stay closed due to the van der Waals forces.53 All these properties of GLC sample preparation make it perfect for our needs, which are keeping the cells viable and obtaining high imaging resolution. Several works have previously been reported with this technique. Mohanty et al reported the encapsulation of Bacillus subtilis bacteria in between a graphene sandwich and carried out TEM imaging.54 Yuk et al reported the growth of platinum nanocrystals via coalescence using this imaging technique.55 Wang et al used this technique to understand the crystal structure and chemistry information of ferritins.56 Wang, Shokuhfar and Klie demonstrated that nanoscale chemical reactors can be created inside GLCs and the rate of the hydrogen molecule formation can be monitored.57 Park et al also developed a hybrid method using GLC-TEM and single particle reconstruction, and reported the 3D structure of individual platinum nanoparticles in liquid state, which, without the usage of GLCs, would require collection of images of many individual particles for reconstruction.58 Furthermore, Park et al used GLCs to image the structures of influenza viruses, during which they were able to obtain high resolution images of the viruses and visualize the cytoskeleton structure, exhibiting the native state whole cell imaging capability of GLCs.59
Although the overall mechanism of how β-cells secrete insulin at high blood glucose level is well established and described earlier,60 it needs to be further unfolded using nanoscale electron imaging so that the reasons why some β-cells secrete insulin while others do not in different environments can be understood. This aforementioned resolution during imaging is of utmost importance and with the recent ongoing advancements in electron optics and sample preparation techniques, more detailed visualization of the subcellular details is possible. Until our wok, monitoring dynamics of insulin granules to aid the detailed assessment of β-cell function with nanoscale imaging resolution has been unachievable with the current conventional approaches due to the lack of both keeping the sample in its native state and using high resolution liquid EM imaging. Therefore, to study insulin granules at high resolution, we used TEM imaging via GLC sample preparation technique and reported the insulin granule fusion and exocytosis. Presence of water in between graphene layers around insulin particles is verified via spatially resolved electron energy loss spectroscopy (EELS) and energy dispersive X-ray spectroscopy (EDS). Viability of the β-cells is monitored before and after GLC-TEM imaging to evaluate the feasibility of this technique on cells. Understanding the physiological structure and subcellular dynamics of pancreatic islet cells in this research, and comparing them with the pathogeny to understand the causes of the dysfunctionalities as a future goal will facilitate the development of more effective drug and therapeutic treatments for diabetes.
Materials and methods
Cells and chemicals
MIN6 β-cells were used for GLC-TEM imaging. We obtained MIN6 cells from Louis Philipson (University of Chicago)61 (originally from Jun-Ichi Miyazaki).62
MIN6 cell culture and preparation
MIN6 cells in the active phase of growth were cloned by the dilution plating technique. The effect of increased passage on the insulin secretion dynamics was evaluated earlier by O’Driscoll et al.63 They compared MIN6 cells with passage #18 and passage #40 and they reported that the cells which underwent low passage exhibited five- to sixfold increased insulin secretion when the glucose stimulus was in the range of 0–26.7 mmol/L. Therefore, in our work, we tried to keep the passage low, similar to the passage reported in O’Driscoll et al.63 Many times experimentation was carried out and 15 to 20 cell passages were executed. Cells were detached with trypsin in Dulbecco’s phosphate buffered saline without Ca2+ and Mg2+, and then resuspended in DMEM, 1X+ GlutaMAX™-I with the addition of 10% FBS, antibiotics (100 U/mL penicillin and 100 μg/mL streptomycin) (Ab), 25 mM HEPES, and 285 μM 2-mercaptoethanol. The cell suspension was aspirated gently with care, to avoid separating the cells into a single-cell suspension. Following this, the cells were centrifuged at 1,000 rpm for 5 minutes, resuspended in prewarmed culture medium, counted, and diluted to a concentration of 100 cells/μL in Krebs–Ringer buffer (with 2 mM glucose). Buffer solutions were prepared by adding 20 mM HEPES, 5 mM KH2PO4, 1 mM MgSO3, 1 mM CaCl2, 136 mM NaCl, 4.7 mM KCl, and adjusted to a pH of 7.4. For high KCl stimulation experiments, we adjusted the final concentration with 30 mM KCl.
Cell live/dead testing
Live/dead assay of the cells was determined by 1) cell counter by adding 10 μL trypan blue solution 0.4% (ThermoFisher Scientific, Waltham, MA, USA) to 10 μL cell culture, and by (2) fluorescence microscopy by adding 10 μL of 0.46 μM fluorescein diacetate (ThermoFisher Scientific) for counting the live cells and 5 μL of 14.34 μM propidium iodide (ThermoFisher Scientific) to 100 μL cell culture for counting the dead cells. Direct reading of percent viable cells from cell counter was obtained. For fluorescence imaging, Olympus BX51/IX70 and Leica M165 FC fitted with Leica DFC420 C cameras were used with acquisition times of 0.1–1 seconds.
GLC sample preparation
The dissociated β-cells were used for investigating insulin granule characteristics by GLC-TEM. In brief, 1 μL of cells (100 cells/μL) in Krebs–Ringer buffer was loaded into graphene coated TEM grids (2,000 meshes) with single layer of graphene deposited on it via chemical vapor deposition (Graphene Supermarket; Graphene Laboratories Inc., Calverton, NY, USA). Sample was dipped onto the floating monolayer of graphene, creating the GLC as discussed by Wang et al.56
TEM imaging, STEM imaging, STEM EELS and STEM EDS
TEM imaging was carried out via JEOL 1220 or Hitachi HT7700. Scanning transmission electron microscopy (STEM) imaging, spatially resolved EDS and EELS were conducted via Hitachi HD2300, respectively. For low loss EELS, 0.1 eV/channel dispersion was used. Microscopes were operated at a low energy of 80 keV to minimize electron beam damage to the cells. Graphene itself further protected the cells from beam damage by minimizing the radicals and conducting the electrons. During the course of the TEM imaging (0.1 seconds exposure for video recording), electron dose was kept lower than 100 e/nm2, which was discussed earlier by de Jonge and Ross.64 The dose values are estimates based on experiments performed by Hitachi HT7700. For STEM imaging, the electron dose was kept lower than the critical dose reported by Kennedy et al.65 During TEM imaging, both high and low magnification imaging were carried out on most of the cells on the grids, with the main aim of keeping the cells intact in the vacuum environment.
Data analysis and statistics
Image acquisition was carried out via Digital Micrograph 2.11.1404.0. During video recording for Supplementary Videos S1, S2 and S3, 30 fps was used, which is high enough to visualize clearly the trajectories of the particles.
Results and discussion
Encapsulation of β-cells in GLCs
GLC-TEM imaging facilitates imaging of the cells and secreted granules in the smallest liquid capsule in the TEM. Cells were encapsulated between two graphene monolayers with 100 cells/μL concentration (Figure 2A). Individual β-cells are shown in the high-angle annular dark field (HAADF)-STEM image in Figure 2. This image is in great harmony with the 3D tomography image reported by Pfeifer et al.35 The intracellular structures were not as visible as in the cryofixed or conventionally fixed counterparts because the cells in those cases were fixed, stained and ultramicrotomed to a thickness less than 100 nm, reducing the electron scattering, thus increasing the imaging resolution, while in this work, whole cell imaging was carried out with no fixation and ultramicrotomy.
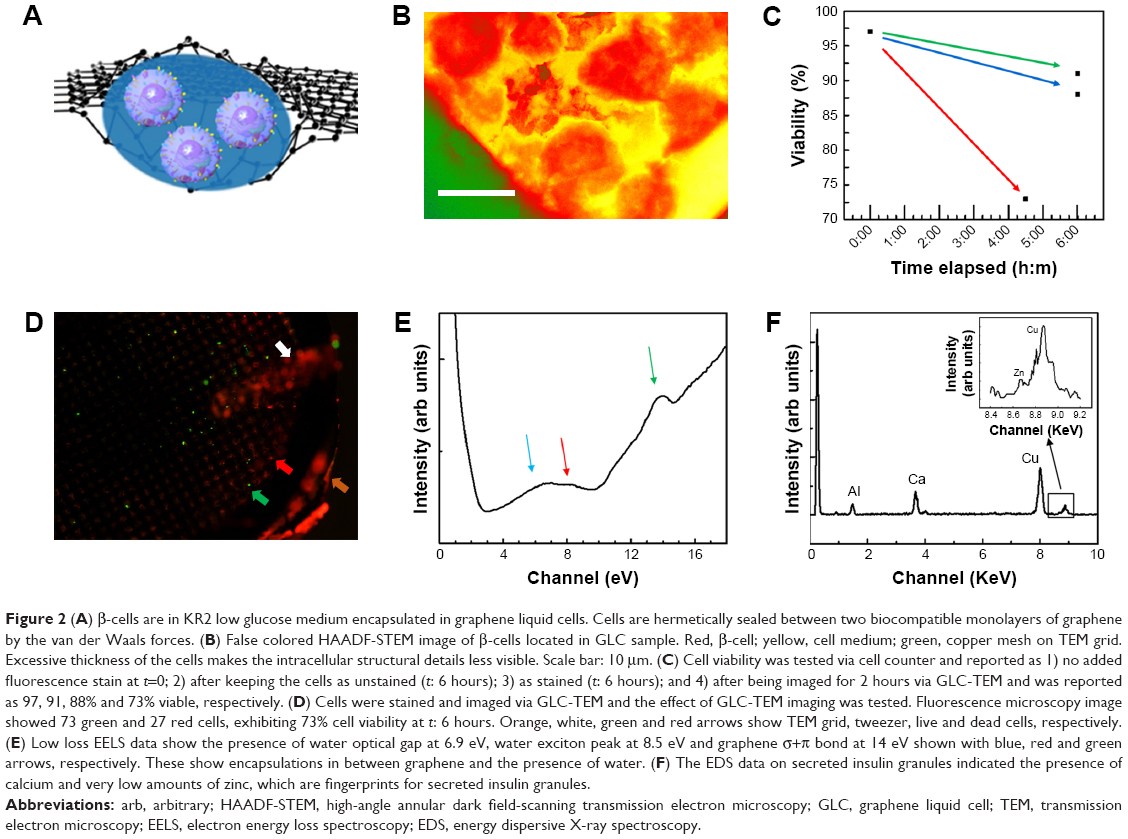 | Figure 2 (A) β-cells are in KR2 low glucose medium encapsulated in graphene liquid cells. Cells are hermetically sealed between two biocompatible monolayers of graphene by the van der Waals forces. (B) False colored HAADF-STEM image of β-cells located in GLC sample. Red, β-cell; yellow, cell medium; green, copper mesh on TEM grid. Excessive thickness of the cells makes the intracellular structural details less visible. Scale bar: 10 μm. (C) Cell viability was tested via cell counter and reported as 1) no added fluorescence stain at t=0; 2) after keeping the cells as unstained (t: 6 hours); 3) as stained (t: 6 hours); and 4) after being imaged for 2 hours via GLC-TEM and was reported as 97, 91, 88% and 73% viable, respectively. (D) Cells were stained and imaged via GLC-TEM and the effect of GLC-TEM imaging was tested. Fluorescence microscopy image showed 73 green and 27 red cells, exhibiting 73% cell viability at t: 6 hours. Orange, white, green and red arrows show TEM grid, tweezer, live and dead cells, respectively. (E) Low loss EELS data show the presence of water optical gap at 6.9 eV, water exciton peak at 8.5 eV and graphene σ+π bond at 14 eV shown with blue, red and green arrows, respectively. These show encapsulations in between graphene and the presence of water. (F) The EDS data on secreted insulin granules indicated the presence of calcium and very low amounts of zinc, which are fingerprints for secreted insulin granules. |
Effect of GLC encapsulation on the β-cell viability
One of the advantages of GLC-S/TEM is to protect the cells from the vacuum environment due to the strong graphene layers. GLC-TEM imaging has also been reported to be a very significant tool for the characterization of Madin–Darby canine kidney epithelial cells and it was proven that the cells were still viable in the correlative fluorescence microscopy imaging after the TEM study.59 The other advantage is that graphene is electron transparent, which means that the radiolysis effect due to the electron charge build-up is at a minimum. Radiolysis of the water-based cell medium would create radiolysis by-products including hydroxyl radicals and hydrogen peroxide, which furthermore might interact with the cells and create oxidative stress, respectively.66,67 This may result in cell death. To test how the viability of the cells change during GLC-TEM imaging, cells were removed from the incubator at t: 0 seconds, stained with trypan blue and checked for viability via cell counter, which reported that cells were 97% alive. Another set of cells from the same batch was stained with fluorescein diacetate and propidium iodide for fluorescence imaging. After 6 hours with no electron microscopy, the cells were reported to be 88% and 91% viable with and without fluorescence stain, respectively. This showed that on the bench, with the assumption of linear rate of cell viability loss, viability drops 1% per hour and if stained for fluorescence, additional loss of 0.5% per hour was monitored. Furthermore, to check the viability change via GLC-TEM, cells were encapsulated in GLC and examined for 2 hours with an electron microscope. By interpolating the viability from the cell counter, when the GLC was prepared, viability was 97% (1.5% per hour ×2 hours) =94%. After 2 hours of TEM imaging, with 1.5% per hour viability loss, 3% viability loss was also expected due to the both nature of the cells and the effect of stain, making them 91% viable (Figure 2C). Via fluorescence imaging, the cell viability after 2 hours of GLC-TEM imaging was reported to be 73%, making the viability loss due to GLC-TEM imaging 91–73=18%, with respect to the total number of the cells in the starting batch (Figure 2D). This verifies that the cells remain mostly viable when encapsulated in GLC and imaged in TEM for at least 2 hours. We should also add that further work should be performed to fully asses if the cells are alive during TEM imaging in graphene liquid cells. There is always high chance for artifacts in liquid cell systems under electron beam that may lead to improper interpretation. We noticed that success rate of our experiments is quite low which points to the lack of proper control on keeping the cells alive during TEM imaging in GLC. We encourage the scientific community to perform such experiments with proper cross checking with other characterization techniques.
Verification of the presence of water, graphene and insulin
Low loss EEL spectrum was collected from secreted insulin granules and reported in Figure 2E. For the investigation of the presence of water, carrying out EELS analysis on β-cell will not be informative due to the excessive thickness of the cells, which is around 5–8 μm. Thus, the analysis was carried out on relatively smaller secreted insulin granules in the cell medium. The blue, red and green arrows at 6.9, 8.5 and 14 eV show water optical gap,68 water exciton69 and σ+π bond for graphene.69 These are indications of the proper preservation of the samples, that is, samples are encapsulated in graphene and have liquid. Investigation of oxygen K edge in EELS was avoided since the source of oxygen in the GLC sample can be any constituent of the buffer, not limited to water. Insulin is also known to show fingerprints of calcium and zinc before secretion.70 Figure 2F shows the EDS data collected from secreted insulin granules, which indicate the presence of calcium and very low amounts of zinc, which was consistent with an earlier study by Li,71 confirming the release of zinc after the secretion of insulin. Calcium and zinc can be also used as an identification marker for insulin granules residing in the β-cell and for potential quantification of zinc, calcium, or other element homeostasis and insulin maturation. But after the secretion, negligible zinc was observed in these particles. Furthermore, the copper signal was due to the copper grid and aluminum from the grid locking mechanism of the holder.
Fusion and exocytosis events
β-cells have four modes of insulin granule fusion. In full fusion (92% of total exocytosis), a granule completely fuses with the plasma membrane (PM) forming an omega structure.7 We have successfully imaged and recoded, with nanoscale resolution, the dynamics of insulin fusion and exocytosis in real-time as shown in Figure 3. Formation and docking of insulin granule outside the PM and release of the insulin are shown as false colored TEM images in Figure 3A–H. Furthermore, Figure 3I shows the morphology and size change during this full fusion process. Figure 3A shows the proximity of the PM at t: 0 seconds. Initially, there is a small insulin granule by the PM with a size of 52 by 68 nm with an aspect ratio of 1.3. Furthermore, the presence of bubbles in the liquid area shows the presence of liquid, specifically, the formation of hydrogen molecule bubbles due to the electron beam induced radiolysis in the liquid.72 Figure 3B–F show the time sequences of t: 2, 4, 6, 8 and 32 seconds, exhibiting the growth of insulin particle. Figure 3F shows the fully grown particle to a size of 130 by 388 nm with an aspect ratio of 3. In addition to the size of the particle, the aspect ratio also increases, but until t: 16 seconds, after which it stays constant and slightly increases until t: 64 seconds and afterward increases drastically. The granule, initially shaped as a sphere, transforms into an imperfect rectangle following docking on the PM in an omega shape (Ω). This shape transformation is affected by the PM, where if the PM was not there, these particles might have been grown to spherical shape similar to the initial shape of these particles. This trend in the shape transformation is traditional for the insulin undergoing full fusion. After t: 60 seconds (Figure 3G), the granule is retrieved, fusion pores open and as time passes (t: 120 seconds) insulin is released (Figure 3H). The further increase in the aspect ratio with more drastic shrinkage in shorter axis compared to longer axis might be an indication of the insulin release in parallel direction with the short axis that is perpendicular to PM, which is anticipated through the basis of insulin fusion as well. Another example of full fusion is also reported in Figure S1 (Supplementary Video 3).
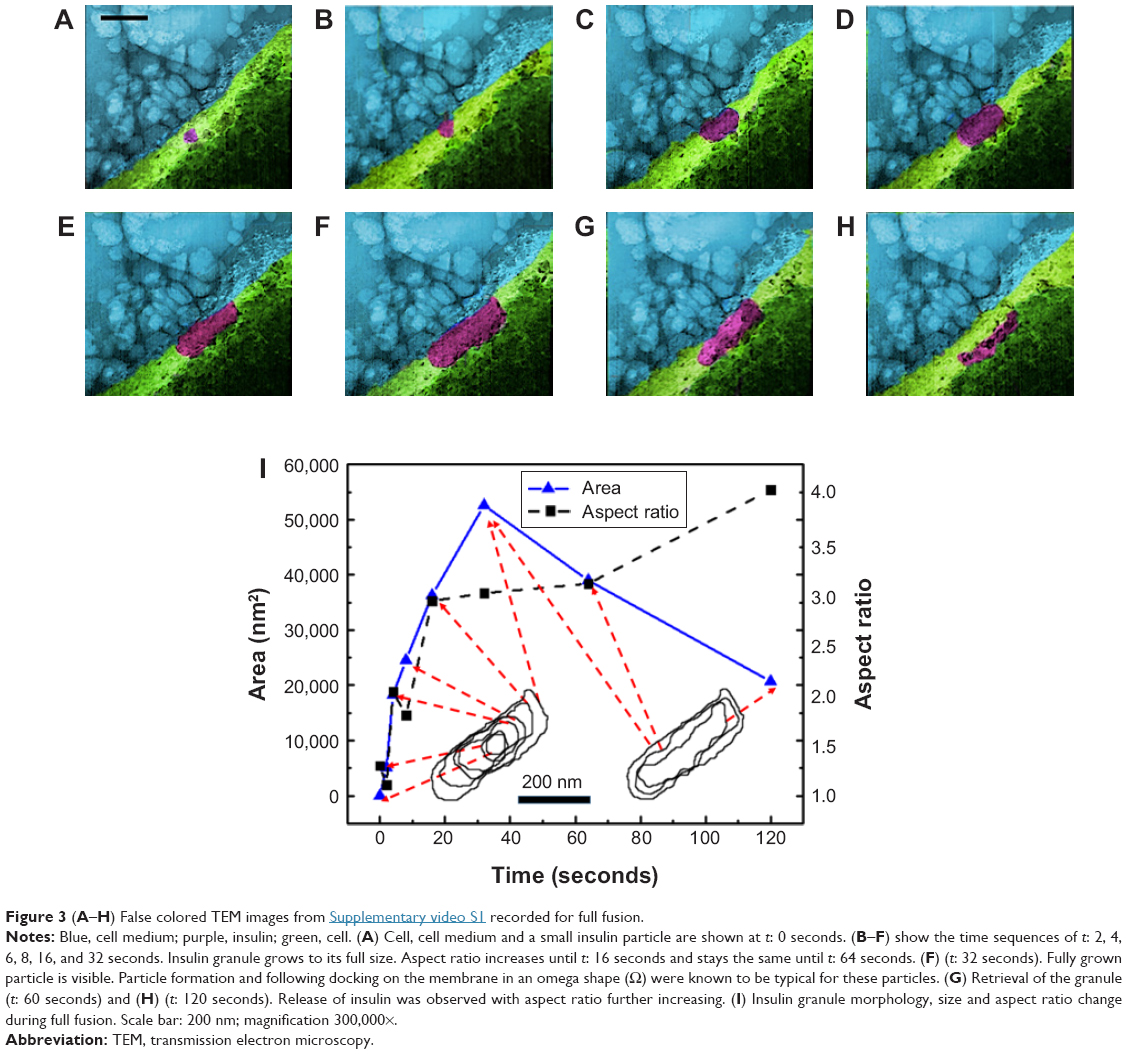 | Figure 3 (A–H) False colored TEM images from Supplementary video S1 recorded for full fusion. |
An insulin granule undergoing kiss-and-run exocytosis transiently fuses with the PM and subsequently moves away. The transient and narrow fusion pore often indicates as a failure of insulin secretion. In multivesicular exocytosis, several granules are fused together, leading to a robust and abrupt insulin release that brings risk of hypoglycemia. In sequential exocytosis, a granule fuses with another granule that is already fused with the PM, in which exocytosis sites move into the internal area designated for exocytosis.7 The TEM images in Figure 4A–L show the sequence of sequential exocytosis. Individual insulin particles are observed to attach onto the top of the anchored initial particles first, and afterward, these particles approach each other and further toward PM. In Figure 4A, at t: 0 seconds, one of the insulin particles is marked with cyan arrow. Following this, attachment of new particles is designated with additional colors throughout a 0.5–5 second time interval. Comparing the positions of the particles in Figure 4 (t-0 seconds) with Figure 4 (t-0.5 seconds), the particles with cyan arrow in 4D, dark green arrow in Figure 4I and yellow arrow in Figure 4K moved toward PM, which is expected in sequential exocytosis. In Figure 4E, at t: 2 seconds, the insulin particles with light blue and dark green arrows and in Figure 4G, at t: 3 seconds, insulin particles with orange and purple arrows are observed to attract toward each other. This attraction, along with the attachment of the new ones to the already anchored ones, is thermodynamically favorable due to the fact the total surface area will be reduced, which will further reduce the Gibbs free energy. The observed sequential exocytosis here also matches with the relatively lower resolution video recorded by two-photon excitation microscopy by Takahashi et al.73
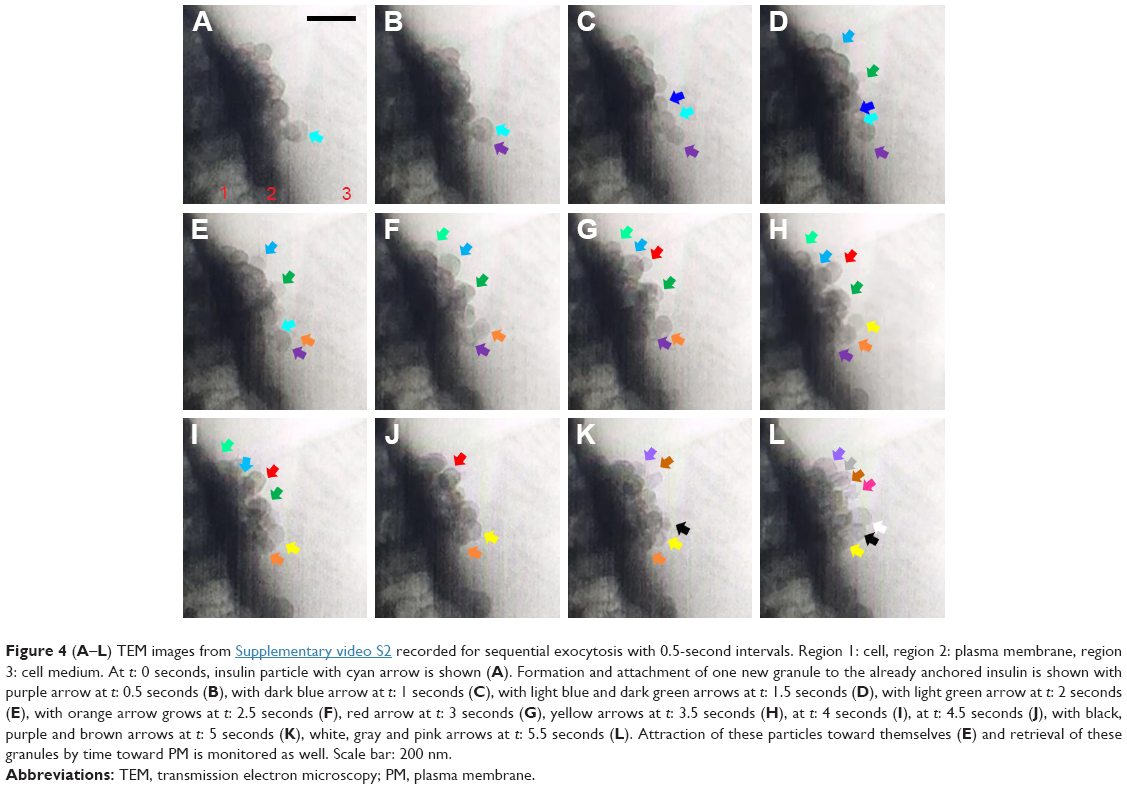 | Figure 4 (A–L) TEM images from Supplementary video S2 recorded for sequential exocytosis with 0.5-second intervals. Region 1: cell, region 2: plasma membrane, region 3: cell medium. At t: 0 seconds, insulin particle with cyan arrow is shown (A). Formation and attachment of one new granule to the already anchored insulin is shown with purple arrow at t: 0.5 seconds (B), with dark blue arrow at t: 1 seconds (C), with light blue and dark green arrows at t: 1.5 seconds (D), with light green arrow at t: 2 seconds (E), with orange arrow grows at t: 2.5 seconds (F), red arrow at t: 3 seconds (G), yellow arrows at t: 3.5 seconds (H), at t: 4 seconds (I), at t: 4.5 seconds (J), with black, purple and brown arrows at t: 5 seconds (K), white, gray and pink arrows at t: 5.5 seconds (L). Attraction of these particles toward themselves (E) and retrieval of these granules by time toward PM is monitored as well. Scale bar: 200 nm. |
The observed full fusion and sequential exocytosis are similar with respect to the ones reported by Takahashi and Kasai7 and Takahashi et al.73 The EDS characterization in conjunction to similar particle size also confirmed that the particles released are insulin. Kennedy et al65 was able to monitor the cellular functions by the expression of green fluorescing protein-GFP-LVA by Escherichia coli in the electron microscope. We used an electron dose that is tolerant for the live cell imaging. Furthermore, graphene is 1) impermeable to ion flow, so the liquid medium cannot leak from the graphene cell, and thus prevents the cell drying; 2) electron transparent, so electrons do not accumulate on the sample, preventing electron charging induced damage; 3) thin (~1–2 nm) due to its monolayer nature compared to thicker Si3N4 windows (~30–100 nm) used in earlier works, therefore, formation of secondary electrons is in a lower extent, thus less radiation damage; and 4) a radical scavenger, continuously removing the radiolysis by-products. In addition to these advantageous features of graphene, the electron doses used in this work are within the limits of live cell imaging, and in addition to the cell viability test with fluorescence imaging, similar to the experimentation by Kennedy et al,65 cellular function specific to the β-cell under consideration, that is insulin secretion, was monitored.65 Furthermore, the authors did not observe insulin secretion in many of the cells they monitored. Reasons for this could be either the particular cell under observation is not viable or the local glucose concentration in the given graphene pocket is not enough for the initiation of the insulin secretion.
For metabolic activity tests reported in the literature, the KR2 buffer contained 2×10⁶ cells/mL, which has 0.002M (mol/L) or 2×10⁻⁶ mol/mL glucose concentration.74 Similar glucose concentration in the buffer was reported by Llanos et al75 and Hays et al.76 So, the total glucose one cell faces is 10−12 mol. However, in this work, the authors used 100 cells/μL, which is 105 cells/mL. Therefore, the total glucose of 0.002M (2×10⁻⁶ mol/mL) was received by 105 cells/mL. This translates to (2×10⁻⁶ mol/mL/1×105 cells/mL) 2×10⁻¹¹ mol/cell, which is 20 times higher than the one used by Bernard et al.74 This amount of glucose is high enough for insulin secretion. We also observed the full fusion process rarely, even though it is the most common mode of insulin secretion. However, this local high glucose concentration helped with the observation of a few full fusion processes. For future studies to investigate the insulin secretion under varying glucose concentrations, KR buffer will be prepared with higher glucose concentrations.
Many experimentations have been carried out to monitor these insulin secretion events; however, only a few were very successful in imaging insulin secretion (Figure S1). Considering that TEM provides local information about the specimens and is most suited for understanding the mechanisms, we suggest more experimentation should be carried out to further verify these results. Furthermore, even though appropriate glucose concentrations including KR2 to KR50 were used, tightly wrapping of cells between the graphene monolayers yields little amount of liquid wrapped with the cell itself in the graphene capsules, which may not always be high enough for monitoring glucose-induced insulin secretion events. The inability to monitor high numbers of insulin secretion events due to these reasons also hinders monitoring the other types of insulin secretion, namely kiss-and-run and multivesicular exocytosis in addition to the monitored full fusion and sequential exocytosis. Additional tests with microfluidic TEM cells should be pursued in addition to the GLC-TEM studies conducted here.
Even though GLC is advantageous over the Si3N4 based liquid cell TEM holders due to the addition of a few layers of graphene instead of thicker Si3N4 membranes, which deteriorate imaging resolution, formation of individual graphene sandwiches happens due to the adhesion of two monolayers of graphene via the van der Waals forces between two graphene layers. Hence, an individual cell is wrapped in isolated capsules of graphene sandwiches, hindering the interaction of multiple cells. However, due to the nature of the Si3N4 based liquid cell TEM holders, multiple cells could be enclosed in Si3N4 enclosure and the interaction of cells in the cell medium could be monitored.
Conclusion
In this work we reported a direct investigation of insulin granule dynamics in β-cells, which is highly critical for diabetes research. Utilizing GLC-TEM, β-cells were first encapsulated between monolayers of graphene. Verification of cell intactness and the presence of water in graphene sandwich confirmed the feasibility of technique for the cell imaging. Afterward, the insulin granule full fusion and the relatively rare sequential exocytosis were reported for the first time with nanoscale resolution. At the later stages of insulin secretion through full fusion, the aspect ratio of the insulin granule remained high and increasing further, which indicates the release of insulin in perpendicular direction to the PM. Retraction of the anchored insulin granules toward the PM was monitored during sequential exocytosis for the first time with nanoscale resolution as well. The present findings provide an indispensable tool for type 1 and 2 diabetic researchers to monitor the insulin granule dynamics at very small scales. This can open up new opportunities to investigate the effect of chemical stimuli and immunosuppressive drugs on insulin secretion. However, due to low success rate of our experiments and possibility for artifacts, we believe additional characterization and studies should be followed to fully assess if the cells remain to be alive during TEM imaging.
Acknowledgments
TEM imaging work made use of instruments in the Electron Microscopy Service (Research Resources Center, UIC). STEM imaging, STEM-EDS and STEM-EELS work made use of the EPIC facility of Northwestern University Atomic and Nanoscale Characterization Experimental Center, which has received support from the Soft and Hybrid Nanotechnology Experimental (SHyNE) Resource (NSF ECCS-1542205); the MRSEC program (NSF DMR-1121262) at the Materials Research Center; the International Institute for Nanotechnology (IIN); the Keck Foundation; and the State of Illinois, through the IIN. T Shokuhfar is grateful to the National Science Foundation, CAREER award DMR-1564950, for providing partial financial support. R Shahbazian-Yassar acknowledges the financial support from NSF-DMR Award number 1710049. J Oberholzer acknowledges the financial support from NIH/NIDDK R01 DK091526. The authors are grateful to Shayan Shafiee for his contributions and for attending experiments.
Author contributions
EF, JO, and TS conceived the idea. EF performed GLC-TEM imaging and analysis. MO participated in imaging experiments. YX, DL, AC and YH provided the cells. EF and YH carried out cell viability tests. LC and BS draw schematics. Manuscript was written by EF, MO, LC, BS, RSY, YW, JO and TS. All authors contributed to data analysis, drafting and revising the article, gave final approval of the version to be published, and agree to be accountable for all aspects of the work.
Disclosure
The authors report no conflicts of interest in this work.
References
Röder PV, Wu B, Liu Y, Han W. Pancreatic regulation of glucose homeostasis. Exp Mol Med. 2016;48(3):e219. | ||
Chandra R, Liddle RA. Neural and hormonal regulation of pancreatic secretion. Curr Opin Gastroenterol. 2009;25(5):441–446. | ||
Garrett WE, Kirkendall DT. Exercise and sport science. Lippincott Williams & Wilkins; 2000. Available from: https://books.google.com/books?id=Cx22TcXodrwC. Accessed October 23, 2018. | ||
Fridlyand LE, Jacobson DA, Philipson LH. Ion channels and regulation of insulin secretion in human β-cells: a computational systems analysis. Islets. 2013;5(1):1–15. | ||
Tang Q, Desai TA. Approaching a cure for type 1 diabetes. Nat Med. 2016;22(3):236–237. | ||
Willemsen G, Ward KJ, Bell CG, et al. The concordance and heritability of type 2 diabetes in 34,166 twin pairs from international twin registers: The discordant twin (DISCOTWIN) consortium. Twin Res Hum Genet. 2015;18(6):762–771. | ||
Takahashi N, Kasai H. Two-photon excitation imaging of insulin exocytosis. In: Seino S, Bell GI, editors. Pancreatic Beta Cell in Health and Disease. Tokyo: Springer Japan; 2008:195–211. | ||
Ohara-Imaizumi M, Nakamichi Y, Tanaka T, Ishida H, Nagamatsu S. Imaging exocytosis of single insulin secretory granules with evanescent wave microscopy: distinct behavior of granule motion in biphasic insulin release. J Biol Chem. 2002;277(6):3805–3808. | ||
Qian WJ, Aspinwall CA, Battiste MA, Kennedy RT. Detection of secretion from single pancreatic beta-cells using extracellular fluorogenic reactions and confocal fluorescence microscopy. Anal Chem. 2000;72(4):711–717. | ||
Hou JC, Le Min JEP. NIH Public Access. Vitam Horm. 2009;80(506):473–506. | ||
Neher E, Marty A. Discrete changes of cell membrane capacitance observed under conditions of enhanced secretion in bovine adrenal chromaffin cells. Proc Natl Acad Sci U S A. 1982;79(21):6712–6716. | ||
Bokvist K, Holmqvist M, Gromada J, Rorsman P. Compound exocytosis in voltage-clamped mouse pancreatic β-cells revealed by carbon fibre amperometry. Pflügers Arch. 2000;439(5):634–645. | ||
Huang L, Shen H, Atkinson MA, Kennedy RT. Detection of exocytosis at individual pancreatic beta cells by amperometry at a chemically modified microelectrode. Proc Natl Acad Sci U S A. 1995;92(21):9608–9612. | ||
Islam MS. The Islets of Langerhans. Preface. Adv Exp Med Biol. 2010;654. | ||
Leung YM, Sheu L, Kwan E, Wang G, Tsushima R, Gaisano H. Visualization of sequential exocytosis in rat pancreatic islet beta cells. Biochem Biophys Res Commun. 2002;292(4):980–986. | ||
Nagamatsu S, Ohara-Imaizumi M, Nakamichi Y, Tanaka T, Katsuta H. Hitoshi Ishida And Shinya Nagamatsu. Society. 2002;80:73–80. | ||
Yuan T, Lu J, Zhang J, Zhang Y, Chen L. Spatiotemporal detection and analysis of exocytosis reveal fusion “hotspots” organized by the cytoskeleton in endocrine cells. Biophys J. 2015;108(2):251–260. | ||
Ohara-Imaizumi M, Nishiwaki C, Nakamichi Y, Kikuta T, Nagai S, Nagamatsu S. Correlation of syntaxin-1 and SNAP-25 clusters with docking and fusion of insulin granules analysed by total internal reflection fluorescence microscopy. Diabetologia. 2004;47(12):2200–2207. | ||
Ohara-Imaizumi M, Nishiwaki C, Kikuta T, Nagai S, Nakamichi Y, Nagamatsu S. TIRF imaging of docking and fusion of single insulin granule motion in primary rat pancreatic beta-cells: different behaviour of granule motion between normal and Goto-Kakizaki diabetic rat beta-cells. Biochem J. 2004;381(Pt 1):13–18. | ||
Tsuboi T, Mcmahon HT, Rutter GA. Mechanisms of dense core vesicle recapture following “kiss and run” (“cavicapture”) exocytosis in insulin-secreting cells. J Biol Chem. 2004;279(45):47115–47124. | ||
Ma L, Bindokas VP, Kuznetsov A, et al. Direct imaging shows that insulin granule exocytosis occurs by complete vesicle fusion. Proc Natl Acad Sci U S A. 2004;101(25):9266–9271. | ||
Takahashi N. Recent progress in the research of insulin secretion imaging analysis of insulin secretion with two-photon microscopy. 2015;38(5):656–662. | ||
Kasai H, Hatakeyama H, Ohno M, Takahashi N. Exocytosis in islet beta-cells. In: Islam MS, editor. The Islets of Langerhans. Dordrecht: Springer Netherlands; 2010:305–338. | ||
Kasai H, Kishimoto T, Nemoto T, Hatakeyama H, Liu TT, Takahashi N. Two-photon excitation imaging of exocytosis and endocytosis and determination of their spatial organization. Adv Drug Deliv Rev. 2006;58(7):850–877. | ||
Hao M, Li X, Rizzo MA, Rocheleau JV, Dawant BM, Piston DW. Regulation of two insulin granule populations within the reserve pool by distinct calcium sources. J Cell Sci. 2005;118(Pt 24):5873–5884. | ||
Bogan JS, Xu Y, Hao M. Cholesterol accumulation increases insulin granule size and impairs membrane trafficking. Traffic. 2012;13(11):1466–1480. | ||
Cheng H, Beck A, Launay P, et al. TRPM4 controls insulin secretion in pancreatic beta-cells. Cell Calcium. 2007;41(1):51–61. | ||
Crivat G, Taraska JW. Imaging proteins inside cells with fluorescent tags. Trends Biotechnol. 2012;30(1):8–16. | ||
Ettinger A, Wittmann T. Fluorescence live cell imaging. Methods Cell Biol. 2014;123:77–94. | ||
Masini M, Marselli L, Bugliani M, et al. Ultrastructural morphometric analysis of insulin secretory granules in human type 2 diabetes. Acta Diabetol. 2012;49(Suppl 1):247–252. | ||
Xue Y, Zhao W, du W, et al. Ultra-structural study of insulin granules in pancreatic β-cells of db/db mouse by scanning transmission electron microscopy tomography. Protein Cell. 2012;3(7):521–525. | ||
Fava E, Dehghany J, Ouwendijk J, et al. Novel standards in the measurement of rat insulin granules combining electron microscopy, high-content image analysis and in silico modelling. Diabetologia. 2012;55(4):1013–1023. | ||
Mantell J, Nam D, Bull D, Achim A, Verkade P. A novel 2D and 3D method for automated insulin granule measurement and its application in assessing accepted preparation methods for electron microscopy. Journal of Physics: Conference Series. 2014;522:012022. | ||
Collins SC, do HW, Hastoy B, et al. Increased expression of the diabetes gene SOX4 reduces insulin secretion by impaired fusion pore expansion. Diabetes. 2016;65(7):1952–1961. | ||
Pfeifer CR, Shomorony A, Aronova MA, et al. Quantitative analysis of mouse pancreatic islet architecture by serial block-face SEM. J Struct Biol. 2015;189(1):44–52. | ||
Müller A, Neukam M, Ivanova A, et al. A global approach for quantitative super resolution and electron microscopy on cryo and epoxy sections using self-labeling protein Tags. Sci Rep. 2017;7(1):23. | ||
Wu JS, Kim AM, Bleher R, et al. Imaging and elemental mapping of biological specimens with a dual-EDS dedicated scanning transmission electron microscope. Ultramicroscopy. 2013;128:24–31. | ||
Ahn T-Y, Hong S-P, Kim S-I, Kim Y-W. In situ liquid-cell transmission electron microscopy for direct observation of concentration-dependent growth and dissolution of silver nanoparticles. RSC Adv. 2015;5(100):82342–82345. | ||
Evans JE, Jungjohann KL, Browning ND, Arslan I. Controlled growth of nanoparticles from solution with in situ liquid transmission electron microscopy. Nano Lett. 2011;11(7):2809–2813. | ||
Qin F, Wang Z, Wang ZL. Anomalous growth and coalescence dynamics of hybrid perovskite nanoparticles observed by liquid-cell transmission electron microscopy. ACS Nano. 2016;6:b04234. | ||
Liang W-I, Zhang X, Bustillo K, et al. In situ study of spinel ferrite nanocrystal growth using liquid cell transmission electron microscopy. Chemistry of Materials. 2015;27(23):8146–8152. | ||
Parent LR, Robinson DB, Woehl TJ, et al. Direct in situ observation of nanoparticle synthesis in a liquid crystal surfactant template. ACS Nano. 2012;6(4):3589–3596. | ||
Zhu G, Jiang Y, Lin F, et al. In situ study of the growth of two-dimensional palladium dendritic nanostructures using liquid-cell electron microscopy. Chem Commun. 2014;50(67):9447. | ||
Patterson JP, Abellan P, Denny MS, et al. Observing the growth of metal-organic frameworks by in situ liquid cell transmission electron microscopy. J Am Chem Soc. 2015;137(23):7322–7328. | ||
Woehl TJ, Kashyap S, Firlar E, et al. Correlative electron and fluorescence microscopy of magnetotactic bacteria in liquid: toward in vivo imaging. Sci Rep. 2014;4(1):6854. | ||
Kennedy E, Nelson EM, Tanaka T, Damiano J, Timp G. Live bacterial physiology visualized with 5 nm resolution using scanning transmission electron microscopy. ACS Nano. 2016;10(2):2669–2677. | ||
de Jonge N, Peckys DB, Kremers GJ, Piston DW. Electron microscopy of whole cells in liquid with nanometer resolution. Proc Natl Acad Sci U S A. 2009;106(7):2159–2164. | ||
Peckys DB, Veith GM, Joy DC, de Jonge N. Nanoscale imaging of whole cells using a liquid enclosure and a scanning transmission electron microscope. PLoS One. 2009;4(12):e8214–e8217. | ||
Peckys DB, de Jonge N. Liquid scanning transmission electron microscopy: imaging protein complexes in their native environment in whole eukaryotic cells. Microsc Microanal. 2014;20(2):346–365. | ||
Kim YD, Kim H, Cho Y, et al. Bright visible light emission from graphene. Nat Nanotechnol. 2015;10(8):676–681. | ||
Nair RR, Anissimova S, Zan R, et al. Graphene as a transparent conductive support for studying biological molecules by transmission electron microscopy. IEEE Trans Inf Theory. 1993;39(3):1057–1064. | ||
Heo C, Yoo J, Lee S, et al. The control of neural cell-to-cell interactions through non-contact electrical field stimulation using graphene electrodes. Biomaterials. 2011;32(1):19–27. | ||
Warner JH, Schaffel F, Rummeli M, Bachmatiuk A. Graphene: Fundamentals and Emergent Applications: Elsevier Science; 2012. Available from: https://www.elsevier.com/books/graphene/warner/978-0-12-394593-8. Accessed October 23, 2018. | ||
Mohanty N, Fahrenholtz M, Nagaraja A, Boyle D, Berry V. Impermeable graphenic encasement of bacteria. Nano Lett. 2011;11(3):1270–1275. | ||
Yuk JM, Park J, Ercius P, et al. High-resolution EM of colloidal nanocrystal growth using graphene liquid cells. Science. 2012;336(6077):61–64. | ||
Wang C, Qiao Q, Shokuhfar T, Klie RF. High-resolution electron microscopy and spectroscopy of ferritin in biocompatible graphene liquid cells and graphene sandwiches. Adv Mater. 2014;26(21):3410–3414. | ||
Wang C, Shokuhfar T, Klie RF. Precise In Situ Modulation of Local Liquid Chemistry via Electron Irradiation in Nanoreactors Based on Graphene Liquid Cells. Adv Mater. 2016;28(35):7716–7722. | ||
Park J, Elmlund H, Ercius P, et al. Nanoparticle imaging. 3D structure of individual nanocrystals in solution by electron microscopy. Science. 2015;349(6245):290 LP-295–295. Available from: http://science.sciencemag.org/content/349/6245/290.abstract. Accessed October 23, 2018. | ||
Park J, Park H, Ercius P, et al. Direct observation of wet biological samples by graphene liquid cell transmission electron microscopy. Nano Lett. 2015;15(7):4737–4744. | ||
Schmitz O, Rungby J, Edge L, Juhl CB. On high-frequency insulin oscillations. Ageing Res Rev. 2008;7(4):301–305. | ||
Rajan S, Dickson LM, Mathew E, et al. Chronic hyperglycemia downregulates GLP-1 receptor signaling in pancreatic β-cells via protein kinase A. Mol Metab. 2015;4(4):265–276. | ||
Miyazaki J, Araki K, Yamato E, et al. Establishment of a pancreatic beta cell line that retains glucose-inducible insulin secretion: special reference to expression of glucose transporter isoforms. Endocrinology. 1990;127(1):126–132. | ||
O’Driscoll L, Gammell P, Mckiernan E, et al. Phenotypic and global gene expression profile changes between low passage and high passage MIN-6 cells. J Endocrinol. 2006;191(3):665–676. | ||
de Jonge N, Ross FM. Electron microscopy of specimens in liquid. Nat Nanotechnol. 2011;6(11):695–704. | ||
Kennedy E, Nelson EM, Damiano J, Timp G. Gene expression in electron-beam-irradiated bacteria in reply to “live cell electron microscopy is probably impossible”. ACS Nano. 2017;11(1):3–7. | ||
Le Caër S. Water Radiolysis: Influence of oxide surfaces on H2 production under ionizing radiation. Water. 2011;3(1):235–253. | ||
Persson HL, Kurz T, Eaton JW, Brunk UT. Radiation-induced cell death: importance of lysosomal destabilization. Biochem J. 2005;389(Pt 3):877–884. | ||
Holtz ME, Yu Y, Gao J, Abruña HD, Muller DA. In situ electron energy-loss spectroscopy in liquids. Microsc Microanal. 2013;19(4):1027–1035. | ||
Aronova MA, Sousa AA, Leapman RD. EELS characterization of radiolytic products in frozen samples. Micron. 2011;42(3):252–256. | ||
Foster MC, Leapman RD, Li MX, Atwater I. Elemental composition of secretory granules in pancreatic islets of Langerhans. Biophys J. 1993;64(2):525–532. Available from: http://www.ncbi.nlm.nih.gov/pmc/articles/PMC1262355/. Accessed October 23, 2018. | ||
Li YV. Zinc and insulin in pancreatic beta-cells. Endocrine. 2014;45(2):178–189. | ||
Grogan JM, Schneider NM, Ross FM, Bau HH. Bubble and pattern formation in liquid induced by an electron beam. Nano Lett. 2014;14(1):359–364. | ||
Takahashi N, Hatakeyama H, Okado H, et al. Sequential exocytosis of insulin granules is associated with redistribution of SNAP25. J Cell Biol. 2004;165(2):255–262. | ||
Bernard AB, Lin CC, Anseth KS. A microwell cell culture platform for the aggregation of pancreatic β-cells. Tissue Eng Part C Methods. 2012;18(8):583–592. | ||
Llanos P, Contreras-Ferrat A, Barrientos G, Valencia M, Mears D, Hidalgo C. Glucose-dependent insulin secretion in pancreatic β-cell islets from male rats requires Ca2+ release via ROS-stimulated ryanodine receptors. PLoS One. 2015;10(10):e0140198. | ||
Hays LB, Wicksteed B, Wang Y, et al. Intragranular targeting of syncollin, but not a syncollin GFP chimera, inhibits regulated insulin exocytosis in pancreatic beta-cells. J Endocrinol. 2005;185(1):57–67. |
Supplementary material
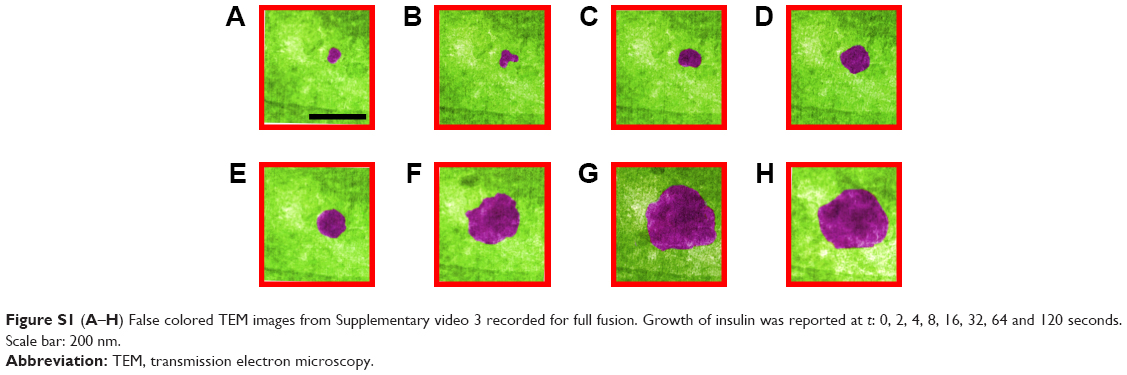 | Figure S1 (A–H) False colored TEM images from Supplementary video 3 recorded for full fusion. Growth of insulin was reported at t: 0, 2, 4, 8, 16, 32, 64 and 120 seconds. Scale bar: 200 nm. |
 © 2019 The Author(s). This work is published and licensed by Dove Medical Press Limited. The
full terms of this license are available at https://www.dovepress.com/terms
and incorporate the Creative Commons Attribution
- Non Commercial (unported, 3.0) License.
By accessing the work you hereby accept the Terms. Non-commercial uses of the work are permitted
without any further permission from Dove Medical Press Limited, provided the work is properly
attributed. For permission for commercial use of this work, please see paragraphs 4.2 and 5 of our Terms.
© 2019 The Author(s). This work is published and licensed by Dove Medical Press Limited. The
full terms of this license are available at https://www.dovepress.com/terms
and incorporate the Creative Commons Attribution
- Non Commercial (unported, 3.0) License.
By accessing the work you hereby accept the Terms. Non-commercial uses of the work are permitted
without any further permission from Dove Medical Press Limited, provided the work is properly
attributed. For permission for commercial use of this work, please see paragraphs 4.2 and 5 of our Terms.