Back to Archived Journals » Advances and Applications in Bioinformatics and Chemistry » Volume 10
In silico-based vaccine design against Ebola virus glycoprotein
Authors Dash R, Das R, Junaid M, Akash MFC, Islam A, Hosen SMZ
Received 26 June 2016
Accepted for publication 21 December 2016
Published 21 March 2017 Volume 2017:10 Pages 11—28
DOI https://doi.org/10.2147/AABC.S115859
Checked for plagiarism Yes
Review by Single anonymous peer review
Peer reviewer comments 2
Editor who approved publication: Dr Juan Fernandez-Recio
Video abstract presented by Zahid Hosen, Raju Dash, and Md Junaid.
Views: 7987
Raju Dash,1 Rasel Das,2 Md Junaid,3 Md Forhad Chowdhury Akash,4 Ashekul Islam,5 SM Zahid Hosen1
1Molecular Modeling and Drug Design Laboratory (MMDDL), Pharmacology Research Division, Bangladesh Council of Scientific and Industrial Research (BCSIR), Chittagong, Bangladesh; 2Nanotechnology and Catalysis Research Center, University of Malaya, Kuala Lumpur, Malaysia; 3Department of Pharmaceutical Sciences, North South University, Dhaka, Bangladesh; 4Department of Pharmacy, BGC Trust University Bangladesh, Chittagong, Bangladesh; 5Department of Biochemistry and Molecular Biology, University of Chittagong, Chittagong, Bangladesh
Abstract: Ebola virus (EBOV) is one of the lethal viruses, causing more than 24 epidemic outbreaks to date. Despite having available molecular knowledge of this virus, no definite vaccine or other remedial agents have been developed yet for the management and avoidance of EBOV infections in humans. Disclosing this, the present study described an epitope-based peptide vaccine against EBOV, using a combination of B-cell and T-cell epitope predictions, followed by molecular docking and molecular dynamics simulation approach. Here, protein sequences of all glycoproteins of EBOV were collected and examined via in silico methods to determine the most immunogenic protein. From the identified antigenic protein, the peptide region ranging from 186 to 220 and the sequence HKEGAFFLY from the positions of 154–162 were considered the most potential B-cell and T-cell epitopes, correspondingly. Moreover, this peptide (HKEGAFFLY) interacted with HLA-A*32:15 with the highest binding energy and stability, and also a good conservancy of 83.85% with maximum population coverage. The results imply that the designed epitopes could manifest vigorous enduring defensive immunity against EBOV.
Keywords: Ebola virus, epitope, glycoprotein, vaccine design
Introduction
Ebola virus (EBOV) is an antisense-strand RNA virus from the Filoviridae family, and it is structurally filamentous.1 Although the initial discovery of EBOV was in 1976, till now more than 24 epidemics have been reported from Africa, mostly with the Zaire species (http://who.int/mediacentre/factsheets/fs103/en/).2–4 The genome of EBOV enciphers the seven structural proteins, ie, nucleoprotein (NP), viral structural proteins (VP35, VP40, VP30, and VP24), glycoprotein (GP), and RNA-dependent RNA polymerase (L).5
Among these, three different versions of glycoprotein are transcribed by the GP gene.6–9 Both attachment protein (GP1) and entry/fusion protein (GP2) are expressed from the full length of the GP chain, which are synthesized from messenger RNAs (mRNAs), containing an additional nontemplated adenosine. The soluble GP (sGP) is synthesized from the unedited RNA transcript. On the contrary, small soluble GP (ssGP) is translated during this process by adding two additional adenosine residues.10 The GPs are expressed virally on the virion surface, which plays a crucial role in the catalysis of membrane fusion and amalgamation to host cells. As a result, it is considered not only a crucial component for vaccines but also an essential target for developing inhibitors and antibodies of attachment and fusion.11–13
With the advances in genomics, proteomics, and the understanding of pathogens, the field of viral vaccine preparation has been recently expanded by a most promising approach, known as epitope-based vaccine design.14 Epitope represents the negligible immunogenic region of a protein sequence, which specifically elicits accurate immune responses.15 Various studies recently reported that the vaccination process based on epitope efficiently educes defensive immune responses against diverse pathogens.16–19 In this context, prediction of epitopes via in silico tools in vaccine designing process can significantly minimize the time and cost required in the development process.
Thereby, based on the available GP sequences of EBOV, this study attempted to design effective epitope-based peptide vaccines (T-cell and B-cell epitope) using various in silico tools. These results offer new epitope vaccine candidates for vaccine development against EBOV.
Materials and methods
The methodologies used for peptide vaccine development are shown in Figure 1.
 | Figure 1 Graphical depiction of the methodologies used in peptide vaccine design. Abbreviations: EBOV, Ebola virus; GP, glycoprotein; RMSF, root mean square function; RMSD, root mean square deviation; MD, molecular dynamics; HLA, human leukocyte antigen; IEDB, immune epitope database. |
Protein sequence retrieval, evaluation analysis, and antigenic protein identification
All available sequences of the GP of EBOV were extracted from the UniProt database.20 After that, multiple sequence alignment was performed by using the ClustalW2 tool, and a phylogenetic tree was assembled by MEGA 6.021 software. And then, VaxiJen v2.022 was used to predict most efficient antigenic protein from the available protein sequences.
T-cell epitope identification and conservancy analysis
T-cell identification was done using the NetCTL 1.2 server,22 setting thresholds at 0.5, 0.89, and 0.94 for sensitivity and accuracy. MHC-I binding of the identified epitopes and epitope conservancy were then calculated using tools from the immune epitope database (IEDB).24–26 These tools calculate the half maximal inhibitory concentration (IC50) value of epitope binding to human leukocyte antigen (HLA) molecules using the stabilized matrix base method.26,27 The restriction for epitope identification was set to 12 MHC-I supertypes. Prior to the run, all the alleles were considered, and the length of the peptides was set at 9.0.
Prediction of population coverage and allergenicity assessment
The population coverage tool from IEDB was applied to determine the population coverage for every single epitope by selecting HLA alleles of the corresponding epitope.
Allergenicity of the predicted epitope was calculated using AllerHunter,27 which can predict both nonallergens and allergens with a high level of accuracy , by comparing the input sequence with the sequence of known allergen.29
Molecular simulation analysis of HLA allele interaction
Design of the three-dimensional structure of epitope and HLA protein
The three-dimensional structures of all the five epitopes were predicted by a PEP-FOLD web-based server.30 For each sequence, this server predicted the five most provable structures, the best of which, having the lowest energy model, was chosen for further analysis.
To validate the binding of identified epitope and HLA molecule, we considered the homology modeling as there is no relevant structure available in the protein data bank. We selected homology modeling using the most popular online protein fold recognition server, Phyre2,31 to generate the three-dimensional structure of HLA-A*32:1532 (accession id: AM422702). Then, ModRefiner33 was used to minimize and correct the hypothetical structure. The validation of the predicted structure was done using PROCHECK,34 verify 3D,35 ERRAT,36 PROVE,37 and QMEAN.38
Docking analysis
Molecular docking analysis was performed using AutoDock Vina,39 by considering HLA molecule as a protein and identified epitopes as ligands. First, we used the protein preparation wizard of UCSF Chimera40 to prepare the hypothetical protein for docking analysis by adding hydrogens and Gasteiger–Marsili charges.41 The prepared file was then converted into pdbqt format. The parameters used for the docking simulation were set to default. The size of the grid box in AutoDock Vina was kept at 36.3095, 54.3374, and 48.025, respectively, for X, Y, and Z. The energy range was kept at 4, according to the default setting. AutoDock Vina was implemented via the shell script offered by AutoDock Vina developers. Docking results were observed by negative score in kcal/mol, as binding affinity of ligands.39
Binding energy estimation and molecular dynamics (MD) simulation
The binding free energy of HLA-epitope complexes were calculated by using MM (CHARMm)42 – Generalized Born Surface Area (GBSA) and Poisson–Boltzmann Surface Area (PBSA) protocols, implemented in Accelrys Discovery Studio 2.5. Using implicit solvent models of GBSA and PBSA, the binding free energy (ΔGbind) for each epitope was calculated by maintaining salt concentration of 0.15 M. Default value was set for conformational entropy and ligand minimization. The distance cutoff value was set to 14.0 Å. The binding energy was calculated by using following equation:
|
The entire dynamics simulation study for the HLA-epitope complex was accomplished in YASARA Dynamics software. Prior to simulation, the complex was cleaned and optimized the hydrogen bond network.43 After that, a cubic simulation cell was created with a periodic boundary condition, and the atoms of the complex were typed using the AMBER1444 force field. The pKa (acid dissociation constant) values of protein titratable amino acids were calculated and solvated the simulation box using the transferable intermolecular potential3 points (TIP3P) water model (density: 0.997 g/L–1). The system consistent with 46406 atoms was energy minimized using the steepest gradient approach (5000 cycles) followed by simulated annealing method. Restrained and unrestrained all-atom molecular dynamics simulation were performed in solvent using the PME method to describe long-range electrostatic interactions at a cut off distance of 8 Å at physiological conditions (298 K, pH 7.4, 0.9% NaCl).45 A multiple time step algorithm together with a simulation time step interval of 2.50 fs was chosen.46 Molecular dynamics simulations of 100 ns long were performed at constant temperature using a Berendsen thermostat and constant pressure. The MD trajectories were saved every 250 ps for analysis. The trajectories generated from the simulation were analyzed for the stability by various evaluative measures viz. RMSD, RMSF (RMS fluctuations), and initial and final protein backbone comparisons using YASARA structure built in macros and VMD software.
Identification of the B-cell epitope
To detect B-cell epitope, various tools from IEDB were used to identify the B-cell antigenicity, together with the Emini surface accessibility prediction,47 Kolaskar and Tongaonkar antigenicity scale,48 Karplus and Schulz flexibility prediction,49 and Bepipred linear epitope prediction analysis.50 Since antigenic parts of a protein belong to the beta turn regions,51 the Chou and Fasman beta turn prediction tool52 was also used.
Results
Evolutionary analysis of the GP sequences
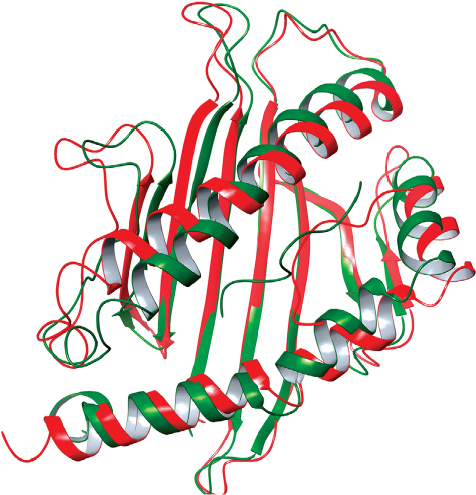
A total of 46 GP sequences from the different variants of EBOV were collected from the UniProtKB database. Multiple sequence alignment analysis was then performed, and a phylogenetic tree (Figure 2) was constructed thereby. Using the unweighted pair-group method with arithmetic mean, a phylogram was constructed using the bootstrap with 1,000 replications in MEGA6.53 From the multiple sequence alignment analysis, it is clearly seen that protein sequences that isolated from various strains were having a close relationship. Also, from the multiple comparison result, the selected sequences of EBOV of the same subtype have 78%–99% similarity. This result also confers the possibilities of mutation in glycoprotein of all strains, which demonstrates a good agreement with the results from Veljkovic et al.54
 | Figure 2 Evolutionary divergence analysis of available glycoproteins of different strains of EBOV; results are represented in a phylogenetic tree. Abbreviations: EBOV, Ebola virus; GP, glycoprotein; sGP, soluble GP. |
Antigenic protein prediction
Protein sequences in this study were considered to screen out using VaxiJen web server for the identification of potent antigenic protein. As a corollary, UniProtKB id: Q9YMG2 was identified as the most potent antigenic protein having a maximum total prediction score of 0.5390. Here the threshold of 0.5 is considered as the potent antigenicity.55 This sequence was used for further analysis.
Prediction of potent T-cell epitope
On the basis of the high combinatorial score, the five best epitopes were predicted by the NetCTL server from the selected protein sequence in a preselected environment. The identified epitopes are represented in Table 1. In combination with several methods such as proteasomal cleavage/transporter associated with antigen processing (TAP)/MHC-I combined predictor, MHC-I processing of the NetCTL server calculates an overall score for each peptide’s intrinsic potential from a protein for the designing of T-cell epitope. Peptides with a higher score represent higher processing capabilities.
 | Table 1 Five most potent T-cell epitopes, according to the overall score predicted by the NetCTL server |
The five T-cell epitopes were subjected to MHC-I binding prediction, using the stabilized matrix base method. The epitopes that elicited higher affinity (IC50 <200 nM) were subjected to afterward analysis (Table 2). Notably, proteins are transformed into peptides by proteasome complex, which cleaved the peptide bonds. By combining with Class I MHC molecules, these peptides were deported to the cell membrane, where they were introduced to T helper cells.
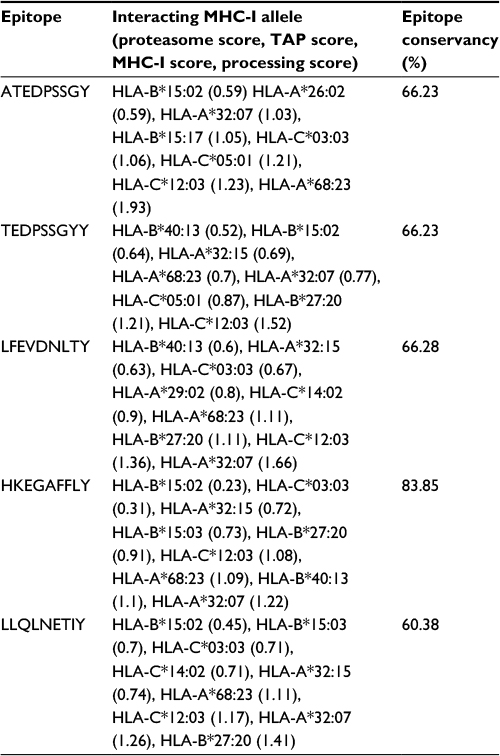 | Table 2 Interaction, binding, and conservancy of identified T-cell epitopes Notes: MHC-I alleles that have an interacting affinity lower than 200 nm are represented, and total processing scores are shown as enclosed numbers. Abbreviations: HLA, human leukocyte antigen; MHC-I, major histocompatibility complex I. |
As shown in Table 2, a 9-mer T-cell epitope HKEGAFFLY was detected to interact with most MHC-I alleles, including HLA-B*15:02; HLA-C*03:03; HLA-A*32:15; HLA-B*15:03; HLA-B*27:20; HLA-C*12:03; HLA-A*68:23; HLA-B*40:13; and HLA-A*32:07 with higher affinity, among the five T-cell epitopes.
Furthermore, this epitope retained the highest conservancy of 83.85%, according to the IEDB conservancy analysis, as tabulated in Table 2. As population coverage in vaccine design generally plays a crucial role, it was calculated in this study.
Population coverage and allergenicity analysis
The cumulative percentage of population coverage was obtained for the predicted epitope HKEGAFFLY. As shown in Table 3, the population coverage for East Africa was found to be 66.98%; in West and North Africa, it was 69.50% and 63.89%, respectively; and for Central Africa it was observed to be 75.93%. The population coverage was recorded at 55.88% for the East Asian region, which was a major hotspot for viral infection. For North America, the population coverage was found to be 58.69%. In current vaccine design pipeline, allergenicity is considered the most prominent barrier in vaccine designing, since most vaccines convert the immune system into an “allergic” reaction56 by inducting Type 2 T helper cells and immunoglobulin E. That is why we predicted allergenicity of the selected epitope by the AllerHunter web server, where the probability is >0.06. The epitope HKEGAFFLY was scored 0.00 (sensitivity =91.6%, specificity =89.3%), and was thus considered a nonallergen, according to the Food and Agriculture Organization/World Health Organization evaluation system of allergenicity prediction.
 | Table 3 Analysis of the population coverage for the proposed epitope against EBOV Notes: aProjected population coverage. bAverage number of epitope hits/HLA combinations recognized by the population. cMinimum number of epitope hits/HLA combinations recognized by 90% of the population. Abbreviations: EBOV, Ebola virus; HLA, human leukocyte antigen. |
Validation of predicted T-cell epitope
As described in the “Materials and methods” section, the hypothetical structure of HLA-A*32:15 protein was generated using the homology technique. The structure was then analyzed through various web-based protein validation software. As shown in Figure 3, the Ramachandran plot generated by the PROCHECK34 server showed that about 98.9% of the residues of protein are located in the most favored region, as against 0% in the outlier region and 1.1% in the generously allowed region. It should be noted that the protein model having >90% of the residues in the core and allowed regions can be considered a high-quality model.57 The hypothetical model was further analyzed using ERRAT and Verify 3D.58 For a good model, structure should retain an ERRAT score >80.00, against which the model in this study obtained an ERRAT score of 89.859.55 Verify 3D graph indicates that 100.00% of residues of this model had an averaged 3D-1D score of 0.2, which is good.59 Along with the QMEAN analysis, the protein model in our interest resulted in a Z-score of −1.33, and the total score was 0.636. This value denotes a higher quality of the model, where the acceptable score ranges between 0 and 1 (Figure 3B).38 On the basis of the results obtained from the aforementioned structural validation programs, the model (Figure 3C) showed much reliability and was considered for further study.
 | Figure 3 Evaluation of structural superiority by (A) Ramachandran plot, (B) QMEAN assessment, and (C) three-dimensional structure of final model of HLA-A*32:15. Abbreviations: PDB, Protein Data Bank; HLA, human leukocyte antigen; SSE, secondary structure element; ACC, accessibility. |
Molecular docking simulation revealed that the proposed epitopes bound in the cleft of the HLA-A*32:15 (Figure S2), where the highest binding affinity was −7.6 kcal/mol (Table S2, observed for the HKEGAFFLY epitope). The Chimera40 program was used to visualize the interactions of docked HLA-A–epitope complexes, as shown in Figures 4 and S2. Then, binding energy calculation was carried out to understand the binding of HLA with epitopes. Here the binding free energies of MM-GBSA and MM-PBSA are approximate free energies of binding, so a more negative value denotes stronger binding. From MM-GBSA analysis, the highest binding free energy was observed for HLA-A*32:15 with epitope (HKEGAFFLY) of –63.89 kj/mol (Table S1). On the contrary, the lowest binding free energy was obtained for ATEDPSSGY epitope, i.e. –44.86 kj/mol. In contrast of MM-GBSA, the HKEGAFFLY epitope was also resulted the highest binding energy of –38.48 kj/mol, while the lowest binding free energy was seen for TEDPSSGYY epitope, –20.98 kj/mol. Since HKEGAFFLY epitope obtained the highest docking affinity and binding free energy, its complex subjected for molecular dynamics simulation.
 | Figure 4 Molecular interaction analysis of HLA-A*32:15 and epitope HKEGAFFLY complex, where the epitope HKEGAFFLY binds in the groove of the HLA-A*32:15, generated by Autodock Vina. Notes: Here, blue color represents the corresponding distances of hydrogen bonding, the red stick model defines the epitope. Abbreviation: HLA, human leukocyte antigen. |
The 100 ns MD simulation of HLA-epitope (HLA-A*32:15-HKEGAFFLY) complex was carried out using AMBER14 force field, following the energy minimization protocol. The stability of the HLA-epitope complex by means of RMSD was calculated and rendered in Figure 5A. From the results, it is revealed that the HLA molecule was stabilized after 5 ns simulation and tended to remain in plateau phase thereafter for rest of the period. The RMSD value of HLA was observed to grow up quickly from 0.48 Å to 2.214 Å and remained stable in the range from 2.0 Å to 3 Å. In case of epitope, similar RMSD pattern was observed, where the order of magnitude was seen to fluctuate in some range. The average energy of the simulation was –578125.270 kj/mol; the average Coulombic charge and van der Waals interactions was –694749.662 kj/mol, 77122.511 kj/mol, respectively. We also calculated the contribution of each residue for both HLA and epitope in the simulation, in terms of RMSF and RMSD. As seen in Figure 6A, highest RMSD was observed for ARG residue at the position of 180 in HLA, while lowest RMSD observed for CYS100. However, this residue was also resulted highest RMSF value of 7.181 Å, while the rests of the residues were in lowest fluctuation. In case of epitope, the histidine residue at the first position and the tyrosine residue in 9th position were seen to be very much flexible, as these residues were resulted with highest RMSD and RMSF (Figure 6B). In the meanwhile, we calculated the number of hydrogen bond formed between the epitope and HLA molecule during the simulation. The results represented in Figure 5B, showed that hydrogen bond at initial stage was 236, and the range decreased to 160. During the simulation, the number of hydrogen bond was at a range of 160–210, which indicates the strong binding of epitope-HLA complex. Hence, all analyses lead to the conclusion that HKEGAFFLY is one of the most prominent T-cell epitopes for GP based designing of vaccine.
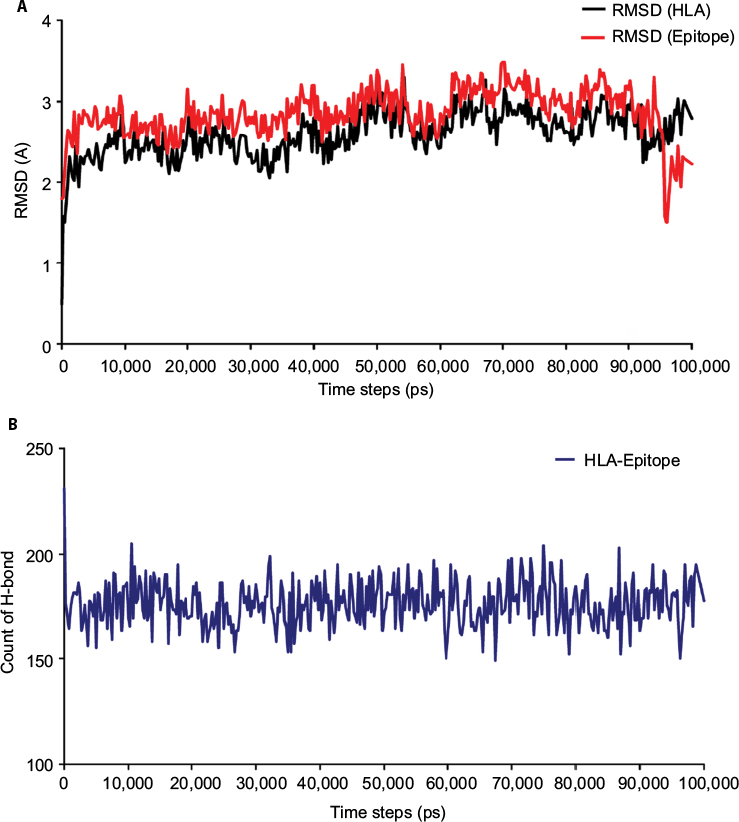 | Figure 5 Time evolutions of (A) the backbone RMSD and (B) the number of hydrogen bonds formed between the epitope-HLA (HLA-A*32:15) complex in binding position. The results are presented with respect to the time (ps) of MD simulation, demonstrating the mechanical stability and flexibility of the complex. Abbreviations: HLA, human leukocyte antigen; MD, molecular dynamics; RMSD, root mean square deviation. |
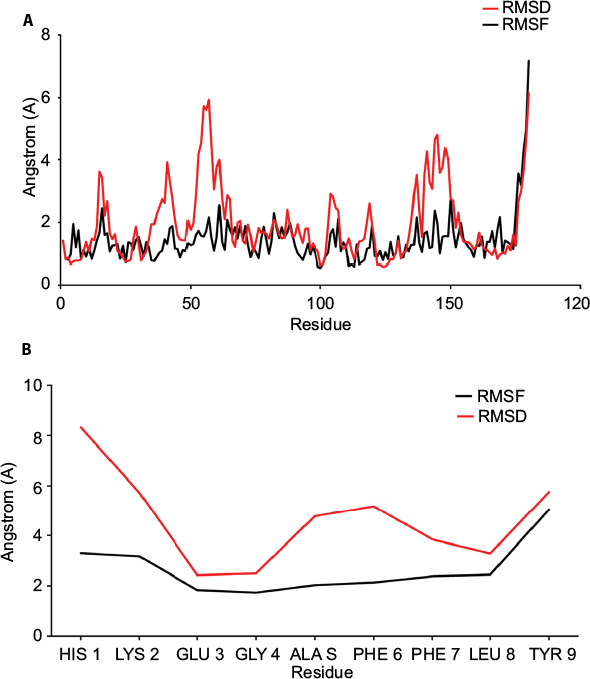 | Figure 6 (A) Plot showing the RMSF (black) and RMSD (red) values of C-alpha atoms from of MD simulation of HLA protein. (B) Plot showing the RMSF (black) and RMSD (red) values of C-alpha atoms from of MD simulation of 9-mer epitope. Here, Y axis represented the RMSD and RMSF values in molecular distance unit, ie, Angstrom (A), while X axis demonstrated the position of residue. Abbreviations: RMSF, root mean square function; RMSD, root mean square deviation; MD, molecular dynamics; HLA, human leukocyte antigen. |
B-cell epitope identification
For the identification of potential B-cell epitopes, amino acid scale base methods have been used in this study. Consistent with this protocol, we used diverse investigation processes for the calculation of an incessant B-cell epitope.
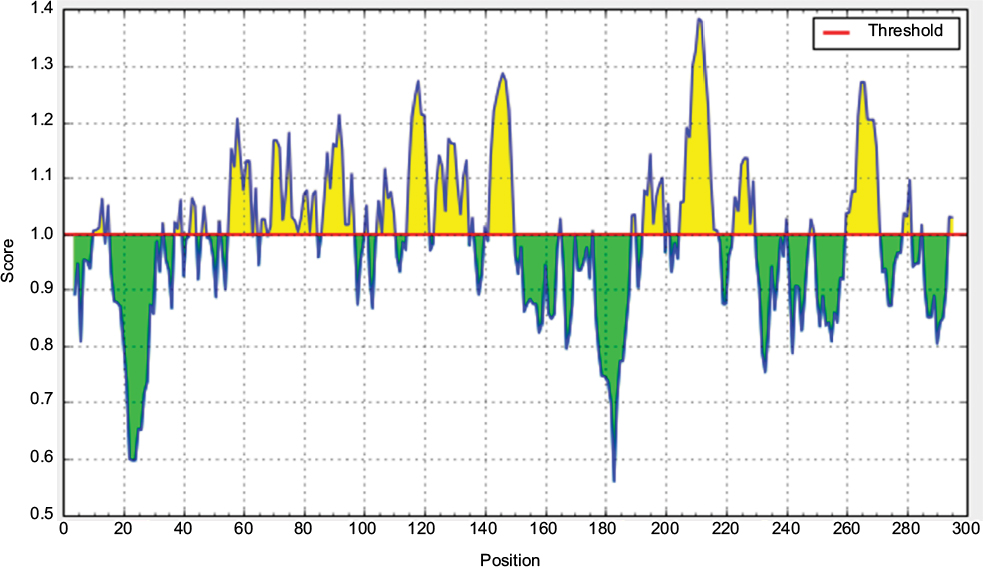
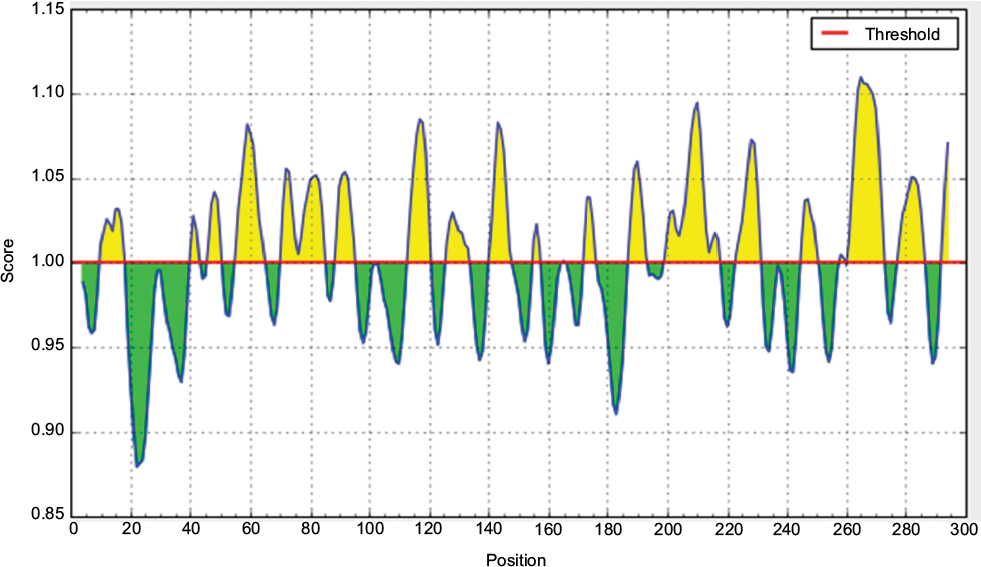
According to the analysis of Kolaskar and Tongaonkar’s48 antigenicity prediction method, the average antigenicity was 1.028, while 1.225 and 0.894 were the maximum and minimum, respectively. The Kolaskar and Tongaonkar48 antigenicity prediction uses a semiempirical method to predict antigenicity on the basis of physicochemical properties of the residues in a protein and their diversity in experimentally known epitopes, where values >1.00 were considered to denote a potential antigen. As summarized in Table 4 and Figure S3, 14 epitopes have been found to satisfy the threshold value, and also have the potentiality to express the B-cell response. Furthermore, the surface accessibility of the protein was also analyzed using the Emini surface accessibility prediction methods, since a potent B-cell epitope should be accessible through the surface.47 As shown in Figure S4 and Table 5, higher accessibility was found in regions 9–17 and 186–223 amino acid residues. Figure S5 represents the β-turns region identified by Chou and Fasman β-turn methods.52 According to the result, the region from 200 to 220 (in the region of 200–220 and 105–150) is regarded as β-turns as well as hydrophilic in nature. These are two properties required to be a potent B-cell epitope.60 Experimentally, antigenicity is related to the protein flexibility.61 That is why we implemented the Karplus and Schulz flexibility prediction method, where it was evident that the regions of 255–280 and 200–220 were regarded as the most flexible (Figure S6). Finally, based on the Hidden Markov model, the Bepipred linear epitope prediction tool was utilized to predict linear B-cell epitopes. The predicted result is rendered and tabulated in Figure S7 and Table 6. Hence, by comparing the foregoing results, the peptide sequences ranging from 186 to 220 are able to provoke the immune response as B-cell epitope for GP-based designing of vaccine.
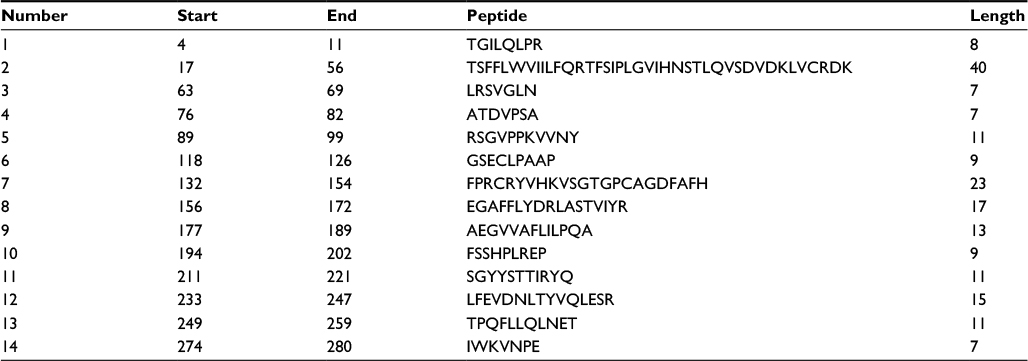 | Table 4 Prediction of antigenic region of the protein by Kolaskar and Tongaonkar antigenicity prediction method |
 | Table 5 Prediction of the Emini surface accessibility of the protein under study |
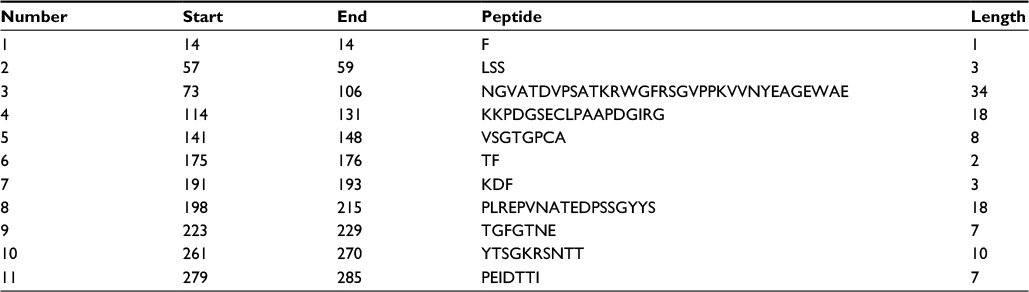 | Table 6 Identification of the Bepipred linear epitope from the protein sequence |
Discussion
In recent trends, the primary focus of vaccine development is very much rely on GPs, as they are involved in cell attachment, fusion and entry as well as assist in invasion; and thus plays the role of pathogenesis of disease. The central role of GP of EBOV therefore makes an appropriate antigenic target for vaccine development; as a result, several reports have been published on this perspective.62–66 However, the information representing the population coverage in the worldwide are still limited. In such case, computational based epitiope screening is very much efficient in context of HLA class I molecules,67 and also much safe, high specificity and cost effective. Therefore, this study incorporated various immunoinformatics and molecular modelling tools to identify potential epitopes present in EBOV GPs.
Initially, a set of 46 glycoprotein sequences from the different strains of EBOV has been subjected to perform multiple sequence alignment. Previous GP sequences analysis of different strains of each EBOV species revealed a high degree of sequence similarity,68,69 and thereby, it is believed that targeting GP from old strain could provide strong and cross reactive immunity against the new strain and previous outbreaks in 2014.70 Interestingly, in our molecular analysis, we have found ~98–99% conservation for the amino acid sequences of different strains within the species, which confers the degree of similarity and support the previous analysis. From this set of GPs, the most antigenic protein sequence was determined by Vaxijen server. Based on auto cross covariance (ACC), the Vaxijen server transform the protein sequence into uniform vectors of physicochemical properties of proteins. With 91% sensitive, 82% accuracy and 72 specificity, the l00-CV (leave one – out cross validation) was used to identify antigenicity of protein for viral species.71 The resultant antigenic protein (VaxiJen score ≥0.5) was then subjected for various immunoinformatics analysis, followed by IEDB web server.
At the beginning five potent 9-mer epitopes have been predicted from NetCTL 1.2 server and selected for further study. Using the threshold of 0.5, the NetCTL 1.2 server predicts maximum number of epitopes without compromising the specificity or sensitivity levels, covering all 12 MHC class I supertypes.23 The five most potent epitopes are represented in Table 1, and the scores are the predicted MHC class I affinities in the form of –logIC50 and IC50 value.
For MHC-I binding prediction, peptides with IC50 values <50 nM are considered high affinity, <500 nM for intermediate affinity, and <5000 nM for low affinity. Therefore, we selected maximum alleles having binding affinity <200 nM.72 It is advocated that T-cell epitope binding to specific multiple HLA supertypes are termed as promiscuous in vaccine design, since they effectively increase the coverage of higher proportions of human populations.73,74 According to the results, both HKEGAFFLY and LFEVDNLTY bind to the highest number of alleles. However, HKEGAFFLY represents highest conservancy and was hence considered as epitope of choice.
We also validated each epitope by molecular docking simulation and MM-GBSA/MM-PBSA studies with HLA-A*32:15 protein, as it was found common in the results from MHC-I binding interaction analysis. Prior of docking simulation, the three dimensional structure of HLA molecule was prepared by using the Phyre2, followed by intensive mood. As a result, 179 residues (99%) of HLA-A*32:15 modelled at >90% accuracy. In these study, 2BCK_Chain A, crystal structure of HLA-A*2402 showed the highest similarity of 90% (Figure S1). The selected model has been chosen from the twenty models generated by Phyre2, on the basis of similarity and confidence level. Phyre2 is one of the best protein prediction servers that allows remote fold reorganization and homology detection. Using hidden Markov model (HMM), this server predicts the structure of given protein sequence by constructing backbone, loop modelling and adding side chains.75 However in intensive mode, additional ab initio approach is used for reconstruction of missing region, backbone and side chain.75 In docking simulation, among the other epitopes, HKEGAFFLY obtained highest binding affinity (Table S1, supplementary material). In addition, MM-PBSA and MM-GBSA techniques are frequently to re-rank docking poses from molecular docking study, as they achieve a much better performance than docking scoring functions.76 Nevertheless, the success rate of the absolute binding free energy prediction strongly depends on the systems.77 Thence, we used both of these solvation models to predict binding energy more accurately, where the results from MM-PBSA examine the accuracy and reliability of the results from MM-GBSA. Results of binding energy calculation are shown in Table S1. The relative magnitude of binding free energy obtained from GB methods is found to be consistent with those calculated using PB method, despite of the differences in the absolute value of salvation energy. As a corollary, these results also demonstrated the consistence with relative stabilities of HLA-epitope complexes. In previous published reports regarding in silico epitope identification of EBOV,78–81 the studies are limited to sequence-based scoring function techniques and some extend to docking simulation. These techniques have certain limitations, though these are very useful.82 In docking simulation of peptide and protein, it faces problem like peptide’s flexibility.83,84 Whereas, energy based approach like molecular mechanics and interaction energy scoring can add valuable information to sequence based results.85,86
Therefore, we have performed MD simulation study of 100 ns long to enhance the predictive power of the peptide affinity calculations to MHC molecule. In molecular dynamics simulation, both epitope and HLA protein were seen to achieve equilibration, while different fluctuations of RMSD were seen by the time evolution. Higher RMSD values of epitope indicate the flexibility in binding with HLA molecule, during the simulation. These results were further confirmed by the analysis of per residue contributions in dynamics simulation by means of RMSF and RMSD. Low values of RMSF indicate the core region of the HLA protein was stable, while high values of RMSD demonstrated the motion of the protein during the simulation. In like manner, the RMSD and RMSF profiles of eptiope confirm the synergic conformation changes to accommodate the binding pocket of HLA. The hydrogen bond occupancy analysis between the HLA-epitope further confirmed the stability of the complex during the simulation. Overall, these results evidently demonstrate that both HLA and epitope have remarkable conformation changes to facilitate the binding and formed stable complex in thermodynamic environment (Figure 7).
 | Figure 7 Conformational illustration of HLA-epitope complex. Here, cartoon structure of green color represents the starting confirmation the complex, while red color represents the confirmation of last step in 100 ns long MD simulation. Abbreviations: MD, molecular dynamics; HLA, human leukocyte antigen. |
It is one of important factors in vaccine design that the distribution of HLA varies according to the diverse ethnic groups and geographic regions around the world. Therefore, wide range of population coverage must be considered during the designing of an effective design. According to the results from population coverage analysis, the epitope HKEGAFFLY showed wide range of population coverage in different regions of the world (Table 3), where the highest coverage was observed Central Africa; one of the most EBOV infected areas. This result indicates that it will specifically bind with the prevalent HLA molecules in the target population, where the vaccine will be employed.
In other aspects, the B-cell epitope stimulates minimal immune unity, which is very much strong enough to elicit a potent humoral immune response, causing no harmful side effects to human body. Thereby, we are also calculated and found that the sequences ranging from 186–220 as a B-cell epitope, by taking consideration of amino acid property, hydrophilicity, accessibility, flexibility, turns, exposed surface, polarity and antigenic propensity. This study could provide a solid base for vaccine design.
Conclusion
In recent years, most vaccines have been developed based on B-cell immunity; however, the current strategy relies mostly on T-cell epitope owing to long-lasting immunity. Both B-cell and T-cell epitopes are offered in this study for stimulating immunity in several ways. The resulting peptides showed B-cell and T-cell selectivity, better conservancy, population coverage, and significant interaction with MHC-1 allele with good affinity. Above all, the predicted epitopes are anticipated to offer long-term and high protective immunity against EBOV.
Disclosure
The authors report no conflicts of interest in this work.
References
Groseth A, Hoenen T, Eickmann M, Becker S. Filoviruses: Ebola, Marburg and Disease. New York, NY: John Wiley & Sons Ltd; 2001. | ||
Bastug A, Bodur H. Ebola viral disease: what should be done to combat the epidemic in 2014? Turk J Med Sci. 2015;45(1):1–5. | ||
Kilgore PE, Grabenstein JD, Salim AM, Rybak M. Treatment of ebola virus disease. Pharmacotherapy. 2015;35(1):43–53. | ||
Dixon MG, Schafer IJ. Ebola viral disease outbreak – West Africa, 2014. MMWR Morb Mortal Wkly Rep. 2014;63(25):548–551. | ||
Ikegami T, Calaor AB, Miranda ME, et al. Genome structure of Ebola virus subtype Reston: differences among Ebola subtypes. Brief report. Arch Virol. 2001;146(10):2021–2027. | ||
Volchkova VA, Dolnik O, Martinez MJ, Reynard O, Volchkov VE. Genomic RNA editing and its impact on Ebola virus adaptation during serial passages in cell culture and infection of guinea pigs. J Infect Dis. 2011;204(Suppl 3):S941–S946. | ||
Mehedi M, Hoenen T, Robertson S, et al. Ebola virus RNA editing depends on the primary editing site sequence and an upstream secondary structure. PLoS Pathog. 2013;9(10):e1003677. | ||
Shabman RS, Jabado OJ, Mire CE, et al. Deep sequencing identifies noncanonical editing of Ebola and Marburg virus RNAs in infected cells. MBio. 2014;5(6):e02011. | ||
Radoshitzky SR, Warfield KL, Chi X, et al. Ebolavirus delta-peptide immunoadhesins inhibit marburgvirus and ebolavirus cell entry. J Virol. 2011;85(17):8502–8513. | ||
de La Vega M-A, Wong G, Kobinger GP, Qiu X. The multiple roles of sGP in Ebola pathogenesis. Viral Immunol. 2015;28(1):3–9. | ||
Lee JE, Saphire EO. Ebolavirus glycoprotein structure and mechanism of entry. Future virol. 2009;4(6):621–635. | ||
Lee JE, Fusco ML, Hessell AJ, Oswald WB, Burton DR, Saphire EO. Structure of the Ebola virus glycoprotein bound to an antibody from a human survivor. Nature. 2008;454(7201):177–182. | ||
Wu S, Yu T, Song X, Yi S, Hou L, Chen W. Prediction and identification of mouse cytotoxic T lymphocyte epitopes in Ebola virus glycoproteins. Virol J. 2012;9(1):1–7. | ||
Sharmin R, Islam AB. A highly conserved WDYPKCDRA epitope in the RNA directed RNA polymerase of human coronaviruses can be used as epitope-based universal vaccine design. BMC Bioinformatics. 2014;15(161):1471–2105. | ||
Purcell AW, McCluskey J, Rossjohn J. More than one reason to rethink the use of peptides in vaccine design. Nat Rev Drug Discov. 2007;6(5):404–414. | ||
Firbas C, Jilma B, Tauber E, et al. Immunogenicity and safety of a novel therapeutic hepatitis C virus (HCV) peptide vaccine: a randomized, placebo controlled trial for dose optimization in 128 healthy subjects. Vaccine. 2006;24(20):4343–4353. | ||
Staneková Z, Varečková E. Conserved epitopes of influenza A virus inducing protective immunity and their prospects for universal vaccine development. Virol J. 2010;7(1):1. | ||
He L, Cheng Y, Kong L, et al. Approaching rational epitope vaccine design for hepatitis C virus with meta-server and multivalent scaffolding. Sci. Rep. 2015;5. | ||
Sominskaya I, Skrastina D, Dislers A, et al. Construction and immunological evaluation of multivalent hepatitis B virus (HBV) core virus-like particles carrying HBV and HCV epitopes. Clin Vaccine Immunol. 2010;17(6):1027–1033. | ||
Apweiler R, Bairoch A, Wu CH, et al. UniProt: the Universal Protein knowledgebase. Nucleic Acids Res. 2004;32(Database issue):D115–D119. | ||
Larkin MA, Blackshields G, Brown NP, et al. Clustal W and Clustal X version 2.0. Bioinformatics. 2007;23(21):2947–2948. | ||
Doytchinova IA, Flower DR. VaxiJen: a server for prediction of protective antigens, tumour antigens and subunit vaccines. BMC Bioinformatics. 2007;8:4. | ||
Larsen MV, Lundegaard C, Lamberth K, Buus S, Lund O, Nielsen M. Large-scale validation of methods for cytotoxic T-lymphocyte epitope prediction. BMC bioinformatics. 2007;8:424. | ||
Bui HH, Sidney J, Li W, Fusseder N, Sette A. Development of an epitope conservancy analysis tool to facilitate the design of epitope-based diagnostics and vaccines. BMC Bioinformatics. 2007;8:361. | ||
Buus S, Lauemoller SL, Worning P, et al. Sensitive quantitative predictions of peptide-MHC binding by a ‘Query by Committee’ artificial neural network approach. Tissue Antigens. 2003;62(5):378–384. | ||
Peters B, Sette A. Generating quantitative models describing the sequence specificity of biological processes with the stabilized matrix method. BMC Bioinformatics. 2005;6:132. | ||
Tenzer S, Peters B, Bulik S, et al. Modeling the MHC class I pathway by combining predictions of proteasomal cleavage, TAP transport and MHC class I binding. Cell Mol Life Sci. 2005;62(9):1025–1037. | ||
Muh HC, Tong JC, Tammi MT. AllerHunter: a SVM-pairwise system for assessment of allergenicity and allergic cross-reactivity in proteins. PLoS One. 2009;4(6):0005861. | ||
Liao L, Noble WS. Combining pairwise sequence similarity and support vector machines for detecting remote protein evolutionary and structural relationships. J Comput Biol. 2003;10(6):857–868. | ||
Thevenet P, Shen Y, Maupetit J, Guyon F, Derreumaux P, Tuffery P. PEP-FOLD: an updated de novo structure prediction server for both linear and disulfide bonded cyclic peptides. Nucleic Acids Res. 2012;40(Web Server issue):11. | ||
Kelley LA, Sternberg MJ. Protein structure prediction on the Web: a case study using the Phyre server. Nat Protoc. 2009;4(3):363–371. | ||
Heinold A, Bauer M, Opelz G, Scherer S, Schmidt AH, Tran TH. Identification and characterization of three novel HLA alleles, HLA-A*240214, HLA-A*3215 and HLA-DQB1*060302. Tissue Antigens. 2007;70(6):511–514. | ||
Xu D, Zhang Y. Improving the physical realism and structural accuracy of protein models by a two-step atomic-level energy minimization. Biophys J. 2011;101(10):2525–2534. | ||
Laskowski RA, Rullmannn JA, MacArthur MW, Kaptein R, Thornton JM. AQUA and PROCHECK-NMR: programs for checking the quality of protein structures solved by NMR. J Biomol NMR. 1996;8(4):477–486. | ||
Eisenberg D, Luthy R, Bowie JU. VERIFY3D: assessment of protein models with three-dimensional profiles. Methods Enzymol. 1997;277:396–404. | ||
Colovos C, Yeates TO. Verification of protein structures: patterns of nonbonded atomic interactions. Protein Sci. 1993;2(9):1511–1519. | ||
Pontius J, Richelle J, Wodak SJ. Deviations from standard atomic volumes as a quality measure for protein crystal structures. J Mol Biol. 1996;264(1):121–136. | ||
Benkert P, Tosatto SC, Schomburg D. QMEAN: A comprehensive scoring function for model quality assessment. Proteins. 2008;71(1):261–277. | ||
Trott O, Olson AJ. AutoDock Vina: improving the speed and accuracy of docking with a new scoring function, efficient optimization, and multithreading. J Comput Chem. 2010;31(2):455–461. | ||
Pettersen EF, Goddard TD, Huang CC, et al. UCSF Chimera--a visualization system for exploratory research and analysis. J Comput Chem. 2004;25(13):1605–1612. | ||
Dunbrack RL, Jr. Rotamer libraries in the 21st century. Curr Opin Struct Biol. 2002;12(4):431–440. | ||
Vanommeslaeghe K, Hatcher E, Acharya C, et al. CHARMM General Force Field (CGenFF): A force field for drug-like molecules compatible with the CHARMM all-atom additive biological force fields. J Computat Chem. 2010;31(4):671–690. | ||
Krieger E, Dunbrack RL, Jr., Hooft RW, Krieger B. Assignment of protonation states in proteins and ligands: combining pKa prediction with hydrogen bonding network optimization. Methods Mol Biol. 2012;819:405–421. | ||
Dickson CJ, Madej BD, Skjevik ÅA, et al. Lipid14: the amber lipid force field. J Chem Theory Comput. 2014;10(2):865–879. | ||
Krieger E, Nielsen JE, Spronk CA, Vriend G. Fast empirical pKa prediction by Ewald summation. J Mol Graph Model. 2006;25(4):481–486. | ||
Krieger E, Vriend G. New ways to boost molecular dynamics simulations. J Comput Chem. 2015;36(13):996–1007. | ||
Emini EA, Hughes JV, Perlow DS, Boger J. Induction of hepatitis A virus-neutralizing antibody by a virus-specific synthetic peptide. J Virol. 1985;55(3):836–839. | ||
Kolaskar AS, Tongaonkar PC. A semi-empirical method for prediction of antigenic determinants on protein antigens. FEBS Lett. 1990;276(1–2):172–174. | ||
Karplus PA, Schulz GE. Prediction of chain flexibility in proteins. Naturwissenschaften. 1985;72(4):212–213. | ||
Larsen JE, Lund O, Nielsen M. Improved method for predicting linear B-cell epitopes. Immunome Res. 2006;2:2. | ||
Rini JM, Schulze-Gahmen U, Wilson IA. Structural evidence for induced fit as a mechanism for antibody-antigen recognition. Science. 1992;255(5047):959–965. | ||
Chou PY, Fasman GD. Empirical predictions of protein conformation. Annu Rev Biochem. 1978;47:251–276. | ||
Tamura K, Stecher G, Peterson D, Filipski A, Kumar S. MEGA6: molecular evolutionary genetics analysis version 6.0. Mol Biol Evol. 2013;30(12):2725–2729. | ||
Veljkovic V, Glisic S, Muller CP, et al. In silico analysis suggests interaction between Ebola virus and the extracellular matrix. Front Microbiol. 2015;6. | ||
Monterrubio-López GP, González-Y-Merchand JA, Ribas-Aparicio RM. Identification of novel potential vaccine candidates against tuberculosis based on reverse vaccinology. Biomed Res Int. 2015;2015:483150. | ||
McKeever TM, Lewis SA, Smith C, Hubbard R. Vaccination and allergic disease: a birth cohort study. Am J Public Health. 2004;94(6):985–989. | ||
Dash R, Hosen SZ, Sultana T, et al. Computational Analysis and Binding Site Identification of Type III Secretion System ATPase from Pseudomonas aeruginosa. Interdiscip Sci. 2015:1–9. | ||
Bowie JU, Luthy R, Eisenberg D. A method to identify protein sequences that fold into a known three-dimensional structure. Science. 1991;253(5016):164–170. | ||
Daydé-Cazals B, Fauvel B, Singer M, et al. Rational design, synthesis, and biological evaluation of 7-Azaindole derivatives as potent focused multi-targeted kinase inhibitors. J Med Chem. 2016;59(8):3886–3905. | ||
Rose GD, Gierasch LM, Smith JA. Turns in peptides and proteins. Adv Protein Chem. 1985;37:1–109. | ||
Novotny J, Handschumacher M, Haber E, et al. Antigenic determinants in proteins coincide with surface regions accessible to large probes (antibody domains). Proc Natl Acad Sci U S A. 1986;83(2):226–230. | ||
Henao-Restrepo AM, Longini IM, Egger M, et al. Efficacy and effectiveness of an rVSV-vectored vaccine expressing Ebola surface glycoprotein: interim results from the Guinea ring vaccination cluster-randomised trial. The Lancet. 2015;386(9996):857–866. | ||
Wu S, Kroeker A, Wong G, et al. An adenovirus vaccine expressing Ebola virus variant makona glycoprotein is efficacious in Guinea Pigs and nonhuman primates. J Infect Dis. Aug 4 2016. | ||
Zhang Q, Gui M, Niu X, et al. Potent neutralizing monoclonal antibodies against Ebola virus infection. Sci Rep. 2016;6:25856. | ||
Davidson E, Bryan C, Fong RH, et al. Mechanism of binding to Ebola virus glycoprotein by the ZMapp, ZMAb, and MB-003 cocktail antibodies. J virol. 2015;89(21):10982–10992. | ||
Milligan ID, Gibani MM, Sewell R, et al. Safety and immunogenicity of novel adenovirus type 26- and modified vaccinia ankara-vectored Ebola vaccines: a randomized clinical trial. Jama. Apr 19 2016;315(15):1610–1623. | ||
Sundar K, Boesen A, Coico R. Computational prediction and identification of HLA-A2. 1-specific Ebola virus CTL epitopes. Virology. 2007;360(2):257–263. | ||
Ponomarenko J, Vaughan K, Sette A, Maurer-Stroh S. Conservancy of mAb epitopes in Ebolavirus glycoproteins of previous and 2014 outbreaks. PLoS Curr. 2014;6:1–13. | ||
Sanchez A, Ksiazek TG, Rollin PE, et al. Detection and molecular characterization of Ebola viruses causing disease in human and nonhuman primates. J Infect Dis. 1999;179(Suppl 1):S164–S169. | ||
Sridhar S. Clinical development of Ebola vaccines. Ther Adv Vaccines. 2015;3(5–6):125–138. | ||
Verma SK, Yadav S, Kumar A. In silico prediction of B- and T- cell epitope on Lassa virus proteins for peptide based subunit vaccine design. Adv Biomed Res. 2015;4:201. | ||
Mostafa SM, Islam AB. An in silico approach predicted potential therapeutics that can confer protection from maximum pathogenic Hantaviruses. Future Virology. 2016;11(6):411–428. | ||
Wilson CC, McKinney D, Anders M, et al. Development of a DNA vaccine designed to induce cytotoxic T lymphocyte responses to multiple conserved epitopes in HIV-1. J Immunol. 2003;171(10):5611–5623. | ||
Vani J, Shaila M, Chandra N, Nayak R. A combined immuno-informatics and structure-based modeling approach for prediction of T cell epitopes of secretory proteins of Mycobacterium tuberculosis. Microbes Infect. 2006;8(3):738–746. | ||
Kelley LA, Mezulis S, Yates CM, Wass MN, Sternberg MJE. The Phyre2 web portal for protein modeling, prediction and analysis. Nat Protocols. 2015;10(6):845–858. | ||
Genheden S, Ryde U. The MM/PBSA and MM/GBSA methods to estimate ligand-binding affinities. Expert Opin Drug Discov. 2015;10(5):449–461. | ||
Deng Y, Roux B. Computations of Standard Binding Free Energies with Molecular Dynamics Simulations. J Phys Chem B. 2009;113(8):2234–2246. | ||
Oany AR, Sharmin T, Chowdhury AS, Jyoti TP, Hasan MA. Highly conserved regions in Ebola virus RNA dependent RNA polymerase may be act as a universal novel peptide vaccine target: a computational approach. In Silico Pharmacol. 2015;3:7. | ||
Dikhit MR, Kumar S, Vijaymahantesh, et al. Computational elucidation of potential antigenic CTL epitopes in Ebola virus. Infect Genet Evol. 2015;36:369–375. | ||
Khan MA, Hossain MU, Rakib-Uz-Zaman SM, Morshed MN. Epitope-based peptide vaccine design and target site depiction against Ebola viruses: an immunoinformatics study. Scand J Immunol. 2015;82(1):25–34. | ||
Ali MT, Islam MO. A highly conserved GEQYQQLR epitope has been identified in the nucleoprotein of Ebola virus by using an in silico approach. Adv Bioinformatics. 2015;2015:278197. | ||
Stavrakoudis A. Conformational flexibility in designing peptides for immunology: the molecular dynamics approach. Curr Comput Aided Drug Des. 2010;6(3):207–222. | ||
Chandrika B-R, Subramanian J, Sharma SD. Managing protein flexibility in docking and its applications. Drug Discov Today. 2009;14(7):394–400. | ||
Legge F, Budi A, Treutlein H, Yarovsky I. Protein flexibility: Multiple molecular dynamics simulations of insulin chain B. Biophys Chem. 2006;119(2):146–157. | ||
Wan S, Flower DR, Coveney PV. Toward an atomistic understanding of the immune synapse: Large-scale molecular dynamics simulation of a membrane-embedded TCR–pMHC–CD4 complex. Mol Immunol. 2008;45(5):1221–1230. | ||
Petrone PM, Garcia AE. MHC–peptide binding is assisted by bound water molecules. J Mol Biol. 2004;338(2):419–435. |
Supplementary materials
 | Figure S1 Multiple sequence alignment and secondary structure predictions of query sequence (HLA*A15:02) and template sequence (PDB: 2BCK). Notes: Green color represents alpha helix, whereas beta sheet is represented by blue color. Abbreviations: HLA, human leukocyte antigen; PDB, Protein Data Bank. |
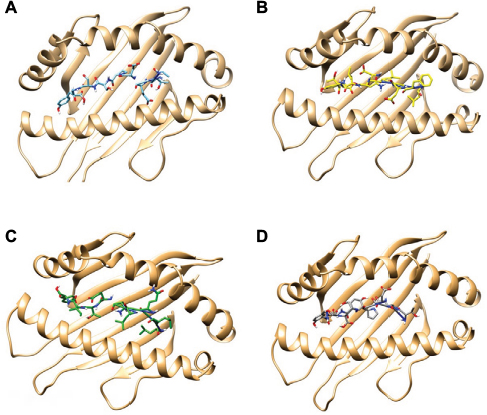 | Figure S2 Visualization of the best docked HLA–epitope complexes obtained from molecular docking analysis. The complexes are representing the interaction of HLA (HLA*A15:02) with (A) ATEDPSSGY, (B) TEDPSSGYY, (C) LFEVDNLTY, and (D) LLQLNETIY epitope. Abbreviation: HLA, human leukocyte antigen. |
 | Figure S3 Kolaskar and Tongaonkar antigenicity prediction of the most antigenic protein. Notes: Here, the x-axis and y-axis represent sequence position and antigenic propensity, respectively. The threshold value is 1.000. The regions above the threshold are antigenic, shown in yellow while, green color reflects the polypeptide regions that could not satisfy the threshold margin. |
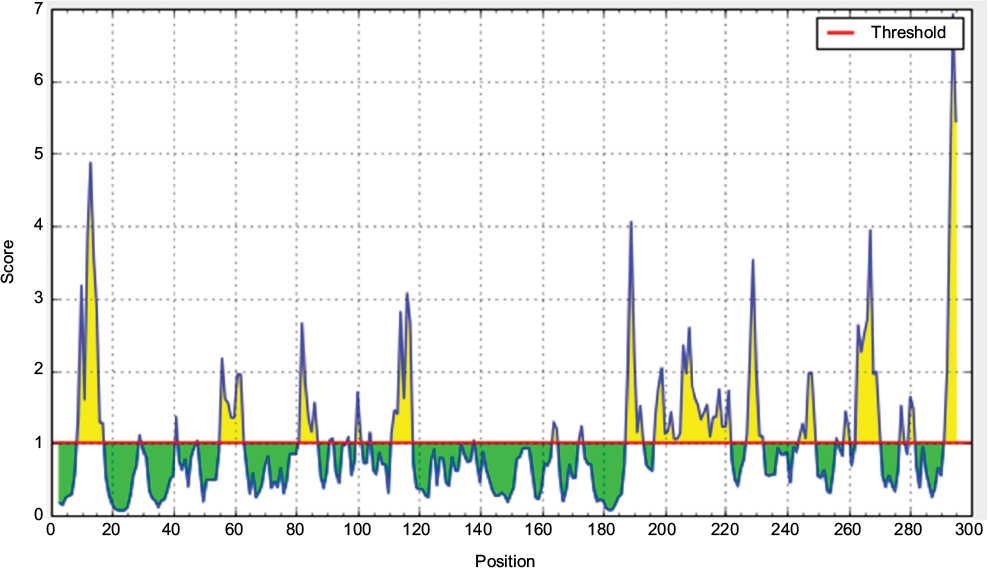 | Figure S4 Emini surface accessibility prediction of the most antigenic protein. Notes: Here, the x-axis and y-axis represent sequence position and antigenic propensity, respectively. The threshold value is 1.000. The regions above the threshold are antigenic, shown in yellow while, green color reflects the polypeptide regions that could not satisfy the threshold margin. |
 | Figure S5 Chou and Fasman β-turn prediction of the most antigenic protein. Notes: Here, the x-axis and y-axis represent sequence position and antigenic propensity, respectively. The threshold value is 1.000. The regions above the threshold are antigenic, shown in yellow while, green color reflects the polypeptide regions that could not satisfy the threshold margin. |
 | Figure S6 Karplus and Schulz flexibility prediction. Notes: Here, x-axis and y-axis represent position and score, respectively. The threshold is 1.00. The flexible regions are shown in yellow while, green color reflects the polypeptide regions that could not satisfy the threshold margin. |
 | Figure S7 Bepipred linear epitope prediction of the most antigenic protein. Notes: Here, x-axis and y-axis represent position and score, respectively. The threshold is 0.35. The flexible regions are shown in yellow while, green color reflects the polypeptide regions that could not satisfy the threshold margin. |
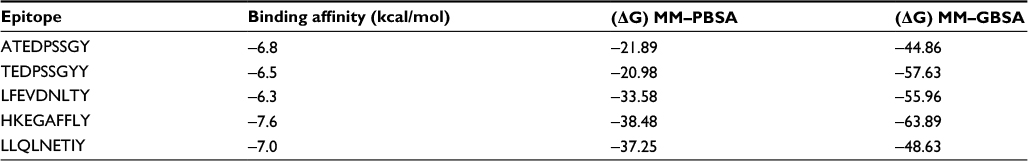 | Table S1 Results of binding affinity and binding energy calculations of the selected epitopes |
 © 2017 The Author(s). This work is published and licensed by Dove Medical Press Limited. The
full terms of this license are available at https://www.dovepress.com/terms
and incorporate the Creative Commons Attribution
- Non Commercial (unported, 3.0) License.
By accessing the work you hereby accept the Terms. Non-commercial uses of the work are permitted
without any further permission from Dove Medical Press Limited, provided the work is properly
attributed. For permission for commercial use of this work, please see paragraphs 4.2 and 5 of our Terms.
© 2017 The Author(s). This work is published and licensed by Dove Medical Press Limited. The
full terms of this license are available at https://www.dovepress.com/terms
and incorporate the Creative Commons Attribution
- Non Commercial (unported, 3.0) License.
By accessing the work you hereby accept the Terms. Non-commercial uses of the work are permitted
without any further permission from Dove Medical Press Limited, provided the work is properly
attributed. For permission for commercial use of this work, please see paragraphs 4.2 and 5 of our Terms.