Back to Journals » International Journal of Nanomedicine » Volume 10 » Issue 1
Improvement of fluvastatin bioavailability by loading on nanostructured lipid carriers
Received 1 July 2015
Accepted for publication 3 August 2015
Published 16 September 2015 Volume 2015:10(1) Pages 5797—5804
DOI https://doi.org/10.2147/IJN.S91556
Checked for plagiarism Yes
Review by Single anonymous peer review
Peer reviewer comments 2
Editor who approved publication: Dr Thomas Webster
Abdel-Rahim M El-Helw, Usama A Fahmy
Department of Pharmaceutics and Industrial Pharmacy, Faculty of Pharmacy, King Abdulaziz University, Jeddah, Saudi Arabia
Abstract: The aim of this study is to prepare fluvastatin nanostructured lipid carriers (FLV-NLCs) in order to find an innovative way to alleviate FLV-associated disadvantages. The limitations include poor solubility and extensive first-pass metabolism, resulting in low (30%) bioavailability and short elimination half-life (1–3 hours). FLV-NLCs were prepared by hot emulsification–ultrasonication method. Ten runs were created by three-level factorial design (32) to optimize FLV-NLCs formulation process. In this study, two factors, four responses, and three-level factorial design were endorsed. The studied variables were lipid:oil ratio (X1) and sonication time (X2). However, the responses parameter determined the particle size (Y1, nm), entrapment efficiency percent (EE%, Y2), particles zeta potential (Y3), and 80% of the drug release after 24 hours (X4). Furthermore, stability and in vivo pharmacokinetics were studied in rats. The optimized consisted formula had an average particle size of 165 nm with 75.32% entrapment efficiency and 85.32% of drug released after 24 hours, demonstrating a sustaining drug release over 24 hours. An in vivo pharmacokinetic study revealed enhanced bioavailability by >2.64-fold, and the mean residence time was longer than that of FLV. We concluded that NLCs could be promising carriers for sustained/prolonged FLV release with enhanced oral bioavailability.
Keywords: factorial design, nano-vesicles, hyperlipidemia, statins
Introduction
The elevation of low-density lipoproteins (LDLs) in plasma concentration leads to narrowing of the blood vessels that carries the risk of atherosclerosis, coronary heart disease, and plagues formation with life-threatening consequences.1 Fluvastatin (FLV) is one of the statins family, which is considered as the first-line defense against hyperlipidemia.2 FLV suppresses cholesterol formation in the liver through inhibiting the HMG-CoA reductase enzyme.3 FLV has some disadvantages, including poor bioavailability (~30%) as a result of low solubility, and short half-life (t1/2) of 1–3 hours, and therefore, short duration of action.4 Also, by taking into consideration the long-term use of FLV, it is an essential requirement to enhance FLV bioavailability and sustain its release that will lower both the dose and the frequency, hence improve patient tolerability.
Nanostructured lipid carriers (NLCs) are a second-generation smart drug carrier system and have a solid matrix at the room temperature. This carrier system is made up of physiological, biodegradable lipid materials that have multiple advantages such as a wide range of application, compatibility with body fluids, and high efficiency to improve the bioavailability of low soluble drugs.5 The aim of this study is to enhance FLV bioavailability by increasing its absorption and also to sustain its release through loading it on NLCs and modification of FLV particle size, thus decreasing the dose and dose frequency so, decrease its side effects.
Materials
FLV was purchased from Xian Sonwu Biotech Co., Ltd. (Shaanxi Province, People’s Republic of China). Compritol® 888 ATO and Gelucire® 44/14 were granted from Gattefossé (Saint-Priest, France); almond oil was purchased from Sigma-Aldrich Co. (St Louis, MO, USA), and l-phosphatidylcholine (soya 95%) was purchased from Avanti Polar Lipids (Birmingham, England). All other reagents and chemicals were of analytical grade.
Experimental design
Ten runs were created by three-level factorial design (32) using Statgraphics Plus, Version 4 (Manugistics Inc., Rockville, MD, USA) to optimize fluvastatin nanostructured lipid carrier (FLV-NLC) formulation process. In this study, two factors, four responses, and three-level factorial design were endorsed. The variables studied were lipid:oil ratio (X1) and sonication time (X2), while the particle size (Y1, nm), entrapment efficiency percent (EE%, Y2), and particles zeta potential (Y3) 80% of drug release after 24 hours (X4) were selected as the responses parameters. According to the experimental design, the actual values of the independent variables as well as the observed values for the responses parameters were presented in Table 1.
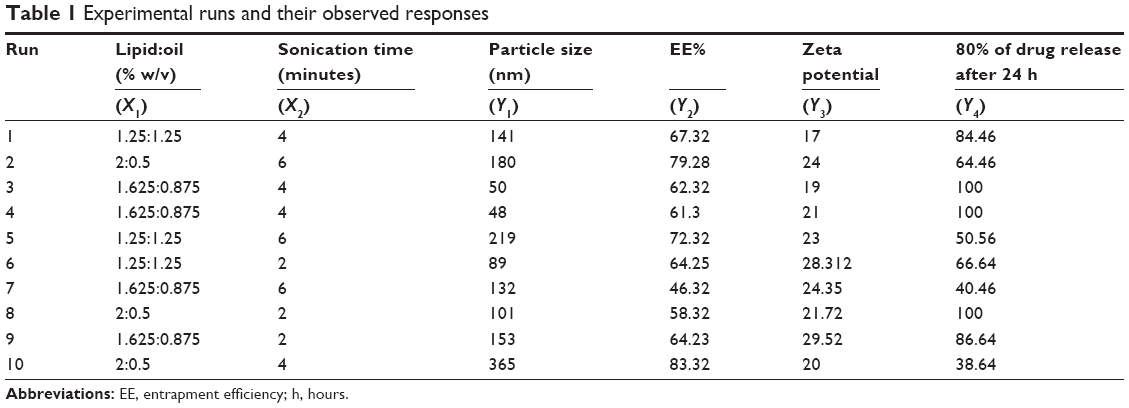 | Table 1 Experimental runs and their observed responses |
NLCs were prepared by hot emulsification–ultrasonication method.6 Briefly, oil, lipid, phospholipid, and FLV were placed in a beaker and heated up to 60°C. Gelucire® 44/14 was dissolved in distilled water, heated to 60°C, and then added to the lipid layer. The produced suspension was then homogenized by an IKA Ultra, Turrax-T8 homogenizer (IKA, Wilmington, NC, USA) at 20,000 rpm for 3 minutes, and then ultrasonicated by Sonics VC750 (Newtown, CT, USA) at 35% amplitude at the sonication times specified in Table 1 to obtain an oil-in-water (o/w) emulsion. Finally, it was added to a specified volume of distilled water. All NLCs produced were characterized. The emulsion was left to cool at room temperature.
Characterization of FLV-NLCs
FLV-NLCs surface morphology
Surface morphology of the optimized FLV-NLCs was identified using scanning electron microscope (Philips XL30, Eindhoven, the Netherlands). After centrifugation, the precipitated FLV-NLCs were separated from the supernatant and diluted with 10% w/v lactose solution (1:1) as cryoprotectant and finally subjected to freeze-drying. The lyophilized sample was coated with gold before investigation.
Particles size and zeta potential
The size and zeta potential of FLV-NLCs were measured by photon correlation spectroscopy using a Zetasizer (Zetatrac, Mongomeryville, PA, USA). Samples were appropriately diluted with the aqueous phase of the formulation to get an optimum of 50–200 kilo counts per second (kcps).
Entrapment efficiency measurement
Free FLV aqueous dispersion, which was measured after ultracentrifugation of each formula to 100,000 rpm for 1 hour using Hitachi ultracentrifuge CP100WX, Hitachi, Koki Co., Ltd. (Hitachi, Tokyo, Japan). One milliliter of the supernatant was diluted with distilled water and injected into the high-performance liquid chromatography (HPLC) system.
Entrapment efficiency (EE)% was calculated as in Equation 1:
|
|

where Fs is the soluble free drug and Ts is the initial amount of drug added during the preparation of NLCs.
Stability study
Three freeze-thaw cycles (−20°C and +25°C) were performed on these formulae to study the stability of the formulae. The particle size, zeta potential, and EE% were then measured.
Drug release study
Drug release study was performed according to the dialysis bag method.7 Briefly, FLV-NLCs suspension with a cutoff molecular weight of 12 kDa was placed in the dialysis bags (Sigma-Aldrich Co.) and immersed in 500 mL 0.01 M potassium dihydrogen orthophosphate buffer with pH 7.4 at 37°C in a dissolution apparatus with a paddle rotating at 50 rpm. Aliquots of the sample (5 mL) were taken from the dissolution medium after 0.5, 1, 2, 4, 6, 8, 12, and 24 hours. FLV content were analyzed by using an HPLC system Agilent 1,200 infinity series, equipped with a ultra violet (UV) diode array detector and an automatic sampling system, Agilent Technologies (Santa Clara, CA, USA).
Experimental animals
All experimental protocols were approved by the Animal Ethics Committee of Beni Suef University (Beni-Suef, Egypt) and conformed to the Declaration of Helsinki, the Guiding Principle in Care and Use of Animals (DHEW publication NIH 80-23), and the “Principles of Laboratory Animal Care” (NIH publication #85-23, revised in 1985). Male Wistar rats (300±20 g) were used for the pharmacokinetic study. The rats were acclimated for at least 7 days in environmentally controlled cages (22°C±1°C and 12/12-hour dark/light cycle) with free access to standard food and water.
Bioavailability study
The rats were divided into two groups, with four rats in each group. The rats fasted overnight before the experiments. The first group administered an oral dose of FLV (2 mg/kg) suspended in water (1 mL) and the second group administered a FLV-NLC dose (equivalent to 2 mg/kg FLV). Pharmacokinetic parameters based on FLV plasma concentrations were analyzed using Excel add-in program, PKSolver software,8 using a noncompartmental model. Maximum plasma concentration (Cmax), time to maximum concentration (Tmax), area under the plasma concentration–time curve (AUC), total body clearance (CLT), mean residency time (MRT0–∞_obs), and volume of body distribution (Vz/F_obs) were calculated for each rat.
Statistical analysis of data
Data are presented as mean ± SD. Significant differences between the pharmacokinetic data were tested using analysis of variance (ANOVA), followed by Tukey’s multiple comparisons test; the confidence level was set at P<0.05 (GraphPad Prism 6; GraphPad Software, Inc., La Jolla, CA, USA).
Quantification of FLV in rat plasma by HPLC-LC-MS/MS detector
A total of 200 μL blood were collected at each time of sampling, and the same volume of methylparaben, used as an internal standard with concentration (100 ng/mL), was dissolved in acetonitrile to precipitate the plasma proteins. Plasma drug concentrations were analyzed using an Agilent HPLC instrument 1,200, Agilent Technologies, and LC-MS/MS detection was carried out using the API 3,200 mass spectrometer equipped with a turbo ion spray interface at 400°C. The ion spray voltage was set as 3,000 V. The working parameters were N2 gas nebulizer at a temperature of 350°C and drying N2 gas flow of 180 mL/min. An isocratic mobile phase was composed of acetonitrile:potassium dihydrogen orthophosphate buffer (10 mM) (1:1, v/v), and the pH was adjusted to 3 using orthophosphoric acid, which was used for the elution. The process of separation was performed using an ODS-A C18 analytical column (250 mm ×4.6 mm id, ACE Ltd., Aberdeen, Scotland, UK), with a flow rate of 1.3 mL/min. The column was maintained at 40°C and the injection volume was 20 μL. The HPLC method used in this study was described in detail by Gonzalez et al.9
Results and discussion
Scanning electron microscopic analysis (Figure 1) revealed the presence of spherical particles with smooth dense surface. The regular spherical morphology can ensure a high packing density.
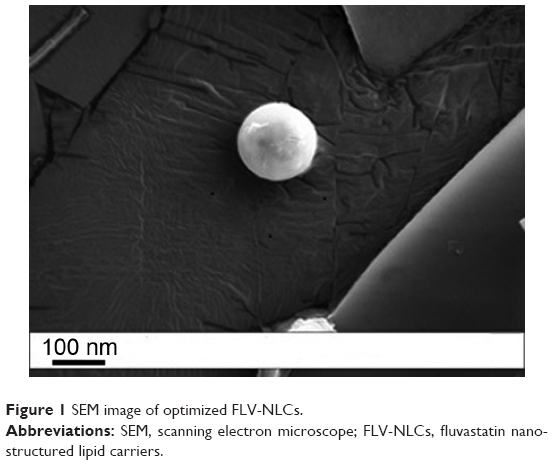 | Figure 1 SEM image of optimized FLV-NLCs. |
A three-level factorial design (32) was used in this study to optimize the formulation of FLV-NLCs. This study proposed different formulations to enhance the clinical efficacy of FLV in the treatment of hyperlipidemia and to reduce the side effects commonly associated with statins. By using a three-level factorial design (32), each independent variable was investigated at three levels, and the outcome was based on four responses: vesicular size, EE%, zeta potential, and 80% of the drug release after 24 hours. The optimized conditions were experimentally determined by testing the ten formulations generated by the three-level factorial design. Pareto charts were used to illustrate the effect of the experimental variables on the responses. A positive sign in the chart indicates a direct relationship between the variable and the observed response, whereas a negative sign indicates an inverse relationship.
FLV-NLCs size
The Pareto chart (Figure 2) showed a significant effect of lipid concentration, which enhances the particle size and reverses the sonication time effect on the size. The interaction of these variables as well as their quantitative effects on the observed responses was generated using a mathematical regression equation (Equation 2) for the observed response Y1.
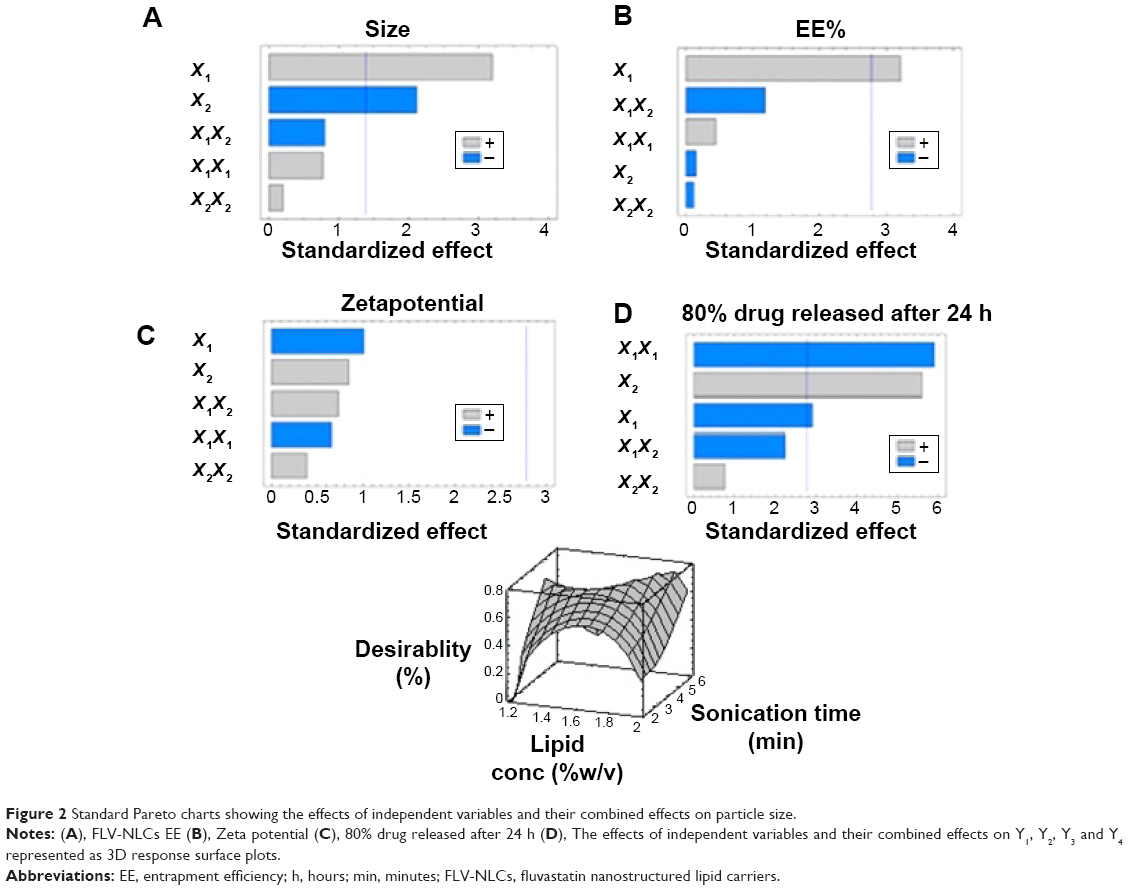 | Figure 2 Standard Pareto charts showing the effects of independent variables and their combined effects on particle size. |
Size=302.389−384.889× X1 +10.375× X2 +227.556× | (2) |
 −33.6667× X1×X2 +2.125 ×
The results showed that by increasing the lipid concentration, the particle size increased but by increasing the almond oil content, the particle size decreased up to 48 nm. Additionally, maximum particle size (365 nm) was observed with 2% concentration of Compritol® 888. Different viscosities obtained from different lipid:oil ratio/percentage could explain these results, which indicate that the higher the almond oil content, the reduction in the viscosity inside NLCs and, consequently, reduction in the surface tension increases to form smaller and smoother surface particles.
On the other hand, sonication time has reverse effect on the particle size (P=0.0132) and Pareto chart (Figure 2, Table 2). Different sonication times result in different vesicle sizes. Before sonication, large particles with variable size distribution were produced. Ultrasonic waves traveled through the distilled water and produced compression forces called cavitation forces, which lead to fractionation of the original globule. These globular fractions transform into long tubelike appendages that can be easily pinched off into small globules.10 After ultrasonication, the vesicles were more homogenous and smaller in size.
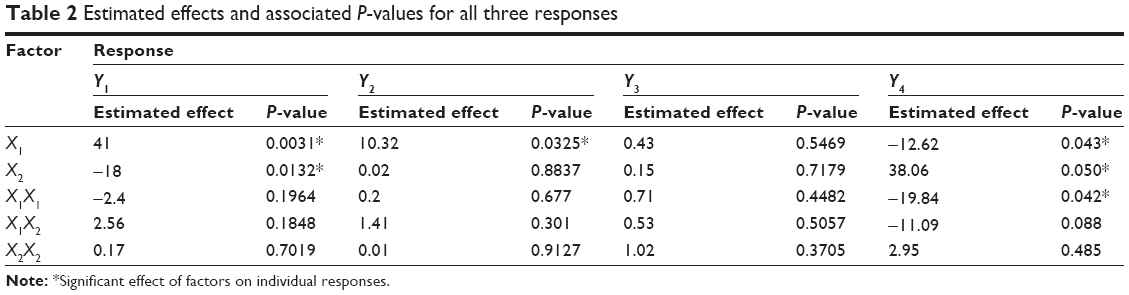 | Table 2 Estimated effects and associated P-values for all three responses |
Entrapment efficiency
The Pareto chart (Figure 2, Table 2) shows a positive relationship between X1 and EE%. The interaction of these factors and their quantitative effects on the responses were generated using a mathematical regression equation for the observed response, Y2 (Equation 3).
Y2 =21.8603−0.994921× X1 +11.2718× X2 +16.7314× | (3) |
The entrapment efficiency of FLV significantly increased (P<0.05) when the concentration of the lipid was increased from 1.25% to 2%. Consequently, when the proportion of oil increases, the number of imperfect spaces in the lipid particle matrix increases, and more drug molecules can be escaped there. However, the lipid matrix might be destroyed when the proportion of almond oil becomes excessive and the drug entrapment efficiency decreases.11 Another advantage for Compritol® 888 is that it could be a multifunction excipient, which is used as a lipid matrix for formation of the lipid particles, surfactant, and emulsifying agent. Furthermore, Compritol® 888 decreases interfacial tension between the two phases leading to a homogeneous and stable emulsion, thus enhancing FLV entrapment in the FLV-NLC vesicles.12
Zeta potential
According to Pareto charts (Figure 2, Table 2), both Y1 and Y2 have no significant effect on zeta potential (Y3). All the prepared FLV-NLCs exhibited negative polarity and a zeta potential value in the range of 17.0–29.2 mV. The interaction of these factors and their quantitative effects on the responses were generated using a mathematical regression equation for the observed response, Y3 (Equation 4).
Y3 =76.3378−69.8844× X1 +2.76333× X2 +17.7778× | (4) |
Drug release
Positive relationship was found between Y4 and each of X1 and X2 (P<0.05; Pareto chart: Figure 2, Table 2). The interaction of these factors and their quantitative effects on the responses were generated using a mathematical regression equation for the observed response, Y4 (Equation 5).
Y4 =−263.391+349.775× X1 +12.647× X2 −100.17× | (5) |
The release of pure drug suspension, F1, F3, F4, F8, and F9, displayed biphasic drug release pattern with a burst release within 60 minutes followed by relatively sustained release, which exceeded 80% after 12 hours. This release pattern may be rationalized by the relation between the particle size and the drug release. The smaller size will be associated with higher surface area leading to higher release rate.13 Formulae F2 and F3 released >90% of the drug in 12 hours, which was not acceptable to the desired criteria for sustained release. Figure 3 depicts the percentage of FLV permeated from optimized FLV-NLCs. The study revealed a biphasic sustained-release pattern during the 24 hours. The initial burst effect stage is usually attributed to the fast release of drug entrapped near the surface of the nanoparticles. After the initial stage, FLV release was characterized by a slow release. The slow release pattern of FLV-NLCs after the initial stage could be related to the depth of entrapped FLV in the core matrix of the NLCs. FLV in the core of the nanoparticles has a longer diffusion path to reach the surface in comparison to FLV entrapped near the surface.14 The release of FLV from core matrix of the lipid carriers is controlled by parameters that affect drug release pattern from this matrix. These parameters are drug diffusion rate, the rate of water uptake, and the size of the particles, including matrix erosion/degradation rate.15–18 In addition, the hydrophobic nature of the lipids augments the delay of water penetration and could retard the diffusion of the poorly water-soluble FLV into the release medium. The optimized formula fulfilled all the desired criteria required in sustained-release product as only 20% of the drug was released in the first hour, time for 50% release (t50) was 7 hours, and time for 80% release dissolution was extended to 20 hours.
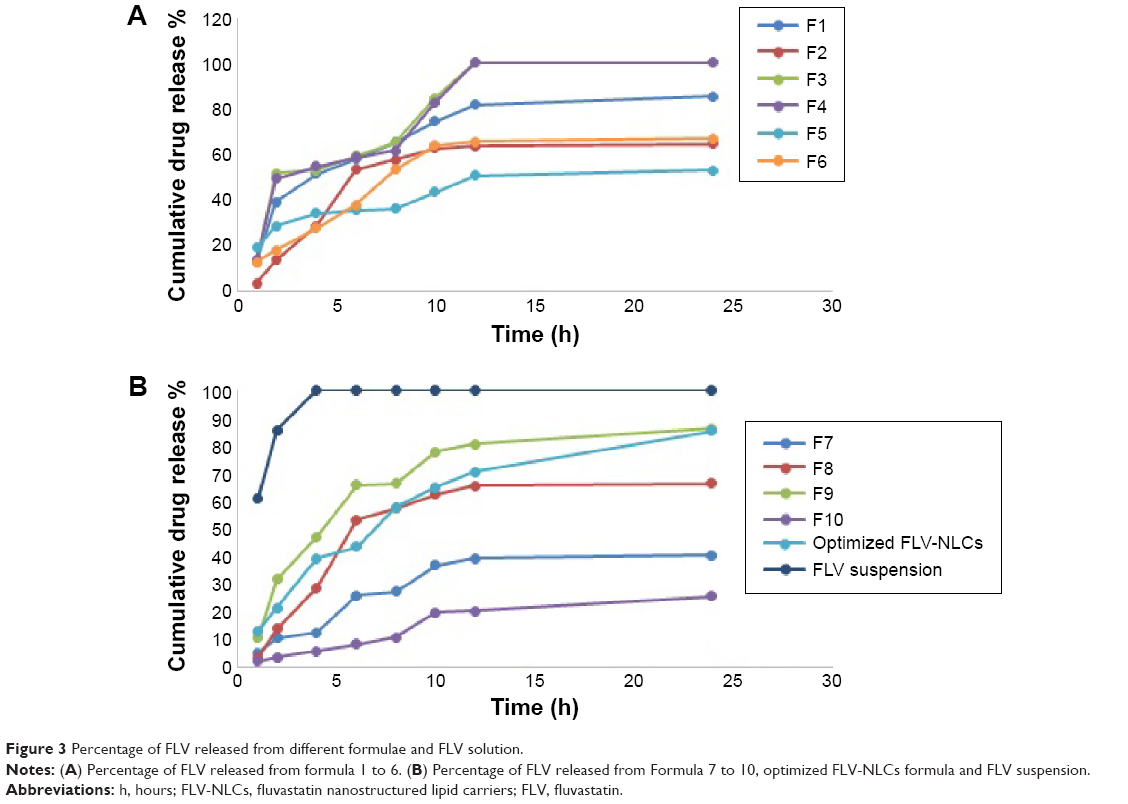 | Figure 3 Percentage of FLV released from different formulae and FLV solution. |
The optimized FLV-NLC formula was prepared using the predicted values of X1, X2, X3, and X4 to measure the observed responses and compared with the calculated values. The observed and predicted values together with residuals for the optimized formulation are shown in Table 3.
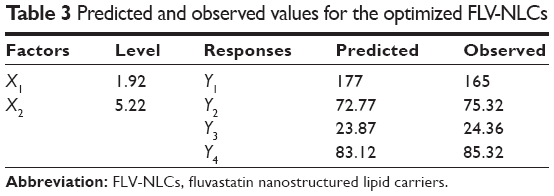 | Table 3 Predicted and observed values for the optimized FLV-NLCs |
Thermodynamic stability of the FLV-NLCs
Stability test revealed that there was a statistically nonsignificant difference in the EE%, zeta potential, or particle size. All formulae revealed good dispersion stability.
Bioavailability study
There was a statistically significant difference between FLV-NLCs and FLV-aqueous suspension in the AUC0–∞, Tmax, Cmax, and MRT data (Figure 4, Table 4; P≤0.05). In the case of FLV-aqueous suspension, the mean AUC0–∞ value significantly increased in comparison with that of FLV-NLCs. These results confirmed that the formulation of FLV-NLCs increased its bioavailability by >2.64-fold. The pharmacokinetic study of FLV-NLCs revealed lower initial plasma concentration than that of the FLV suspension. This may be due to slow release of FLV from NLCs that extended the time. The onset of action from a FLV suspension usually occurs after 30 minutes (at a plasma concentration of 291.48±50 ng/mL) and lasts for 2 hours. In case of FLV-NLCs, the same concentration was obtained after 2 hours and lasted for 4 hours indicating the sustained action of FLV-NLC formulation. After 1 hour, the FLV plasma concentration in case of FLV suspension was decreased more than that of FLV-NLCs due to rapid metabolism and elimination of free FLV molecules in comparison to the entrapment FLV molecules. The results also revealed that FLV-NLCs can significantly modify the pharmacokinetic profile and can increase the FLV bioavailability by >2.64-folds of the FLV suspension. This was due to the fact that FLV is a lipophilic drug with poor aqueous solubility,19 and the preparation of this drug as an NLC enhances its solubility. Also, the pharmacokinetic characteristics of the drugs upon delivery in NLC formulation are dictated by the properties of the NLCs rather than by the physicochemical properties of the drug molecules. Additionally, the presence of Gelucire® 44/14 surfactant in the NLC formula causes a steric hindrance, which helps in reducing the tissue uptake by evading the Reticuloendothelial system. This will increase the residence time of NLCs in the blood circulation. Furthermore, NLCs protected the drug from presystemic metabolism, and this could be due to the NLCs present in nanometric size range. Consequently, the rapid metabolism was delayed as the liver cannot absorb the drug from the delivery system so that the MRT was extended to 7.82 hours in comparison to 4.5 hours in the case of FLV-aqueous suspension. In addition, it has been reported that the absorption of NLCs occurs mainly through the lymphatic uptake pathway by M-cells of the Peyer’s patches;19 this process exhibited a clear dependency on particle characteristics such as size, surface properties, and decreased amount of hepatic first-pass metabolism that is associated with the oral administration of the FLV suspension.20 The use of the optimized formula could eliminate the major drawbacks of the conventionally used FLV suspension.
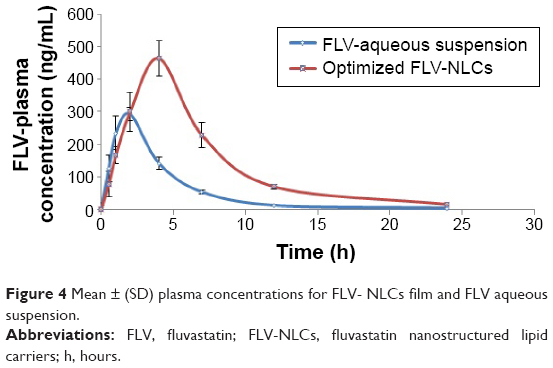 | Figure 4 Mean ± (SD) plasma concentrations for FLV- NLCs film and FLV aqueous suspension. |
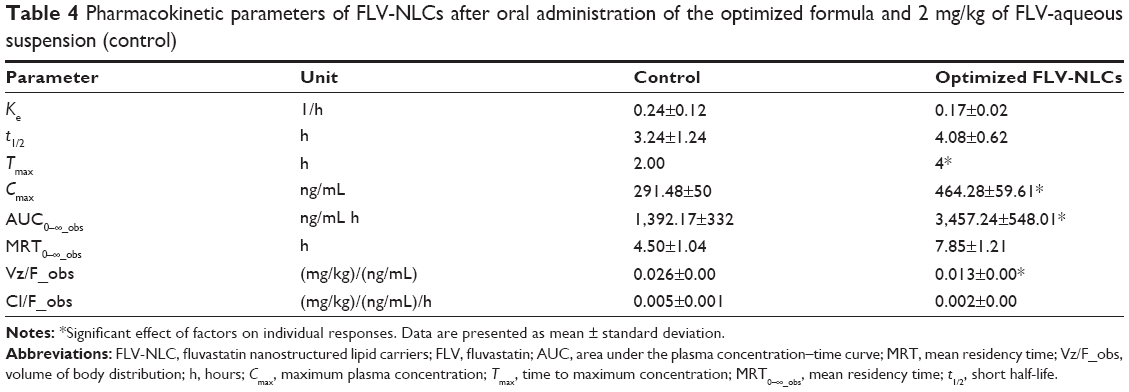 | Table 4 Pharmacokinetic parameters of FLV-NLCs after oral administration of the optimized formula and 2 mg/kg of FLV-aqueous suspension (control) |
Conclusion
FLV-NLCs were developed for hyperlipidemia treatment, and the formulae were subjected to optimization, characterization, and in vivo evaluation. In vivo pharmacokinetic investigations in rats showed an augmentation of FLV bioavailability compared with an oral drug suspension. As a result, patient hyperlipidemia could be improved for lower dosing with reduced side effects that improve patient tolerability and compliance. FLV-NLCs could be considered as promising oral drug delivery systems for the treatment of hyperlipidemia.
Acknowledgments
This work was supported by the Deanship of Scientific Research (DSR), King Abdulaziz University, Jeddah, under grant number (166/942/D1435). The authors, therefore, gratefully acknowledge the DSR technical and financial support.
Disclosure
The authors report no conflicts of interest in this work.
References
Lopes-Virella MF, Virella GT: U.S. Patent and Trademark Office. Washington, DC. 2013; U.S. Patent No. 8,568, 995. | ||
Yano M, Ikeda M, Abe K, et al. Oxidative stress induces anti-hepatitis C virus status via the activation of extracellular signal-regulated kinase. Hepatology. 2009;50(3):678–688. | ||
Kah J, Wüstenberg A, Keller AD, et al. Selective induction of apoptosis by HMG-CoA reductase inhibitors in hepatoma cells and dependence on p53 expression. Oncol Rep. 2012;28(3):1077–1083. | ||
Lee CK, Choi JS, Bang JS. Effects of fluvastatin on the pharmacokinetics of repaglinide: possible role of CYP3A4 and P-glycoprotein inhibition by fluvastatin. Korean J Physiol Pharmacol. 2013;17(3):245–251. | ||
Ekambaram P, Abdul Hasan Sathali A, Priyanka K. Solid lipid nanoparticles: a review. Sci Rev Chem Commun. 2012;2(1):80–102. | ||
Liu Z, Zhang X, Wu H, et al. Preparation and evaluation of solid lipid nanoparticles of baicalin for ocular drug delivery system in vitro and in vivo. Drug Dev Ind Pharm. 2011;37(4):475–481. | ||
Elshafeey A, Bendas E, Mohamed O. Intranasal microemulsion of sildenafil citrate: in vitro evaluation and in vivo pharmacokinetic study in rabbits. AAPS Pharm Sci Tech. 2009;10(2):361–367. | ||
Zhang Y, Huo M, Zhou J, Xie S. PKSolver: an add-in program for pharmacokinetic and pharmacodynamic data analysis in microsoft excel. Comput Methods Programs Biomed. 2010;99:306–314. | ||
Gonzalez O, Iriarte G, Rico E, et al. LC–MS/MS method for the determination of several drugs used in combined cardiovascular therapy in human plasma. J Chromatogr B Analyt Technol Biomed Life Sci. 2010;878(28):2685–2692. | ||
Koch S, Pohl P, Cobet U, Rainov NG. Ultrasound enhancement of liposome-mediated cell transfection is caused by cavitation effects. Ultrasound Med Biol. 2000;26(5):897–903. | ||
Rawat M, Singh D, Saraf S, Saraf S. Lipid carriers: a versatile delivery vehicle for proteins and peptides. Yakugaku Zasshi. 2008;128(2): 269–280. | ||
Aburahma MH, Badr-Eldin SM. Compritol 888 ATO: a multifunctional lipid excipient in drug delivery systems and nanopharmaceuticals. Expert Opin Drug Deliv. 2014;11(12):1865–1883. | ||
Das S, Ng WK, Tan RB. Are nanostructured lipid carriers (NLCs) better than solid lipid nanoparticles (SLNs): development, characterizations and comparative evaluations of clotrimazole-loaded SLNs and NLCs? Eur J Pharm Sci. 2012;47(1):139–151. | ||
Ballantyne CM, Pazzucconi F, Pintó X, et al. Efficacy and tolerability of fluvastatin extended-release delivery system: a pooled analysis. Clin Ther. 2001;23(2):177–192. | ||
Berkland C, Kim K, Pack DW. Fabrication of PLG microspheres with precisely controlled and monodisperse size distributions. J Control Release. 2001;73:59–74. | ||
Brazel CS, Peppas NA. Modeling of drug release from swellable polymers. Eur J Pharm Biopharm. 2000;49:47–58. | ||
Franssen O, Stenekes RJ, Hennink WE. Controlled release of a model protein from enzymatically degrading dextran microspheres. J Control Release. 1999;59:219–228. | ||
Oneda F, Re MI. The effect of formulation variables on the dissolution and physical properties of spray-dried microspheres containing organic salts. Powder Technol. 2003;130:377–384. | ||
Araujo L, Sheppard M, Löbenberg R, Kreuter J. Uptake of PMMA nanoparticles from the gastrointestinal tract after oral administration to rats: modification of the body distribution after suspension in surfactant solutions and in oil vehicles. Int J Pharm. 1999;176:209–224. | ||
Hosny KM, Ali SM. Novel controlled release oxypentifylline microspheres; preparation, characterization and in-vivo evaluation. Afr J Pharm Pharmacol. 2012;6(27):2039–2048. |
 © 2015 The Author(s). This work is published and licensed by Dove Medical Press Limited. The
full terms of this license are available at https://www.dovepress.com/terms
and incorporate the Creative Commons Attribution
- Non Commercial (unported, 3.0) License.
By accessing the work you hereby accept the Terms. Non-commercial uses of the work are permitted
without any further permission from Dove Medical Press Limited, provided the work is properly
attributed. For permission for commercial use of this work, please see paragraphs 4.2 and 5 of our Terms.
© 2015 The Author(s). This work is published and licensed by Dove Medical Press Limited. The
full terms of this license are available at https://www.dovepress.com/terms
and incorporate the Creative Commons Attribution
- Non Commercial (unported, 3.0) License.
By accessing the work you hereby accept the Terms. Non-commercial uses of the work are permitted
without any further permission from Dove Medical Press Limited, provided the work is properly
attributed. For permission for commercial use of this work, please see paragraphs 4.2 and 5 of our Terms.