Back to Journals » Clinical Ophthalmology » Volume 11
Impression cytology implicates cell autophagy in aqueous deficiency dry eye
Authors Lin T, Filek R, Wang JM, Wu CH, Liu H, Hutnik CML ![]()
Received 17 October 2016
Accepted for publication 11 February 2017
Published 24 April 2017 Volume 2017:11 Pages 773—779
DOI https://doi.org/10.2147/OPTH.S124889
Checked for plagiarism Yes
Review by Single anonymous peer review
Peer reviewer comments 3
Editor who approved publication: Dr Scott Fraser
Tony Lin,1,2,* Richard Filek,3,* Joy M Wang,4 Chong H Wu,4 Hong Liu,2 Cindy ML Hutnik1–3
1Department of Ophthalmology, Western University, 2Ivey Eye Institute, St Joseph’s Health Care, St Joseph’s Hospital, 3Department of Pathology and Laboratory Medicine, 4Department of Biology, Western University, London, ON, Canada
*These authors contributed equally to this work
Purpose: Impression cytology in combination with a cell autophagy marker was used to demonstrate the utility of a novel frozen section technique, to assess the health of the ocular surface, as well as to correlate autophagic cell death with the commonly used clinical tests for dry eye.
Methods: Female patients over the age of 18 years who attended an outpatient ophthalmology clinic were invited to participate. Schirmer’s test, tear film break-up time and the ocular surface disease index questionnaire were used as objective and subjective clinical tests for dry eye. The cellular biomarker microtubule-associated protein light chain 3 (LC3) was used as a marker of autophagic cell death.
Results: Low LC3 nuclear staining was positively correlated with Schirmer’s test <10 mm. No correlation was found between other clinical tests for dry eye.
Conclusion: This study demonstrates a positive linear relationship between Schirmer’s testing and LC3. There is a lack of correlation between the commonly used diagnostics tests for dry eye, highlighting our incomplete understanding and assessment of dry eye.
Keywords: impression cytology, cell autophagy, dry eye, technique, Schirmer’s test, LC3
Introduction
Dry eye is a complex, dynamic and multifactorial disease that continues to be underdiagnosed and undertreated. In 2007, the epidemiology subcommittee of International Dry Eye Workshop estimated the prevalence of dry eye to be 5%–30% in people over the age of 50.1 True extent of the disease is difficult to estimate due to the complexity of the condition and the lack of reliable, objective tools for its identification. Common risk factors for dry eye include aging, low androgen pool, meibomian gland disease, systemic medications and disorders of the eyelid. Currently, and in the broadest sense, the classification of this disease identifies two main subtypes: aqueous tear deficiency and evaporative dry eye. Differentiating between the subtypes is often a challenge for clinicians as most cases of dry eye exhibit characteristics of both subtypes which may vary on a daily basis. Environmental triggers, also, play a significant role in the development of dry eye symptoms and may be difficult to deduce accurately based on patient history. Finally, the disruption of neural pathways due to the primary or secondary disease can cause a lack of correlation between signs and symptoms.2
In both subtypes of dry eye, there is a deficiency in the amount and/or composition of the tear film. Prolonged deficiency in the tear film can initiate a cycle of ocular surface changes leading to chronic inflammation and cellular changes which further compromise the ocular surface. These changes give rise to symptoms of foreign body sensation, irritation, epiphoria, blurred vision and photophobia.3 Currently, the diagnosis of dry eye is based on several clinical tests, many of them subjective, to assess tear production and tear film stability.
Tear production is mainly assessed using Schirmer’s test. Evaluation of evaporative dry eye is primarily done by the assessment of meibomian glands and tear film break-up time (TBUT). The ocular surface disease index (OSDI) is one of several available questionnaires which have been validated as tools in the assessment of the subjective impact of dry eye. It incorporates the patient’s visual function, environmental triggers and ocular symptoms to determine the severity of dry eye disease.4 Despite the multitude of clinical tests available for dry eye testing, there is often a lack of correlation between these tests. Furthermore, there is a poor understanding of the ocular surface physiology.5,6 When used in isolation, these tests may give an incomplete picture of the true status of the ocular surface. Tear osmolarity has emerged as another potential objective measure of dry eye. Active research is underway to better understand its potential clinical role.
Impression cytology (IC) is the collection of ocular surface epithelial cells for the purpose of histologic, immunologic and molecular analysis. Microtubule-associated protein light chain 3 (LC3) is a cellular biomarker of autophagy.7 This biomarker was selected for use in this study because its expression has been confirmed as a biomarker for autophagy in a dry eye murine model as described by Seo et al.8 Cell autophagy is a cellular response to stress and starvation, where the intracellular components are degraded by autophagosomes. LC3 is a soluble protein that is found in autophagosome membranes and is widely used as marker of cell autophagy. Autophagy can result from a number of stress stimuli, and hence is considered a “downstream” response.
The current understanding of dry eye pathophysiology is incomplete, and definitive clinical diagnosis remains elusive. Our study aims to determine if an objective cellular biomarker can be positively and sufficiently correlated with typical clinical tests used in the assessment of patients with dry eye. We describe, for the first time, a novel frozen section technique using IC and LC3, a cellular biomarker for cell autophagy, to characterize the health of the ocular surface. We correlate our findings with a number of conventional clinical tests for dry eye to better understand the interrelationship between them.
Methods
This study was conducted at a tertiary care academic center in London, Ontario, Canada. Healthy adult female patients over the age of 18 years with no past ocular history who presented consecutively to an outpatient ophthalmology clinic for routine cataract surgery were invited to participate. To minimize variability between the results among the patients, when assessing this novel approach, only female patients were elected to participate in the study. Patients were excluded if there was a history of prior use of contact lenses, topical medications use within 6 months of participation, previous diagnosis of ocular surface disease or anterior segment and adnexal pathology. Patients with systemic conditions such as Sjogren’s disease and other autoimmune conditions were excluded. In addition, patients must not have had any ocular surgeries within 6 months of participation. All patients provided written informed consent for this study. This study complied with the Declaration of Helsinki and was approved by the Health Sciences Research Ethics Board of Western University.
Dry eye diagnostic tests
All participants were subjected to a series of dry eye diagnostic tests performed on the right eye in the following order: TBUT, Schirmer’s test, OSDI questionnaire and IC. The right eye was chosen for consistency, as it is known that there can be variability in the composition of the tear film between the two eyes. The same eye was used for all tests. Clinical tests were selected on the basis of being able to provide quantitative measures. The participants were separated into normal versus abnormal groups based on the staining results of the LC3 biomarker, our positive objective test for ocular surface disease in the surface impressions. Subsequent statistical analyses were performed to assess the correlation between the existing clinical tools and the LC3 biomarker expression.
Tear film break-up time
TBUT time was performed using fluorescein 1% w/v (Bausch and Lomb Canada Inc., Vaughan, ON, Canada). One drop of fluorescein was instilled into the lower fornix and the patients were asked to blink several times. The tear film was examined at the slit-lamp with a broad beam using the cobalt blue filter. The interval between the last blink and the formation of dry areas, black spots or lines in the fluorescein-stained tear film was recorded. A TBUT of <10 seconds was considered abnormal.
Schirmer’s test
Schirmer’s testing was performed using no 41 Whatman filter paper that was 5 mm wide and 35 mm long. The test was performed with topical anesthesia (proparacaine hydrochloride 0.5%) to reduce discomfort and prevent tearing due to the irritation from the filter paper. One drop of topical anesthetic eye drop was instilled into the lower fornix and the patients were asked to blink off excess tears which were then removed with a filter paper. Another fresh filter paper was folded 5 mm from one end and inserted at the junction of the middle and outer thirds of the lower eyelid. The patients were asked to keep their eyes closed. After 5 minutes, the filter paper was removed and the amount of wetting from the fold was measured. Wetting distance <10 mm was considered positive for aqueous deficiency of the tear film.
OSDI questionnaire
Patients were instructed to read and complete the OSDI questionnaire. The OSDI score was calculated as per the scoring manual. The OSDI score ranges from 0 to 100 points and categorizes the ocular surface as normal (0–12 points), mild disease (13–22 points), moderate disease (23–32 points) and severe disease (33–100 points).9
IC and frozen section technique
Prior to obtaining impressions, one drop of topical anesthesia (proparacaine hydrochloride 0.5%) was placed into each eye. Conjunctival cytology impressions were obtained using individually packed, sterile Biopore membranes (Millicell-CM 1.4 μm; EMD Millipore, Billerica, MA, USA). The procedure was done immediately following administration of topical anesthesia to ensure minimal impact on subsequent RNA analyses. The Biopore membrane (8 mm in diameter) was spread out on a small plastic tube and did not require additional coating. Before use, the three legs on the edge of the tube were cut off with a pair of scissors. The tube with the Biopore membrane was gently pressed on the temporal bulbar conjunctival surface for 3 seconds. The membrane became translucent when it came into contact with the conjunctival surface. The membrane was then peeled off and immediately transferred into a dry ice box. The samples were either stored in −80°C for future use or were immediately processed.
In order to maximize the potential of biomarker detection, the Biopore membranes containing the cytology impressions were separated from the plastic tube using a Bard Parker Disposable Standard Scalpel (BD Medical Systems, Franklin Lakes, NJ, USA) and mounted in Tissue-Tek O.C.T. Compound (Ames Division, Miles Laboratories, Elkhart, IN, USA) on pellets in a Leica CM 1850 Cryostat (Leica Systems, Concord, ON, Canada). The samples were then cut with a Feather Microtome (Feather, Osaka, Japan) at a temperature of −20°C. The specimens were sectioned at 8 μm and collected on charged slides (Diamed Lac Supplies Inc, Mississauga, ON, Canada), to prevent cell loss during staining. Every sample was cut into 20 labeled slides containing eight sections each. The number of slides was variable, depending on the number of immunohistochemical tests required. The slides were immediately transferred into a dry ice box to preserve the integrity of the RNA and proteins in the tissue.
The sectioned slides were fixed in cold acetone (−20°C) for 2 minutes and dried completely. This was followed by rinsing in phosphate-buffered saline (PBS) to remove the freeze mounting medium. The slides were incubated in blocking buffer for 10 minutes (0.5% bovine serum albumin, 1.5% goat serum with PBS) and incubated with a primary antibody diluted in blocking buffer for 1 hour at room temperature in a humid chamber. After rinsing in PBS three times, the slides were incubated with a secondary antibody diluted in blocking buffer for 30 minutes at room temperature. The slides were rinsed three times in PBS and stained with 4′,6-diamidino-2-phenylindole.
This technique permitted the potential for multi-biomarker testing on single specimens. For the purpose of this study, rabbit anti-LC3, 0.002% (Sigma L8918; Sigma-Aldrich Co., St Louis, MO, USA) was used as a primary antibody and Alexa Fluor 594 goat anti-rabbit IgG, 0.002% (Thermo Fisher Scientific, Waltham, MA, USA) as the secondary antibody for both. Three sectioned slides from each sample were stained with each antibody. Confocal microscopy was used to examine and compare the specific antibodies. LC3 quantification was analyzed using ImageJ software (National Institutes of Health, Bethesda, MD, USA) and two masked human graders.
Hematoxylin staining
Hematoxylin staining was performed to assess the adequacy of individual impressions. Approximately three slides per IC specimen were stained by hematoxylin (Surgipath Medical Industries, Inc., Richmond, IL, USA) in order to determine the success of the IC cell collection procedure. The specimen slides were immersed in hematoxylin for 1 minute, while thoroughly rinsing with tap water with frequent water exchange. This was carried out until the water was clear. The specimens were then dehydrated in ascending alcohol solutions (50%, 70%, 95% and 2×100%) followed by treatment with xylene (Thermo Fisher Scientific). Xylene treatment was repeated, followed by mounting of coverslip onto a labeled glass slide with Cytoseal XYL (Richard-Allan Scientific, Kalamazoo, MI, USA).
LC3 nuclear/cytoplasmic staining ratio
Two graders masked to the type of patients and purpose of the study quantified the fluorescence intensity of the average LC3 nuclear/cytoplasmic staining ratio from confocal images using ImageJ. Three confocal pictures were taken of each sample slide. The regions of interest were drawn within the nucleoplasm, cytoplasm and background outside of each cell (as blank). The intensity of the blank was first subtracted from both the nucleus and the cytoplasm. The ratios were then calculated from the average intensities of these adjusted values. This was repeated three times for each picture. A kappa statistic was performed for the graders to assess intergrader agreement.
Statistical analysis
The Pearson’s correlation coefficient (r) between each clinical test result and all other clinical tests, including LC3 staining, was derived from our data set using Statistical Package for the Social Sciences (IBM Corporation, Armonk, NY, USA). The correlation coefficient is a statistical measure of the strength of linear dependence between two variables, in this case, each pair of dry eye clinical tests. The value of r can range from −1 to 1, inclusive. Generally, r values between 0 and 0.35 (0 and −0.35) indicate a weak-positive (or negative) linear relationship between the two results of the two testing methods; an r value between 0.36 and 0.67 (−0.36 and −0.67) indicates a moderate-positive (or negative) linear relationship; an r value between 0.68 and 1 (−0.68 and −1) is indicative of a strong-positive (or negative) linear correlation. A value of 1 (−1) implies that there is a perfect positive (negative) linear relationship, while an r value of 0 implies that there is no linear correlation between the results of the clinical methods.10
To further analyze the relationship between each clinical method and cellular autophagy as determined by LC3 staining, the patient samples were divided into normal or abnormal categories based on the result of each clinical test. One-way analysis of variance followed by Tukey’s multiple comparisons test was conducted to confirm the statistical significance between the groups.
Results
The baseline characteristics of the study patients are shown in Table 1. A total of 68 female patients were enrolled in the study. The average age was 69.0±12.4 with a range of 36–89. Ocular epithelial impression samples were collected from the right eye of all patients. Of the 68 right eyes sampled, 56 impressions were collected and processed successfully, resulting in a collection rate of 82.4%. The remaining 17.6% of impressions had inadequate cell collection on the Biopore membrane. The average number of cells per sample slide was 27.25±5.036.
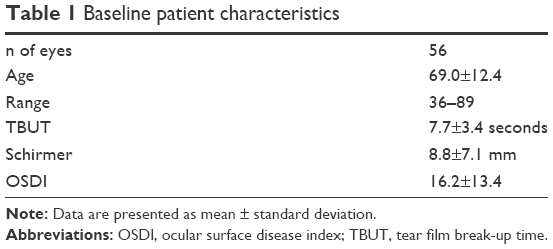 | Table 1 Baseline patient characteristics |
All ocular impression samples were stained with an LC3 antibody and the staining ratio between the nucleus and cytoplasm was measured using ImageJ software. A ratio of more than 1 indicated a preponderance of LC3 in the nucleus, suggestive of a healthy ocular surface. Conversely, a ratio of less than 1 indicated that more LC3 was in the cytoplasm and there was a higher degree of autophagic cellular stress (Figure 1). The kappa statistic between the two graders was 0.86±0.046, indicating almost perfect agreement.
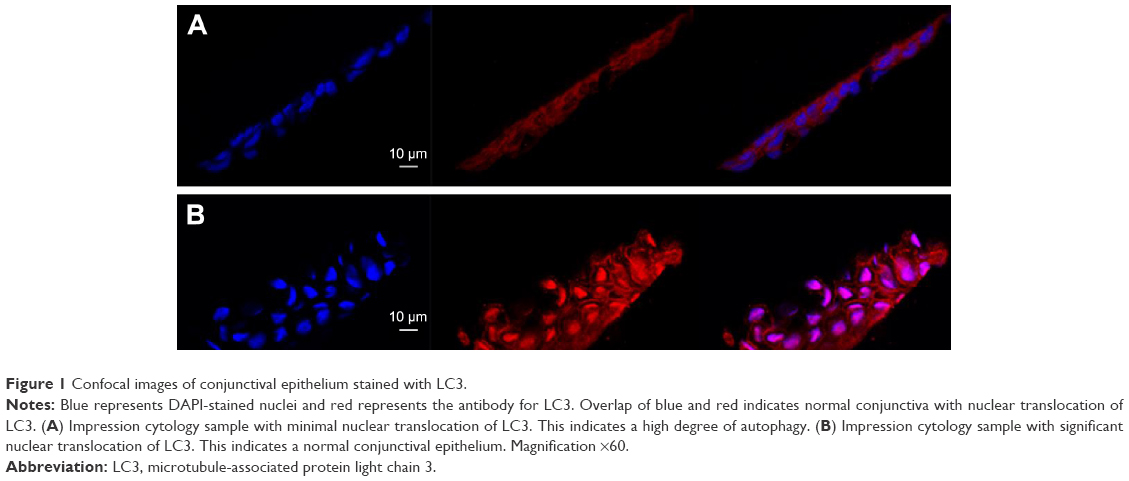 | Figure 1 Confocal images of conjunctival epithelium stained with LC3. |
The average Schirmer’s score with an LC3 ratio ≥1.0 was 10.1±8.0 mm and with an LC3 ratio <1.0 was 6.0±3.5 mm (P<0.05). The average TBUT in eyes with an LC3 ratio ≥1.0 was 7.5±3.7 seconds and with an LC3 ratio <1.0 was 8.2±2.7 seconds (P=0.48). The average OSDI score in eyes with an LC3 ratio of ≥1.0 was 14.2±13.7 mm and with an LC3 ratio of <1.0 was 20.6±11.9 mm (P=0.095). The OSDI scores for both LC3 groups were in the mild disease category (score 12–22). These values are summarized in Table 2.
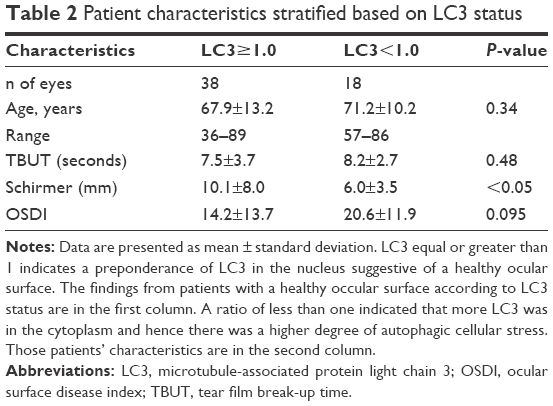 | Table 2 Patient characteristics stratified based on LC3 status |
Pearson’s correlation coefficients are reported in Table 3. The five variables assessed were Schirmer’s test, LC3 ratio, patient age, TBUT and OSDI. Among the five variables assessed, the highest correlation, r=0.41, was found between the results of the Schirmer’s test and LC3 ratio. This indicates a moderate-positive linear relationship between the two clinical tests. The linear relationship between all other variables was weak, as their r values were between 0.35 and −0.35. Significantly higher (P<0.05) Schirmer’s scores were obtained in samples with LC3 ≥1.0, compared to samples with LC3 <1.0 (Figure 2).
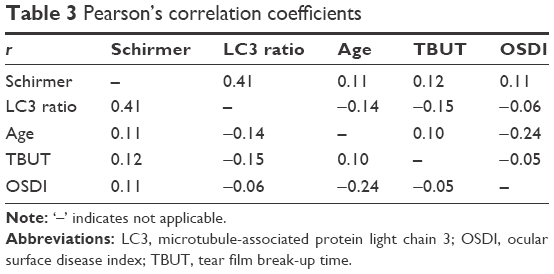 | Table 3 Pearson’s correlation coefficients |
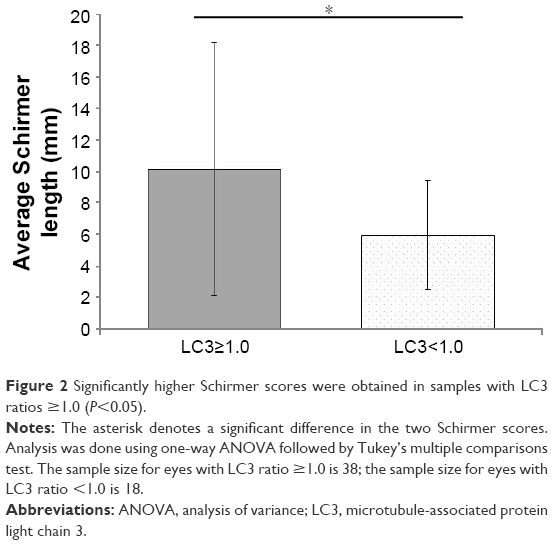 | Figure 2 Significantly higher Schirmer scores were obtained in samples with LC3 ratios ≥1.0 (P<0.05). |
Discussion
Dry eye symptoms are a common patient complaint. Despite this, there is lack of definitive and reliable clinical tests used for diagnosis. Current tests often correlate poorly with one another, thus illustrating our inadequate understanding of this disease spectrum.4,5 In this study, we used IC and cellular biomarker testing as a tool to assess the ocular surface and compared it with the commonly used clinical tests for dry eye. The expression of the cellular biomarker was used as a positive objective test to identify patients with an abnormal ocular surface. The Schirmer’s test and TBUT were selected due to their objective nature, their common clinical use, the ability to obtain quantitative data and the elements of the tear film that they assess. OSDI was selected due to its popularity in assessing the subjective aspect of dry eye.
Low nuclear localization of LC3, which is an objective indicator of cellular health, was found to be correlated with Schirmer’s testing <10 mm. This is the first study to demonstrate an association between cell autophagy and aqueous deficiency dry eye in human patients. The cellular changes associated with aqueous deficient dry eyes are poorly understood. The exact role of cell autophagy in aqueous deficiency dry eye is unclear and will require further exploration. Seo et al8 reported that in dry eye-induced mice, autophagic markers such as LC3 increase, and other studies have suggested that LC3 and cell autophagy lead to cellular demise.11–13
TBUT was not significantly correlated with LC3 staining. This lack of correlation, in contrast to Schirmer’s testing, supports the current paradigm of dry eye with its different subtypes. Tear film instability is not a deficiency of the aqueous layer of the tear film; rather, it is the inadequacy of the lipid and/or mucin component in the tear film produced by the meibomian glands and conjunctival goblet cells, respectively. The underlying differences in LC3 staining between TBUT and Schirmer’s test may reflect these differences.
OSDI was not significantly correlated with LC3 staining. OSDI has been suggested to be a valid and reliable instrument in dry eye diagnosis that combines the patient’s subjective visual function, environmental triggers and ocular symptoms to determine the severity of dry eye disease.4 However, OSDI is not without inherent deficiencies. One of these deficiencies is the high variability in score from baseline over time. This high variability can make it impossible to differentiate normal subjects from patients with moderately severe disease.9 Another problem with OSDI is the subjective nature of ocular irritation. Symptoms of ocular irritation can be difficult to describe and can be caused by a variety of anterior segment pathologies. Patients can misattribute ocular irritation from other anterior segment pathologies to dry eye. Dry eye and/or its causes have been well documented to affect the neural pathways that exist between the ocular surface and brainstem. Lack of neural sensitivity and hypersensitivity cause very poor correlation between dry eye signs and the patient’s reported symptoms.2 Finally, questionnaires based on reported symptoms have the inability to differentiate between dry eye subtypes, which can have treatment ramifications. The utility of the OSDI is maximized when used in conjunction with the clinical tests of dry eye.
There was a lack of correlation between the Schirmer’s test, TBUT and, perhaps unexpectedly, the OSDI. The lack of correlation between the clinical tools may be due to a number of factors, including the emerging realization that dry eye is a dynamic, multifaceted condition with a constellation of both known and unknown elements. The findings highlight the fact that any of the established clinical tools is likely insufficient when used in isolation to provide adequate diagnosis and management of dry eye syndromes.
A potential difference in dry eye disease due to gender differences was an important factor when the study inclusion criteria were selected. Females were chosen for the study, since it is known that females have higher incidences of ocular surface disease compared to age-matched males. Furthermore, the study was limited to a single gender in order to minimize potential confounders due to androgen hormone status.14 Due to this intentional aspect of the protocol, the study findings are not generalizable to the male population.
It is known that the ocular surface has a highly dynamic state that can vary with the time of day and from eye to eye. As such, these fluctuations may have a significant effect on the validity of the correlations between the dry eye tests. In order to minimize the impact of changing states on the results, the tests had to be performed within a minimal time frame, one after the other. The optimum sequence of tests, as it may be used in clinical settings, was determined to be TBUT testing followed by Schirmer’s test, OSDI and IC. One of the primary objectives in determining the sequence of tests was to limit the interference and reduce the impact of the procedures on subsequent tests. Primarily, the potential effects of topical fluorescein, used in TBUT, and proparacaine, a topical anesthetic, on the results were sought to be reduced to a nonfactor. To this end, IC was chosen to be the last test directly following OSDI, so as to give the eye ample time to stabilize following prior procedures.
Fluorescein, used in TBUT, besides its role in the test, allows analysis of the ocular surface for superficial punctate erosions, which is another potential sign of dry eye. It is noted that addition of fluorescein may destabilize the tear film. However, fluorescein is not known to have any influence on Schirmer’s test and by the time IC was done, it was observed that most of the fluorescein had dissipated as the paper test plates did not have any discoloration.
It is possible that proparacaine, contained within the topical anesthetic eye drops, could influence the autophagic activity of the ocular surface epithelium. However, without ocular surface anesthesia, the test procedure would be difficult to perform due to ethical issues arising from patient discomfort. To reduce the effects of proparacaine, the methods were developed in such a manner that only a single drop of anesthetic was needed for all tests. Furthermore, where required, the specimens were quickly frozen. Overall, it is unlikely that proparacaine caused changes in RNA expression.
The lack of a clinically designated control group was the result of there being no reliable test in detecting the dry eye disease. Selection of a control group would have required a single clinical test, or a group of tests, to be selected as a “gold standard”. The significant lack of correlation between the clinical tests, as demonstrated in this study, indicates that there is no single clinical test, tool or instrument that is adequate in the assessment of identifying dry eye. Therefore, establishing a dry eye group and a control group to measure LC3 expression for a study is extremely challenging and, likely, unrealistic at this time. Mindful of the complications in screening the patients, this study chose to include all applicable patients and identify patient groups based upon LC3 expression, which was found to be a consistent and objective tool. The identification of objective biomarkers and their correlation with clinical tests serves to further our understanding of dry eye pathogenesis and facilitates the development of better diagnostic tests.
To our knowledge, this is the first study to employ IC and fresh frozen sections of the ocular surface in dry eye testing. The goal of this study was to determine if there was a relationship between typically used clinical tests for dry eye and an objective biomarker of cell stress. The second goal was to describe a novel frozen section technique of ocular surface impressions that could be used for multi-biomarker testing from single specimens. This study demonstrates a positive linear relationship between Schirmer’s testing and LC3 staining. The exact role of cell autophagy in aqueous deficiency dry eye patients is unclear, but our findings provide a look at the health of the ocular surface. Future studies employing other biomarkers will further characterize the status of the ocular surface as it relates to disease and contributes to a better understanding of dry eye. Our study also confirms a lack of correlation between the commonly used clinical diagnostics tests for dry eye. This highlights the insufficiency of the available clinical tools in the assessment of dry eye and the multifaceted nature of this complex disease. The results of this study provide a foundation for future longitudinal studies, eye-to-eye comparisons and gender differences in dry eye.
Acknowledgments
Dr Tony Lin and Richard Filek are co-first authors for this study.
The authors thank Dr William Hodge, MD, PhD and Dr Alex Mao, MD, MPH, Western University for their assistance in statistical analyses and Nanak Rai, BSc, Western University and Deenaz Zaidi, MBBC, University of Alberta for their assistance in data collection.
This paper/abstract of this paper was presented at the ARVO Annual Meeting as a poster presentation/conference talk with interim findings. The poster’s abstract was published in “ARVO Annual Meeting Abstract” Investigative Ophthalmology & Visual Science April 2014, Vol 55, 1986. doi: http://iovs.arvojournals.org/article.aspx?articleid=2267281.
Disclosure
The authors report no conflicts of interest in this work.
References
[No authors listed]. The definition and classification of dry eye disease: report of the definition and classification subcommittee of the International Dry Eye Work Shop. Ocul Surf. 2007;5(2):75–92. | ||
Stern ME, Gao J, Siemasko KF, Beuerman RW, Pflugfelder SC. The role of the lacrimal functional unit in the pathophysiology of dry eye. Exp Eye Res. 2004;78(3):409–416. | ||
Lee D, Higginbotham E. Clinical Guide To Comprehensive Ophthalmology. New York, NY: Thieme; 1999. | ||
Schiffman RM, Christianson MD, Jacobsen G, Hirsch JD, Reis BL. Reliability and validity of the ocular surface disease index. Arch Ophthalmol. 2000;118(5):615–621. | ||
Sullivan BD, Crews LA, Messmer EM, et al. Correlations between commonly used objective signs and symptoms for the diagnosis of dry eye disease: clinical implications. Acta Ophthalmol. 2012;92(2):161–166. | ||
Sullivan BD, Crews LA, Sönmez B, et al. Clinical utility of objective tests for dry eye disease: variability over time and implications for clinical trials and disease management. Cornea. 2012;31(9):1000–1008. | ||
Tanida I. Autophagy basics. Microbiol Immunol. 2011;55(1):1–11. | ||
Seo Y, Ji Y, Lee S, et al. Activation of HIF-1α (hypoxia inducible factor-1α) prevents dry eye-induced acinar cell death in the lacrimal gland. Cell Death Dis. 2014;5:e1309. | ||
Miller KL, Walt JG, Mink DR, et al. Minimal clinically important difference for the ocular surface disease index. Arch Ophthalmol. 2010;128(1):94–101. | ||
Taylor R. Interpretation of the correlation coefficient: a basic review. J Diagn Med Sonography. 1990;6(1):35–39. | ||
Tanida I. Autophagosome formation and molecular mechanism of autophagy. Antioxid Redox Signal. 2011;14(11):2201–2214. | ||
Tanida I, Ueno T, Kominami E. LC3 and Autophagy. Methods Mol Biol. 2008;445:77–88. | ||
Kabbage M, Williams B, Dickman MB. Cell death control: the interplay of apoptosis and autophagy in the pathogenicity of Sclerotinia sclerotiorum. PLoS Pathog. 2013;9(4):e1003287. | ||
[No authors listed]. The epidemiology of dry eye disease: report of the Epidemiology Subcommittee of the International Dry Eye Workshop (2007). Ocular Surf. 2007;5(2):93–107. |
 © 2017 The Author(s). This work is published and licensed by Dove Medical Press Limited. The
full terms of this license are available at https://www.dovepress.com/terms
and incorporate the Creative Commons Attribution
- Non Commercial (unported, 3.0) License.
By accessing the work you hereby accept the Terms. Non-commercial uses of the work are permitted
without any further permission from Dove Medical Press Limited, provided the work is properly
attributed. For permission for commercial use of this work, please see paragraphs 4.2 and 5 of our Terms.
© 2017 The Author(s). This work is published and licensed by Dove Medical Press Limited. The
full terms of this license are available at https://www.dovepress.com/terms
and incorporate the Creative Commons Attribution
- Non Commercial (unported, 3.0) License.
By accessing the work you hereby accept the Terms. Non-commercial uses of the work are permitted
without any further permission from Dove Medical Press Limited, provided the work is properly
attributed. For permission for commercial use of this work, please see paragraphs 4.2 and 5 of our Terms.