Back to Journals » Nature and Science of Sleep » Volume 12
Impaired Coupling of the Brain’s Default Network During Sleep Deprivation: A Resting-State EEG Study
Authors Wang YJ ![]() , Duan W
, Duan W ![]() , Lei X
, Lei X ![]()
Received 18 August 2020
Accepted for publication 22 October 2020
Published 10 November 2020 Volume 2020:12 Pages 937—947
DOI https://doi.org/10.2147/NSS.S277655
Checked for plagiarism Yes
Review by Single anonymous peer review
Peer reviewer comments 3
Editor who approved publication: Dr Sarah L Appleton
Ya-Jie Wang,1,2 Wei Duan,1,2 Xu Lei1,2
1Sleep and NeuroImaging Center, Faculty of Psychology, Southwest University, Chongqing 400715, People’s Republic of China; 2Key Laboratory of Cognition and Personality (Southwest University), Ministry of Education, Chongqing 400715, People’s Republic of China
Correspondence: Xu Lei
Sleep and NeuroImaging Center, Faculty of Psychology, Southwest University, Chongqing 400715, People’s Republic of China
Tel +86 23 6825 2309
Email [email protected]
Introduction: Sleep deprivation (SD) has a negative influence on mood and emotion processing, and previous studies have elucidated the impaired coupling within the default network (DN) after SD. However, the dynamic characteristic with high temporal precision was rarely investigated in the DN after SD.
Methods: Here, the resting-state EEG after nocturnal sleep (NS) and SD was collected from 31 participants. The cortical electrical activities of the posterior cingulate cortex (PCC) and the anterior medial prefrontal cortex (aMPFC) were reconstructed applying the eLORETA, and the functional connectivity (FC) of PCC-aMPFC was calculated using the power envelope connectivity (PEC).
Results: Compared with NS, the power spectrums of the PCC and the FC of PCC-aMPFC were significantly reduced in the α band after SD. Interestingly, the impaired PCC-aMPFC integration was positively correlated with the decreased positive affect, implying that the DN plays a critical role in the subjective mood state. Our moderation analysis further revealed that the intensity of the DN posterior–anterior interaction moderated sleep loss and positive affect.
Discussion: Overall, the results reveal the strong relationship between the uncoupling of DN and the feeling down of mood. Our research may contribute towards a better understanding of the mood and cognition processing after sleep loss.
Keywords: resting-state EEG, sleep deprivation, α band, default network, affective state
Introduction
Sleep plays a vital role in our physical and mental health because it is one of the indispensable physiological activities of the human body. An approach to explore functions of sleep reversely is sleep deprivation (SD), which is a powerful experimental manipulation to better clarify the links between sleep and affect. Generally, feeling down of mood was reported after SD in healthy subject.1,2 That includes two effects: reduced positive affective state and increased negative emotion.3 Moreover, the loss of sleep could induce stress, anxiety, aggression and irritability to some extent.4,5 In all, SD has a deteriorating effect on mood states, which is usually measured with the Positive and Negative Affect Scale (PANAS).6 This scale divided the subjective mood state into positive affect (PA) and negative affect (NA). They are two relatively independent dimensions,6 and PA shows notable diurnal variation and is more unique to physiological hyperarousal than NA.7 Therefore, compared with NA, PA is usually more sensitive to SD.8
The psychological mechanisms and neural basis of the reduced mood are not understood yet. A promising investigation framework, which is based on functional magnetic resonance imaging (fMRI), focuses on brain networks.1 These studies mainly adopt task designs, which based on emotional-related pictures or videos.9,10 Previous resting-state fMRI studies revealed that the default network (DN) is particularly affected by SD,11,12 inducing a double dissociation within anterior and posterior midline regions of the DN.13 Specifically, SD induced decreasing functional connectivity (FC) between the posterior cingulate cortex (PCC) and the medial prefrontal cortex (MPFC).14
Here, we further hypothesized that after SD, the alterations within the DN could be related to mood state. We chose the PCC and anterior MPFC (aMPFC) as regions of interest (ROIs) mainly for three reasons. Firstly, they are the posterior and anterior midline cores of the DN.11 This study11 divided DN into one midline core (PCC-aMPFC) and two sub-systems, considering function and anatomy. Previous studies15,16 showed that PCC-aMPFC exhibited the highest centrality within the DN circuit. Secondly, midline cores have some links with sleep. For example, previous researches suggested that SD has a negative impact on PCC and MPFC.12,15,17 In addition, decreased connectivity within PCC was related to later chronotype.18,19
Thirdly, many studies suggest that PCC and aMPFC are related to emotion.20–22 On the one hand, PCC has been pointed out as a pivotal for arousal and awareness,22 linking with emotion,21 and involving in affective symptoms of obstructive sleep apnea (OSA) or insomnia disorder.20 In addition, increased Gamma Aminobutyric Acid (GABA) levels in the PCC were thought to link with antidepressant and anti-anxiety.23 On the other hand, functional impaired MPFC might result in emotional deficits,10,24 and anterior DMN was implicated in emotion regulation.18 More importantly, the core PCC-aMPFC subsystem entangles with emotion and introspection on mental states.11 In a recent study, disrupted FC of PCC-mPFC may contribute to affective symptoms of bipolar disorder.25
To gain more detailed rhythmic characteristics than fMRI, the resting-state EEG technique was employed in our current study. The main advantage of electroencephalography (EEG) is its high sampling rate. Based on this advantage, we can extract various electrophysiological characteristics within a wide frequency band, from 0.1 to 40 Hz. Furthermore, using a source imaging method, for example, exact low-resolution brain electromagnetic tomography (eLORETA),26 EEG can provide electrophysiological information of FC between the aMPFC and PCC. We especially focused on the change within the α band (8–13 Hz) rhythm. The α band was chosen as the frequency band of interest due to its dominant activity during eye closure.27 Besides, the power of the α band is a good indicator of EEG vigilance, which was greatly impaired during SD.28 More importantly, waking α power has been correlated with the emotional state and the emotional content of dream reports.29
In this study, resting-state EEG was recorded after nocturnal sleep (NS) and SD from 31 participants. The cortical electrical activities of the PCC and aMPFC were reconstructed applying the eLORETA, and the FC of PCC-aMPFC was calculated using the power envelope connectivity (PEC). Both the power spectrum and FC were compared between NS and SD. We further conducted a moderation analysis to investigate the relationship between FC, sleep condition, and current mood state. We have three hypotheses for SD compared with NS: 1. In the midline of DN, the α power will decrease; 2. The anterior-posterior DN FC will decrease; 3. Decreased FC might correlate with altered mood states. It may be a positive correlation for positive affect and a negative correlation for negative affect.
Methods
Participants
A total of 37 participants engaged in our study. Six participants were excluded because of sleeping more than half of the eyes-closed EEG recording time (more than 150 s), based on the manual sleep staging of a sleep expert. Exclusion resulted in 31 valid right-handed participants (17 males), 20.16 ± 0.33 (M ± SEM) years old. All participants had no self-reported mental illness, anxiety or depression symptoms, recent cold symptoms, or sleep problems (such as insomnia, sudden wakefulness or feeling difficult to breathe). This study was supported by the Ethics Committee of Southwest University, and all procedures were performed following the Helsinki Declaration. We explained the purposes and procedures of the study to participants in detail and informed consents were obtained before the experiment started.
Procedure
All participants visited the laboratory twice. For the first time, half of them arrived at 8 a.m. after sleep in the dormitory. For the second time, they arrived at 10 p.m., then remained awake until the end of the experiment. The other half was in reverse order. During SD, participants have a 24-hour continuous awake period, monitored by research assistants. They were forbidden to consume beverages or foods containing caffeine, tea or alcohol. Besides, they were not allowed to lie down, sleep or engage in vigorous physical activity. After SD day, the participant was suggested to take a restorative sleep immediately, in their dormitory, or the nearby restroom provided by our sleep center. Both sleep conditions were monitored by an actigraphy wrist-watch (wGT3X-BT). The data from the actigraphy were analyzed by Actilife (https://www.theactigraph.com), to check the participant has a regular sleep or total SD in each condition. The interval between the two sleep conditions was at least seven days, and participants were required to keep their regular sleep habits throughout the experiment.
Resting-state EEG recordings and questionnaires filling were conducted in the morning. The EEG data were collected between 9.00 and 10.00 a.m., after electrodes were applied successfully with low impedance (<5 kΩ). After that, participants were instructed to keep their eyes closed for 5 minutes. Then, they filled out a sleep log30 and Positive and Negative Affect Scale (PANAS).6 In addition, to ensure the experimental manipulation was successful, all participants were asked to complete a 5-minute psychomotor vigilance task (PVT)31,32 and the Stanford Sleepiness Scale (SSS).33 The SSS and PVT were used as indicators for subjective and objective sleepiness, respectively.
The sleep log was used to collect their sleep time and wake up time. The PANAS consisted of 20 items, and each item described an emotional state, for example, nervous. Participants rated from 1 (nearly no) to 5 (extremely a lot). All items were attributed to two dimensions, namely NA and PA. As for the SSS, participants chose one description from seven statements to evaluate their subjective sleepiness. For example, “feeling energetic, vital, alert and awake” (statement one) and “always dreaming, falling asleep fast, giving up staying awake” (statement seven).
In PVT, a square frame centered in the screen. Participants needed to click the mouse as soon as the red number appeared in the box. And after some random time, the number appeared again. The time length of PVT was 5 minutes. The lapses (the number of trials with response time > 500 ms) and mean reaction time (from trials with response time ≤ 500 ms and >100 ms) can objectively quantify the vigilance of subjects.34
EEG Data Acquisition and Data Preprocessing
EEG signals were recorded using 63 Ag/AgCl electrodes on an elastic cap, based on the international extended 10–20 electrode placement system (Brain Products GmbH, Steingrabenstr, Germany). Two channels were used to record vertical and horizontal electrooculograms, and the impedance levels at all electrodes were kept below 5 kΩ. The sampling rate was 500 Hz, and the FCz was utilized as the online reference channel.
Firstly, the sleeping EEG data needed to be identified. We selected six channels (F3, F4, C3, C4, O1, O2) for manual sleep staging. One sleep expert scored the EEG signal with a time window of 30 s, according to the 2017 AASM manual.35 For example, N1 (non-rapid eye movement Stage 1) is defined as attenuated α rhythm and rising mixed θ signal, accompanied by slow eye movements and a decrease in muscle tone. N2 (non-rapid eye movement Stage 2) was featured as the appearance of K-complexes and sleep spindles.
If the total time length of sleeping data exceeded half, then we discarded all the data from this subject. In this study, we deleted six participants because they fall asleep for more than 150 seconds. Among the 31 remaining subjects, nine of them showed signs of falling asleep after SD. We manually deleted 30 s sleeping data for seven participants and 60 s for two. In other words, all participants could stay wakefulness during the whole 5-minute eyes-closed resting-state data acquisition after NS, but only 22 participants can make that after SD, and nine could only stay awake for more than 150 seconds.
After deleting sleeping data and rejecting noisy data by manual, there were 225.13 ± 29.17 seconds of data remained in NS condition and 231.00 ± 38.08 seconds in SD condition. For bad electrodes, we interpolated its signal with its surrounding electrodes. As a result, we interpolated 2.38 ± 2.15 and 2.44 ± 2.26 electrodes in NS and SD conditions, respectively. Both valid data length and the number of bad channels had no significant differences in NS and SD conditions (paired t-test, p > 0.05).
Data preprocessing was performed using EEGLAB (version 2019_1, http://sccn.ucsd.edu/). The general processing pipeline was applied, which included band filtering to 0.1–40 Hz, replacing bad channels with surrounding channels, every 4 seconds was divided into an epoch and rejection of artifact epoch by manual. Epochs with ocular, muscular, and other types of artifacts were identified and then excluded from further analyses. Independent Components Analysis (ICA) was used to correlate the eye-movement artifact because eye movements are always identified as the biggest independent components in ICA decomposition. At last, the signal was re-reference to average.
EEG Source Imaging and FC
For resting-state EEG, we firstly used the exact low-resolution brain electromagnetic tomography eLORETA,26,36 to calculate the cortical electric neuronal activity distributions from EEG measurements. EEG source imaging was performed using the Fieldtrip http://www.ru.nl/donders/fieldtrip,37 The EEG forward model is restricted to a high-density canonical cortical mesh, which was extracted from a structural MRI template of a neurotypical male in Fieldtrip software (http://fieldtrip.fcdonders.nl/download.php). The mesh has 8196 vertices, which was uniformly distributed on the gray-white matter interface. Each vertex is assumed to be one dipole, oriented perpendicular to the mesh surface. In this step, our input is the remained EEG signal of 61 electrodes, and the output is the reconstructed time course of 8196 vertices, constructing the whole brain cortical electric neuronal activity. Notice that the duration of the reconstructed time course in source space has the same duration as the scalp EEG.
Then, the power spectrums of each vertex varied from 0.1 to 40 Hz were obtained using Welch’s method in MATLAB, with a frequency resolution of 0.2 Hz. Due to our special interest in the α band, the spectral density of 8–13 Hz was averaged. Considering some arousal states (for example, SD), it is important to take the entire spectra range into account when comparing changes of specific frequency band.38,39 Therefore, we computed relative power instead of absolute power. Relative power was obtained by normalizing power in each frequency band with the overall average power in 0.1–40 Hz within each channel.
After that, we chose the PCC (in MNI coordinate (mm), x:-8, y:-56, z:26, Broadman Areas: 23, 3) and the aMPFC (x:-6, y:52, z:-2, Broadman Areas:10, 32) as ROIs. Each ROI was assumed as a sphere with a radius of 5 mm. In our EEG forward model, the number of corresponding dipoles (vertices) was 14 and 16 for the PCC and aMPFC, respectively. The power spectrums of PCC and aMPFC were the average spectrums of all the dipoles in each ROI.
For FC, we averaged the time course of all the dipoles within each ROI to represent the time course of an ROI. After that, the power envelope correlation40 was applied to calculate the interaction between these two ROIs. This is based on quantifying correlations between power envelopes of two ROIs. Firstly, the absolute values of the complex spectral estimates were squared and then logarithmically transformed to render the power statistics more normal. After that, the Pearson’s linear correlation between the resulting power envelopes from the two ROIs was computed. More additional information and numerical simulations about PEC can be found in Hipp, Hawellek, Corbetta, Siegel and Engel.40
Statistical Analyses
For questionnaires and behavioral data, paired sample t-tests were conducted to compare the difference between the two conditions. The PANAS scale was divided into positive and negative affect subscales, and corresponding total scores were calculated, respectively. All PVT trials with response time ranged from 100 to 500 ms were included in calculating the average response time.
For EEG data, the power spectrums of the PCC and aMPFC were compared using paired sample t-test in each frequency bin. We also conducted an additional t-test for the α band, which is the averaged spectrum between 8 and 13 Hz. A similarly paired sample t-test was conducted for the FC between PCC and aMPFC. Finally, as mentioned earlier, we concerned about the relationship between positive affect, negative affect and the PCC-aMPFC connectivity in the α band. After that, the Pearson correlation was conducted to explore the relations between these two variables under different conditions. In order to explore the moderation relationship among SD, the PCC-aMPFC connectivity in the α band, and positive affect, we used the Process41 in SPSS (version 18) to analyze the underlying mechanism. The process is a plug-in in SPSS for mediation or moderation analysis with up to more than 70 different models (visit https://www.processmacro.org/index.html for more information).
Results
Behavioral results
Descriptive statistics and paired t-test results of the SSS, PVT, the positive and negative affect of PANAS are demonstrated in Figure 1. All the related values are listed in Table 1. Results suggested that the SSS and PVT (RTs and lapses) increased prominently after SD (t = −9.66, p < 0.001; t = −4.54, p < 0.001; and t = −3.85, p < 0.001, respectively). Apart from that, positive affect of PANAS worsened significantly (t = 5.35, p < 0.001), but negative affect only showed a slight decrease trend (t = −1.67, p = 0.105) when comparing SD with NS.
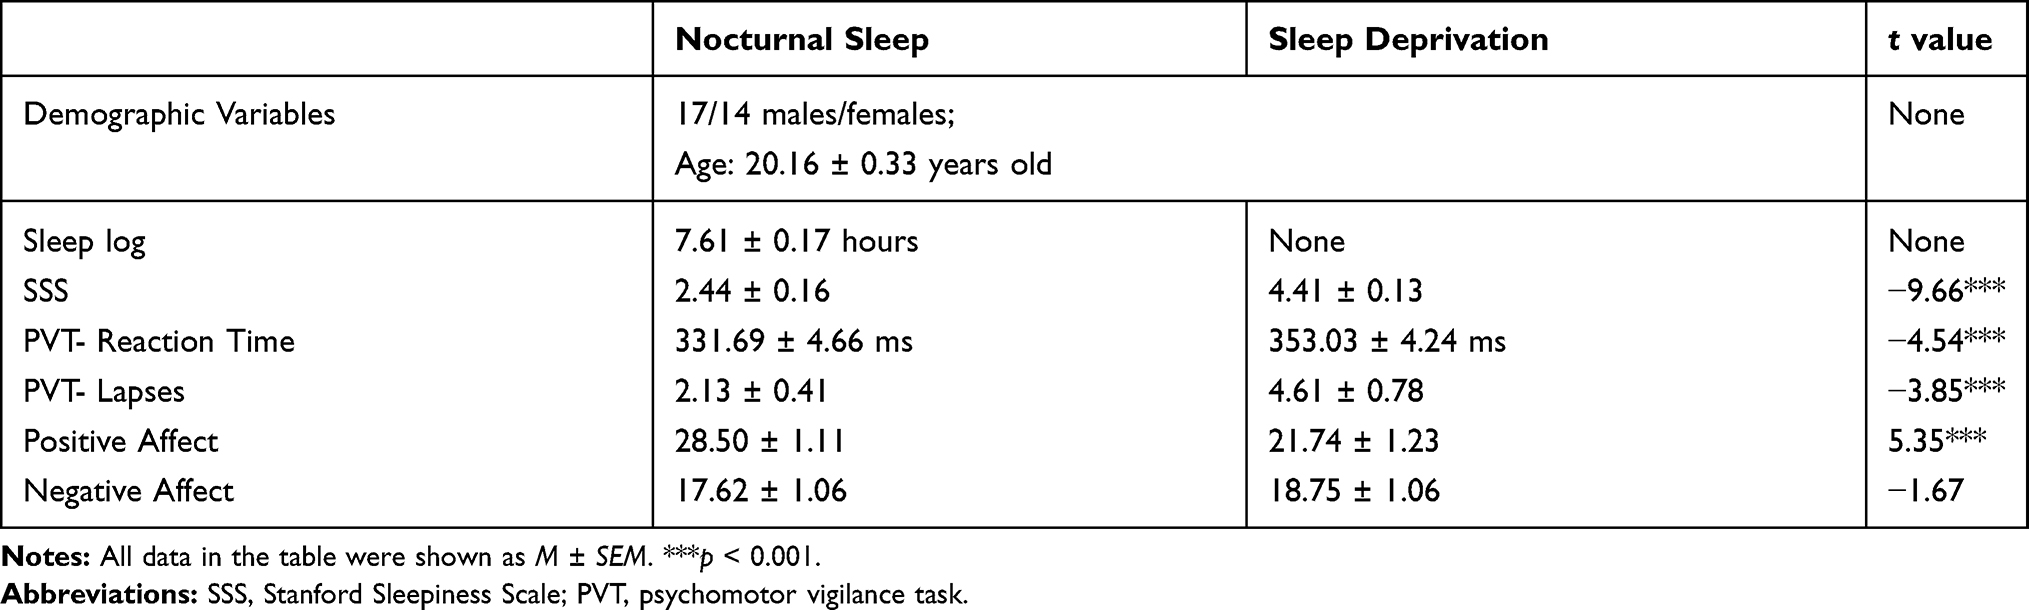 |
Table 1 The Demographic Variables and Four Behavioral Variables of the Experiment |
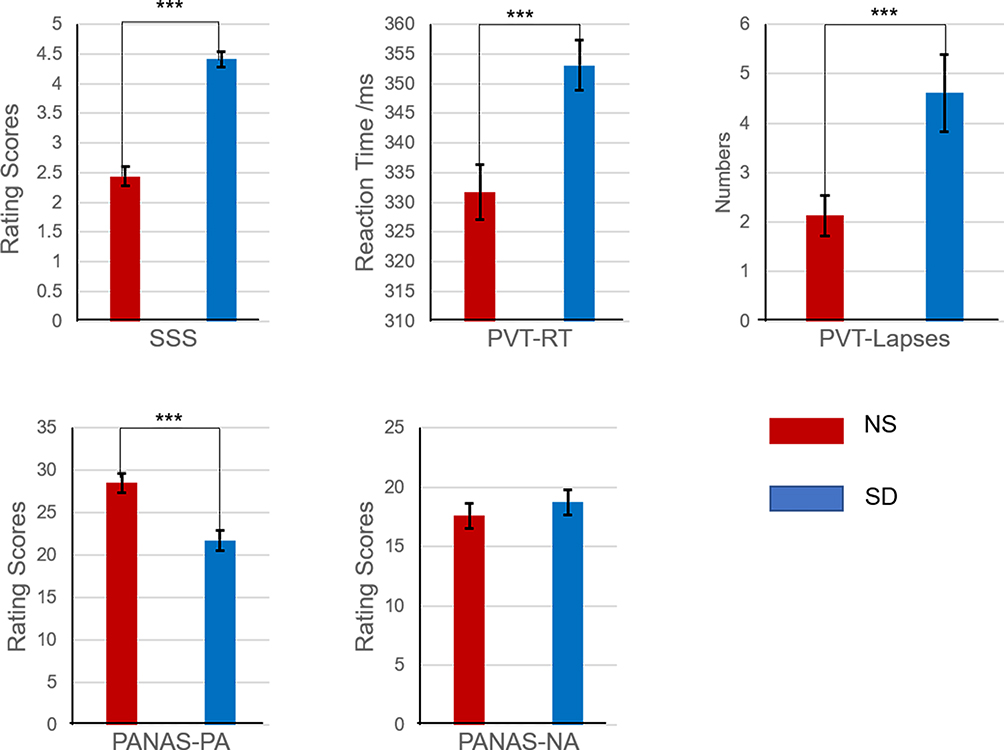 |
Figure 1 The values (M + SEM) of four parameters after nocturnal sleep (NS) and sleep deprivation (SD). ***p < 0.001. Abbreviations: SSS, Stanford Sleepiness Scale; PVT, psychomotor vigilance task; RT, reaction time; PA, positive affect; NA, negative affect; NS, nocturnal sleep; SD, sleep deprivation. |
Power Spectrums of PCC and aMPFC
The spectrum of the two ROIs is plotted in Figure 2. The frequency bands with significant differences were shaded (paired t-test, p < 0.05, FDR corrected). It revealed that the PCC was significantly different during delta, theta, and alpha bands. In comparison, that of aMPFC showed no significant change.
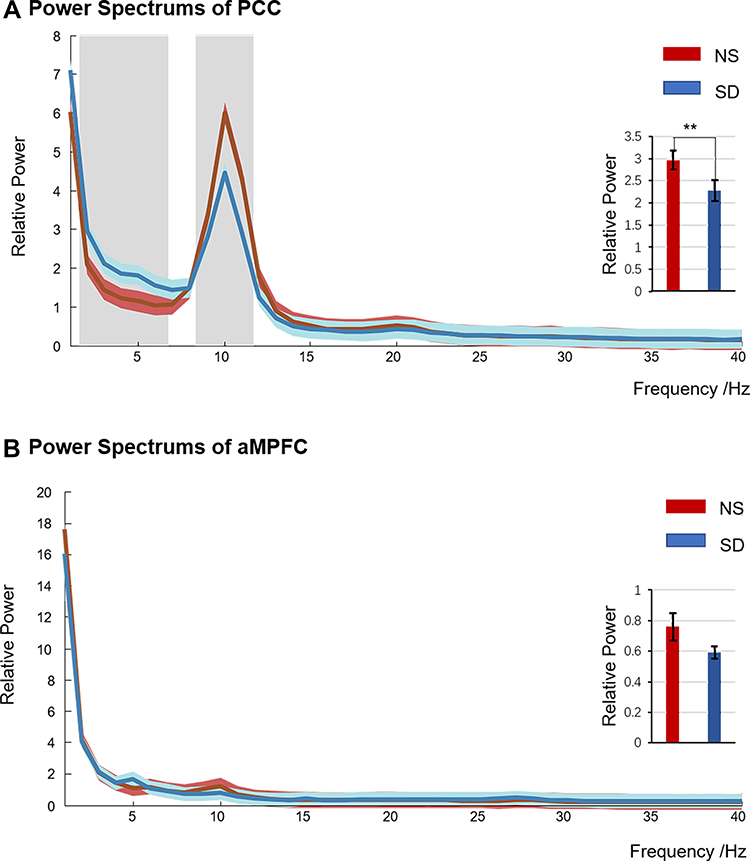 |
Figure 2 Power spectrums of PCC (A) and aMPFC (B) after nocturnal sleep (NS) and sleep deprivation (SD). The red line represented NS condition, the blue line for SD, and the light blue and red shadows meant for standard errors. There were significant differences in the grey-shaded parts (two-tail paired sample t-tests, p < 0.05, FDR-corrected). The embedded histogram showed the power differences between aMPFC and PCC in the α band (8–13 Hz). **p < 0.05. Abbreviations: NS, nocturnal sleep; SD, sleep deprivation. |
Due to our interest in the α band, the changes in the aMPFC and PCC at 8–13 Hz were shown as an embedded histogram in Figure 2. The results indicated that the power of the α band in the PCC was significantly reduced after SD (NS: 2.97 ± 0.21, SD: 2.28 ± 0.23, t = 3.13, p < 0.01, FDR corrected). Similarly, that of the aMPFC also decreased, with t = 2.14 and p = 0.04 (uncorrected. NS: 0.76 ± 0.09, SD: 0.59 ± 0.04). However, this could not survive from multiple comparisons correction.
In addition, according to the power spectrum, the PCC also changed significantly in δ (1–3 Hz) and θ (4–7 Hz) ranges: δ band: NS: 3.19 ± 0.27, SD: 4.05 ± 0.33, t = −2.36, p < 0.05, FDR corrected; θ band: NS: 1.12 ± 0.08, SD: 1.66 ± 0.13, t = −4.20, p < 0.001, FDR corrected. In contrast, it seems that the aMPFC was not affected by SD: none of the two frequency bands mentioned above changed significantly.
PCC-aMPFC Connectivity and Its Relations with Mood State
The connectivity of each frequency bin between two midline ROIs of DN ranged from 0.1 to 40 Hz is shown in Figure 3A. Correlations between PA and the FC are presented in Figure 3B and C.
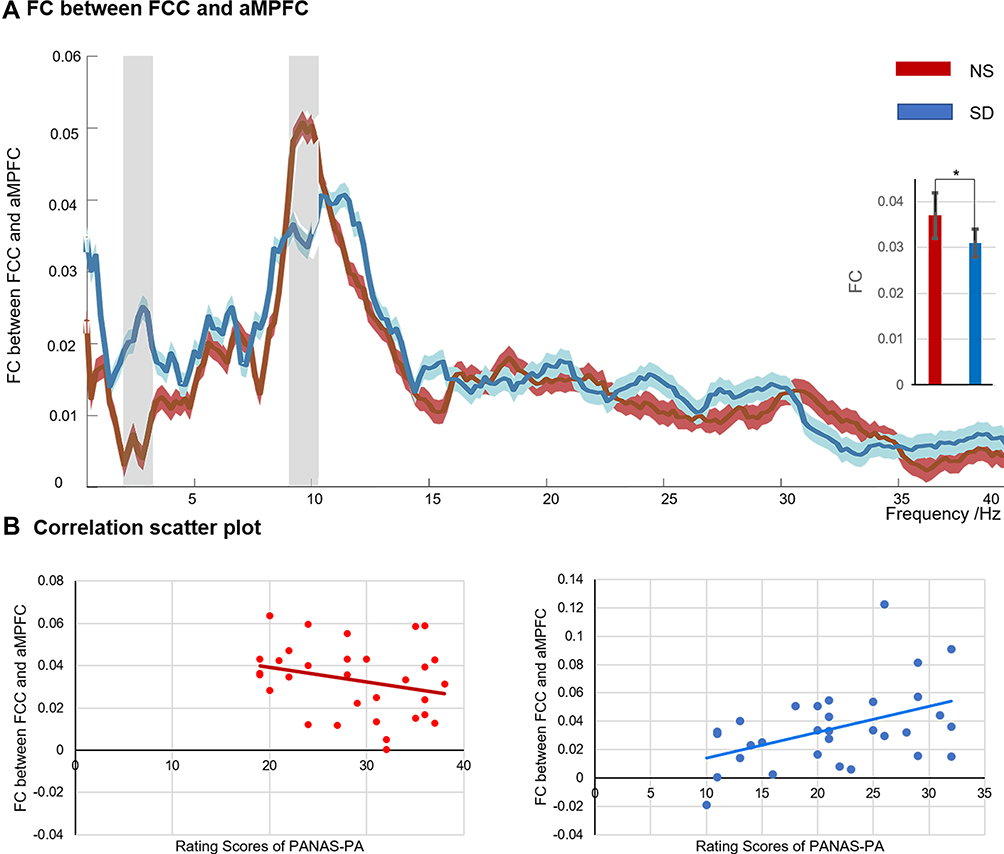 |
Figure 3 The functional connectivity of aMPFC and PCC after nocturnal sleep (NS) and sleep deprivation SD (A), and the correlation scatter diagrams between the positive affect and PCC-aMPFC connectivity (B). The histogram embedded in Figure 3A illustrated the integration strength between aMPFC and PCC in the α band (8–13 Hz). The light blue and red shadows represented the standard error under SD and NS conditions, respectively. Gray shadow indicated statistically significant differences (paired t-test, p < 0.05, FDR-corrected). *p < 0.05. Abbreviations: PA, positive affect; NS, nocturnal sleep; SD, sleep deprivation. |
Power envelope correlations implied that compared to NS, the FC of PCC-aMPFC decreased significantly in the α band after SD: t = 2.25, p < 0.05 (FDR correction). In addition, the PCC-aMPFC connectivity in the α band became significantly correlated with positive affect: r = 0.46 and p < 0.05 (FDR correction). However, this pattern did not hold for NS, with r = −0.26 and p = 0.15. As for negative emotion, the PCC-aMPFC connectivity showed no significant correlations with NA under both sleep conditions (NS: r = 0.29 and p = 0.12; SD: r = 0.10 and p = 0.60).
Moderating Effect of the PCC-aMPFC Connectivity
To understand the underlying moderating effect intuitively, we constructed a moderation model among sleep conditions, the PCC-aMPFC connectivity, and the positive affect of PANAS, as illustrated in Figure 4.
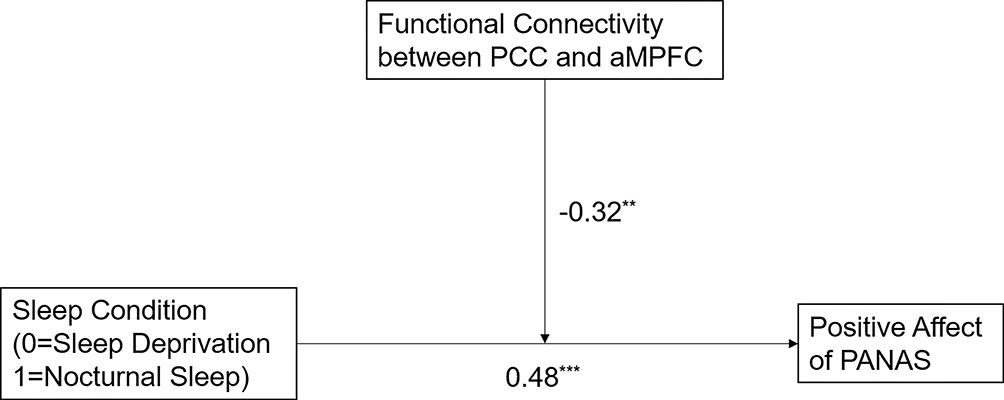 |
Figure 4 The moderation model among sleep conditions, the PCC-aMPFC connectivity, and the positive affect of PANAS. Functional connectivity between PCC and aMPFC in the α band was a moderator, and sleep condition and positive affect were independent and dependent variables, respectively. The path coefficients reported were standardized. **p < 0.01; ***p < 0.001. |
The moderating effect of the FC of anterior-posterior midline of the DN was significant: β = −0.32, p < 0.01, and sleep condition had significant effect on positive affect: β = 0.48, p < 0.001.
Discussion
To reveal a wide band electrophysiological characteristic of DN after SD, 31 valid participants were included in the resting-state EEG study. Consistent with previous studies, our behavioral data showed that subjective sleepiness (SSS) increased, and vigilance (PVT) decreased significantly after SD.42 Besides, the PA of PANAS significantly decreased,42 while NA decreased slightly.8 This demonstrated that our SD experimental manipulation was successful.
In addition, compared with between-subject design,13 our within-subject experiments could greatly take out the effect of inter-individual variabilities, such as gender, chronotype or other sleep-related traits.43 Interestingly, compared with NS, the power spectrum of the PCC and the FC of PCC-aMPFC were significantly reduced in the α band after SD. In addition, the impaired PCC-aMPFC integration was positively correlated with the decreased positive affect, implying that the DN plays a critical role in the subjective mood state. Moderation analysis further revealed that the intensity of the DN posterior-anterior interaction moderated sleep loss and positive affect. Overall, the results reveal the strong relationship between the uncoupling of DN and the feeling down of mood. Our research may contribute towards a better understanding of the mood and cognition processing after sleep loss.
Decreased α Power in PCC
The α band power of the PCC declined significantly after SD, yet the aMPFC did not exhibit any notable change. To the best of our knowledge, this is the first study to reveal the energy changes of the PCC and aMPFC, across a wide frequency range (0.1–40 Hz). Previous studies have reported the decreased α power in parietal and occipital regions based on the scale surface EEG, and this is very relevant to our result.3,44 Nevertheless, although the relative power decreased, the PCC still showed an α dominant effect during the eyes-closed condition. In other words, the activity of the PCC declined after SD, which was identical to a previous fMRI study.45
One possible explanation for the α dominant effect could be the neurotransmitter: GABA. GABA is produced by the hypothalamus, which is considered the most important brain region to regulate sleep.46 We speculated that after SD, the enhanced driving force of sleep might result from the increasing GABA secretion, which can systematically inhibit the α power.47
In contrast to α, the PCC presented raised power around δ and θ bands. More θ and less α activity were linked with a sleepier state,28 hence the frequency variations of the PCC were in line with the functional differentiation of high and low-frequency bands. Furthermore, the ratio power between α and θ bands was widely utilized as EEG vigilance.28 The increase in θ and δ44 or the decrease of α power3 was accompanied by a decline in alertness and transition to drowsiness.28 Therefore, we speculated that the decrease of high frequency and increase of low frequency of PCC may reflect a state of lower vigilance after sleep deprivation.
Decreased Connectivity Within the Default Network
The PCC and aMPFC exhibited attenuated integration in the α band, and this may reflect an abnormal awake state caused by SD, considering the natural awake state is characterized by the strong posterior and anterior integration in the DN.48,49 The loss of connectivity often occurred when consciousness was absent, such as descent to sleep,27 minimally conscious, and vegetative state patients.49 Preceding researchers believed that self-consciousness was associated with the DN.50,51 From this point of view, SD might weaken self-consciousness, accompanying damaged posterior and anterior integration within DN in the α band. Moreover, this decoupling may also imply cognitive impairment, considering a previous fMRI study,20 which suggested that aberrant posterior DN connectivity was associated with working and declarative memory.
As mentioned earlier, GABA is essential for sleep regulation,46 and we assumed that SD may cause abnormal GABA secretion because of increased sleep drive. Previous research showed that the inhibitory effect of GABA may result in decreases in neuronal activity and the intrinsic FC almost within the entire DN.52 Specifically, they found that GABA is special to DN because they fail to associate any other network with GABA. Apart from that, many studies measured the GABA concentration at PCC,52,53 which may imply that the PCC is more sensitive to GABA than other brain regions. Consistently, our results showed that, compared to the aMPFC, sleep condition could have more influence on PCC. Thus, we speculated that the weakening connectivity of PCC-aMPFC could be largely due to the reduced activity of the PCC.
Correlations Between FC and Positive Affect
We found that after SD, the midline integration of the DN in the α band became related to the subjective mood state, namely PA. This may indicate that only after SD, the midline cores of DN begin to take part in an affective state. Maybe we can view this as some compensation mechanisms after SD, though future study is required. Anyway, we suggested that SD-induced abnormal deactivation in the midline DN might reflect an unhealthy mental state. The decreased connectivity within DN, especially between PCC and aMPFC, was associated with multiple neuropsychiatric disorders, such as post-traumatic stress disorder (PTSD),54 schizophrenia,55 early life stress,54 and major depression disorder.55 SD may disrupt the boundaries of the regular DN activity, therefore making the DN architectures fail to maintain brain functions to some extent.
The modulation model further illustrated the relationships among these three variables: the connectivity strength of the PCC-aMPFC regulates the effect of sleep loss on PA. As the loss of midline connectivity in the DN intensifies, the effects of SD on PA will be stronger. Previous literature1 supported the negative effects of sleep loss on mood. Furthermore, we revealed that this phenomenon may be due to the moderating effect of the PCC-aMPFC connectivity of the DN in the α band. We believed that the SD-induced low PA could be the mood state basis for subsequent emotional responses. Moreover, the decrease in anterior-posterior connectivity within DN may impact emotional-related brain responses.
Limitations
Even though our research has made some unique advances, some limitations still exist. First, the narrow age range and would limit the generalization of research results. Future studies should consider the inclusion of middle-aged and older people to check for age effects. For example, whether the α dominant effect will be replaced in other age groups? Second, no polysomnography (PSG) monitors to exclude sleep disorders. Later studies should have a strict screening of sleep quality, and consider taking the quality scores as an independent variable to test our correlation results and modulation model. In addition, only one questionnaire (PANAS) was used to measure the affective state after sleep restriction. Future research may consider applying some cognitive tasks, to further examine the effect of resting state on subsequent emotional cognition. Finally, we assumed that GABA may play a certain role after SD, but we did not test GABA directly. We should consider exploring the effect of GABA on α activity and FC after SD.
Conclusions
In summary, sleep deprivation inhibits the activity of the PCC. It also reduces the midline integrity of the DN, within the dominant α band during the eyes-closed condition. Moreover, the less interaction between the anterior and posterior core regions of DN, the stronger the negative impact on the current mood state. The abnormal mood state and the DN activity may be important reasons for subsequent emotional deterioration and cognitive impairment caused by sleep loss. Our research may contribute towards a better understanding of the mood and cognition processing after sleep loss.
Acknowledgments
The authors thank Xinyuan Chen, Ling He, Zhiqi Lu, and Teng Li for their help in data analyses strategy and data collection. This work was supported by the National Science Foundation of China (grant number 31971028) and Major Project of Medicine Science and Technology of PLA (AWS17J012).
Disclosure
The authors declare no conflicts of interest.
References
1. Kahn M, Sheppes G, Sadeh A. Sleep and emotions: bidirectional links and underlying mechanisms. Int J Psychophysiol. 2013;89(2):218–228. doi:10.1016/j.ijpsycho.2013.05.010
2. Ben Simon E, Vallat R, Barnes CM, Walker MP. Sleep loss and the socio-emotional brain. Trends Cogn Sci. 2020;24(6):435–450. doi:10.1016/j.tics.2020.02.003
3. Ferreira C, Deslandes A, Moraes H, et al. The relation between EEG prefrontal asymmetry and subjective feelings of mood following 24 hours of sleep deprivation. Arq Neuropsiquiatr. 2006;64(2B):382–387. doi:10.1590/S0004-282X2006000300006
4. Kamphuis J, Meerlo P, Koolhaas JM, Lancel M. Poor sleep as a potential causal factor in aggression and violence. Sleep Med. 2012;13(4):327–334. doi:10.1016/j.sleep.2011.12.006
5. Minkel J, Banks S, Htaik O, et al. Sleep deprivation and stressors: evidence for elevated negative affect in response to mild stressors when sleep deprived. Emotion. 2012;12(5):1015–1020. doi:10.1037/a0026871
6. Watson D, Clark LA, Tellegen A. Development and validation of brief measures of positive and negative affect: the PANAS scales. J Pers Soc Psychol. 1988;54(6):1063–1070. doi:10.1037//0022-3514.54.6.1063
7. Hughes AA, Kendall PC. Psychometric properties of the Positive and Negative Affect Scale for Children (PANAS-C) in children with anxiety disorders. Child Psychiatry Hum Dev. 2009;40(3):343–352. doi:10.1007/s10578-009-0130-4
8. Franzen P, Siegle G, Buysse D. Relationships between affect, vigilance, and sleepiness following sleep deprivation. J Sleep Res. 2008;17(1):34–41. doi:10.1111/j.1365-2869.2008.00635.x
9. Alfarra R, Fins A, Chayo I, Tartar J. Changes in attention to an emotional task after sleep deprivation: neurophysiological and behavioral findings. Biol Psychol. 2014;104:1–7. doi:10.1016/j.biopsycho.2014.11.001
10. Yoo -S-S, Gujar N, Hu P, Jolesz FA, Walker MP. The human emotional brain without sleep - a prefrontal amygdala disconnect. Curr Biol. 2007;17(20):R877–8. doi:10.1016/j.cub.2007.08.007
11. Andrews-Hanna JR, Reidler JS, Sepulcre J, Poulin R, Buckner RL. Functional-anatomic fractionation of the brain’s default network. Neuron. 2010;65(4):550–562. doi:10.1016/j.neuron.2010.02.005
12. Wang Y, Liu H, Hitchman G, Lei X. Module number of default mode network: inter-subject variability and effects of sleep deprivation. Brain Res. 2015;1596:69–78. doi:10.1016/j.brainres.2014.11.007
13. Gujar N, Yoo -S-S, Hu P, Walker M. The unrested resting brain: sleep deprivation alters activity within the default-mode network. J Cogn Neurosci. 2009;22(8):1637–1648. doi:10.1162/jocn.2009.21331
14. Sämann P, Tully C, Spoormaker V, et al. Increased sleep pressure reduces resting state functional connectivity. MAGMA. 2010;23:375–389. doi:10.1007/s10334-010-0213-z
15. Yang L, Lei Y, Wang L, et al. Abnormal functional connectivity density in sleep-deprived subjects. Brain Imaging Behav. 2018;12(6):1650–1657. doi:10.1007/s11682-018-9829-9
16. Hagmann P, Cammoun L, Gigandet X, et al. Mapping the structural core of human cerebral cortex. PLoS Biol. 2008;6(7):e159. doi:10.1371/journal.pbio.0060159
17. Chase H, Moses-Kolko E, Zevallos C, Wisner K, Phillips M. Disrupted posterior cingulate-amygdala connectivity in postpartum depressed women as measured with resting BOLD fMRI. Soc Cogn Affect Neurosci. 2014;9(8):1065–1075. doi:10.1093/scan/nst083
18. Horne CM, Norbury R. Altered resting-state connectivity within default mode network associated with late chronotype. J Psychiatr Res. 2018;102:223–229. doi:10.1016/j.jpsychires.2018.04.013
19. Tian Y, Chen X, Xu D, Yu J, Lei X. Connectivity within the default mode network mediates the association between chronotype and sleep quality. J Sleep Res. 2020;29(5):e12948. doi:10.1111/jsr.12948
20. Khazaie H, Veronese M, Noori K, et al. Functional reorganization in obstructive sleep apnoea and insomnia: a systematic review of the resting-state fMRI. Neurosci Biobehav Rev. 2017;77:219–231. doi:10.1016/j.neubiorev.2017.03.013
21. Shackman AJ, Salomons TV, Slagter HA, Fox AS, Winter JJ, Davidson RJ. The integration of negative affect, pain and cognitive control in the cingulate cortex. Nat Rev Neurosci. 2011;12(3):154–167. doi:10.1038/nrn2994
22. Vogt BA, Laureys S. Posterior cingulate, precuneal and retrosplenial cortices: cytology and components of the neural network correlates of consciousness. Prog Brain Res. 2005;150:205–217. doi:10.1016/s0079-6123(05)50015-3
23. Flores-Ramos M, Alcauter S, López-Titla M, Bernal-Santamaría N, Calva-Coraza E, Edden RAE. Testosterone is related to GABA+ levels in the posterior-cingulate in unmedicated depressed women during reproductive life. J Affect Disord. 2019;242:143–149. doi:10.1016/j.jad.2018.08.033
24. Zhang Q, Wang D, Qin W, et al. Altered resting-state brain activity in obstructive sleep apnea. Sleep. 2013;36(5):651–659. doi:10.5665/sleep.2620
25. Gong J, Chen G, Jia Y, et al. Disrupted functional connectivity within the default mode network and salience network in unmedicated bipolar II disorder. Prog Neuropsychopharmacol Biol Psychiatry. 2019;88:11–18. doi:10.1016/j.pnpbp.2018.06.012
26. Pascual-Marqui RD, Michel CM, Lehmann D. Low resolution electromagnetic tomography: a new method for localizing electrical activity in the brain. Int J Psychophysiol. 1994;18(1):49–65. doi:10.1016/0167-8760(84)90014-x
27. Larson-Prior LJ, Power JD, Vincent JL, et al. Modulation of the brain’s functional network architecture in the transition from wake to sleep. Prog Brain Res. 2011;193:277–294. doi:10.1016/B978-0-444-53839-0.00018-1
28. Olbrich S, Mulert C, Karch S, et al. EEG-vigilance and BOLD effect during simultaneous EEG/fMRI measurement. NeuroImage. 2009;45:319–332. doi:10.1016/j.neuroimage.2008.11.014
29. Benca RM, Obermeyer WH, Larson CL, et al. EEG alpha power and alpha power asymmetry in sleep and wakefulness. Psychophysiology. 1999;36(4):430–436. doi:10.1111/1469-8986.3640430
30. van Hees VT, Sabia S, Anderson KN, et al. A novel, open access method to assess sleep duration using a wrist-worn accelerometer. PLoS One. 2015;10(11):e0142533. doi:10.1371/journal.pone.0142533
31. Dinges D, Pack F, Williams K, et al. Cumulative sleepiness, mood disturbance, and psychomotor vigilance performance decrements during a week of sleep restricted to 4–5 hours per night. Sleep. 1997;20(4):267–277. doi:10.1093/sleep/20.4.267
32. Gui D, Xu S, Zhu S, et al. Resting spontaneous activity in the default mode network predicts performance decline during prolonged attention workload. NeuroImage. 2015;120:323–330. doi:10.1016/j.neuroimage.2015.07.030
33. Hoddes E, Dement W, Zarcone V, Phillips R, Dement WC. The development and use of the Stanford Sleepiness Scale (SSS). Psychophysiology. 1972;10:431–436. doi:10.1037/t07116-000
34. Basner M, Dinges DF. Maximizing sensitivity of the psychomotor vigilance test (PVT) to sleep loss. Sleep. 2005;34(5):581–591. doi:10.1093/sleep/34.5.581
35. Berry RB, Brooks R, Gamaldo C, et al. AASM scoring manual updates for 2017 (version 2.4). J Clin Sleep Med. 2017;13(5):665–666. doi:10.5664/jcsm.6576
36. Pascual-Marqui RD, Lehmann D, Koukkou M, et al. Assessing interactions in the brain with exact low-resolution electromagnetic tomography. Philos Trans a Math Phys Eng Sci. 2011;369(1952):3768–3784. doi:10.1098/rsta.2011.0081
37. Oostenveld R, Fries P, Maris E, Schoffelen J-M. FieldTrip: open source software for advanced analysis of MEG, EEG, and invasive electrophysiological data. Comput Intell Neurosci. 2011;2011:156869. doi:10.1155/2011/156869
38. Lendner JD, Helfrich RF, Mander BA, et al. An electrophysiological marker of arousal level in humans. Elife. 2020;9:e55092. doi:10.7554/eLife.55092
39. Voytek B, Kramer MA, Case J, et al. Age-related changes in 1/f neural electrophysiological noise. J Neurosci. 2015;35(38):13257–13265. doi:10.1523/jneurosci.2332-14.2015
40. Hipp J, Hawellek D, Corbetta M, Siegel M, Engel A. Large-scale cortical correlation structure of spontaneous oscillatory activity. Nat Neurosci. 2012;15(6):884–890. doi:10.1038/nn.3101
41. Hayes AF. Introduction to Mediation, Moderation, and Conditional Process Analysis: A Regression-Based Approach. Guilford Publications; 2017.
42. Durmer JS, Dinges DF. Neurocognitive consequences of sleep deprivation. Semin Neurol. 2005;25(1):117–129. doi:10.1055/s-2005-867080
43. Charness G, Gneezy U, Kuhn MA. Experimental methods: between-subject and within-subject design. J Econ Behav Organ. 2012;81(1):1–8. doi:10.1016/j.jebo.2011.08.009
44. Kaida K, Takahashi M, Åkerstedt T, et al. Validation of the Karolinska sleepiness scale against performance and EEG variables. Clin Neurophysiol. 2006;117(7):1574–1581. doi:10.1016/j.clinph.2006.03.011
45. Mander BA, Reid KJ, Davuluri VK, et al. Sleep deprivation alters functioning within the neural network underlying the covert orienting of attention. Brain Res. 2008;1217:148–156. doi:10.1016/j.brainres.2008.04.030
46. Siegel J. The neurotransmitters of sleep. J Clin Psychiatry. 2004;65(Suppl 16):4.
47. Lozano-Soldevilla D. On the physiological modulation and potential mechanisms underlying parieto-occipital alpha oscillations. Front Comput Neurosci. 2018;12:23. doi:10.3389/fncom.2018.00023
48. Horovitz SG, Braun AR, Carr WS, et al. Decoupling of the brain’s default mode network during deep sleep. Proc Natl Acad Sci U S A. 2009;106(27):11376–11381. doi:10.1073/pnas.0901435106
49. Chow HM, Horovitz SG, Carr WS, et al. Rhythmic alternating patterns of brain activity distinguish rapid eye movement sleep from other states of consciousness. Proc Natl Acad Sci U S A. 2013;110(25):10300–10305. doi:10.1073/pnas.1217691110
50. Samann PG, Wehrle R, Hoehn D, et al. Development of the brain’s default mode network from wakefulness to slow wave sleep. Cereb Cortex. 2011;21(9):2082–2093. doi:10.1093/cercor/bhq295
51. Lei X, Zhao Z, Chen H. Extraversion is encoded by scale-free dynamics of default mode network. Neuroimage. 2013;74:52–57. doi:10.1016/j.neuroimage.2013.02.020
52. Kapogiannis D, Reiter DA, Willette AA, Mattson MP. Posteromedial cortex glutamate and GABA predict intrinsic functional connectivity of the default mode network. Neuroimage. 2013;64:112–119. doi:10.1016/j.neuroimage.2012.09.029
53. Arrubla J, Tse DH, Amkreutz C, Neuner I, Shah NJ, Zang Y-F. GABA concentration in posterior cingulate cortex predicts putamen response during resting state fMRI. PLoS One. 2014;9(9):e106609. doi:10.1371/journal.pone.0106609
54. Philip NS, Sweet LH, Tyrka AR, Price LH, Bloom RF, Carpenter LL. Decreased default network connectivity is associated with early life stress in medication-free healthy adults. Eur Neuropsychopharmacol. 2013;23(1):24–32. doi:10.1016/j.euroneuro.2012.10.008
55. Gong Q, He Y. Depression, neuroimaging and connectomics: a selective overview. Biol Psychiatry. 2015;77(3):223–235. doi:10.1016/j.biopsych.2014.08.009
 © 2020 The Author(s). This work is published and licensed by Dove Medical Press Limited. The
full terms of this license are available at https://www.dovepress.com/terms
and incorporate the Creative Commons Attribution
- Non Commercial (unported, 3.0) License.
By accessing the work you hereby accept the Terms. Non-commercial uses of the work are permitted
without any further permission from Dove Medical Press Limited, provided the work is properly
attributed. For permission for commercial use of this work, please see paragraphs 4.2 and 5 of our Terms.
© 2020 The Author(s). This work is published and licensed by Dove Medical Press Limited. The
full terms of this license are available at https://www.dovepress.com/terms
and incorporate the Creative Commons Attribution
- Non Commercial (unported, 3.0) License.
By accessing the work you hereby accept the Terms. Non-commercial uses of the work are permitted
without any further permission from Dove Medical Press Limited, provided the work is properly
attributed. For permission for commercial use of this work, please see paragraphs 4.2 and 5 of our Terms.