")
Back to Journals » Clinical Optometry » Volume 13
Impact of Ocular Surface Temperature on Tear Characteristics: Current Insights
Received 17 September 2020
Accepted for publication 20 January 2021
Published 15 February 2021 Volume 2021:13 Pages 51—62
DOI https://doi.org/10.2147/OPTO.S281601
Checked for plagiarism Yes
Review by Single anonymous peer review
Peer reviewer comments 5
Editor who approved publication: Mr Simon Berry
Ankit M Shah,1 Anat Galor1,2
1Bascom Palmer Eye Institute, University of Miami, Miami, FL, USA; 2Surgical Services, Miami Veterans Affairs (VA) Medical Center, Miami, FL, USA
Correspondence: Anat Galor
Bascom Palmer Eye Institute, 900 NW 17th St, Miami, FL, 33136, USA
Email [email protected]
Abstract: Infrared (IR) thermographic assessment of ocular surface temperature (OST) is gaining interest as an adjuvant method to evaluate the ocular surface. It is a quick, non-invasive test that causes minimal, if any, discomfort to patients. The purpose of this article was to summarize research on how OST relates to tear film parameters and dry eye disease (DED). PubMed, Google Scholar, and Scopus searches for specific terms were carried out and eligible articles reviewed. OST of the central cornea is ∼ 34-35°C when measured as a single time-point (typically right after a blink). Dynamically, OST values decrease over time at a rate of ∼ − 0.01 °C/s in healthy eyes. Single time-point OST values are impacted by temperature, with positive correlations noted with both ambient (1°C↓ results in ∼ 0.16°C↓ in OST) and body (1°C↑ results in ∼ 0.98°C↑ in OST) temperature. Single time-point OST values are also impacted by tear parameters, with negative correlations noted with tear break-up time (TBUT; r=− 0.61) and positive correlations with lipid layer thickness (∼r=0.50). Dynamically, the rate of OST cooling over the interblink period correlates with various tear parameters including Schirmer’s test scores (r=− 0.39), tear meniscus height (r=− 0.52) and the rate of tear film break-up (r=− 0.74). These data imply that OST decreases more rapidly in individuals with greater tear production, larger tear volumes, and shorter tear break-up times (faster rates of tear film break-up). There are discrepancies in relationships between OST and DED across studies, which is not surprising given that DED encompasses a number of different phenotypic presentations. However, most studies found that OST decreases at a more rapid rate in DED vs. control groups. As such, cooling rate may have utility as a screening tool in DED in combination with established point-of-care tests.
Keywords: ocular thermography, tear film, dry eye
Plain Language Summary
Ocular surface temperature (OST) has potential to provide valuable insight into the status of the ocular surface. A review of the current literature was carried out to evaluate the relationship between OST and tear film parameters. Each blink “resets” the OST through heat exchange with the inner eyelid to its maximum temperature and the eye subsequently cools between each blink as it is exposed to the environment. Overall, studies have found that single time-point OST values increase with increases in ambient and body temperatures. Single time-point OST also increases in eyes with a more unstable tear film. When examining OST cooling rate, an unstable tear film, a larger quantity of tears, and increased blink frequency were all associated with greater decreases in OST over time. Given that an unstable tear film is one component of Dry Eye Disease (DED), OST may be developed into a screening tool for DED, but future studies are needed to clarify how OST can be used in this regard.
Introduction
The measurement of ocular surface temperature (OST) through infrared (IR) thermography was first introduced by Mapstone in 1968. Using a bolometer, Mapstone quantified the radiation emitted from the surface of the eye, finding that it provided a better alternative to traditionally used contact thermometry.1 Mapstone explored determinants of OST,2 measured interocular differences in OST,3 and developed thermographic profiles of various eyes.4 His work is widely cited today and has informed many studies of the ocular surface. More recently, advancements in thermographic technology have increased the accuracy of OST measurement and the technology is increasingly being applied to individuals with and without ocular surface diseases. For example, older IR thermographers had frame speeds of 4 Hz while many today have speeds up to 60 Hz, allowing for greater precision in measuring OST in real time.5 The goal of this article was to review the literature regarding relationships between OST and ocular surface health and disease, in order to provide insight into the application of thermography as an adjuvant tool to non-invasively evaluate the tear film.
Methods
PubMed, Google Scholar, and Scopus searches were conducted using the search terms “Ocular Surface Temperature” AND “Ocular Thermography” AND “tear film” OR “dry eye.” All published scientific articles from 1968 to 2020 were considered, including original research, meta-analyses, and systematic reviews. Abstract-only results and uncited excerpts were excluded. Articles were further excluded if they were deemed not clinically relevant (eg diseases not directly related to the ocular surface and tear film). Of 164 returned search results, 43 were deemed eligible and reviewed.
Results
Definitions and Important Equations
Before reviewing data on OST measurements as they relate to the eye, we first introduce definitions that will be used throughout the manuscript. We also present two equations that summarize the influence of various factors on OST.
Definitions
Single Time-Point OST Measurement
The temperature measured at a single time-point, such as at the beginning of the interblink period.
Dynamic OST Measurement
Cooling rate over the interblink period, reported as °C decrease per second(s) and expressed as a negative number.
Interblink Period
The time, in seconds (s), between one blink and the next blink.
Mean OST
The average OST (single time-point or dynamic) value for a group of subjects.
Equations
Pennes Bioheat Equation (applied to the Anterior Eye) (Equation 1):6
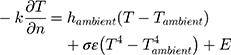
Where:

hambient = ambient convection coefficient
Tambient = ambient temperature
T = corneal temperature
σ = radiation coefficient (Stefan-Boltzmann constant)
ε = emissivity
E = heat loss due to evaporation
Further,
E = c (Pc - Pa) (Equation 2), where c is the evaporative cooling constant, Pc and Pa are the vapor pressure at the corneal surface and atmosphere, respectively.7
The eye is constantly exposed to, and exchanges heat with, the environment. Heat loss primarily occurs through convection (caused by unrestricted air flow across the convex surface of the cornea), radiation, and evaporation.3 The first term in Equation 1 refers to convective heat loss between the eye and environment ( , the second term refers to radiation heat loss between the eye and the environment
 , and the third term refers to evaporative heat loss (E). Notably, other factors not directly present in this equation will affect these terms, such as humidity and water vapor pressure in the case of evaporation, as shown in the second equation (Pc - Pa). In addition, increases in air flow velocity can increase both convective and evaporative heat loss from the eye.8 Each of these forms of heat loss, and their individual factors, impact the overall cooling at the ocular surface.3,4 For example, higher corneal temperatures (T), lower ambient temperatures (Tambient), and higher evaporative heat loss (E) will result in a faster (larger) cooling rate (reflected by -k
 ) at the ocular surface, expressed as a negative number. Equation 1 explains many of the noted relationships described below.6,7 It is also important to note that although cooling rates are reported as linear in the various studies, actual cooling rates, as reflected in Equation 1, are not linear in nature.
Instruments to Measure Ocular Surface Temperature
The technology used to measure OST has evolved over time. Early methods, like thermistors and mercury bulbs, utilized direct contact to measure temperature. However, conductive heat exchange between the probe and ocular surface, reflex tearing, and potentially poor resolution produced inaccurate results.5,9 Since 1968, IR thermography has become the standard for obtaining OST. IR thermography offers two important advantages over direct contact methods. First, it is noninvasive and quickly obtains measurements. Second, IR thermographers can reflect temperature variations across the ocular surface, which direct contact methods are unequipped to do.5,10,11
Specifically, IR Thermographers measure radiation emitted from a specified region of interest (ROI) on the ocular surface, which can include the entire cornea or a circle of specific diameter around the center or limbus. A specific range of the IR spectrum passes through a coated lens onto a photosensitive detector which converts the stimulus into a measured voltage, current, or resistance. These changes are processed through software and reflected as temperature through a color-coded thermographic profile.10,11
The typical measurement protocol affords subjects 10–20 minutes to adjust to room conditions followed by subjects closing and/or blinking their eyes before keeping them open for a specific period of time. Several studies restricted measurements to between late morning to early afternoon, as OST varied significantly throughout the day in some5 but not all12 studies. The temperature is then measured in a predefined circular ROI (eg 4 mm diameter) set through the thermographer.5,9,13,14
With this set up, thermographers can provide different measurements. Single time-point measurements reflect OST at a defined time point, such as immediately after a blink. For example, a study of 60 healthy young Chinese adults obtained single time-point temperature measurements in various areas of the cornea 5 seconds after blinking. They found that temperatures varied across the cornea, both vertically and horizontally. The corneal center was approximately 34.39 ± 0.47°C with peripheral temperatures increasing to 34.91 ± 0.48°C superiorly, 34.62 ± 0.49°C inferiorly, 35.25 ± 0.46°C temporally, and 35.33 ± 0.36°C nasally.9 Dynamic measurements reflect OST cooling rate, such as over a period of 10 seconds after a blink. In a cohort of 62 individuals with dry eye disease (DED, defined as use of tear replacement therapy and tear break-up time (TBUT) ≤10 s or Schirmer test <10 mm at 5 minutes) and 63 sex- and age-matched controls, the cooling rate over 10 seconds of sustained eye opening (obtained through constant thermographic recording) in dry eyes (−0.02 °C/s) was greater than in controls (−0.01 °C/s).13 However, it is important to note that the resolution may differ between thermographers (Table 1),9,15–27 which needs to be considered when interpreting the above data.
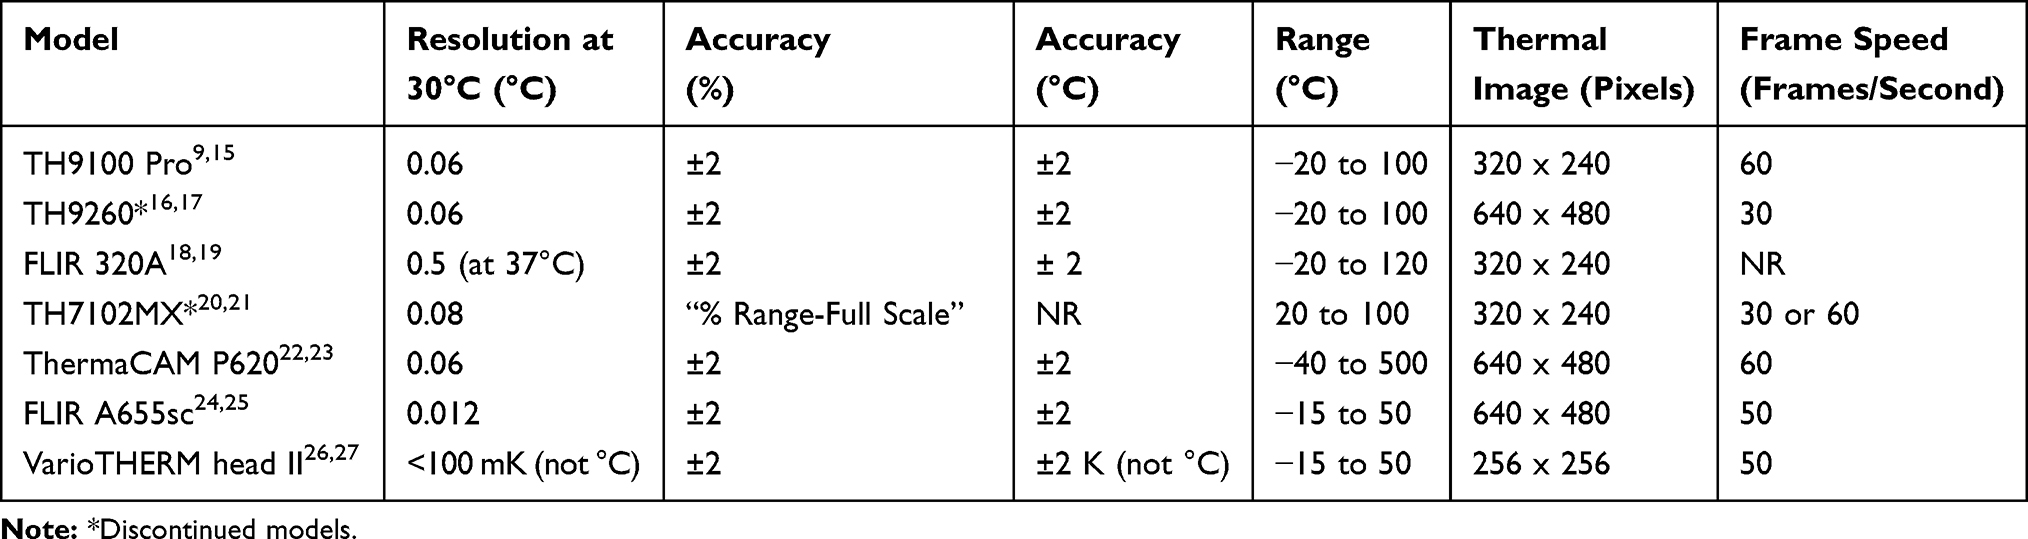 |
Table 1 Relevant Specifications for Selected IR Thermographers. NR = Not Reported in Available Specifications on Company Website |
Overall, the different IR thermographers share many properties, but differences exist between devices. For example, while many devices utilize a frame speed of 30 Hz, each has a slightly different resolution (Table 1). Furthermore, repeatability has been established through studies for some,16 but not all instruments. As such, when evaluating the studies below, it is important to note that different devices were used for different studies and values between devices may not be completely interchangeable.5,9,13,14
Ocular Surface Temperature in Healthy Eyes
The growing importance of thermography and temperature in understanding the ocular surface has also increased the importance of establishing normal values in healthy eyes. The single time-point OST of healthy eyes typically ranges from 31 to 37°C in older literature.5,9 The wide range may be due to several factors, including the use of older instruments, inherent variability among individuals, and the inclusion of different ROIs (entire eye vs. center).5,9 Several factors can affect OST in healthy individuals. The first variable is time. OST is at its maximal value immediately after each blink as the ocular surface comes into contact with the vascular supply of the eyelid, allowing for heat exchange. After blinking, the ocular surface remains exposed to the environment, decreasing the surface temperature until the next blink can reset the temperature back to its initial, maximal value.1,5 Other variables include age and location measured within the ocular surface. One study measured OST in five distinct regions - the temporal canthus, temporal-central region, central cornea, central-nasal region, and nasal canthus - over 7 seconds after a blink in the right eyes of 220 healthy individuals. While no significant differences were found between male and female subjects, temperature did vary with age and across the regions. Immediately after each blink, ocular surface was warmest at the nasal canthus (35.78 ± 0.49°C in males, 35.68 ± 0.49°C in females) and coolest at the corneal center (35.00 ± 0.58°C in males, 34.93 ± 0.46°C in females). Younger eyes (18–40 years) were significantly warmer than middle-age (41–64 years) and elderly (65+ years) eyes. At the central cornea in females, young eyes measured 35.20 ± 0.45°C, middle-age eyes measured 35.00 ± 0.54°C, and elderly eyes measured 34.60 ± 0.39°C (p < 0.05).18 Overall, single point OST in healthy eyes ranges from 34–35°C (Table 2).13,14,18,22,24,28–32 However, values can be impacted by age (declining values with increasing age), location (lower values in central cornea compared to other regions), and seconds elapsed since the last blink (lower values with more time elapsed since blink).
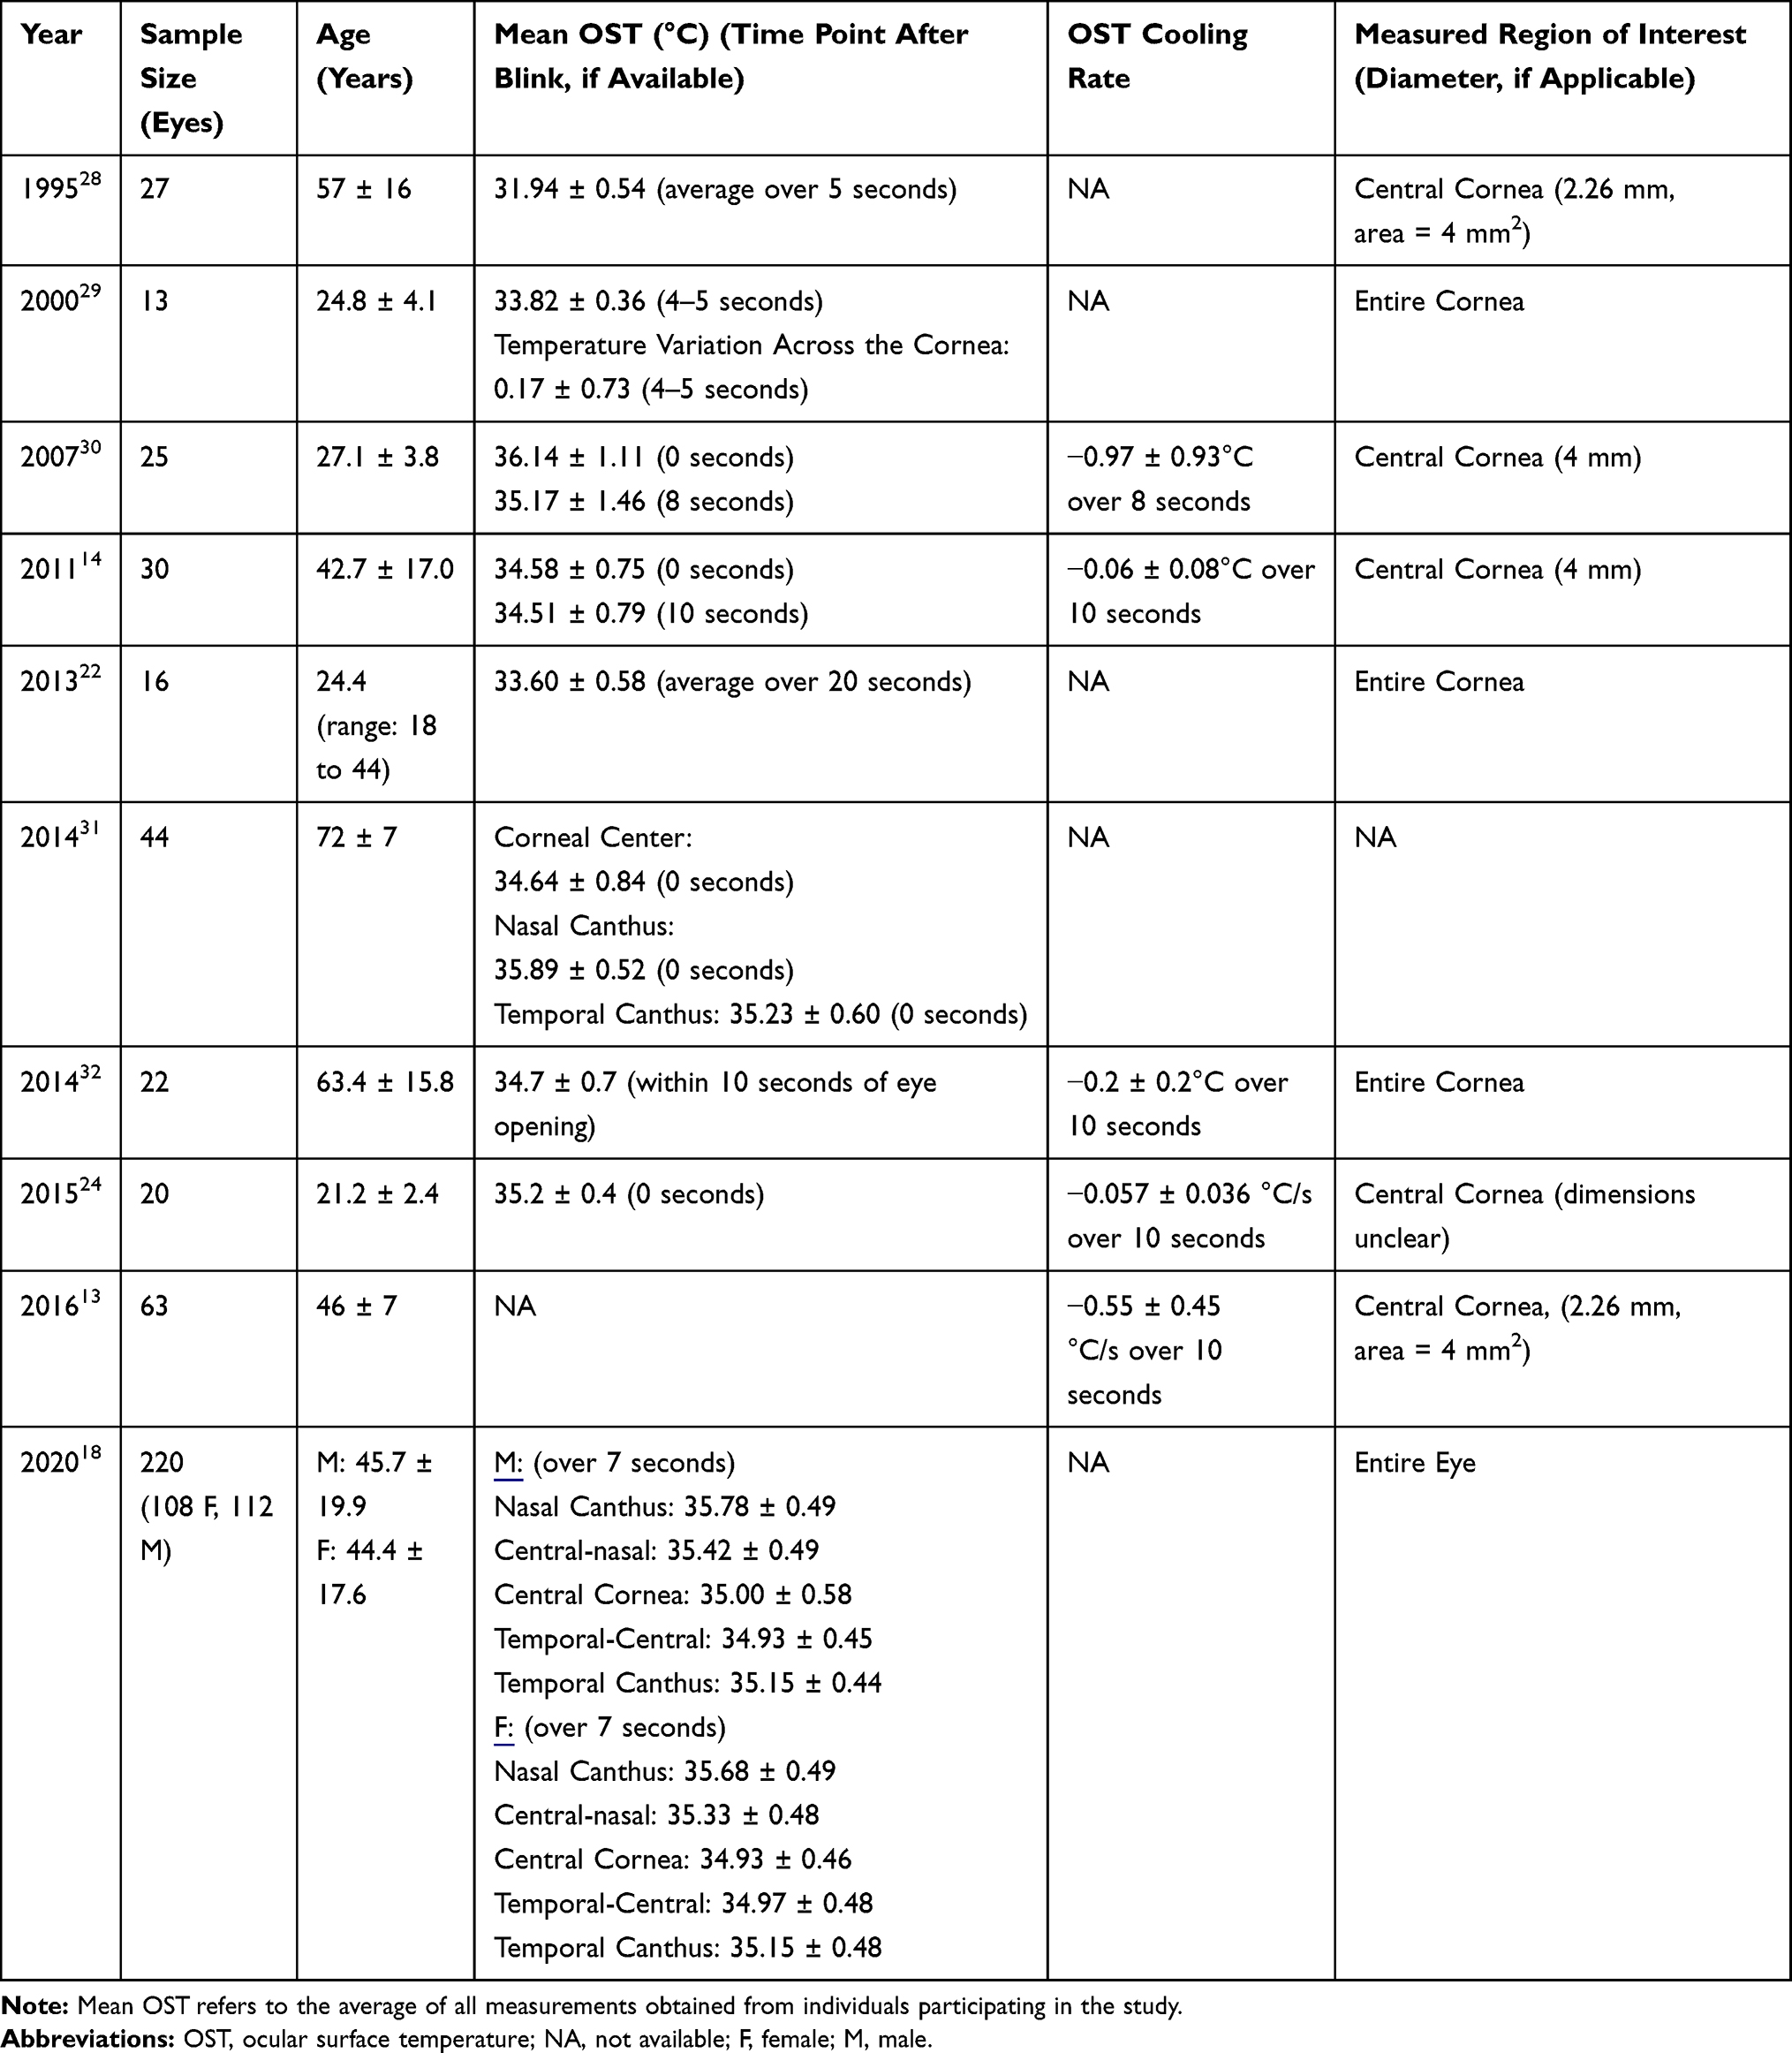 |
Table 2 Summary of Mean OST and Change in OST (if Measured) in Healthy Individuals Participating in Studies Referenced in This Review |
Determinants of Ocular Surface Temperature (OST)
Both intrinsic and extrinsic factors can impact OST (Figure 1).
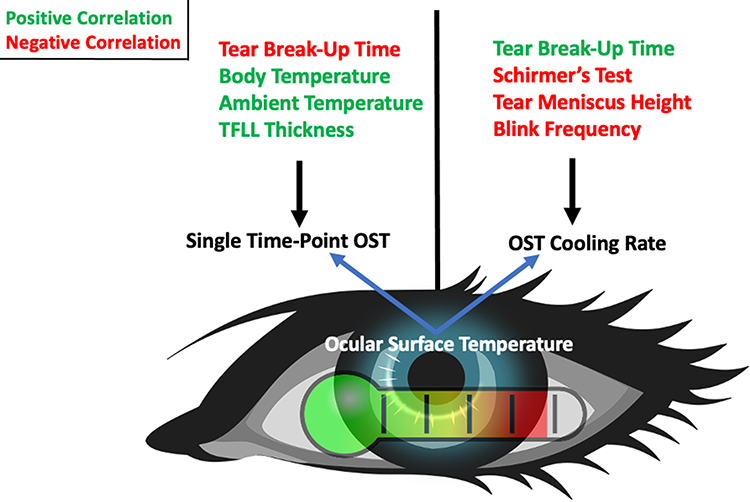 |
Figure 1 Tear film characteristics are associated with ocular surface temperature (OST) and change in OST over time. OST correlates positively and negatively with different variables, most notably tear break-up time, body temperature, ambient temperature, lipid layer thickness, Schirmer’s Test (tear production), Tear Meniscus Height (tear volume), and blink frequency. Green text indicates that the variable is positively correlated with either OST or change in OST and red text indicates a negative correlation. Eyes with short tear break-up times and thin lipid layers from an individual with a warmer body temperature and in warmer surroundings would be expected to have warmer OST. On the other hand, eyes with short tear break-up times, high Schirmer’s test scores, and high tear meniscus height are expected to have larger changes in OST over the interblink period, which is also associated with a higher blink frequency. |
Extrinsic Factors
Ambient temperature can affect single time-point OST. In a 1968 study of four healthy subjects, ambient temperature was restricted between 18 and 27°C and the corneal temperature in both eyes was measured 17 times in the late afternoon over the course of 8 weeks with 15 minutes allocated for equilibration with room conditions prior to measurement. The study found a mean fall in OST of −0.15°C per 1°C fall in ambient temperature across this specific temperature range.2
A more recent study utilized a controlled environment chamber (CEC) to more robustly investigate this relationship.33 A British study exposed 12 healthy individuals to a constant RH of 40% and varying ambient temperatures of 5, 10, 15, 20, and 25°C. After 10 minutes of adjustment to the environment, OST was measured at the corneal center over an area with a 4 mm diameter. OST dropped from approximately 35 to 31°C as ambient temperature dropped from 25 to 5°C (p < 0.05). Of note, cooler temperatures were also associated with decreased lipid layer thickness, shorter tear break-up times, and slower tear evaporation rates.34
Studies have also investigated relationships between RH and OST with constant ambient temperature. A study in Singapore assessed OST in 2 RH conditions, 45% and 65%, with a constant ambient temperature of 30°C in 10 healthy individuals. After 20 minutes of adaptation to each condition, thermal imaging of the entire cornea in both eyes was taken over a 20 second period. The OST in 65% RH (mean: 35.2°C, 95% CI = 35.0–35.6°C) was minimally yet significantly greater than in 45% RH (mean = 34.9°C, 95% CI = 34.6–35.2°C) (p = 0.001). Interestingly, blink rate, tear evaporation rate, and TBUT did not significantly correlate with changes in humidity.26
A British study evaluated OST in lower RH conditions by exposing 12 healthy individuals to 20% (dry) and 40% (control) RH with a constant temperature of 25°C for 60 minutes. Median OST at the corneal center was not significantly different in the dry (35.4°C, IQ: 34.7–36.1°C) versus control condition (35.2°C, IQ: 34.6–35.9°C) (p = 0.859). Furthermore, tear production, as measured by the Schirmer Test, and core body temperature did not differ between the two conditions.22 Overall, ambient temperature appears to have a greater impact than RH on single-point OST measurements. Notably, larger differences in RH may have had a larger effect on OST, but further controlled investigation are needed.
Intrinsic Factors
Like the ambient temperature, body temperature can also influence OST. A British study of 25 healthy individuals evaluated correlations between OST in the right eye (area 4 mm in diameter at the corneal center after 10 minutes of adaptation) and body temperature (measured just above the root of the nose). Mean OST (36.14 ± 1.11°C) measured immediately after eye opening and mean body temperature (35.63 ± 0.91°C) had a strong positive correlation (r = 0.80, p < 0.001). A regression line fitted to the data found that a 1°C rise in body temperature resulted in a 0.98°C rise in single time-point OST measured immediately after blinking.30
In addition to body temperature, contact time with the vascular palpebral conjunctiva (as a local heat source) can affect OST.1,5 In a 1968 British study, the effect of lid closure on corneal temperature was investigated in 5 healthy individuals. OST was measured (across the entire cornea after 15 minutes of adaptation to the environment) immediately before and after subjects closed their eyes for 5 minutes. Overall, OST increased by a mean of 1.5°C with a range of 1.1 to 2.0°C after lid closure for 5 minutes.1
Ocular inflammation may also contribute to OST, although the data is less robust in this regard. A small case series evaluated differences in OST across the entire eye in 6 individuals with unilateral ocular inflammation (1 anterior uveitis, 2 anterior scleritis, 2 posterior scleritis, and 1 meibomian gland dysfunction associated keratitis (MGD-keratitis)), 2 individuals with other unilateral pathologies (conjunctival benign reactive lymphoid hyperplasia (BRLH) and central serous chorioretinopathy (CSCR)), and 1 control. Five of six individuals with ocular inflammation (all except for the individual with MGD-keratitis) had higher OST in the affected vs. non-affected eye, with affected eyes measuring between 0.35°C (anterior uveitis) and 1.13°C (anterior scleritis) warmer than non-affected eyes. Interestingly, the affected eye in the individual with MGD-keratitis was cooler (−0.63°C) than the non-affect eyes, a pattern also seen in the individuals with BRLH and CSCR (−0.2 and −0.18°C compared to non-affected eyes, respectively).35 OST in the healthy control were equal between the eyes. These findings indicate that ocular surface inflammation may impact OST.
Overall, the data suggest that OST is impacted by ocular and systemic status, with a strong positive correlation between OST and body temperature and weaker data on effects of ocular inflammatory pathologies and OST.
Blinking
Quality and quantity of blinks are also related to OST. The process of blinking increases OST along the corneal surface by facilitating heat transfer between the eyelid and ocular surface. A complete blink is necessary to fully reset the OST after each interblink period. On the other hand, partial blinks leave areas of the ocular surface exposed and thus cooler after each blink. A mathematical, computer-generated model demonstrated that a series of partial blinks would slowly decrease the OST across the entire cornea measured immediately after each incomplete blink.36
This relationship has also been studied in humans. A prospective study examined 98 eyes of 69 Japanese subjects one month after cataract surgery. OST was continuously measured over the central cornea (4 mm diameter) for 10 seconds and, on a separate occasion, blink rate was measured over 60 seconds. Subjects were stratified by the presence of a stable (TBUT > 5 s) or unstable (TBUT < 5 s) tear film. In both groups, blink rate (stable tear film: 4.9 ± 5.8 blinks/minute; unstable tear film: 9.3 ± 7.5 blinks/minute) negatively correlated with OST cooling rate over 10 seconds (stable tear film: −0.27 ± 0.23°C; unstable tear film: −0.56 ± 0.23°C, r = −0.43, p <0.0001);37 that is, a faster cooling rate was associated with a higher blink rate. One hypothesis is that TRPM8 receptors on corneal thermoreceptors drive this association by sensing temperature drop on the ocular surface and triggering a blink reflex.38–41
Tear Film
The tear film acts as an interface between the external environment and the ocular surface. It provides a smooth layer over the cornea necessary for clear vision and protection. The tear film consists of muco-aqueous and lipid layers, the latter acting as a barrier to aqueous evaporation. Different qualities of the tear film can affect the OST.42
Tear Film Break-Up Time
Tear Break-Up Time (TBUT), which represents tear film stability, is defined as the time interval between a complete blink and the first occurrence of a dry spot on the tear film. It can be visualized with fluorescein dye (FTBUT) or with specialized instruments (non-invasive break up time (NIBUT)).5,9 In the British study above, NIBUT was assessed in 23 participants as they held their eyes open for as long as possible after a complete blink. Mean NIBUT (14.4 ± 6.7 seconds) negatively correlated with mean OST measured immediately after a blink (36.14 ± 1.11°C; r = −0.68, p = 0.001). That is, the ocular surface of individuals with poor tear film stability (shorter NIBUT) was warmer (higher OST) immediately after a blink than those with good tear film stability.30 This association may be driven by a faster blink rate (just prior to the measurement period) in individuals with shorter NIBUT, driven by heat exchange between the ocular surface and vascular palpebral conjunctiva.1
The relationship between tear film stability and OST cooling rate has also been studied. For example, an American study assessed the rate of formation of areas with fluorescein tear break-up (FTBU) (defined as the percentage of the corneal surface with areas of FTBU over time) and OST cooling rate (3 successive measurements taken across the entire cornea with 20 seconds of rest in between) in 20 control eyes. The mean OST at the start of the interblink period measured 35.2 ± 0.4°C and then decreased by −0.80 ± 0.47°C over a mean interblink period of 15.50 ± 10.27 seconds. OST cooling rate (mean: −0.06 ± 0.04 °C/s) negatively correlated with the FTBU formation rate (mean: 3.1%/s; r = −0.74, p < 0.001).24 That is, individuals with decreased tear film stability (higher FTBU) had a larger OST cooling rate. Unstable tear films likely result in greater evaporative heat loss (E in Equation 1) from the aqueous layer and would consequently lose more heat over time ( compared to eyes with stable tear films and lower evaporative heat loss (Equation 1).6,42
Other studies have found similar relationships. A Taiwanese study evaluated tear film parameters of 227 individuals (195 with DED, defined as an Ocular Surface Disease Index score ≥ 23 and FTBUT < 5 seconds or a Schirmer’s Test < 5 mm over 5 minutes, and 22 controls). After 10 minutes of adjustment to the environment, OST was measured over 4 seconds in 3 separate regions of interest each 3 mm in diameter: nasal, corneal center, and temporal. This study then calculated a normalized OST by dividing the OST at a given number of seconds after each blink (eg at 1 second post-blink, 2 seconds post-blink, etc.) by the maximum value measured at the beginning of the interblink period. A smaller normalized OST indicated faster cooling. Individuals were divided into four groups based on right eye FTBUT and Schirmer Test values:
Group 1: FTBUT > 5 seconds and Schirmer > 5 mm
Group 2: FTBUT ≤ 5 seconds and Schirmer > 5 mm
Group 3: FTBUT ≤ 5 seconds and Schirmer ≤ 5 mm
Group 4: FTBUT > 5 seconds and Schirmer ≤ 5 mm
Overall, Groups 1 and 4 had the smallest decrease in OST while Group 2 had the greatest decrease in OST over the 4 second period. These differences were significant at the corneal center, but similar trends were observed nasally and temporally. These data suggest that eyes with a less stable tear film (FTBUT ≤ 5 seconds) had a larger (more negative) decrease in OST compared to eyes with a more stable tear film, independent of tear production. In fact, eyes with poor stability but sufficient tear production had the fastest decline in temperature (more negative OST cooling rate). Perhaps this finding can be explained by a greater volume of tears evaporating off the ocular surface and thereby removing more heat.43
To summarize, multiple studies have demonstrated that tear film instability correlates with a faster OST cooling rate over the interblink period. Taken together, eyes with short TBUTs may blink more frequently37 with the effect of generating a warmer single time-point OST measurement immediately after blink, but then exhibit a greater cooling rate over the interblink period due to more rapid tear film break-up.
Lipid Layer
The tear film lipid layer (TFLL) is a protective covering that improves tear film stability by retarding evaporation of the aqueous component.20,29,44 One British study of 13 healthy volunteers and 8 individuals with dry eye disease (DED defined by prior diagnosis, symptoms, and NIBUT < 20 s) assessed relationships between lipid layer thickness, OST, and NIBUT. While lipid layer thickness did not significantly correlate with OST, it did influence NIBUT, where thinner lipid layers were associated with faster tear breakup times.29
In contrast, a study of 29 young healthy individuals from the UK and Spain reported a moderate positive relationship between TFLL thickness and OST (r = 0.52, p = 0.004). After 20 minutes of adjustment to the environment, OST for each individual was calculated (at the corneal center, 4 mm diameter) by averaging the initial (immediately after blinking) and final (just prior to the subsequent blink) OST during the interblink period. Overall, eyes with thinner lipid layers (30–50 nm) had a mean OST ~ 1°C cooler than eyes with thicker lipid layers (50–90 nm).20 These data demonstrate discrepancies in the relationship between the TFLL thickness and OST.
Tear Production and Volume
The lacrimal gland is responsible for the bulk of aqueous production. The Schirmer’s Test is used to measure aqueous production while Tear Meniscus Height (TMH) is an indicator of tear volume. Several studies investigated the influence of tear production and volume on OST.30,45 A Taiwanese study of 43 eyes of healthy individuals evaluated the relationship between OST dynamics, TMH, and Schirmer’s Test results. OST dynamics were calculated as the difference in OST at various time points and immediately after blinking. After 10 minutes of adjustment to the environment, OST was measured in an area over the corneal center (5 mm in diameter) over 4 seconds. TMH and Schirmer’s Test were measured separately, with 10 minutes between each test. Overall, OST decreased by −0.06°C at 1 second, −0.07°C at 2 seconds, −0.1°C at 3 seconds, and −0.12°C at 4 seconds as compared to immediately after a blink. Mean TMH and Schirmer’s Test values were 218.6 ± 94.8 µm and 7.0 ± 5.1 mm, respectively. Both TMH and Schirmer’s Test negatively correlated with a decrease in OST (3 seconds: TMH: r = −0.52, p = 0.0003 and Schirmer’s Test: r = −0.39, p = 0.008). That is, eyes with greater tear volumes and production had faster (more negative) OST cooling rates.46
Table 3 summarizes relationships between the determinants discussed above and single time-point and/or dynamic (over the interblink period) OST measures.
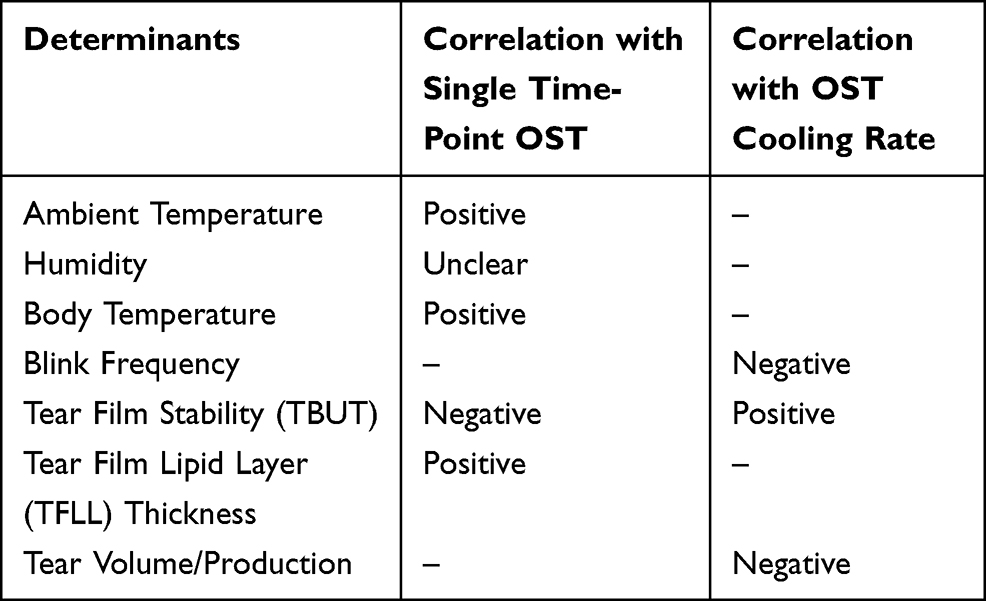 |
Table 3 Determinants of Ocular Surface Temperature |
Ocular Surface Temperature in Dry Eye Disease (DED)
The TFOS DEWS II Report defined DED as
A multifactorial disease of the ocular surface characterized by a loss of homeostasis of the tear film, and accompanied by ocular symptoms, in which tear film instability and hyperosmolarity, ocular surface inflammation and damage, and neurosensory abnormalities play etiological roles.
It is a heterogeneous condition with a plethora of symptoms (pain and poor visual quality) and signs (increased break up, corneal epithelial disruption, decreased tear volume and production, high or unstable osmolarity, ocular surface inflammation).47
Single Time-Point OST Measurements and DED
Several studies have investigated differences in single time-point OST measures in individuals with DED as compared to controls. A British study measured single time-point OST in 36 individuals with DED (defined as FTBUT ≤ 10 s or Schirmer’s test < 10 mm at 5 minutes) and 27 age- and sex-matched controls. After 20 minutes of adjustment to the environment, OST was assessed 4–5 seconds after blinking at five distinct regions (1 mm2 area): corneal center, nasal limbus, nasal conjunctiva, temporal limbus, and temporal conjunctiva. The mean OST was slightly higher in the DED versus control group (32.38 ± 0.69°C vs. 31.94 ± 0.54°C; p < 0.001). In addition, the difference between corneal and limbal OST was also greater in the DED versus control groups (0.64 ± 0.26°C vs. 0.41 ± 0.20°C; p < 0.001). Looking at individual tear parameters, the difference between corneal and limbal OST was greater in eyes with TBUT ≤ 6 seconds (0.81 ± 0.29°C) and Schirmer’s Test ≤ 4 mm (0.83 ± 0.26°C) compared to eyes with TBUT > 6 seconds (0.56 ± 0.17°C) and Schirmer’s Test > 4 mm (0.55 ± 0.28°C) (p < 0.05).28 Overall, mean OST was slightly warmer at the corneal center of the DED vs. control group, with a larger difference in temperature between the limbal and central cornea in the DED group, as well. Limbal hyperemia (leading to warmer limbal temperatures) in the DED group may explain the regional variation in temperature between the limbus and central cornea.28,35
However, discrepancies exist across studies. In another British study, 8 individuals with DED (previous symptoms/diagnosis and NIBUT < 20 s) and 13 controls underwent measurements of central corneal OST (average temperature across the entire cornea) 4–5 seconds after each blink after 20 minutes of adaptation to the environment. In contrast to the previous study, mean OST was cooler in the DED vs. control group (33.24 ± 0.78°C vs. 33.82 ± 0.36°C; p = 0.032).29 Notably, the control group in the latter study (mean 24.8 years) was significantly younger than the DED group (mean 60.3 years) and the definition of DED used in the study was unusual (NIBUT < 20 s, while typical values are < 5 or 10 s to define DED).43
Yet another study found no differences in single time-point OST measures between DED and control groups. A prospective Japanese study examined 30 individuals with DED (subjective symptoms, TBUT < 5 s or Schirmer I test < 5 mm, and cornea and conjunctiva staining) and 30 controls and measured OST continuously over 10 seconds after blinking at 3 regions: corneal center (4 mm diameter), nasal conjunctiva (2 mm diameter), and temporal conjunctiva (2 mm diameter). Mean single time-point OST immediately after blinking did not differ between the two groups in any of the regions studied (corneal center: DED: 34.45 ± 0.86°C, control: 34.58 ± 0.75°C; nasal conjunctiva: DED: 34.96 ± 0.73°C, control: 35.09 ± 0.72°C; temporal conjunctiva: DED: 34.75 ± 0.82°C, control: 34.79 ± 0.75°C).14
To summarize, discrepancies have been found across studies regarding single time-point OST measurements in DED and control groups. Possible contributors to these discrepancies include population and timing (after 4–5 seconds vs. immediately after a blink) differences. However, overall, single time-point OST measurements do not appear to be a reliable method for differentiating between DED and healthy controls.
OST Cooling Rate and DED
The relationship between DED and OST cooling rate over the interblink has been more robust. The Japanese study above found a larger decrease in OST over 10 seconds in the DED vs. control group (−0.32 ± 0.23°C vs. −0.06 ± 0.08°C, p < 0.05).14 Similarly, a Taiwanese study of 76 individuals with DED (FTBUT < 10 s and Schirmer’s Test < 5 mm over 5 min) and 47 controls found that OST (measured across the entire eye over an interblink period of 6 seconds after 10 minutes of adjustment to the environment) decreased to a greater extent in the DED compared to control group (−0.75 ± 0.24°C vs. −0.48 ± 0.18°C, respectively; p < 0.0001).48
Based on these data, cooling rate has been investigated as a potential screening tool for DED. In the previously discussed Taiwanese study, the normalized OST at the corneal center over an interblink period of 3 seconds dropped from 1.00 to ~0.93 in the DED group and from 1.00 to ~0.96 in controls (indicating that eyes with DED cooled to a greater extent). When a normalized OST after 3 seconds of 0.97 was applied as a cutoff for a DED diagnosis, the sensitivity, specificity, and area-under-the-curve were 0.71, 0.77, and 0.71, respectively.43 However, a limitation in the study is that individuals with DED were significantly older than controls (50.1 years ± 14.4 vs. 38.4 years ± 15.0; p < 0.001) and OST has been shown to decrease with age.
OST by DED Sub-Types
Another study investigated if OST could differentiate various DED sub-types. An American study examined individuals with evaporative DED (EDE, FTBUT < 10 s and Schirmer’s Test > 10 mm), aqueous-deficient DED (ADDE, Schirmer <10 mm), Sjogren’s Syndrome (SS), and controls (10 patients in each group). In a controlled environment chamber, OST was measured over 5 seconds at the corneal center (5.4 mm diameter), nasal conjunctiva (3.6 mm diameter), and temporal conjunctiva (3.6 mm diameter). At all regions (nasal (n), corneal center (c), temporal (t)), mean OST measured at the beginning of the interblink period was lower in DED (both EDE and ADDE) than control eyes (EDE: n: 35.12 ± 0.60°C; c: 34.56 ± 0.56°C; t: 34.56 ± 0.56°C; ADDE: n: 34.89 ± 1.00°C; c: 34.16 ± 1.12°C; t: 34.57 ± 0.94°C; SS: n: 34.99 ± 0.65°C; c: 34.40 ± 0.62°C; t: 34.85 ± 0.51°C; controls: n: 35.78 ± 0.52°C; c: 35.11 ± 0.64°C; t: 35.26 ± 0.47°C, p<0.05 for all). With regards to cooling rate over the entire interblink period, eyes with ADDE had the largest percent decline in OST (−2.8%) followed by SS (−2.2%), controls (−2.2%), and lastly EDE (−1.9%). These data contradict previous studies. First, prior studies reported that individuals with DED (combined ADDE and EDE sub-types) had greater decreases in OST compared to controls whereas in this study ADDE but not EDE followed this trend. Second, a prior study found that eyes with shorter TBUT but sufficient tear production (similar to EDE group in this study) showed the greatest OST cooling rate whereas in this study that group (EDE) showed the smallest OST cooling rate. Again, population and methodology-based differences between the studies may be driving these discrepancies.
To add to the confusion, not all studies found differences in OST by DED subtype. An Italian study also grouped individuals by DED sub-types (without control group) and included 24 individuals with ADDE (TBUT < 5 s, Schirmer ≤ 7 mm, a diagnosis of SS, and/or normal meibomian gland function) and 14 with EDE (TBUT < 5 s, Schirmer > 7 mm, no diagnosis of SS, and/or abnormal meibomian gland function). In contrast to other studies,43,49 OST decreased to a uniform degree in eyes with ADDE (−0.0037 °C/s) and EDE (−0.0042 °C/s). Overall, these decreases are also much lower than those found in other studies evaluating eyes with DED.50
Overall, the most robust finding among studies is that the cooling rate is faster in individuals with DED (variably defined) compared to controls. However, discrepancies arise with regards to single time-point OST and OST differences by DED sub-type. Because DED can be characterized by several abnormal tear film parameters, including TBUT and Schirmer’s, each of which may have a different effect on OST, these discrepancies are not unanticipated.
Discussion and Clinical Applications
Since the introduction of ocular thermography in 1968, OST has been used to study conditions of eye health and disease. Values for OST measured immediately after blinking are around 34–35°C in eyes without ocular pathology with a decrease over the interblink period. The avascular central cornea is cooler than the limbus immediately after a blink and experiences a greater decrease in OST over time. Many factors affect OST including ambient and body temperature, inflammation, and blinking. For example, OST correlates more strongly with body temperature (r = 0.80) and less strongly with ambient temperature (OST dropped by 4°C when temperature dropped by 20°C). Blinking exposes the ocular surface to the vascular conjunctival palpebra and facilitates heat exchange, essentially resetting the OST to its maximal value after each complete blink. OST is also affected by tear film parameters. Studies have consistently shown that shorter tear break-up times lead to larger decreases in OST over the interblink period (that is, faster cooling rates). Less consistent associations have been noted between OST and tear volume and production. Given that these parameters define DED, there is interest in using OST as a screening tool for DED. DED, however, is an umbrella term and includes different sub-types including EDE and ADDE and it is not clear that OST can differentiate between DED sub-types. Furthermore, as highlighted in this review, there are inconsistencies across studies that must be taken into account when interpreting results, such as differences in instrumentation, measurement techniques, and populations studied. As many factors can influence OST, standardizing protocols will be important when designing studies that evaluate the utility of IR thermography for clinical use, such as for a point of care test in dry eye. This includes using the same ROI, room conditions (temperature, humidity), and time points (immediately after a blink) across studies and considering the contribution of patient related confounders (age, gender). Furthermore, studies are needed to clarify relationships between other aspects of the anterior eye and OST, such as corneal thickness and endothelial cell density.51
Designing studies with standardization of different parameters – like ROI, room conditions, and population characteristics – will improve the utility of IR thermography in clinical use, such as for diagnosing dry eye disease.
Conclusion
To conclude, cooling rate is impacted by tear film parameters, measured via tear break-up time, lipid layer thickness, and tear volume/production. All of these parameters may be abnormal in DED and as such, OST may be developed into a point of care test to assess ocular surface health. However, considerations such as temporal and spatial variation of temperature on the ocular surface, environmental conditions, and population-based factors need to be recognized when investigating disease pathology and developing screening tools for disease based on OST.
Disclosure
Dr Galor was supported by the Department of Veterans Affairs, Veterans Health Administration, Office of Research and Development, Clinical Sciences R&D (CSRD) I01 CX002015 (Dr. Galor) and Biomedical Laboratory R&D (BLRD) Service I01 BX004893 (Dr. Galor), Department of Defense Gulf War Illness Research Program (GWIRP) W81XWH-20-1-0579 (Dr. Galor) and Vision Research Program (VRP) W81XWH-20-1-0820 (Dr. Galor), National Eye Institute R01EY026174 (Dr. Galor) and R61EY032468 (Dr. Galor), NIH Center Core Grant P30EY014801 (institutional) and Research to Prevent Blindness Unrestricted Grant (institutional). The authors have no other potential conflicts of interest to disclose.
References
1. Mapstone R. Measurement of corneal temperature. Exp Eye Res. 1968;7(2):237–243. doi:10.1016/S0014-4835(68)80073-9
2. Mapstone R. Determinants of ocular temperature. Br J Opthalmol. 1968;52:729–741. doi:10.1136/bjo.52.10.729
3. Mapstone R. Normal thermal patterns in cornea and periorbital skin. Br J Ophthalmol. 1968;52(11):818–827. doi:10.1136/bjo.52.11.818
4. Mapstone R. Ocular thermography. Br J Ophthalmol. 1970;54(11):751–754. doi:10.1136/bjo.54.11.751
5. Purslow C, Wolffsohn JS. Ocular surface temperature: a review. Eye Contact Lens. 2005;31(3):117–123. doi:10.1097/01.ICL.0000141921.80061.17
6. Li E, Liu GR, Tan V, He ZC. Modeling and simulation of bioheat transfer in the human eye using the 3D alpha finite element method (αFEM). Int j Numer Method Biomed Eng. 2010;26(8):955–976. doi:10.1002/cnm.1372
7. Ferguson DB. Physiology for Dental Students. London: Butterworth Scientific; 1988.
8. Freeman RD, Fatt I. Environmental influences on ocular temperature. Invest Ophthalmol. 1973;12(8):596–602.
9. Tan L, Cai ZQ, Lai NS. Accuracy and sensitivity of the dynamic ocular thermography and inter-subjects ocular surface temperature (OST) in Chinese young adults. Cont Lens Anterior Eye. 2009;32(2):78–83. doi:10.1016/j.clae.2008.09.003
10. Chan TCY, Wan KH, Shih KC, Jhanji V. Advances in dry eye imaging: the present and beyond. Br J Ophthalmol. 2018;102(3):295–301. doi:10.1136/bjophthalmol-2017-310759
11. Tan J-H, Ng EYK, Acharya UR, Chee C. Infrared thermography on ocular surface temperature: a review. Infrared Phys Techn. 2009;52(4):97–108. doi:10.1016/j.infrared.2009.05.002
12. Moussa S, Eppig T, Pattmoller J, et al. Diurnal and zonal analysis of corneal surface temperature in young healthy adults. Eur J Ophthalmol. 2013;23(5):641–645. doi:10.5301/ejo.5000277
13. Tan LL, Sanjay S, Morgan PB. Static and dynamic measurement of ocular surface temperature in dry eyes. J Ophthalmol. 2016;2016:7285132. doi:10.1155/2016/7285132
14. Kamao T, Yamaguchi M, Kawasaki S, Mizoue S, Shiraishi A, Ohashi Y. Screening for dry eye with newly developed ocular surface thermographer. Am J Ophthalmol. 2011;151(5):782–791 e781. doi:10.1016/j.ajo.2010.10.033
15. NEC San-Ei Instruments L. Infared thermal imager thermo tracer TH9100 pro.
16. Tan LL, Sanjay S, Morgan PB. Repeatability of infrared ocular thermography in assessing healthy and dry eyes. Cont Lens Anterior Eye. 2016;39(4):284–292. doi:10.1016/j.clae.2016.01.010
17. Nippon Avionics Co. L. Thermo tracer TH9260.
18. Matteoli S, Vannetti F, Sodi A, Corvi A. Infrared thermographic investigation on the ocular surface temperature of normal subjects. Physiol Meas. 2020;41(4):045003. doi:10.1088/1361-6579/ab6b48
19. FLIR A320 Tempscreen. FLIR systems. FLIR A320 tempscreen fixed-mount thermal camera for EBT screening | FLIR systems.
20. Giraldez MJ, Naroo SA, Resua CG. A preliminary investigation into the relationship between ocular surface temperature and lipid layer thickness. Cont Lens Anterior Eye. 2009;32(4):
21. Nippon Avionics Co. L. Thermo tracer TH7102MX/TH7102WX: infrared thermography: NIPPON AVIONICS CO., LTD.
22. Abusharha AA, Pearce EI. The effect of low humidity on the human tear film. Cornea. 2013;32(4):429–434. doi:10.1097/ICO.0b013e31826671ab
23. Systems F. ThermaCAM P620 infrared camera. FLIR systems.
24. Li W, Graham AD, Selvin S, Lin MC. Ocular surface cooling corresponds to tear film thinning and breakup. Optom Vis Sci. 2015;92(9):e248–e256. doi:10.1097/OPX.0000000000000672
25. Systems F. FLIR A655sc. FLIR A655sc high-resolution science grade LWIR camera | FLIR systems
26. Petznick A, Tan JH, Boo SK, Lee SY, Acharya UR, Tong L. Repeatability of a new method for measuring tear evaporation rates. Optom Vis Sci. 2013;90(4):366–371. doi:10.1097/OPX.0b013e318288bdd1
27. pro-4-pro.com. VarioTherm head. JENOPTIK.
28. Morgan PB, Tullo AB, Efron N. Infrared thermography of the tear film in dry eye. Eye (Lond). 1995;9(Pt 5):615–618. doi:10.1038/eye.1995.149
29. Craig JP, Singh I, Tomlinson A, Morgan PB, Efron N. The role of tear physiology in ocular surface temperature. Eye (Lond). 2000;14(Pt 4):635–641. doi:10.1038/eye.2000.156
30. Purslow C, Wolffsohn J. The relation between physical properties of the anterior eye and ocular surface temperature. Optom Vis Sci. 2007;84(3):197–201. doi:10.1097/OPX.0b013e3180339f6e
31. Sodi A, Matteoli S, Giacomelli G, Finocchio L, Corvi A, Menchini U. Ocular surface temperature in age-related macular degeneration. J Ophthalmol. 2014;2014:281010. doi:10.1155/2014/281010
32. Gonnermann J, Maier AK, Klein JP, Bertelmann E, Pleyer U, Klamann MK. Evaluation of ocular surface temperature in patients with pterygium. Curr Eye Res. 2014;39(4):359–364. doi:10.3109/02713683.2013.844262
33. Calonge M, Labetoulle M, Messmer EM, et al. Controlled adverse environment chambers in dry eye research. Curr Eye Res. 2018;43(4):445–450. doi:10.1080/02713683.2017.1420197
34. Abusharha AA, Pearce EI, Fagehi R. Effect of ambient temperature on the human tear film. Eye Contact Lens. 2016;42(5):308–312. doi:10.1097/ICL.0000000000000210
35. Kawali AA. Thermography in ocular inflammation. Indian J Radiol Imaging. 2013;23(3):281–283.
36. Deng Q, Braun RJ, Driscoll TA, King-Smith PE. A model for the tear film and ocular surface temperature for partial blinks. Interfacial Phenom Heat Transf. 2013;1(4):357–381. doi:10.1615/InterfacPhenomHeatTransfer.v1.i4.40
37. Itokawa T, Okajima Y, Suzuki T, et al. Association among blink rate, changes in ocular surface temperature, tear film stability, and functional visual acuity in patients after cataract surgery. J Ophthalmol. 2019;2019:8189097. doi:10.1155/2019/8189097
38. Li F, Yang W, Jiang H, et al. TRPV1 activity and substance P release are required for corneal cold nociception. Nat Commun. 2019;10(1):5678. doi:10.1038/s41467-019-13536-0
39. Yang JM, Li F, Liu Q, et al. A novel TRPM8 agonist relieves dry eye discomfort. BMC Ophthalmol. 2017;17(1):101. doi:10.1186/s12886-017-0495-2
40. Yang JM, Wei ET, Kim SJ, Yoon KC. TRPM8 channels and dry eye. Pharmaceuticals (Basel). 2018;11:4. doi:10.3390/ph11040125
41. Huang CC, Yang W, Guo C, et al. Anatomical and functional dichotomy of ocular itch and pain. Nat Med. 2018;24(8):1268–1276. doi:10.1038/s41591-018-0083-x
42. Dursch TJ, Li W, Taraz B, Lin MC, Radke CJ. Tear-film evaporation rate from simultaneous ocular-surface temperature and tear-breakup area. Optom Vis Sci. 2018;95(1):5–12. doi:10.1097/OPX.0000000000001156
43. Su TY, Chang SW. Normalized ocular surface temperature models for tear film characteristics and dry eye disease evaluation. Ocul Surf. 2020. doi:10.1016/j.jtos.2020.04.002
44. Mudgil P. Evaluation of use of essential fatty acids in topical ophthalmic preparations for dry eye. Ocul Surf. 2020;18(1):74–79. doi:10.1016/j.jtos.2019.10.001
45. Zeev MS, Miller DD, Latkany R. Diagnosis of dry eye disease and emerging technologies. Clin Ophthalmol. 2014;8:581–590. doi:10.2147/OPTH.S45444
46. Su TY, Ho WT, Lu CY, Chang SW, Chiang HK. Correlations among ocular surface temperature difference value, the tear meniscus height, schirmer’s test and fluorescein tear film break up time. Br J Ophthalmol. 2015;99(4):482–487. doi:10.1136/bjophthalmol-2014-305183
47. Craig JP, Nelson JD, Azar DT, et al. TFOS DEWS II report executive summary. Ocul Surf. 2017;15(4):802–812. doi:10.1016/j.jtos.2017.08.003
48. Su TY, Hwa CK, Liu PH, et al. Noncontact detection of dry eye using a custom designed infrared thermal image system. J Biomed Opt. 2011;16(4):046009. doi:10.1117/1.3562964
49. Abreau K, Callan C, Kottaiyan R, et al. Temperatures of the ocular surface, lid, and periorbital regions of sjogren’s, evaporative, and aqueous-deficient dry eyes relative to normals. Ocul Surf. 2016;14(1):64–73. doi:10.1016/j.jtos.2015.09.001
50. Matteoli S, Favuzza E, Mazzantini L, et al. Ocular surface temperature in patients with evaporative and aqueous-deficient dry eyes: a thermographic approach. Physiol Meas. 2017;38(8):1503–1512. doi:10.1088/1361-6579/aa78bd
51. Nemeth O, Langenbucher A, Eppig T. et al. Correlation between corneal endothelial cell density and central ocular surface temperature in normal and keratoconus eyes. Curr Eye Res. 2020;1–7. doi:10.1080/02713683.2020.1812087
 © 2021 The Author(s). This work is published and licensed by Dove Medical Press Limited. The full terms of this license are available at https://www.dovepress.com/terms.php and incorporate the Creative Commons Attribution - Non Commercial (unported, v3.0) License.
By accessing the work you hereby accept the Terms. Non-commercial uses of the work are permitted without any further permission from Dove Medical Press Limited, provided the work is properly attributed. For permission for commercial use of this work, please see paragraphs 4.2 and 5 of our Terms.
© 2021 The Author(s). This work is published and licensed by Dove Medical Press Limited. The full terms of this license are available at https://www.dovepress.com/terms.php and incorporate the Creative Commons Attribution - Non Commercial (unported, v3.0) License.
By accessing the work you hereby accept the Terms. Non-commercial uses of the work are permitted without any further permission from Dove Medical Press Limited, provided the work is properly attributed. For permission for commercial use of this work, please see paragraphs 4.2 and 5 of our Terms.