")
Back to Archived Journals » Reports in Medical Imaging » Volume 15
Impact of Magnetic Field Inhomogeneity on the Quality of Magnetic Resonance Images and Compensation Techniques: A Review
Authors Manson EN, Inkoom S, Mumuni AN
Received 15 April 2022
Accepted for publication 13 August 2022
Published 1 October 2022 Volume 2022:15 Pages 43—56
DOI https://doi.org/10.2147/RMI.S369491
Checked for plagiarism Yes
Review by Single anonymous peer review
Peer reviewer comments 2
Editor who approved publication: Professor Tarik Massoud
Eric Naab Manson,1,2 Stephen Inkoom,2,3 Abdul Nashirudeen Mumuni1
1Department of Medical Imaging, School of Allied Health Sciences, University for Development Studies, Tamale, Ghana; 2Department of Medical Physics, School of Nuclear and Allied Sciences, University of Ghana, Accra, Ghana; 3Radiation Protection Institute (RPI), Ghana Atomic Energy Commission, Accra, Ghana
Correspondence: Eric Naab Manson, Department of Medical Imaging, School of Allied Health Sciences, University for Development Studies, Tamale, Ghana, Email [email protected]
Background: Magnetic field inhomogeneity in magnetic resonance imaging (MRI) is caused by the inherent properties of the main magnet, external ferromagnetic components surrounding the magnet, and the patient itself. Significant deviations from magnetic field inhomogeneity can create artifacts in MRI images, thereby compromising image quality. Optimizing magnetic field homogeneity improves image quality and helps to reduce artifacts. The goal of this article therefore is to help radiographers and operators of MRI understand the clinical basis of magnetic field inhomogeneity and its effects on MR images. This would assist them to appreciate the trade-offs between sequence parameters and image quality metrics towards optimizing magnetic field inhomogeneity.
Methods: A narrative literature review was conducted from relevant databases using search terms such as MRI, magnetic field inhomogeneity, optimization, magnetic field inhomogeneity artifacts, and MRI shimming.
Results: Minimizing field inhomogeneities in MRI is not straightforward but involves a multitude of factors and steps. Magnetic field homogeneity could be optimized to improve MR image quality by choosing the most appropriate pulse sequence/imaging parameters that could best minimize distortion and increase SNR based on the anatomical region of interest (or tissue types) while complementing it with shimming and use of dielectric pads.
Conclusion: Future works to investigate the association between the MRI pulse sequence parameters and measurements of MR image quality metrics, based on individual tissue densities, could provide a new window for reducing magnetic field inhomogeneity due to susceptibility and chemical shift effects.
Keywords: magnetic field inhomogeneity, shimming, image quality, MRI, pulse sequence
Background
In a magnetic resonance imaging (MRI) system, the magnet is the most expensive component because it is the source of the primary magnetic field (B0).1 Magnets are defined in terms of their field strengths (ie, low-field <0.5, medium-field between 0.5 and 1.5, high-field between 1.5 and 3.0, and ultra-high field >3 T), shapes, and composition. There are two major types of magnets available in MRI: permanent magnets made of ferromagnetic substances and electromagnets (ie, resistive magnets made of copper solenoid or Helmholtz pair coil, and superconductive ones made of alloys such as niobium/titanium).2,3 The maximum field strength that may be produced by permanent magnets is only 0.5 T. This limits their usage in diagnostic imaging and makes spectroscopy, chemical shift, and susceptibility imaging, such as that used in functional brain imaging, impractical. The room temperature needs to be carefully managed because their magnetic field homogeneity is similarly susceptible to the surrounding environment.3 Similar to the permanent magnet, the highest field strength produced by resistive magnets is around 0.3 T. Currently, the superconducting magnet is the most frequently used in MR scanners. It is capable of carrying large amounts of current, enabling high magnetic field strengths to be achieved.2 Superconducting magnets can produce magnetic fields of up to 18 T that are extremely powerful and uniform.
The design and construction of the magnet are to purposively offer both high-quality images and comfort to the patient.1 In the design of the main magnet, fundamental variables that are generally considered in order to obtain optimal image quality are the magnetic field strength, magnetic field homogeneity, shimming capabilities,1 and the linearity of the magnetic gradient fields imposed on the field-of-view (FOV) during the slice-selection and spatial encoding components of the pulse sequence used to obtain data. Among these variables, the quality of the images is primarily determined by the magnetic field homogeneity.1 Also, several measures, including image uniformity, image linearity, and signal-to-noise ratio (SNR), can be used to evaluate field homogeneity in an MRI scanner. By observing the continuous signal response generated by the MRI system over the object volume, the uniformity of the image can be evaluated. The constancy of object dimension and level of geometrical distortion in images created during MRI scanning define the image linearity. Image inhomogeneity can diminish SNR, induce geometrical distortion, and impact image uniformity.4 Magnetic field homogeneity in its simplest term is how the magnetic field (B0) of the main magnet is uniformly distributed when no patient is within the magnetic field, and measured in parts per million (ppm)1 from the isocenter.5
In general, field inhomogeneity is classified under three groups: static magnetic field (B0), chemical shift, and susceptibility-induced inhomogeneities.6 B0 field inhomogeneity creates artifacts in MR images, such as banding, spatial distortion, blurring, shading, and reduction in signal intensity. B0 field inhomogeneity is more prevalent in clinical studies involving large FOV and imaging sequences such as gradient echo (GRE), fast/echo-planar imaging (EPI) sequence, and spectral fat suppression techniques.7 In addition, the impact of B0 field inhomogeneity is mostly evident with cartesian k-space sampling which depends on other factors such as imaging parameters, receiver coil, and patient alignment with the B0 field.8
Regardless of the magnet utilized, magnetic field homogeneity is a key factor in medical MRI. Some technical limitations associated with the construction of the magnet such as spatial restrictions, design criteria, cost and magnetic properties of materials, errors in fabrication dimensions, and restrictions on current density affect the homogeneity of the B0 field. As a result, any unexpected inaccuracies in any of these factors may contribute to B0 inhomogeneity.7,9
To improve image quality and minimize MRI artifacts, the B0 field homogeneity has to be optimized by a technique called shimming. Shimming is used to optimize magnetic field homogeneity by compensating for any unwanted inhomogeneities.10 When electric currents are channeled via superconductive shim coils, they generate their own magnetic field which cancels the remaining field gradients in the main field.10 Shimming involves a complete measurement procedure and lots of mathematical computation for each shim current setup using either MR magnetometers or direct imaging.7 In this review, the sources and effects of field inhomogeneity in MRI are discussed, along with different ways of optimizing magnetic field homogeneity in order to improve image quality.
Methods
In this review, the impact of magnetic field inhomogeneity on the quality of magnetic resonance images viz-a-viz compensating strategies is discussed. To find relevant studies on magnetic field inhomogeneity in magnetic resonance imaging, a preliminary search of the literature was done in PubMed, Google Scholar and Wiley Online. The following search terms: magnetic field inhomogeneity, MRI shimming, image quality, and pulse sequence parameters were used to find relevant publications. Table 1 shows a summary of some data extraction from relevant articles that could assist radiographers and operators to optimize image quality.
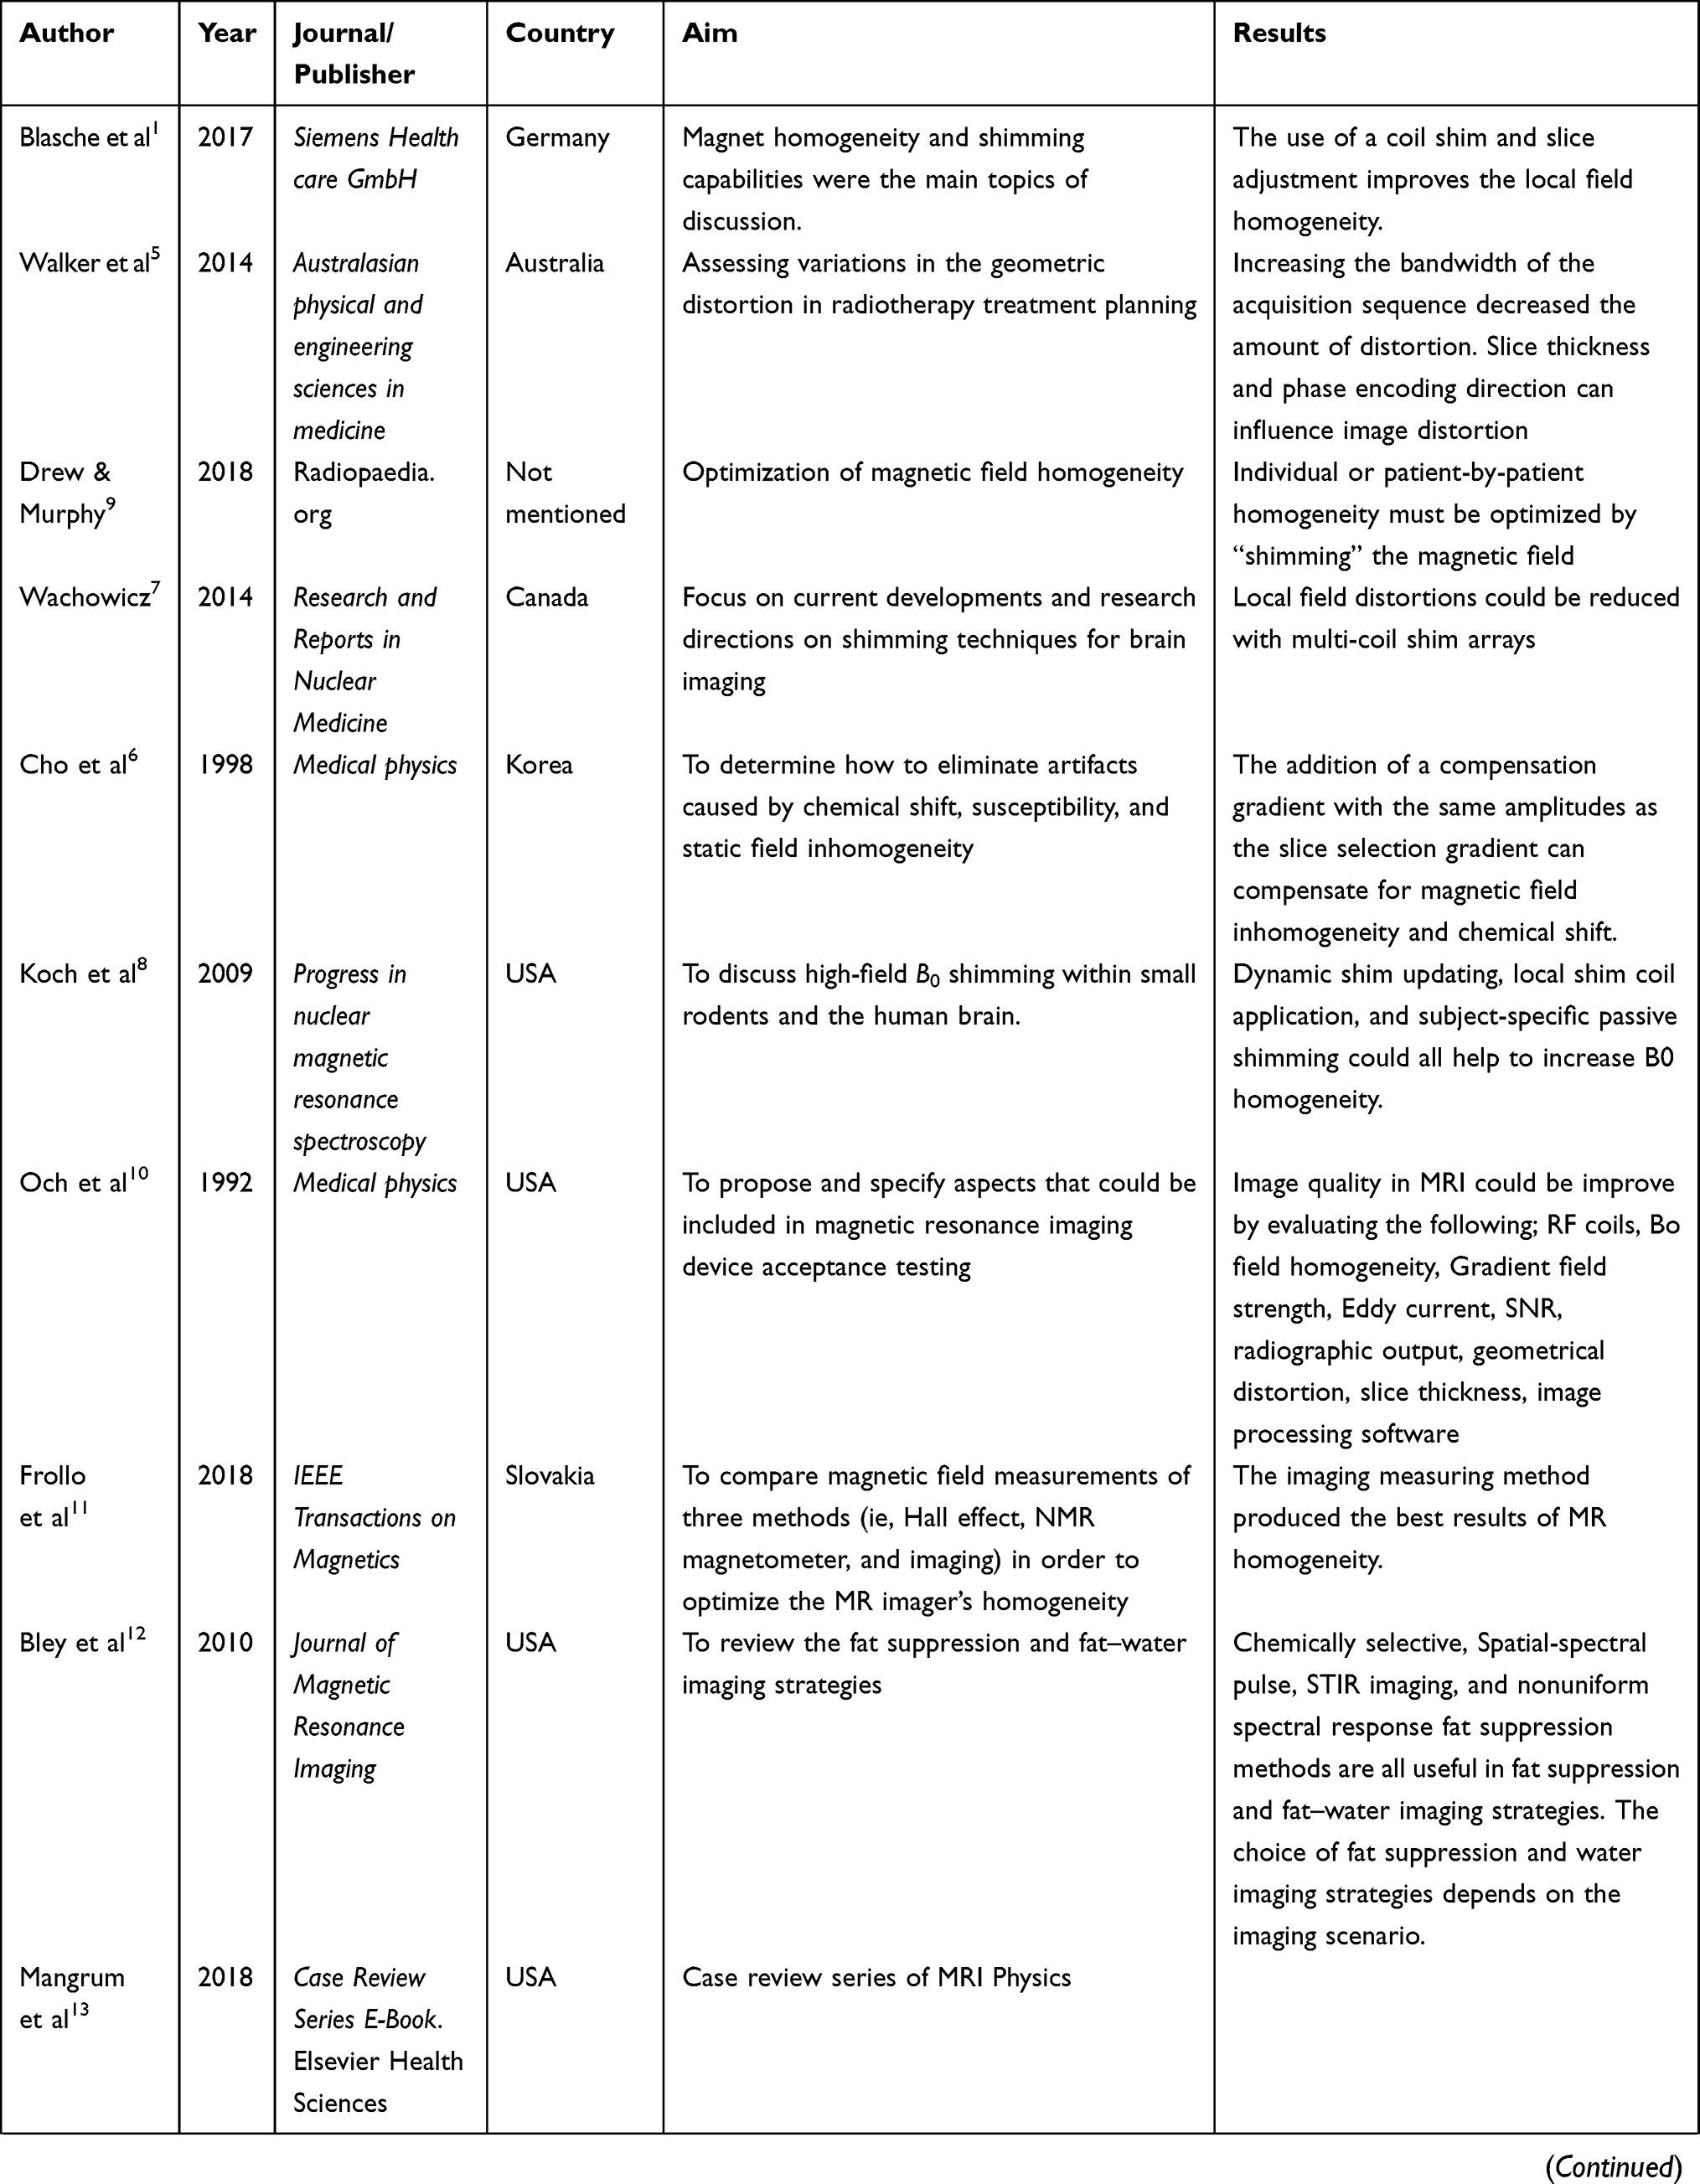 | 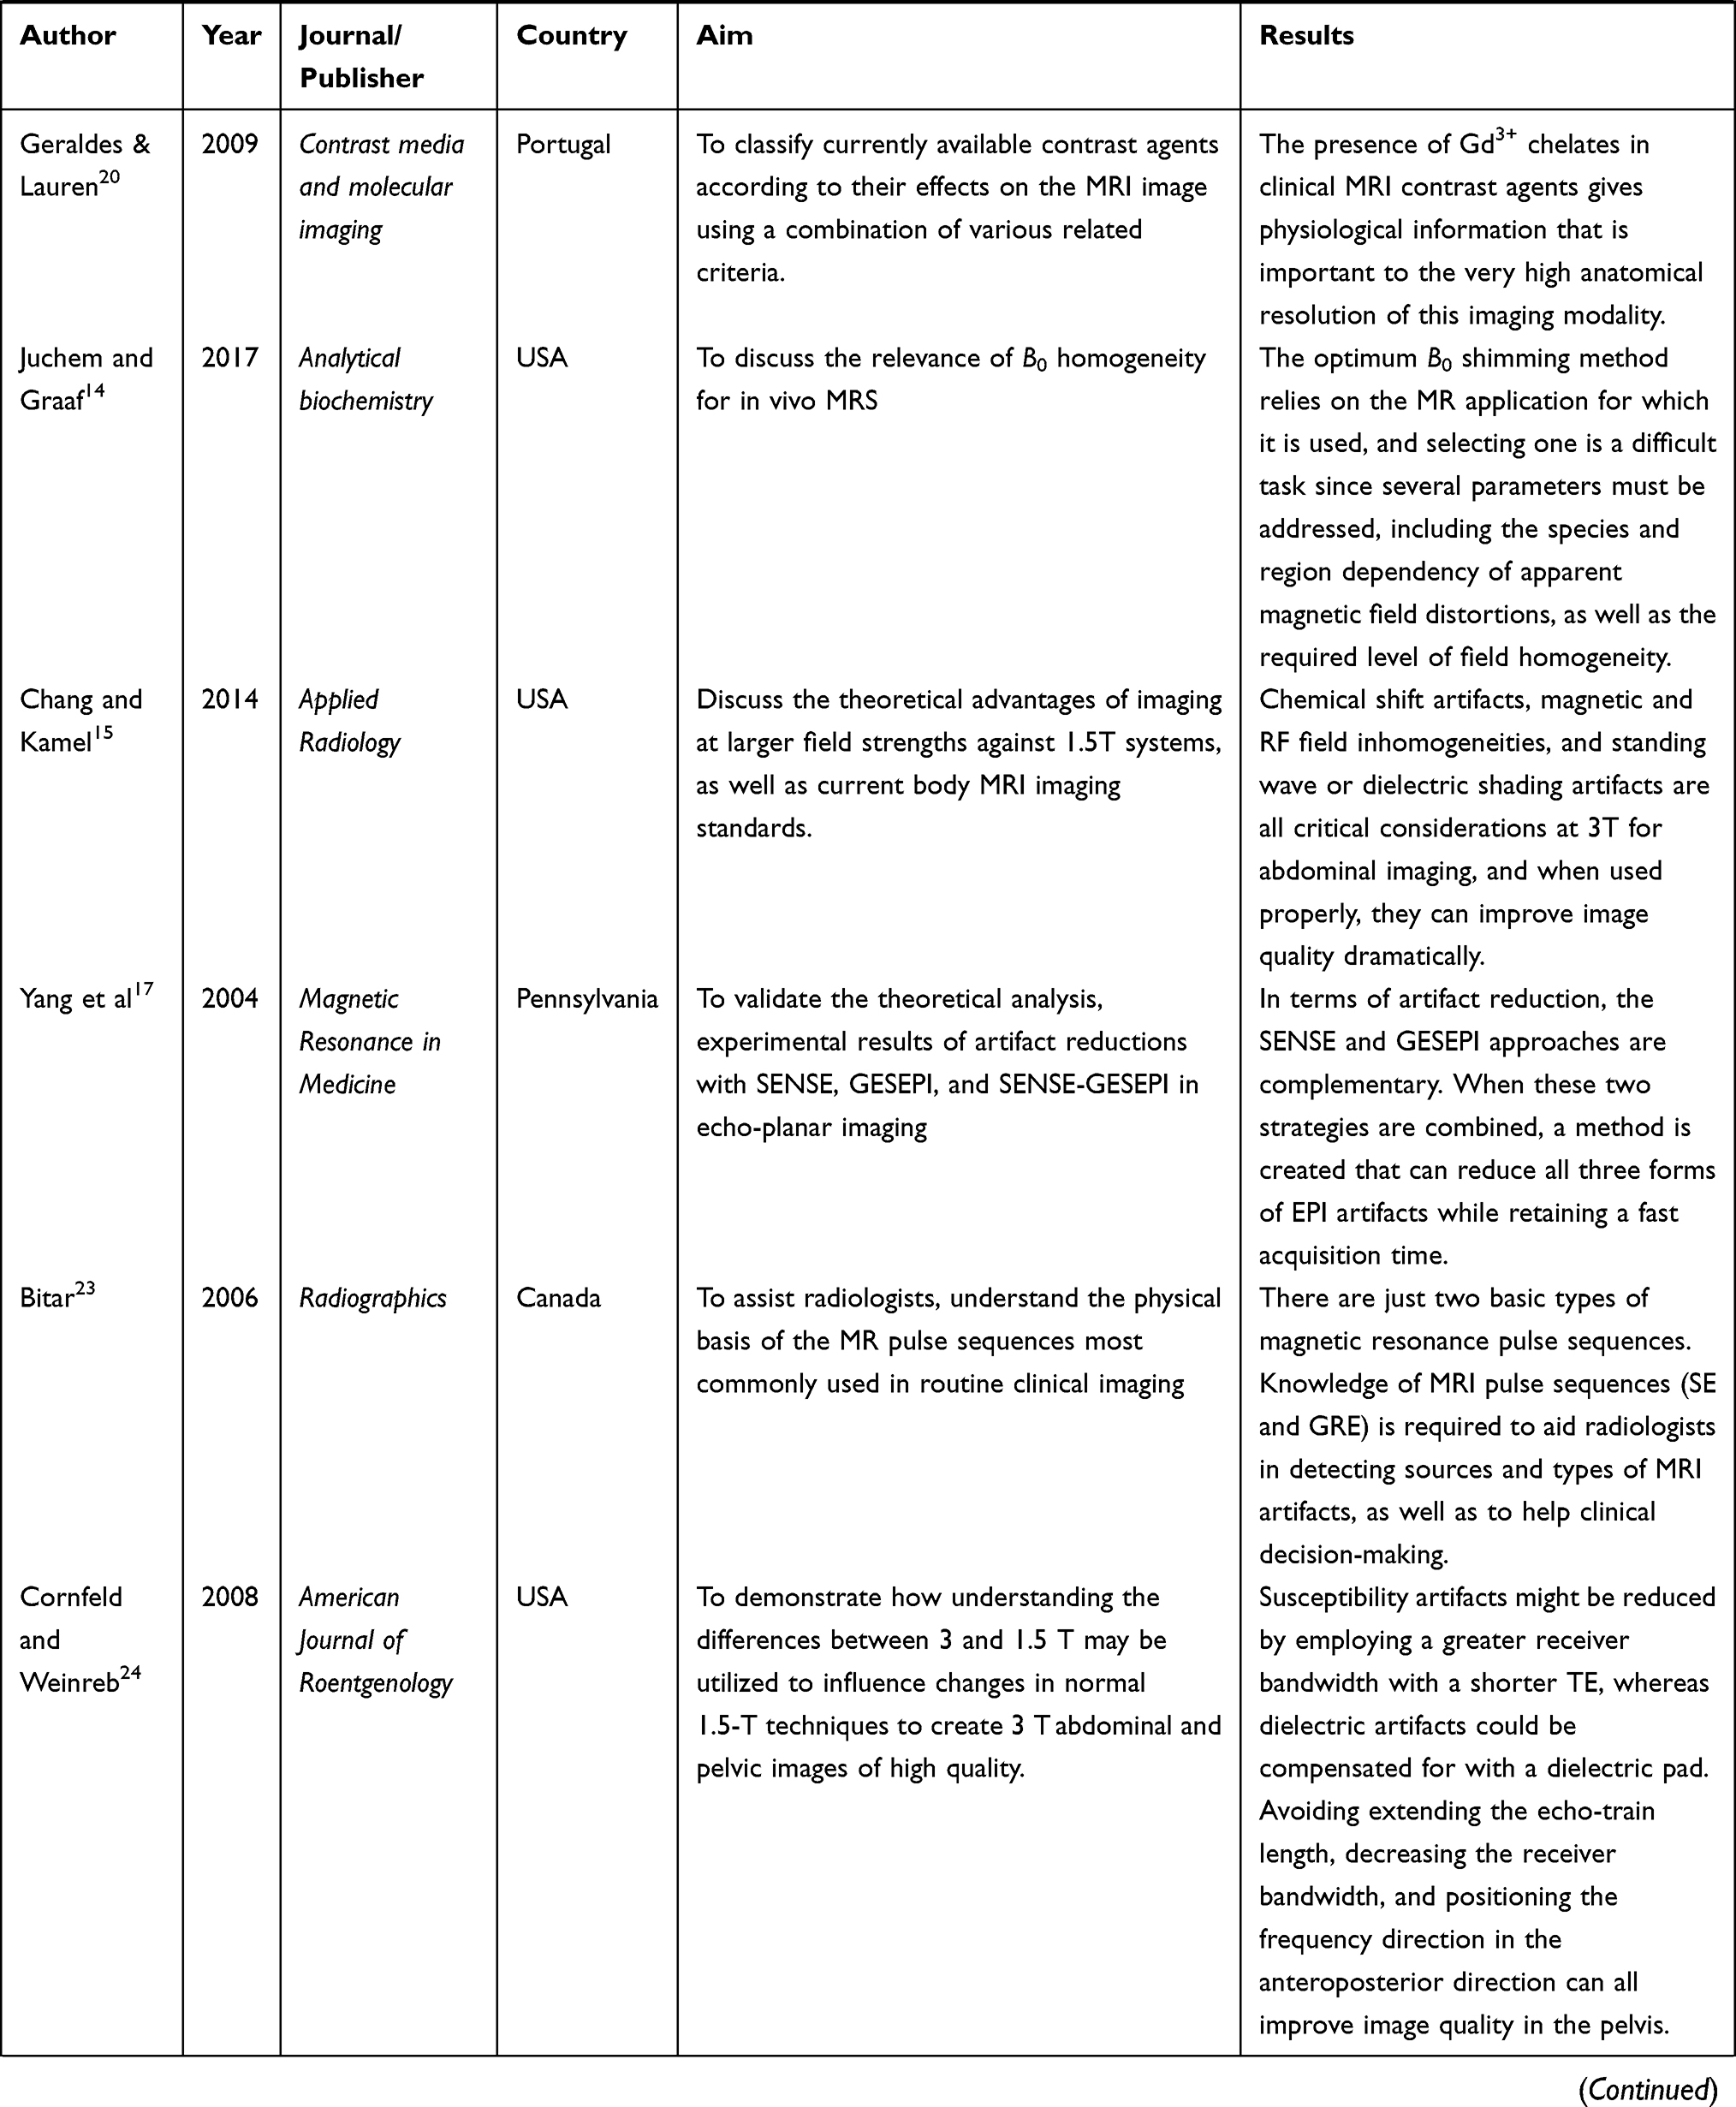 | 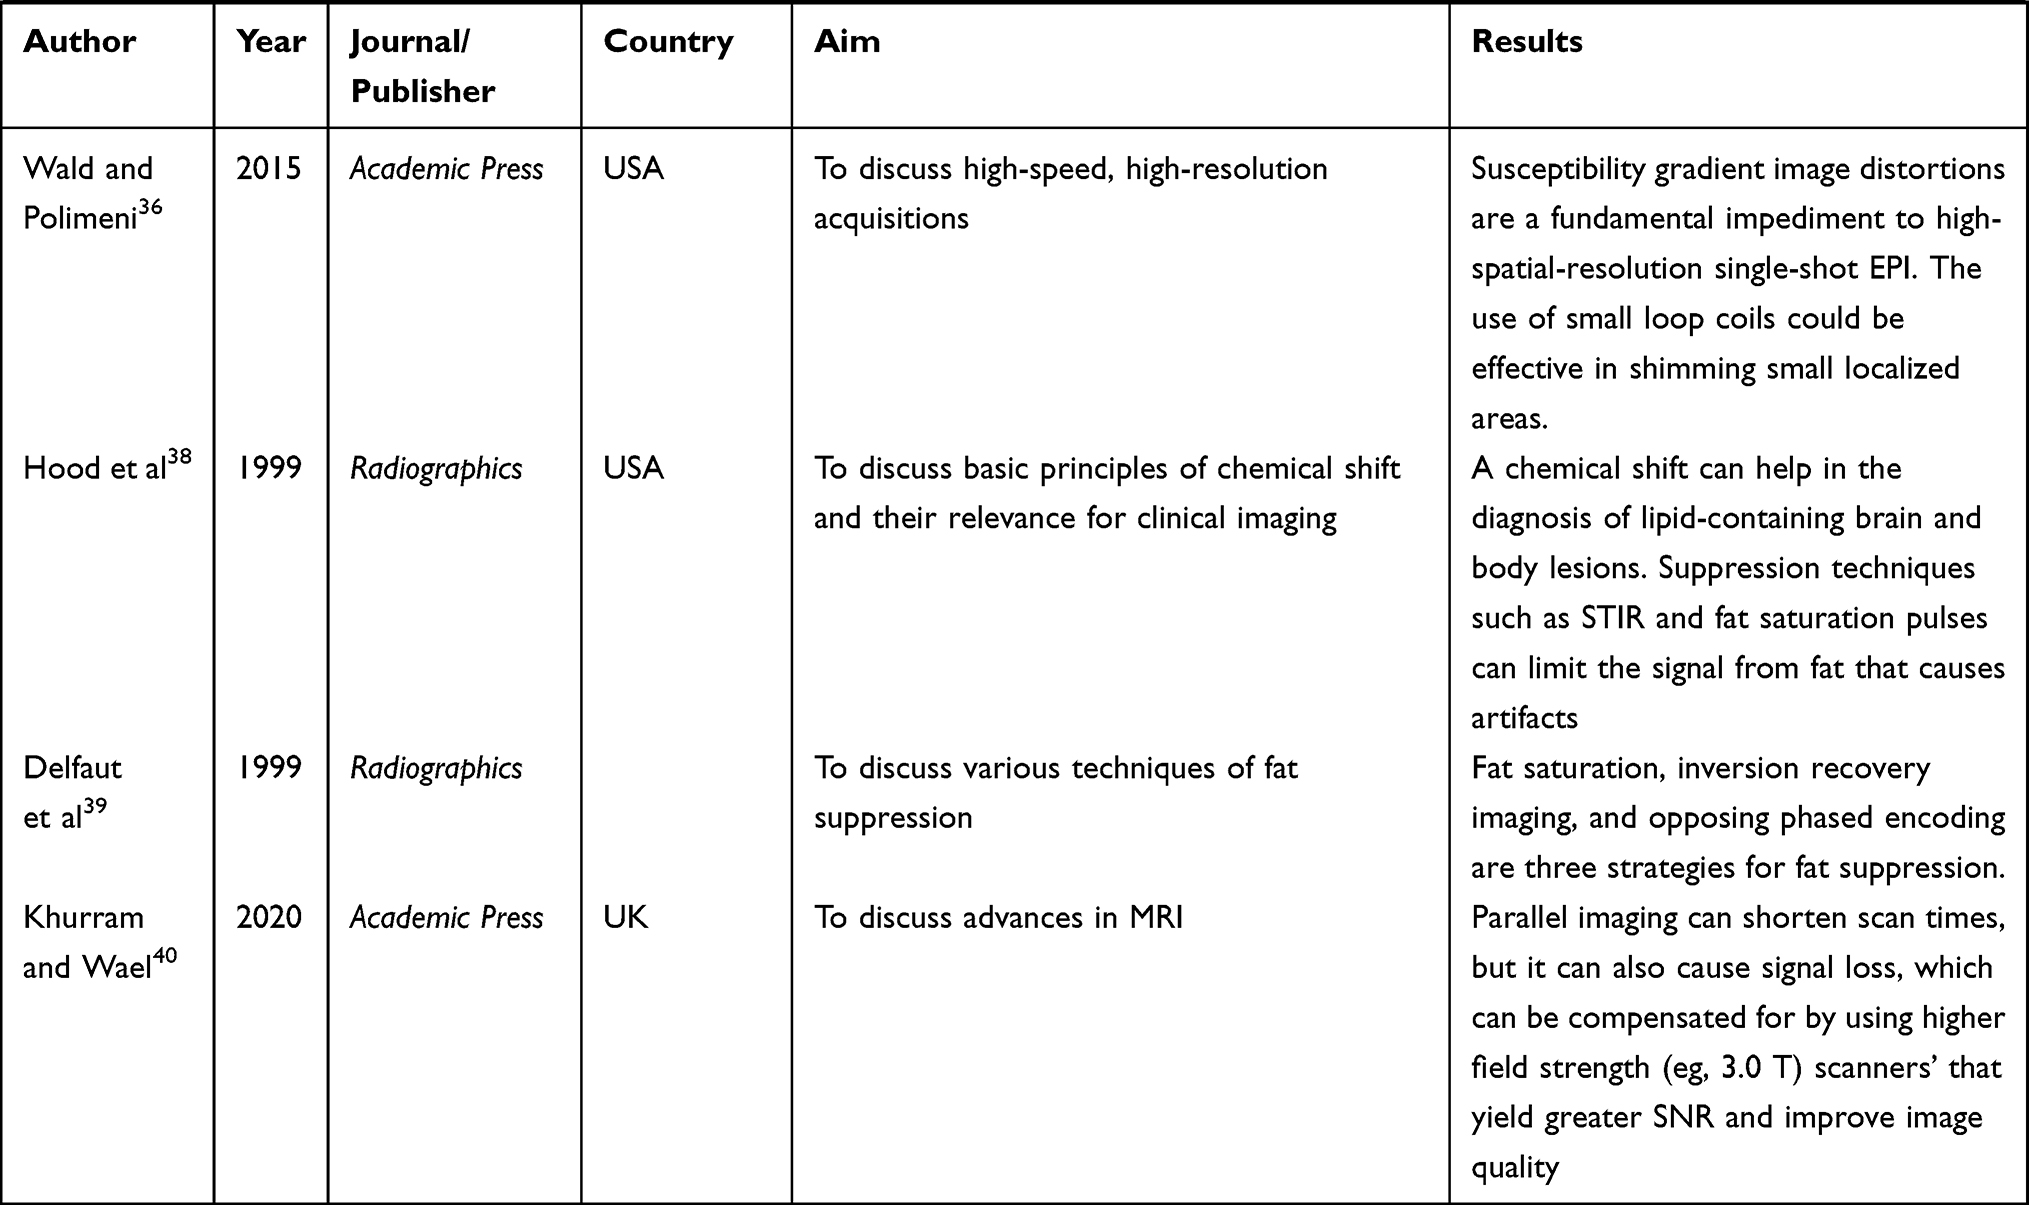 |
Table 1 Summary of Data Extracted from Some Articles |
Primary Sources of Magnetic Field Inhomogeneity
The magnetic field (Bo) fluctuates over a particular diameter of spherical volume (DSV) at high field strength. A higher field magnet needs a longer axis and/or tighter and more coil windings to achieve a constant static field homogeneity for a specific diameter. As a result, the magnet eventually becomes larger and heavier. For instance, to limit the 5-gauss line to within a few meters of a 4T magnet, which can weigh up to 20 tons with cryogens, up to 150 tons of steel shielding must be used. While meeting the aforementioned homogeneity requirements, limiting the overall length of high-field magnets to that of existing clinical 1.5T scanners is a significant production problem that calls for creative magnet design.4 A steady homogenous magnetic field with the best homogeneity in the entire measuring object volume is ideal for MRI. However, since no practical magnet can ever produce a perfect homogenous magnetic field, generating a static homogeneous field is nearly impossible. The primary source of magnetic field inhomogeneity is a result of inaccuracies in coil windings. When a magnet is certified to exit a company after the production process is complete, the magnetic field inhomogeneity is generally in the range of approximately 500 ppm peak-to-peak over the maximum volume.1 Disturbances caused by external ferromagnetic components10,11 or certain site factors such as the presence of steel in building construction can, however, influence the magnetic field homogeneity. As a result, the field homogeneity is fine-tuned during the system installation using a technique known as shimming.1,7 Also, implanted ferromagnetic materials (eg, dentures, surgical clips, staples, prosthetic joints, etc.) may induce more severe distortions in the static magnetic field. In modern scanners, the effect of magnetic inhomogeneity is minimal as magnetic field homogeneity is generally shimmed to about 1 ppm across the FOV.12
Ideally, the main magnet is usually designed to relatively produce a homogeneous magnetic field and three sets of linear spatial gradient fields across the body for the purpose of spatial encoding. However, the local variation in these fields causes a deviation in the spatial-encoding gradients and creates distortions in the final image due to susceptibility effects.13,14
All material substances, including biological tissues, are susceptible to the magnetic effect. When these substances are subjected to external magnetic fields, they have the potential to become magnetized. For example, cortical bone, free water, and most soft tissues are diamagnetic materials with different degrees of negative magnetic susceptibility that alter the B0 field when they are close to each other, thereby generating a net heterogeneous B0 field. This causes protons to dephase in the transverse plane, which could result in both signal loss and distortions when the B0 field is highly heterogeneous.
Effects of Magnetic Field Inhomogeneity on Magnetic Resonance Images
Susceptibility artifacts can occur with any pulse sequence. The spin-echo (SE) pulse sequence is relatively tolerant to static field inhomogeneities. Also, in the SE sequence, because the 180° refocusing RF pulse corrects for T2* effects, susceptibility artifacts are minimal in SE images. However, susceptibility effects are more pronounced in gradient-echo (GRE) images3 (Figure 1) and in echo-planar imaging (EPI). The common magnetic field inhomogeneity artifacts due to susceptibility effects in GRE and EPI are signal loss, visual blurring, and geometrical distortion. Image blurring and signal loss are induced by T2* relaxation distortion, which is primarily caused by the through-plane local gradient.13 At a longer echo time (TE), protons take a relatively long time to dephase, and this causes a greater signal loss due to susceptibility (Figure 2). T2* effects are more sensitive at higher field strength. For instance, when the field strength is doubled from 1.5 T to 3 T, T2* relaxation times are nearly halved due to doubling magnetic susceptibility.15 Signal loss and distortion at air–bone and air–tissue interfaces are due to microscopic gradients or variations in the magnetic field strength near interfaces of different magnetic susceptibility. These effects can be especially pronounced at magnetic fields of 7 T and higher.16 Geometric distortion occurs when there is a frequency shift of the NMR signal due to the in-plane local gradient.17 Geometrical distortions in EPI are prominent in the phase encoding direction due to the substantially smaller sampling rate. The 180°- refocusing pulse employed in spin-echo imaging could counteract this effect by permitting the protons to rephase.13
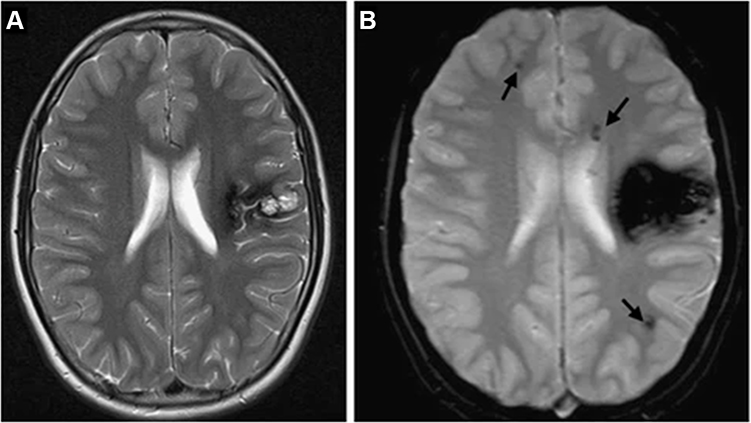 |
Figure 1 A 32-year-old male with several cavernous malformations who was being evaluated for intraparenchymal hemorrhage. (A) A left frontal cavernous malformation is visible on a T2-weighted image, and it is encircled by a significant haemosiderin ring. (B) Multiple punctate hypointense foci can be seen on the GE T2*-weighted image, which are representative of tiny cavernous malformations in both hemispheres (arrows).18 Note: Reproduced from Gasparotti R, Pinelli L, Liserre R. New MR sequences in daily practice: susceptibility weighted imaging. A pictorial essay. Insights into imaging. 2011 Jun;2(3):335-47. |
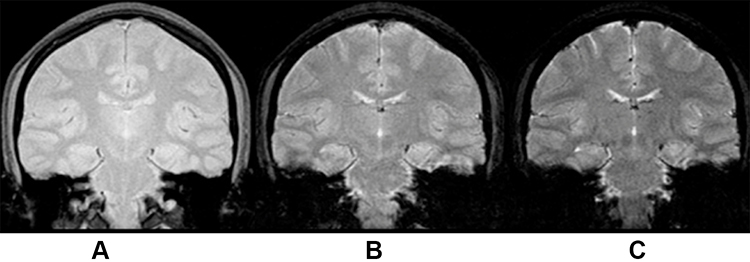 |
Figure 2 With increasing TE, T2* weighting rises. This is so that more dephasing can occur prior to the development of an echo when the TE is longer. (A) TE = 10ms, (B) TE = 30ms, (C) TE = 50ms [Courtesy Allen D Elster, MRIQuestions.com].19 |
In addition to susceptibility effects, substances such as paramagnetic contrast agents (eg, iron oxide particles) could cause magnetic susceptibility dephasing, resulting in signal loss when they are administered in organs like kidneys (Figure 3), bladder, liver, and spleen. The higher the concentration of the contrast agent in the organs, the higher the signal loss that would be obtained at that site in the MR image.13,20
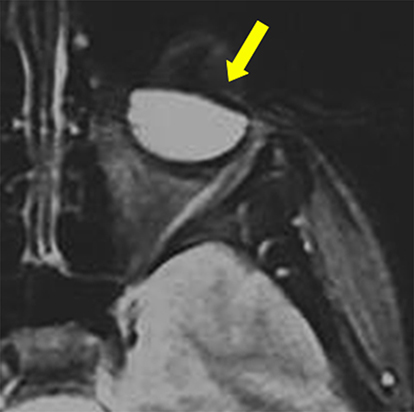 |
Figure 3 Iron-particle-related susceptibility artifact in mascara indicated by yellow solid arrow [Courtesy Allen D Elster, MRIQuestions.com].21 |
Another effect of magnetic field inhomogeneity on MR images is the chemical shift effect. This effect is pronounced at high field strengths.6,15 Magnetic field strengths above 1.5 T with low receiver bandwidths and large FOVRO, especially at fat–water interfaces in tissue, chemical shift artifacts are particularly noticeable. The intrinsic frequency difference between water and fat protons is about 3.5 ppm. When water and fat are subjected to an external magnetic field, chemical shift distortions are generated as a result of the frequency differences. This frequency discrepancy results in two continuous artifacts, ie, the chemical shift artifact and phase cancellation artifact. The chemical shift artifact is the misregistration of fat and water protons from a voxel that are mapped to different pixels. Where the fat and water signals superimpose, the artifact is seen as parallel areas of bright and dark pixels, respectively (Figure 4). In the kidney, for instance (Figure 5), chemical shift shows a dark rim on one edge and a bright rim on the other edge.23 The appearance of artifacts due to the chemical shift effect in the readout and phase encoding directions depends on the type of pulse sequence used in the image acquisition (Figure 6). For example, in an echo-planar pulse sequence, the receiver bandwidth is relatively large, allowing fat and water frequencies to be mapped to the same pixel. Protons from fat and water that are in the same phase encoding direction incur the same amount of phase change. As a result, they are mapped to the same spot in the image, with no visible artifacts.2
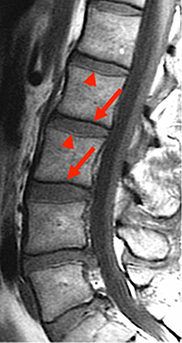 |
Figure 4 Chemical Shift artifact in the spine. At the junction between the vertebrae and the disk, there are a series of light and dark bands (indicated by solid red arrows) [Courtesy Allen D Elster, MRIQuestions.com].22 |
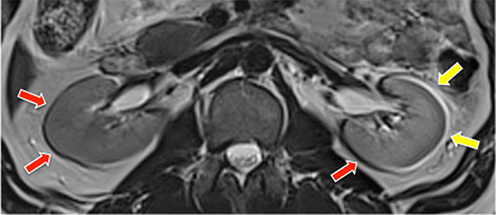 |
Figure 5 At the water-fat interface, there is a chemical shift artifact. The axial T1-weighted GRE MR image shows a dark rim on one border of the kidney and a bright rim on the opposite edge (indicated by white solid arrows), an artifact caused by the difference in fat and water precessional frequencies [Courtesy Allen D Elster, MRIQuestions.com].22 |
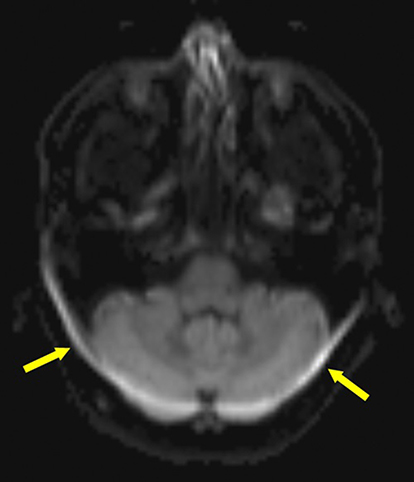 |
Figure 6 Chemical Shift Artifact: The bandwidth per pixel in the phase-encode direction of EPI is very tiny (i.e., on the order of 1kHz). This narrow bandwidth in the phase-encode direction translates into a significant artifact (indicated by the solid yellow arrows) that can be up to 1 cm wide at 1.5 T, where the fat/water chemical shift is around 220 Hz [Courtesy Allen D Elster, MRIQuestions.com].26 |
The phase cancellation artifacts, on the other hand, occur when signals in voxels containing both water and fat protons cancel each other at TEs where fat and water protons are out of phase with each other.15 If the voxel contains equal water and fat content, such as those found at interfaces between fat- and water-containing tissues, very little signal is produced. A dark ring surrounding the tissue is seen as a result of signal cancellation (Figure 7). Since the duration of phase cycling is dependent on the resonant frequency difference, Δω (Hz), between fat and water, the TE values that induce this phase cancellation are dependent on the magnetic field strength.2
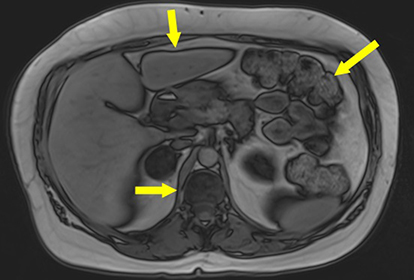 |
Figure 7 Phase cancellation chemical shift artifact indicated by solid yellow arrows of the abdomen. This form of chemical shift artifact occurs exclusively in gradient echo imaging [Courtesy Allen D Elster, MRIQuestions.com].27 |
The term “dielectric effect” describes how matter interacts with an electromagnetic field’s electrical component. According to Maxwell’s principles, the wavelength and speed of light are lowered when the electrical component of electromagnetic waves encounters the human body, which might result in image inhomogeneity.25 Dielectric effects are therefore similar to field inhomogeneities such that they both affect the MRI signal intensity. The dielectric effect is more severe with FSE sequence, at higher field strength and large FOV (eg, thorax)15 or in patients with a lot of intraabdominal water or fat. The RF wavelength corresponding to the Larmor frequency of water protons is substantially longer than the average diameter of a patient’s thorax at a lower field strength (eg, 1.5 T). At a high field strength of 3 T, the Larmor frequency of water protons doubles, which lowers the RF pulse excitation wavelength to the dimension of the abdomen or pelvis as the RF waves penetrate the patient. This results in an increase in standing waves (creating constructive and destructive interferences), thereby causing changes in signal intensity in the MR image.15 Because of the dielectric effect, the signal in the center of the patient volume is reduced29 (Figure 8A).
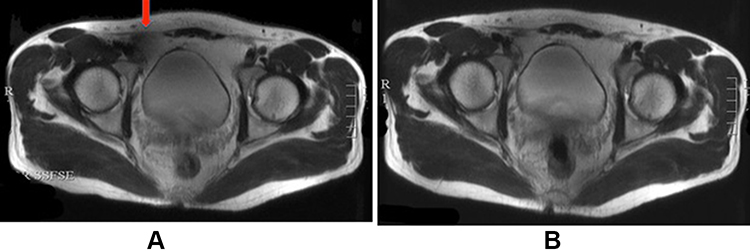 |
Figure 8 Effects of dielectric pads on 3T pelvic MRI artifact reduction. The solid red arrow in (A) depicts a signal dropout in the absence of a dielectric pad. (B) Signal is enhanced by the use of a dielectric pad [Courtesy Allen D Elster, MRIQuestions.com].37 |
Ways of Optimizing Magnetic Field Homogeneity
Optimization of Magnetic Field Homogeneity by Shimming
A number of approaches have been proposed for optimizing magnetic field homogeneity,28–35 the majority of which are based on spherical harmonic expansions and their derivatives. Spherical harmonics (ie, active shimming) uses a computational technique that has the ability to correct the magnetic field to the maximum homogeneity.11 Active shimming is mostly performed to rectify inhomogeneities caused by patients.1 In order to implement this type of shimming, superconducting resistive (shim) coils are incorporated into the gradient coil of the MRI machine to increase the magnetic field homogeneity of the empty magnet.1 These shim coils are capable of generating spherical harmonic fields up to second or third order in most MRI systems. Spherical harmonic shimming is an automated method that is reliable and versatile for achieving an objective user-independent magnetic field homogeneity.14 However, this could be limited by field disturbances resulting from structures with susceptibility differences at tissue–air and tissue–bone interfaces near sinus cavities in the brain,36 bowel gas, and adjacent intraluminal fluid or ascites.12 Small loop coils with confined field patterns could be effective for parallel imaging acceleration and shimming small localized locations that require high-spatial-frequency shim fields.36
Another type of shimming used to compensate for the undesirable effects of B0 heterogeneity is known as passive shimming. Passive shimming is often used to reduce field inhomogeneity resulting from hardware components and external factors (eg, ferromagnetic components used in building materials) that may cause imperfections in the B0 field. Passive shimming entails putting customized shim pockets containing numerous shim irons of various weights and shapes at multiple but accurate points within the gradient coil. The materials embedded in the gradient coil may have paramagnetic, diamagnetic, or ferromagnetic properties. Clinically, passive shimming may not be appropriate because the procedure requires the physical positioning of the shim materials in the MRI system for every patient scan. In addition, because induced magnetization is sensitive to temperature, any temperature gradient would cause the magnetic distribution formed by the passive shims to also fluctuate, which may negatively affect the quality of the image and geometric accuracy.1,7,8
Optimization of Magnetic Field Homogeneity Due to Chemical Shift
Once a patient is positioned in the bore, the homogeneity of the empty magnet is greatly influenced. The field inhomogeneity can reach several ppm when the operator forgets to employ the spectral fat saturation (FAT-SAT) technique in a patient-specific shim process.1 Even the quality of the FAT-SAT technique is still comprised of optimal shimming.12 This is because fat saturation is sensitive to peak-to-peak changes (eg, water and fat) of less than 2 ppm which affects image quality resulting from increased inhomogeneity.1 FAT-SAT could be very difficult to implement when imaging large FOV (eg, head and neck) as well as tissues containing metallic implants such as stainless steel. Using a short T1 relaxation time in pulse sequences such as FSE, spoilt gradient echo, and steady-state free precession produces a bright fat signal on an image which may obscure proper visualization of diseases. Hence, using lower bandwidths with FAT-SAT, the operator is able to obtain the appropriate longitudinal magnetization component (eg, water) while completely suppressing the undesired component of the net magnetization of fat. This approach is, however, very effective for imaging targets such as the knee, pelvis, and abdomen when both B0 and the transmit RF field (B1) are relatively homogeneous. Magnetic field inhomogeneity due to chemical shift increases at higher field strength. Fat suppression is more effective at field strength above 3 T due to the wider spectral bandwidth of RF energy involved and shorter RF pulses in the temporal domain. On the other hand, at field strength lower than 2 T, longer RF pulses are recommended to achieve a good spectral profile due to reduced chemical shifts created between water and fat.12
The most effective approach to dealing with chemical shift artifacts is the use of some type of fat suppression technique to limit the signal from fat. The use of the short TI inversion recovery (STIR) sequence and fat-saturation pulses are examples of such approaches.38 Fat signal suppression in inversion recovery imaging is dependent on tissue T1 differences. Adipose tissue, for example, has a shorter T1 than water. As a result, the longitudinal magnetization of adipose tissue would recover faster than that of water following a 180° inversion recovery. When a 90° pulse is applied at the null point of adipose tissue, no signal is produced, whereas water continues to provide a signal. The null point would be at TI = 0.69 multiplied by the T1 as long as the repetition duration is substantially longer than the T1. As a result, the magnetic field strength influences the T1 and optimum TI null points for inhibiting fat tissue. At 1.5 T, the null point occurs between 130 ms and 170 ms. STIR images are typically acquired using the SE readout process, which takes less time than the traditional SE procedure. The signal of the entire adipose tissue, including the water fraction, is suppressed using the STIR approach. This is the only approach that is unaffected by magnetic field inhomogeneities and may be utilized at a low magnetic field strength.39
Frequency-selective fat saturation is possible in chemical shift change. A frequency selective saturation radio-frequency pulse with the same resonance frequency as lipids is applied to each slice-selection radio-frequency pulse during a fat saturation acquisition. To dephase the lipid signal, a homogeneity spoiling gradient pulse is delivered immediately following the saturation pulse. Lipid has no effect on the signal generated by the succeeding slice-selection pulse.31 Alternatively, swapping the frequency and phase-encoding direction before imaging is a different approach to avoid the chemical-shift artifact. Although the chemical-shift artifact would not be removed, it would be rotated to a different anatomical location. However, such a method may fail because it may result in phase wrap-around or flow-related artifacts being redistributed across the area of interest instead. An additional technique is to decrease the magnitude of the artifact by adjusting imaging parameters. The entire receiver bandwidth could be increased to achieve this purpose (or equivalently, by reducing the field-of-view or increasing the magnitude of the readout gradient).30
Optimization of Magnetic Field Homogeneity Due to Susceptibility Effects
At 3 T, gradient-echo slice excitation profile imaging (GESEPI) could correct EPI signal loss and image blurring artifacts induced by the through-plane local gradient without correcting for geometrical distortion. Similarly, using the SENSE technique reduces geometric distortion caused by in-plane local gradients without decreasing the signal-loss artifact caused by through-plane local gradients. In terms of artifact reduction, the SENSE and GESEPI approaches are complementary. As a result, integrating these two strategies could reduce all three forms of EPI artifacts while maintaining a fast acquisition time due to the reduction in readout time. This method is very effective in reducing magnetic field inhomogeneities of the human brain, especially in air-filled cavities or sinuses where the use of shimming alone to reduce field inhomogeneities may be difficult.17
To optimize field homogeneity due to susceptibility effects, the use of parallel imaging is also recommended. Parallel imaging shortens TE15 as the number of RF pulses required to create an image is reduced;21 however, this may require an increase in bandwidth due to loss in SNR.15 The reduction in SNR could also be compensated for, with high field strength scanners (such as 3 T) when compared with low field strength scanners (eg, 1.5 T).40 Parallel imaging is an efficient technique for minimizing susceptibility artifacts when imaging structures containing gases or paramagnetic compounds, where distortions and signal loss are more evident. In 3 T diffusion-weighted imaging of the brain, this method is more efficient.15
To overcome the variations in MRI signal intensity, dielectric pads or RF cushions filled with gel or conductive fluid or aqueous solution (eg, MnSO4) should be positioned anterior to the thorax during imaging. Dielectric pads act as absorbent layers, removing reflected waves, thereby lowering interference effects. This is very effective in minimizing the standing waves in the body during imaging, which contributes to B0 field homogeneity, and improves RF shimming and transmission efficiency.15 The use of the GRE sequence could minimize the number of standing waves as they are less affected by the dielectric effect.
When imaging body regions with orthopedic implants such as titanium using clinical MRI, avoiding susceptibility artifacts is extremely crucial. In this case, the use of SE or FSE sequences instead of GRE sequences is recommended. The application of multiple 180-degree pulses in these sequences helps to compensate for magnetic field inhomogeneities. This sequence could be used to investigate brain illnesses, meniscal injuries in the knee, and liver abnormalities. The limitation with the SE or FSE sequence is the long echo train which reduces SNR due to longer TE. Hence, to provide enough high spatial frequency information, the length of the echo train should be limited to a reasonable number. In addition to the use of SE/FSE, switching of the phase- and frequency-encoding axes, imaging with a larger receiver bandwidth, arrangement of the longitudinal axis of a metal implant with the axis of the main magnetic field, and use of STIR instead of frequency-selective fat suppression method are all options for reducing susceptibility artifacts from metal implants.
Since the size of geometrical distortion is inversely proportional to the receiver bandwidth, increasing the receiver bandwidth and/or echo train length could help reduce susceptibility-induced image distortion.13 However, increasing the bandwidth excessively could compromise SNR. Hence, to achieve the desired SNR while potentially reducing distortion in an MR image, it is advisable to comprehend the trade-off between sequence parameters (ie, bandwidth, slice thickness, and phase encoding direction) as the magnitude of distortion varies from one anatomic region to another.5 Alternatively, the operator could use a dual-echo sequence to measure the magnetic field and then perform field correction during the reconstruction phase to restore spatial fidelity.13
Conclusion
The magnitude of field inhomogeneities resulting from the inherent properties of the main magnet, external ferromagnetic components surrounding the magnet, and susceptibility effects on MR image depend on field strength, type of pulse sequence, imaging parameters, and the region of the anatomy being imaged. Clinically, there is still some level of uncertainty about how best to optimize field homogeneity considering the different sources of magnetic field inhomogeneity that could affect image quality. Therefore, it is practically impossible to completely eliminate the effect of magnetic field inhomogeneity on MR images. Shimming is the main process that is frequently needed to make modifications to reach the best homogeneity. In addition, it is also important to consider the factors for effective optimization of field homogeneities in MRI;
- the clinical history and the anatomical region of the patient including tissue types (eg, water and fat) being imaged.
- the field strength of the MRI scanner
- the type of pulse sequence most appropriate for the anatomical region being imaged
- sequence parameters most appropriate and suitable for the anatomical region needed to achieve the desired SNR whiles potentially reducing image distortion
- the use of dielectric pads to complement the magnitude of field inhomogeneities and
- the appropriateness of shim values and geometric orientation to an anatomical region.
Recommendation
Apart from shimming and the factors mentioned in the conclusion, it may be worth exploring the interaction between tissue densities, pulse sequence imaging parameters, and image quality metrics (eg, SNR and geometrical distortion) towards optimizing magnetic field homogeneity. Prior knowledge of tissue densities being imaged could assist radiographers and operators of MRI systems to choose the most appropriate or suitable imaging parameters that could yield an image with an optimal signal-to-noise ratio (SNR) and minimize geometrical distortion.
Abbreviations
MRI, Magnetic Resonance Imaging; NMR, Nuclear magnetic resonance; MRS, Magnetic resonance spectroscopy; Bo, Magnetic field; FOV, Field of view; DSV, Diameter of spherical volume; GRE, Gradient echo; STIR, Short TI inversion recovery; SE/FSE, Gradient echo/Fast spin-echo; SENSE, Sensitivity encoding; GESEPI, Gradient echo slice excitation profile imaging; RF, Radio frequency; TE, Echo time; TR, Repetition time; T1, Longitudinal relaxation time; T2, Transverse relaxation time; T2*, Effective transverse relaxation; FAT SAT, spectral fat saturation; SNR, Signal-to-noise ratio; CNR, Contrast-to-noise ratio.
Acknowledgments
The authors would like to thank University of Ghana - Building A New Generation of Academics in Africa (BANGA-Africa) project for their support.
Author Contributions
All authors made significant contributions to the work reported, whether that is in the conception, study design, execution, acquisition of data, analysis and interpretation, or in all these areas; took part in drafting, revising or critically reviewing the article; gave final approval of the version to be published; have agreed on the journal to which the article has been submitted; and agreed to be accountable for all aspects of the work.
Disclosure
The authors declare that there are no competing interests in this work.
References
1. Blasche M, Fischer D, Healthineers. Magnet Homogeneity and Shimming. In: Siemens Healthineers. Siemens Healthcare GmbH; 2017. Available from: https://cdn0.scrvt.com/39b415fb07de4d9656c7b516d8e2d907/1800000003946047/b36c69893983/mreadings_mr-in-rt_3rd-edition_magnet-homogeneity-and-shimming_blasche_v2_1800000003946047.pdf.
2. Dale BM, Brown MA, Semelka RC. MRI: Basic Principles and Applications. John Wiley & Sons; 2015.
3. Weishaupt D, Köchli VD, Marincek B. How does MRI work?: an introduction to the physics and function of magnetic resonance imaging. Springer Science & Business Media, 2008.
4. Dwihapsari Y, Asdiantoro E, Maulidiyah N. On the assessment of image inhomogeneity using T2 magnetic resonance imaging in head phantom for radiotherapy treatment planning: preliminary study. Appl Magn Reson. 2020;51(1):59–69. doi:10.1007/s00723-019-01177-x
5. Walker A, Liney G, Metcalfe P, Holloway L. MRI distortion: considerations for MRI-based radiotherapy treatment planning. Australas Phys Eng Sci Med. 2014;37(1):103–113. doi:10.1007/s13246-014-0252-2
6. Cho ZH, Kim DJ, Kim YK. Total inhomogeneity correction including chemical shifts and susceptibility by view angle tilting. Med Phys. 1998;15(1):7–11. doi:10.1118/1.596162
7. Wachowicz K. Evaluation of active and passive shimming in magnetic resonance imaging. Res Rep Nucl Med. 2014;4:1–12. doi:10.2147/RRNM.S46526
8. Koch KM, Rothman DL, de Graaf RA. Optimization of static magnetic field homogeneity in the human and animal brain in vivo. Prog Nucl Magn Reson Spectrosc. 2009;54(2):69. doi:10.1016/j.pnmrs.2008.04.001
9. Drew Z, Murphy A. Magnetic field homogeneity. Reference article, Radiopaedia.org; 2018. Available from: https://radiopaedia.org/articles/magnetic-field-homogeneity.
10. Och JG, Clarke GD, Sobol WT, Rosen CW, Mun SK. Acceptance testing of magnetic resonance imaging systems: report of AAPM nuclear magnetic resonance task group No. 6. Med Phys. 1992;19(1):217–229. doi:10.1118/1.596903
11. Frollo I, Andris P, Krafčík A, Gogola D, Dermek T. Magnetic field homogeneity adjustment for magnetic resonance imaging equipment. IEEE Trans Magn. 2018;54(5):1–9. doi:10.1109/TMAG.2018.2804352
12. Bley TA, Wieben O, François CJ, Brittain JH, Reeder SB. Fat and water magnetic resonance imaging. J Magn Reson Imaging. 2010;31(1):4–18. doi:10.1002/jmri.21895
13. Mangrum W, Hoang QB, Amrhein TJ, et al. Duke Review of MRI Principles: Case Review Series E-Book. Elsevier Health Sciences; 2018.
14. Juchem C, de Graaf RA. Bo magnetic field homogeneity and shimming for in vivo magnetic resonance spectroscopy. Anal Biochem. 2017;529:17–29. doi:10.1016/j.ab.2016.06.003
15. Chang KJ, Kamel IR. Abdominal imaging at 3T: challenges and solutions. Appl Radiol. 2010;39(10):22. doi:10.37549/AR1773
16. Vachha B, Huang SY. MRI with ultrahigh field strength and high-performance gradients: challenges and opportunities for clinical neuroimaging at 7 T and beyond. Eur Radiol Exp. 2021;5(1):1–8. doi:10.1186/s41747-021-00216-2
17. Yang QX, Wang J, Smith MB, et al. Reduction of magnetic field inhomogeneity artifacts in echo-planar imaging with SENSE and GESEPI at high field. Magn Reson Med. 2004;52(6):1418–1423. doi:10.1002/mrm.20303
18. Gasparotti R, Pinelli L, Liserre R. New MR sequences in daily practice: susceptibility weighted imaging. A pictorial essay. Insights into imaging. 2011 Jun;2(3):335–47.
19. Elster AD, Spoiled-GRE: Image Contrast. MRIQuestions.com; 2021. Available from: https://mriquestions.com/spoiled-gre-parameters.html. Accessed August 19, 2022.
20. Geraldes CF, Laurent S. Classification and basic properties of contrast agents for magnetic resonance imaging. Contrast Media Mol Imaging. 330 2009;4(1):1–23. doi:10.1002/cmmi.265
21. Elster AD, Susceptibility artifact. MRIQuestions.com; 2021. Available from: https://www.mriquestions.com/susceptibility-artifact.html. Accessed August 20, 2022.
22. Elster AD, Chemical shift Artifact. MRIQuestions.com; 2021. Available from: https://mriquestions.com/chemical-shift-artifact.html. Accessed August 18, 2022.
23. Bitar R, Leung G, Perng R, et al. MR pulse sequences: what every radiologist wants to know but is afraid to ask. Radiographics. 2006;26(2):513–537. doi:10.1148/rg.262055063
24. Cornfeld D, Weinreb J. Simple changes to 1.5-T MRI abdomen and pelvis protocols to optimize results at 3 T. American Journal of Roentgenology, 2008;190(2), W140–W150.
25. Franklin KM, Dale BM, Merkle EM. Improvement in B1‐inhomogeneity artifacts in the abdomen at 3T MR imaging using a radiofrequency cushion. J Magn Reson Imaging. 2008;27(6):1443–1447. doi:10.1002/jmri.21164
26. Elster AD, Chemical Shift: Phase Effects. MRIQuestions.com; 2021. Available from: https://mriquestions.com/chemical-shift-in-phase.html. Accessed August 18, 2022.
27. Elster AD, Chemical Shift: 2nd Kind. MRIQuestions.com; 2021. Available from: https://mriquestions.com/chemical-shift-2nd-kind.html. Accessed August 20, 2022.
28. Anderson WA. Electrical current shims for correcting magnetic fields. Rev Sci Instrum. 1961;32(3):241–250. doi:10.1063/1.1717338
29. Keller P, Sommer P. Challenges in NMR magnetometry. In: Proc. 21st IMEKO World Congr. Vol. 1. Prague: Czech Republic; 2015: 909–912.
30. Frollo I, Andris P, Strolka I, Baˇ Ciak L. A least square method for measurement and optimization in selected physical experiments. Key Eng Mater. 2005;295–296:681–686. doi:10.4028/www.scientific.net/KEM.295-296.681
31. Snape-Jenkinson CJ, Crozier S, Forbes LK. NMR shim coil design utilizing a rapid spherical harmonic calculation method. ANZIAM J. 2002;43(36):375–386. doi:10.1017/S1446181100012578
32. Vadovic R. Magnetic field correction using magnetized shims. IEEE Trans Magn. 1989;25(4):3133–3139. doi:10.1109/20.34386
33. Forbes LK, Crozier S. A novel target-field method for finite length magnetic resonance shim coils: i. Zonal shims. J Phys D Appl Phys. 2001;34(24):3447–3455. doi:10.1088/0022-3727/34/24/305
34. Forbes LK, Crozier S. A novel target-field method for finite length magnetic resonance shim coils: II. Tesseral shims. J Phys D Appl Phys. 2002;35(9):839–849. doi:10.1088/0022-3727/35/9/303
35. Forbes LK, Crozier S. A novel target-field method for magnetic resonance shim coils: III. Shielded zonal and tesseral coils. J Phys D Appl Phys. 2003;36(2):68–80. doi:10.1088/0022-3727/36/2/302
36. Wald LL, Polimeni JR. High-Speed, High-Resolution Acquisitions. Brain Mapping, an Encyclopedic Reference. San Diego, CA: Academic Press; 2015. 103–116. doi:10.1016/b978-0-12-397025-1
37. Elster AD, Dielectric Pads. MRIQuestions.com; 2021. Available from: https://mriquestions.com/dielectric-pads.html. Accessed August 20, 2022.
38. Hood MN, Ho VB, Smirniotopoulos JG, Szumowski J. Chemical shift: the artifact and clinical tool revisited. Radiographics. 1999;19(2):357–371. doi:10.1148/radiographics.19.2.g99mr07357
39. Delfaut EM, Beltran J, Johnson G, Rousseau J, Marchandise X, Cotten A. Fat suppression in MR imaging: techniques and pitfalls. Radiographics. 1999;19(2):373–382. doi:10.1148/radiographics.19.2.g99mr03373
40. Khurram S, Wael M. Advances in magnetic resonance imaging (MRI). In: Advances in Medical and Surgical Engineering. Academic Press; 2020: 121–142. ISBN 9780128197127. doi:10.1016/B978-0-12-819712-7.00009-7
 © 2022 The Author(s). This work is published and licensed by Dove Medical Press Limited. The full terms of this license are available at https://www.dovepress.com/terms.php and incorporate the Creative Commons Attribution - Non Commercial (unported, v3.0) License.
By accessing the work you hereby accept the Terms. Non-commercial uses of the work are permitted without any further permission from Dove Medical Press Limited, provided the work is properly attributed. For permission for commercial use of this work, please see paragraphs 4.2 and 5 of our Terms.
© 2022 The Author(s). This work is published and licensed by Dove Medical Press Limited. The full terms of this license are available at https://www.dovepress.com/terms.php and incorporate the Creative Commons Attribution - Non Commercial (unported, v3.0) License.
By accessing the work you hereby accept the Terms. Non-commercial uses of the work are permitted without any further permission from Dove Medical Press Limited, provided the work is properly attributed. For permission for commercial use of this work, please see paragraphs 4.2 and 5 of our Terms.