Back to Journals » Clinical Ophthalmology » Volume 16
Impact of Global Optimization of Lens Constants on Absolute Prediction Error for Final IOL Power Selection When Using Intraoperative Aberrometry
Authors Davidson J, Gu X ![]() , Breen M, Babu RJ
, Breen M, Babu RJ
Received 14 April 2022
Accepted for publication 20 September 2022
Published 27 September 2022 Volume 2022:16 Pages 3155—3164
DOI https://doi.org/10.2147/OPTH.S369797
Checked for plagiarism Yes
Review by Single anonymous peer review
Peer reviewer comments 3
Editor who approved publication: Dr Scott Fraser
John Davidson,1 Xiaolin Gu,2 Michael Breen,2 Raiju J Babu2
1Stein Eye Institute, UCLA School of Medicine, Los Angeles, CA, USA; 2Alcon Vision LLC, Fort Worth, TX, USA
Correspondence: John Davidson, Stein Eye Institute, UCLA School of Medicine, Los Angeles, CA, USA, Email [email protected]
Purpose: To evaluate absolute prediction errors following phacoemulsification with implantation of a multifocal toric intraocular lens (IOL) using intraoperative aberrometry for IOL power selection and to compare findings with the globally optimized and manufacturer’s recommended lens constants and regression coefficients.
Methods: Data from the Optiwave Refractive Analysis (ORA SYSTEM) were analyzed retrospectively. Absolute prediction errors from surgeries performed before and after the first optimization of the manufacturer’s recommended lens constant and non-optimized regression coefficients for the multifocal toric IOL (SND1T3-6) were compared. Optimization was based on outcomes of procedures performed using the ORA SYSTEM and archived in its database (AnalyzOR). Outcome measures included the proportion of eyes with absolute ORA SYSTEM prediction errors ≤ 0.25 D and ≤ 0.5 D and the mean and median absolute prediction errors.
Results: The pre-optimization group included 1027 eyes operated on by 184 surgeons, and the optimized group included 419 eyes operated on by 143 surgeons. The proportions of eyes achieving absolute ORA SYSTEM prediction errors ≤ 0.25 D (52.5% vs 35.0%, p < 0.0001) and ≤ 0.50 D (83.1% vs 66.2%, p < 0.0001) were significantly higher in the optimized than in the pre-optimization group. The mean ± standard deviation (0.30 ± 0.25 D vs 0.43 ± 0.32 D, p < 0.0001) and median (0.24 D vs 0.36 D, p < 0.0001) absolute ORA SYSTEM prediction errors were significantly lower after than before optimization. Prediction errors following optimization were reduced more in eyes of average than of long and short axial lengths.
Conclusion: Global optimization of the manufacturer’s IOL lens constants and regression coefficients resulted in lower absolute prediction errors when compared with the initial manufacturer labeled lens constants and non-optimized regression coefficients. Reductions in absolute prediction error can result in lower postoperative residual refractive error, which can improve post-operative uncorrected visual acuity and provide the potential for greater patient satisfaction following cataract surgery.
Keywords: intraoperative aberrometry, intraocular lens implantation, prediction error, lens constant optimization, refractive error, visual acuity
Introduction
Residual refractive error remains an important cause of suboptimal uncorrected visual acuity (UVA) following cataract surgery,1 particularly in eyes implanted with toric IOLs.2 Numerous formulae for IOL power calculation are available, each of which incorporates keratometry, axial length, and an IOL model-specific lens constant representing an estimate of the effective lens position (ELP), defined as the theoretical difference between the corneal vertex and the effective optical plane of the IOL. One element that could possibly affect ELP is dependent on surgical technique and is therefore surgeon-specific. Inaccurate estimates of postoperative ELP are the primary source of IOL power calculation prediction error.3 Upon release of a new IOL, a provisional recommended lens constant is provided by the manufacturer based on data from bench testing and clinical studies. Ideally, surgeons individually refine this constant for each IOL model based on the refractive outcomes in a series of their own patients, which should include consideration of their specific surgical techniques. Optimization of lens constants improves the likelihood of achieving final spherical equivalent (SE) within ± 0.50D of the predicted post-operative SE.4,5 This is not universally undertaken by cataract surgeons.6 An alternative approach is to optimize the lens constant based on the collective refractive outcomes of large groups of surgeons operating on a large number of eyes.
The Optiwave Refractive Analysis System (ORA SYSTEM; Alcon Laboratories, Ft. Worth, TX) is an intraoperative aberrometry platform that analyzes preoperative biometric and intraoperative aphakic refractive data to determine the optimal IOL power to minimize postoperative residual refractive error using a proprietary formula incorporating a lens constant (Surgeon Factor) and regression coefficients that are IOL model-specific. The ORA SYSTEM measures total refractive astigmatism while accounting for the contributions of posterior corneal astigmatism and surgically induced astigmatism in determining aphakic refraction. The AnalyzOR database is a secure and encrypted HIPAA-compliant web-based data system that stores ocular biometric data measured in the clinic, intraoperative refractive information measured by the intraoperative aberrometry, and postoperative visual acuity and refraction data provided by ORA SYSTEM users. From this database, the ORA SYSTEM lens constants (Surgeon Factor) and regression coefficients for specific IOL models can be optimized via post hoc analysis. For a new IOL to be optimized in the ORA SYSTEM, a minimum data set consisting of ≥100 surgeries, with at least three surgeons performing ≥15 operations each, but no individual surgeon performing more than 50% of operations in the full data set, is required. The optimization process is iterative, and optimized IOL model-specific constants are updated quarterly as additional data are collected in the AnalyzOR database.
In this analysis of data from the AnalyzOR database, the mean absolute ORA SYSTEM prediction errors in eyes undergoing phacoemulsification with implantation of a multifocal toric IOL (AcrySof IQ ReSTOR +3.0 D models SND1T3-6, Alcon) were compared before and after the first optimization of this IOL family’s global Surgeon Factor and regression coefficients. Thus, the purpose of this study was to compare the refractive predictability of lens implantation before and after optimization.
Methods
This was a retrospective analysis of existing data derived from the AnalyzOR database. The database contains preoperative, intraoperative, and postoperative data from patients who had cataract surgery with IOL implantation by surgeons throughout the world. An anonymized data set including only cases from US surgeons, who granted data usage permission to Alcon, was generated for analysis. The study protocol was deemed exempt on the basis of category #4 according to 45 Code of Federal Regulations 46.10 (secondary research using existing data for which consent is not required) by Sterling IRB (Atlanta, GA) on June 30, 2015.
This analysis used eyes implanted with a toric multifocal IOL (AcrySof IQ ReSTOR +3.0 D models SND1T3, SND1T4, SND1T5, or SND1T6, all Alcon) in the US, due to the high number of pre- and post-optimization cases in the database. Additional inclusion criteria included refraction data obtained ≥10 days postoperatively, postoperative best-corrected VA (BCVA) better than 20/40 and better than or equal to postoperative uncorrected VA, absolute ORA SYSTEM predicted error <2.75 D, no ocular disease other than cataract, and no previous corneal refractive surgery. If both eyes of a subject qualified, both were included.
Included eyes were divided into two groups for analysis, based on the timing of surgery relative to the first global optimization of the Surgeon Factor and regression coefficients for the SND1T3-6 toric multifocal IOLs. The pre-optimization group consisted of eyes that underwent surgery before January 21, 2018; IOL power for these eyes was calculated using the manufacturer’s recommended Surgeon Factor for optical biometry and non-optimized ORA SYSTEM regression coefficients. The post-optimization group consisted of eyes that underwent surgery from January 21 through May 6, 2018; IOL power for these eyes was calculated using the first iteration of the optimized Surgeon Factor and regression coefficients.
The study hypothesized that absolute prediction errors using the global optimized Surgeon Factor and regression coefficients would be lower than those using the manufacturer’s pre-optimized lens constant and non-optimized regression coefficients; ie, that post-optimization outcomes would be superior to pre-optimization outcomes. Postoperative manifest refraction spherical equivalent (MRSE) was defined as sphere + ½ cylinder. For each implanted eye, the absolute ORA prediction error was the absolute value of the difference between the achieved postoperative MRSE and the MRSE predicted intraoperatively by the ORA SYSTEM based on the IOL power implanted. Four outcomes were analyzed: the differences in proportions of eyes in the pre- and post-optimization groups with absolute ORA SYSTEM prediction errors ≤0.25 D and ≤0.5 D, and the differences between groups in mean and median absolute ORA SYSTEM prediction errors.
These hypotheses were tested for superiority using one-sided tests (chi-square test for proportions, two-sample t-test for means, Wilcoxon rank sum test for medians) with significance defined as a p-value <0.025. For analyses of outcomes of proportions and means, the 95% confidence intervals (95% CI) for between-group differences were also determined. These four outcomes were also analyzed in eyes sub-grouped by axial lengths of ≤22 mm, >22 mm to <26 mm, and ≥26 mm. No formal power/sample size analysis was performed, as all qualifying eyes from the full AnalyzOR database were included.
In addition, a separate sensitivity analysis was performed using only the first eyes of the patients included in the AnalyzOR database. Despite ORA being blind to outcomes in the first eye in determining recommendations for the second eye, the separate analysis was performed to evaluate whether the inclusion of patients with two eyes in the database had any impact on the results.
Results
This study included 1446 eyes of 1210 subjects who met eligibility criteria and were taken from sites that granted Alcon permission for use of anonymized data. Of these 1446 eyes, 1027 (71.0%) operated upon by 184 surgeons were included in the pre-optimization group and 419 (29.9%) operated upon by 143 surgeons were included in the post-optimization group. Baseline characteristics and IOL models implanted were similar in the two groups (Table 1). Most eyes received an SND1T3 (50.0%) or SND1T4 (29.0%) IOL. More than 85% of eyes had axial lengths between 22 mm and 26 mm.
 |
Table 1 Baseline Characteristics for IOL Models Implanted, and Pre-Operative Biometric Measurements in the Pre-Optimization and Post-Optimization Groups |
Similar findings were observed when first eyes were assessed. Of the 1210 first eyes, 832 (68.8%) were included in the pre-optimization group and 378 (31.2%) in the post-optimization group. Baseline characteristics were also similar in these two groups; most first eyes received an SND1T3 (51.1%) or SND1T4 (28.9%) IOL, and > 85% of eyes had axial lengths between 22 mm and 26 mm (Table 1).
Optimization of the Surgeon Factor and regression coefficients significantly increased the percentages of first eyes (Figure 1A) and all eyes (Figure 1B) achieving absolute ORA SYSTEM prediction errors of ≤0.25 D and ≤0.5 D (Figure 1). The proportions of all eyes achieving absolute ORA SYSTEM prediction error ≤0.25 D were 35.0% pre-optimization and 52.5% post-optimization. This difference, 17.6% (95% CI 12.0%, 23.2%), was statistically significant (p<0.0001). Similarly, the proportions of all eyes achieving absolute ORA SYSTEM prediction error ≤0.5 D were 66.2% pre-optimization and 83.1% post-optimization, a difference (16.8% [95% CI 12.2%, 21.5%]) that was also statistically significant (p<0.0001).
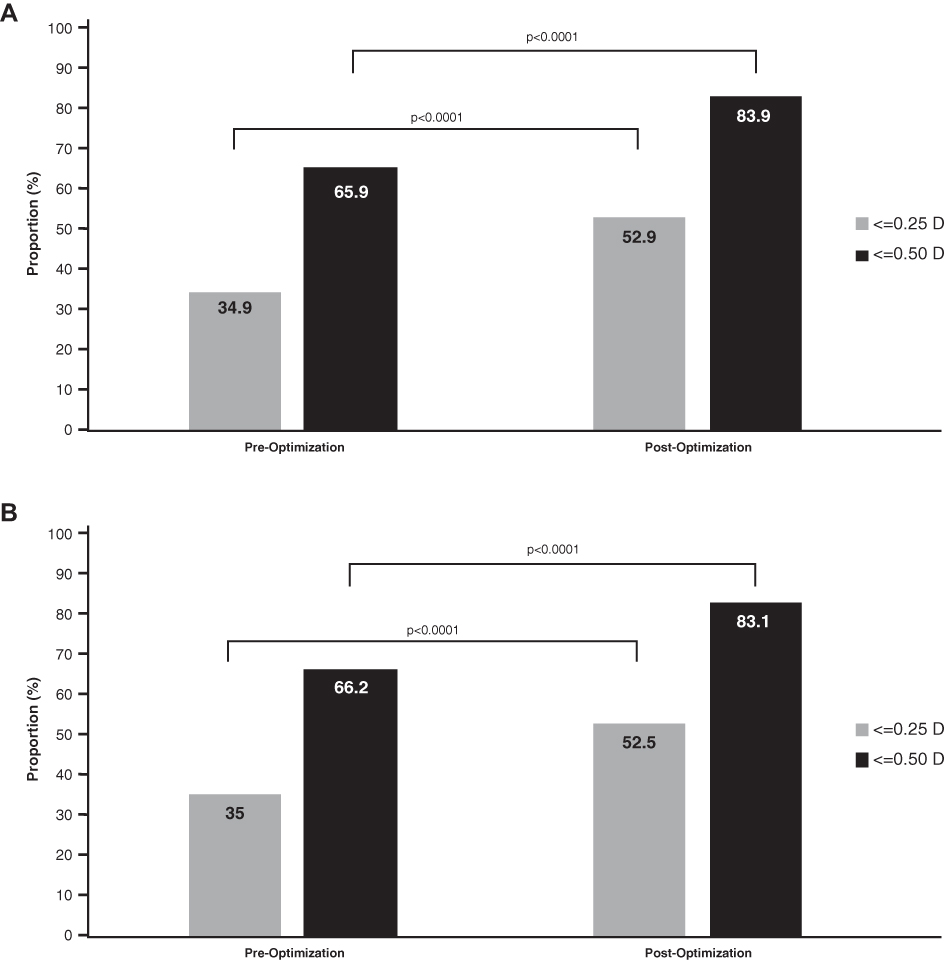 |
Figure 1 Proportions of (A) first eyes and (B) all eyes with absolute ORA SYSTEM prediction error ≤0.25 D and ≤0.50 D before and after the first global optimization of the lens constant. |
Optimization of the Surgeon Factor and regression coefficients also significantly reduced absolute prediction error in both first eyes and all eyes. Both the mean ± SD (0.30 ± 0.25 D vs 0.43 ± 0.32 D; difference, −0.14 D [95% CI −0.17 D, −0.11 D], p<0.0001; Figure 2A) and median (0.24 D vs 0.36 D, difference −0.12 D, p<0.0001; Figure 2B) absolute ORA SYSTEM prediction errors in all eyes were significantly lower after optimization.
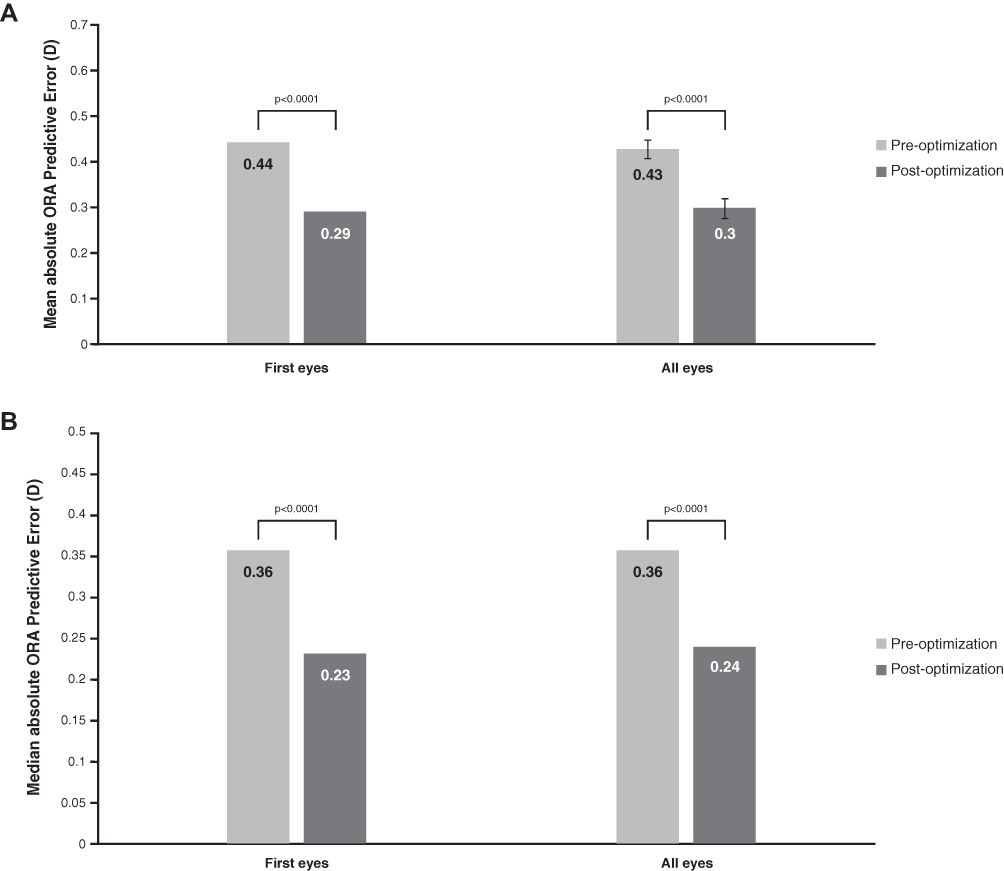 |
Figure 2 (A) Mean and (B) median absolute ORA SYSTEM prediction error before and after optimization of the lens constant in first eyes and in all eyes. |
The effect of axial length on absolute ORA SYSTEM prediction error after the initial lens constant and regression coefficient optimization was assessed in first eyes (Table 2) and in all eyes (Table 3). Optimization of the Surgeon Factor and regression coefficient most effectively increased the proportions of eyes with absolute prediction error ≤0.25 D and ≤0.50 D, and reduced the mean absolute prediction error, in eyes with axial length >22 mm and <26 mm. Less improvement was seen in shorter (≤22 mm) and longer (≥26 mm) eyes. The median absolute prediction error was effectively reduced after optimization in eyes with short and average axial lengths but not in eyes with axial length ≥26 mm.
 |
Table 2 Effect of Axial Length on Absolute ORA SYSTEM Prediction Error After the First Global Lens Constant Optimization in First Eyes |
 | 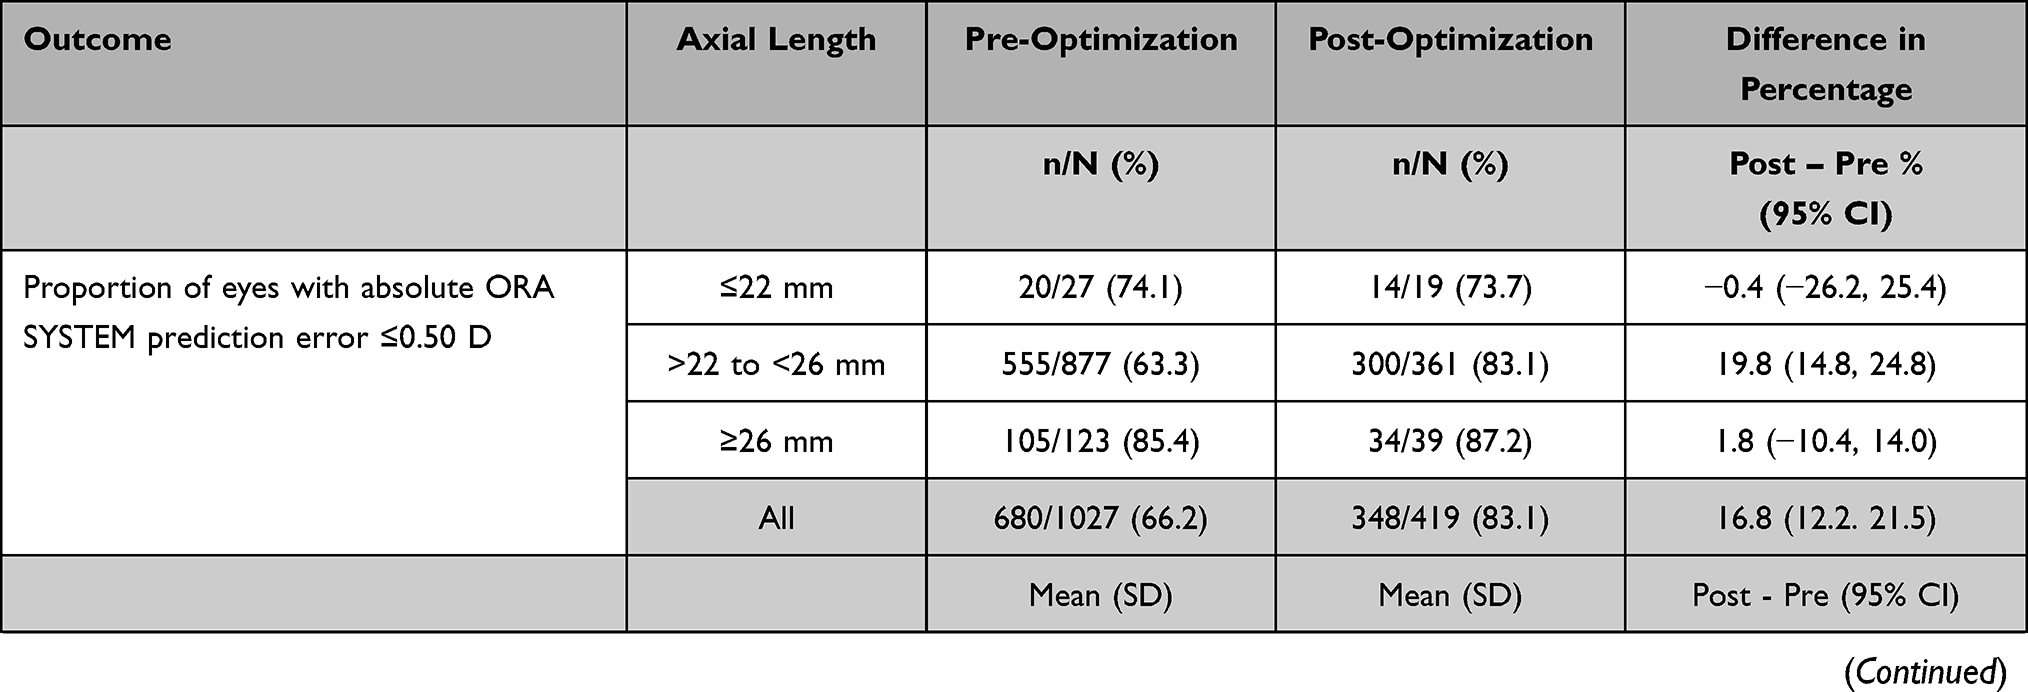 |  |
Table 3 Effect of Axial Length on Absolute ORA SYSTEM Prediction Error After the First Global Lens Constant Optimization in All Eyes |
Discussion
This retrospective analysis of eyes implanted with AcrySof IQ ReSTOR +3.0 D Multifocal toric IOLs (Models SND1T3, SND1T4, SND1T5, and SND1T6) demonstrated that optimization of the ORA SYSTEM Surgeon Factor and regression coefficients improved refractive predictability compared with the use of the manufacturer’s recommended lens constants and non-optimized regression coefficients. Statistically significant reductions in both mean and median absolute prediction errors were achieved, and greater proportions of eyes manifested absolute prediction errors ≤0.25 D and ≤0.50 D after optimization. Relative improvements in the proportion of eyes achieving absolute ORA SYSTEM prediction errors ≤0.25 D and ≤0.50 D were observed following global lens constant optimization, as were reductions in the mean and median absolute prediction error. This was most evident in eyes of average length; short and long eyes were underrepresented in this data set and would be expected to improve in subsequent optimizations based on a larger data set with better representation of short and long eyes.
Cataracts are a leading cause of visual impairment among adults in the US, with the prevalence of cataract expected to double to about 50 million persons by 2050.7 Cataract surgery is among the most commonly performed surgical procedures in adults in the US, with an estimated 3.8 million such surgeries performed in 20178 and a projected annual increase of 5.6%.9 Advances in IOL materials and design, phacoemulsification technology, and surgical techniques have enhanced surgical success rates and simultaneously increased patients’ expectations for high-quality VA, particularly following implantation of premium IOLs for correction of astigmatism and/or presbyopia.1,10
Refractive accuracy after cataract surgery remains suboptimal for many surgeons. Large registry studies have analyzed differences between actual and targeted SE in patients who underwent cataract surgery. For example, a study evaluating risk factors for refractive error after cataract surgery in 282,811 eyes followed-up for 7 to 60 days after surgery reported that 205,675 (72.7%) of these eyes achieved a biometry SE within ± 0.5 D.11 Another study of 8943 eyes that underwent cataract surgery at two hospitals in Glasgow, UK, and were followed up after 4 weeks found that 5577 (62.4%) of these eyes achieved a postoperative SE within ± 0.5 D of target.12
Single-center studies have also compared actual and targeted SE in patients who underwent cataract surgery. For example, an analysis of 2714 eyes that underwent cataract surgery at a private practice in Madrid, Spain found that 86.4% of eyes achieved a postoperative SE within 0.5 D of target.13 A study of 846 patients who underwent cataract surgery at a single practice in Melbourne, Australia, found that, depending on the IOL power formula, 72.1% to 77.9% of eyes achieved a postoperative SE within ± 0.5 D,14 whereas a second study of 200 eyes that underwent surgery in a single center in Rome, Italy, found that depending on the IOL power formula, 80% to 88.5% of eyes achieved a postoperative SE within ± 0.5 D.15 A single-center study in France comparing phacoemulsification cataract surgery in 811 eyes and femtosecond laser assisted cataract surgery in 496 eyes found that 81.2% and 73.5% of these eyes, respectively, achieved a postoperative SE within ± 0.5 D, although the difference was not statistically significant.16
Postoperative residual refractive error can compromise postoperative VA, spectacle independence, and quality of life, all of which can reduce satisfaction among both surgeons and patients. Even if preoperative biometry and surgical technique are perfect, outcomes depend on the lens constant used for IOL power calculation. Although IOL manufacturers include a provisional lens constant for each lens model, personalization of the lens constant will often improve refractive predictability. Thus, guidelines recommend that surgeons personalize lens constants based on their own refractive outcomes. Personalizing lens constants at the individual surgeon level can be facilitated by databases incorporated into biometric devices in the office, online calculators, and web-based services, among others.5 This process can be time-consuming and unfortunately is not always performed,6 which may partially explain why only the top 1% of cataract surgeons can consistently (≥90% of the time) attain refractive predictability within ±0.5 D of predicted postoperative spherical equivalent,17 which is the maximum residual error for which the resulting blur is minimal enough to allow spectacle independence for distance.18,19 In this context, the improvement from 66% to 83% rate of residual refractive error ≤0.5 D using the optimized Surgeon Factor and regression coefficients in the current study takes on meaningful clinical significance.
There is an unmet need to optimize manufacturers’ provisional IOL lens constants for more universal achievement of a baseline absolute prediction error ≤0.5 D, before surgeons perform their own optimization processes. This issue may be remedied by a collective approach among many cataract surgeons to pool pre-, intra-, and postoperative data. As surgeons enter postoperative refraction data into the AnalyzOR database, an iterative analysis of prediction errors allows refinement of the initially recommended lens constant, resulting in a global lens constant optimization based on many surgeries performed by many surgeons. The optimization process also includes the refinement of regression coefficients, a critical component that results in greater refractive predictability. As demonstrated by the present and previous5 studies, use of an optimized lens constant reduces prediction error by applying an average correction across many surgeons. The global optimization process does not address surgeon-specific issues that may produce additional error. To address these additional issues, the lens constant can be further optimized based solely on individual surgeons’ outcomes. This personalized surgeon factor thus corrects for error sources that are both common to many surgeons and specific to individual surgeons. The AnalyzOR program was developed to update both the global optimized Surgeon Factor and regression coefficients and the personalized Surgeon Factor, providing that surgeons enter the post-operative information, in addition to the preoperative information that had been entered into AnalyzOR.
This initial Optimization of the Surgeon Factor and regression coefficients for the SND1T3-6 IOL family was most effective in eyes of average length, with less improvement seen after optimization in short and long eyes. This might be related to the finding that more than 85% of eyes in both pre and post-optimization groups were in the category of average eye (>22mm - <26 mm). Moreover, because the numbers of long and short eyes were too low, their regression coefficients had not been fully refined during the initial optimization process. Existing formulae for IOL power prediction in short and long eyes continue to have lower accuracy than those for average eyes.20 Eyes with extreme axial length are uncommon, representing approximately 10% or less of all eyes.21 Including more eyes in the long and short categories is important to further improve the regression coefficients for these eyes and the overall ORA prediction accuracy.
The strengths of this study include its large sample size, including all eligible patients in the AnalyzOR database at the time of the analysis. Because the optimized data set was restricted to the first iteration of the global optimized lens constant and regression coefficient, further iterative refinement of the lens constant and regression coefficients may result in further improvements in prediction error. The retrospective nature of the analysis was therefore not a study limitation, as the iterative optimization process requires a retrospective approach. Also, refractive outcomes with respect to correction of astigmatic refractive error were not directly analyzed in this study, as the primary outcome was spherical equivalent prediction error, which is the parameter relevant to lens constant optimization for all IOL types, including those that correct presbyopia and/or astigmatism.
Conclusion
In summary, when using the ORA SYSTEM, global optimization of manufacturers’ initial IOL lens constants along with optimization of the regression coefficients of the ORA SYSTEM produce superior refractive predictability compared with the initial labeled lens constants. Reductions in absolute prediction error can lead to higher rates of emmetropia, which might result in better UVA outcomes and greater patient satisfaction following cataract surgery.
Funding
This study is funded by Alcon.
Disclosure
Dr John Davidson is a consultant for Alcon and used Alcon’s ORA device for data gathering and statistical analysis with no financial interest. Dr Xiaolin, Dr Michael Breen, and Dr Raiju J Babu are employees of Alcon Vision LLC. The authors report no other conflicts of interest in this work.
References
1. Kieval JZ, Al-Hashimi S, Davidson RS, et al. Prevention and management of refractive prediction errors following cataract surgery. J Cataract Refract Surg. 2020;46(8):1189–1197. doi:10.1097/j.jcrs.0000000000000269
2. Cionni RJ, Dimalanta R, Breen M, Hamilton C. A large retrospective database analysis comparing outcomes of intraoperative aberrometry with conventional preoperative planning. J Cataract Refract Surg. 2018;44(10):1230–1235. doi:10.1016/j.jcrs.2018.07.016
3. Norrby S. Sources of error in intraocular lens power calculation. J Cataract Refract Surg. 2008;34(3):368–376. doi:10.1016/j.jcrs.2007.10.031
4. Nemeth G, Nagy A, Berta A, Modis L
5. Aristodemou P, Knox Cartwright NE, Sparrow JM, Johnston RL. Intraocular lens formula constant optimization and partial coherence interferometry biometry: refractive outcomes in 8108 eyes after cataract surgery. J Cataract Refract Surg. 2011;37(1):50–62. doi:10.1016/j.jcrs.2010.07.037
6. Osman L, Chung AK. UK national survey on personalized customization of A-constant in cataract surgery. Eye. 2010;24(5):938–940. doi:10.1038/eye.2009.238
7. National Eye Institute. Cataract data and Statistics. Available from: https://www.nei.nih.gov/learn-about-eye-health/resources-for-health-educators/eye-health-data-and-statistics/cataract-data-and-statistics.
8. Vogel K, Rojas CN, Greenberg PB, Margo CE, French DD. Impact of the COVID-19 pandemic on cataract surgeries in the United States. Clin Ophthalmol. 2022;16:1601–1603. doi:10.2147/OPTH.S367608
9. Williams A, Sloan FA, Lee PP. Longitudinal rates of cataract surgery. Arch Ophthalmol. 2006;24(9):1308–1314. doi:10.1001/archopht.124.9.1308
10. Assil KK, Greenwood MD, Gibson A, Vantipalli S, Metzinger JL, Goldstein MH. Dropless cataract surgery: modernizing perioperative medical therapy to improve outcomes and patient satisfaction. Curr Opin Ophthalmol. 2021;32(Suppl 1):S1–S12. doi:10.1097/ICU.0000000000000708
11. Lundstrom M, Dickman M, Henry Y, et al. Risk factors for refractive error after cataract surgery: analysis of 282 811 cataract extractions reported to the European Registry of Quality Outcomes for cataract and refractive surgery. J Cataract Refract Surg. 2018;44(4):447–452. doi:10.1016/j.jcrs.2018.01.031
12. Brogan K, Diaper CJM, Rotchford AP. Cataract surgery refractive outcomes: representative standards in a National Health Service setting. Br J Ophthalmol. 2019;103(4):539–543. doi:10.1136/bjophthalmol-2018-312209
13. Rementeria-Capelo LA, Garcia-Perez JL, Gross-Otero J, Moran A, Sanchez-Pina JM, Contreras I. Visual and refractive outcomes of cataract surgeries performed in one year in a private practice setting: review of 2714 procedures. J Ophthalmol. 2020;2020:2421816. doi:10.1155/2020/2421816
14. Connell BJ, Kane JX. Comparison of the Kane formula with existing formulas for intraocular lens power selection. BMJ Open Ophthalmol. 2019;4(1):e000251. doi:10.1136/bmjophth-2018-000251
15. Savini G, Di Maita M, Hoffer KJ, et al. Comparison of 13 formulas for IOL power calculation with measurements from partial coherence interferometry. Br J Ophthalmol. 2019;105(4):484–489. doi:10.1136/bjophthalmol-2020-316193
16. Crozafon PC, Bouchet C, Zignani M, et al. Comparison of real-world treatment outcomes of femtosecond laser-assisted cataract surgery and phacoemulsification cataract surgery: a retrospective study from an outpatient clinic in France. Eur J Ophthalmol. 2021;31(4):1809–1816. doi:10.1177/1120672120925766
17. Holladay IOL Consultant Software & Surgical Outcomes Assessment: Holladay IOL Outcomes Optics We Need To Know. Available from: http://www.hicsoap.com/docs/HOLLADAY-IOL-Outcomes-Optics-We-Need-to-Know-1.9-MB-5apr18.pdf.
18. Holladay JT, Lynn MJ, Waring GO 3rd, Gemmill M, Keehn GC, Fielding B. The relationship of visual acuity, refractive error, and pupil size after radial keratotomy. Arch Ophthalmol. 1991;109(1):70–76. doi:10.1001/archopht.1991.01080010072036
19. Villegas EA, Alcon E, Artal P. Minimum amount of astigmatism that should be corrected. J Cataract Refract Surg. 2014;40(1):13–19. doi:10.1016/j.jcrs.2013.09.010
20. Hoffer KJ, Savini G. IOL Power calculation in short and long eyes. Asia Pac J Ophthalmol. 2017;6(4):330–331. doi:10.22608/APO.2017338
21. Fotedar R, Wang JJ, Burlutsky G, et al. Distribution of axial length and ocular biometry measured using partial coherence laser interferometry (IOL Master) in an older white population. Ophthalmology. 2010;117(3):417–423. doi:10.1016/j.ophtha.2009.07.028
 © 2022 The Author(s). This work is published and licensed by Dove Medical Press Limited. The
full terms of this license are available at https://www.dovepress.com/terms
and incorporate the Creative Commons Attribution
- Non Commercial (unported, 3.0) License.
By accessing the work you hereby accept the Terms. Non-commercial uses of the work are permitted
without any further permission from Dove Medical Press Limited, provided the work is properly
attributed. For permission for commercial use of this work, please see paragraphs 4.2 and 5 of our Terms.
© 2022 The Author(s). This work is published and licensed by Dove Medical Press Limited. The
full terms of this license are available at https://www.dovepress.com/terms
and incorporate the Creative Commons Attribution
- Non Commercial (unported, 3.0) License.
By accessing the work you hereby accept the Terms. Non-commercial uses of the work are permitted
without any further permission from Dove Medical Press Limited, provided the work is properly
attributed. For permission for commercial use of this work, please see paragraphs 4.2 and 5 of our Terms.