")
Back to Journals » Risk Management and Healthcare Policy » Volume 15
Impact of Diabetes Mellitus on the Immunity of Tuberculosis Patients: A Retrospective, Cross-Sectional Study
Authors Wei R , Li P, Xue Y, Liu Y, Gong W , Zhao W
Received 16 December 2021
Accepted for publication 26 March 2022
Published 8 April 2022 Volume 2022:15 Pages 611—627
DOI https://doi.org/10.2147/RMHP.S354377
Checked for plagiarism Yes
Review by Single anonymous peer review
Peer reviewer comments 3
Editor who approved publication: Dr Jongwha Chang
Ruda Wei,1,2,* Pengchuan Li,2,3,* Yong Xue,3 Yinping Liu,3 Wenping Gong,3 Weiguo Zhao1,2
1Senior Department of Respiratory and Critical Care Medicine, The Eighth Medical Center of PLA General Hospital, Beijing, 100091, People’s Republic of China; 2Hebei North University, Zhangjiakou, 075000, Hebei, People’s Republic of China; 3Army Tuberculosis Prevention and Control Key Laboratory/Beijing Key Laboratory of New Techniques of Tuberculosis Diagnosis and Treatment, Senior Department of Tuberculosis, the Eighth Medical Center of PLA General Hospital, Beijing, 100091, People’s Republic of China
*These authors contributed equally to this work
Correspondence: Weiguo Zhao; Wenping Gong, Email [email protected]; [email protected]
Background: Tuberculosis (TB) is an infectious disease that poses a significant health threat and is one of the leading causes of death worldwide. Diabetes mellitus (DM) has high morbidity and mortality rates. Previous studies have reported that comorbidities can influence one another and aggravate immune disorders. A systematic and comprehensive evaluation of the immune status of patients with TB and DM (TB-DM) is helpful for early clinical immune intervention and for promoting the recovery of patients with TB-DM.
Methods: This study included 159 patients with TB without DM (TB-NDM) and 168 patients with TB-DM. Interferon-γ (IFN-γ) release assays (IGRAs) and TB-specific antibodies against 38kD+16kD proteins were used to detect humoral and cellular immune responses. Flow cytometry was used to analyze the absolute counts of the lymphocyte subsets.
Results: There was no significant difference in the positive rate of enzyme-linked immunospot (ELISPOT) assays, enzyme linked immunosorbent assay (ELISA), and 38kD+16kD antibodies between the TB-DM and TB-NDM groups. Pulmonary lobe lesion and cavity formation rates were significantly higher in patients with TB-DM with poor glycemic control than patients with TB-NDM and TB-DM with normal glycemic control. The absolute counts of T lymphocytes, CD8+ T lymphocytes, and B lymphocytes in patients with TB-DM were markedly lower than those in patients with TB-NDM. The absolute counts of T lymphocytes and CD8+ T lymphocytes in patients with TB-DM and hyperglycemia were lower than those in patients with euglycemia. Linear regression analysis revealed that the absolute counts of total T lymphocytes, CD8+ T lymphocytes, and NK cells in patients with TB-DM significantly decreased with increasing fasting blood glucose (FBG) levels.
Conclusion: Hyperglycemia is a risk factor for pulmonary cavity formation and lobe lesions in patients with TB-DM and suppresses the absolute counts of total T lymphocytes, CD8+ T lymphocytes, and NK cells in patients with TB-DM. The potential mechanism may involve the downregulation of innate and adaptive immune responses.
Keywords: tuberculosis, diabetes mellitus, comorbidity, lymphocyte subsets, interferon-γ, immunological evaluation
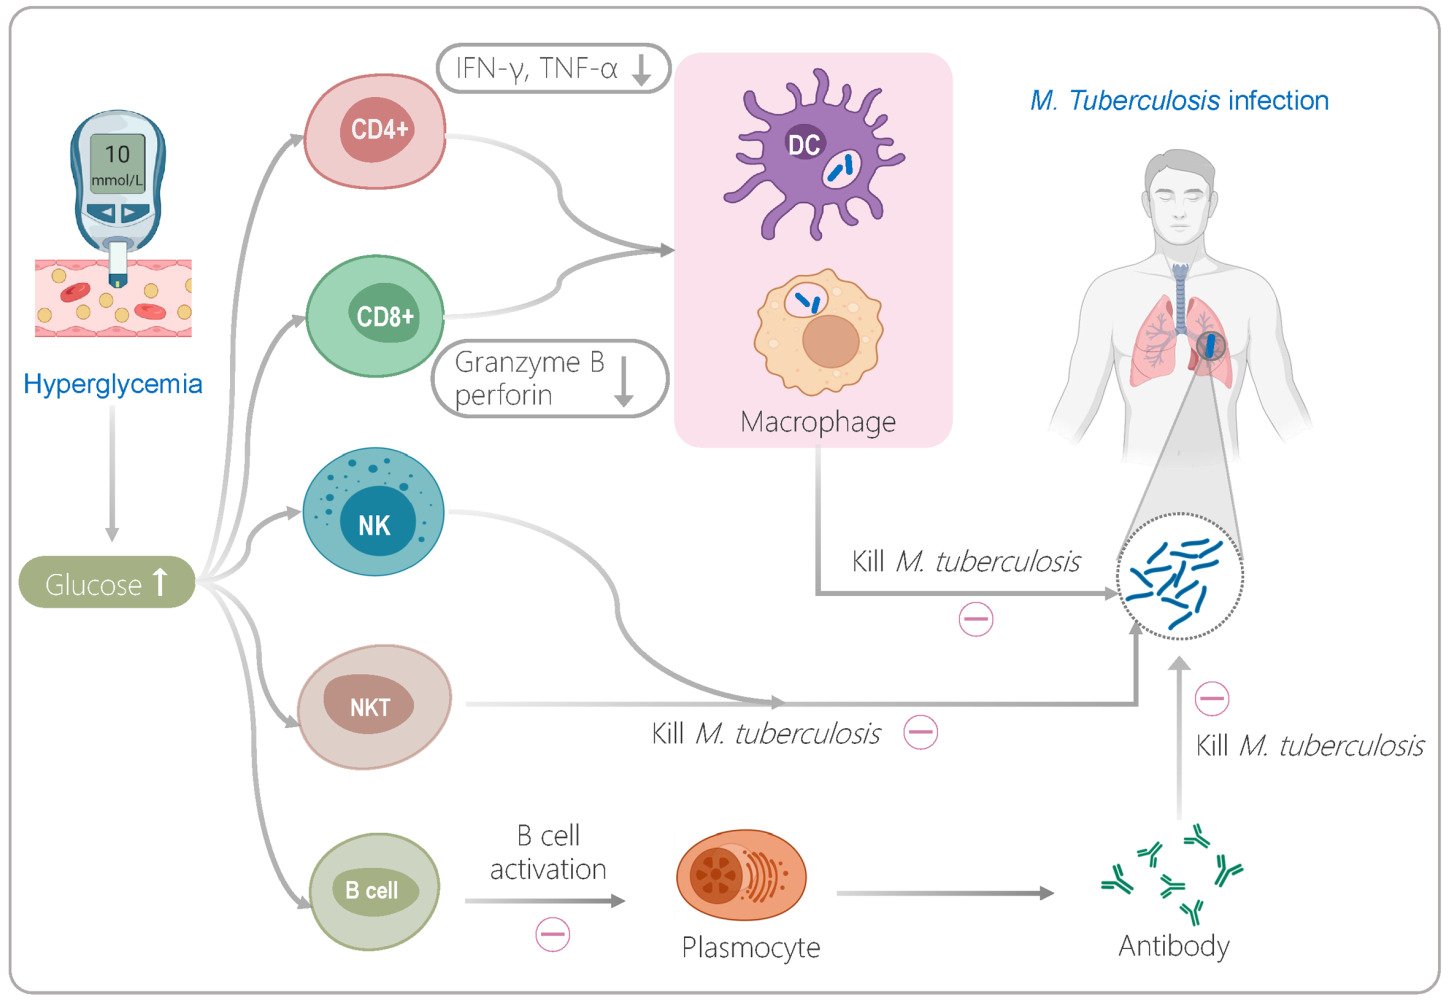
Graphical Abstract:
Introduction
Tuberculosis (TB) is a respiratory infection caused by Mycobacterium tuberculosis (M. tuberculosis).1 According to the World Health Organization (WHO) estimates, due to the impact of coronavirus disease 2019 (COVID-19), the number of TB deaths (among HIV-negative people) has increased from 1.2 million in 2019 to 1.3 million in 2020.2 Although significant progress has been made in preventing and controlling TB, it remains a serious global public health problem.3–5 Furthermore, it is estimated by the International Diabetes Federation (IDF) that more than 400 million adults worldwide suffer from diabetes mellitus (DM), and type 2 DM is a risk factor for patients with TB.6–8
A growing number of studies have shown that DM can promote primary infection or reactivation of M. tuberculosis in the host by damaging the response function of immune cells, thereby increasing the incidence of TB.8,9 It has been reported that higher blood glucose levels can seriously impair the immune response of innate immune cells such as macrophages, dendritic cells (DCs), and natural killer cells (NKs).6 Disorders of glucose metabolism can inhibit the killing effect of innate immune cells in multiple ways, including downregulating the phagocytic activity and antigen presentation ability of macrophages,10,11 reducing the distribution frequency of macrophages and DC subpopulations,12 and decreasing the expression level of perforin, granzyme B, and CD107a by NK cells and cytotoxic T lymphocytes (CTLs).13 It is frustrating that hyperglycemia suppresses a patient’s innate immune cells and affects their adaptive immune cells. It overactivates central memory T cells (TCM), resulting in a decrease in the number of effector CD4+ T cells and CD8+ T cells and a reduction in the secretion of Th1 cytokines such as IFN-γ and TNF-α in patients with TB.6,14
Therefore, DM affects both the function of lymphocyte subsets and phenotypic differentiation of lymphocyte subsets in patients with TB.15,16 Compared to patients with TB without DM (TB-NDM), those with DM (TB-DM) show a strong antigen response and a higher level of pro-inflammatory factors in the early stage of DM. Furthermore, with the development of DM, the alveolar macrophages of patients with TB are inhibited by high blood glucose levels, and the secretion level of IFN-γ also drops immediately.17,18 Interestingly, after effective anti-TB treatment, immune deficiency in patients with TB-DM can be recovered.19 Thus, it is crucial to evaluate the impact of DM on the immunity of patients with TB, which can guide clinicians to perform immune interventions as soon as possible to contribute to the recovery of patients with TB-DM.20,21 However, there are few reports on the systematic and comprehensive evaluation of the immune status of patients with TB-DM.21
Herein, a retrospective cross-sectional study was performed to assess the impact of DM on the immunity of patients with TB by using the flow cytometry (FCM), interferon-γ (IFN-γ) release assay (IGRA), and humoral immunity-related anti-TB antibody test, which may provide the theoretical basis for promoting clinical rehabilitation of TB-DM.
Materials and Methods
Study Design and Ethics Statement
This retrospective cross-sectional study was performed at the Eighth Medical Center of the Chinese People’s Liberation Army (PLA) General Hospital, Beijing, China. This study was approved by the Ethics Committee of the Eighth Medical Center of PLA General Hospital (approval number: 309202109061503) and conducted according to the ethical standards of the Declaration of Helsinki.
Participants and Samples
A total of 327 patients with TB hospitalized in the Senior Department of Tuberculosis of the Eighth Medical Center of the PLA General Hospital between January 2020 and January 2021 were retrospectively enrolled. The diagnostic criteria of all patients with TB were referred to the “Diagnosis for pulmonary tuberculosis (WS 288–2017)22” and “Classification of Tuberculosis (WS 196–2017)23” released by the National Health and Family Planning Commission of China (NHFPC). Based on the definite diagnosis of TB, patients with TB-DM should meet the diagnostic criteria of diabetes listed below: (1) the level of fasting blood glucose (FBG) was ≥ 7.0 mmol/L;24 (2) the level of glycosylated hemoglobin was ≥ 6.5%;25 (3) individuals with HIV infection, agranulocytosis diseases, autoimmune diseases, severe liver/kidney diseases, malignancies, immunomodulators, and pregnancy were excluded. All patients with TB were classified according to whether their hospital length of stay (LOS) exceeded 2 weeks: (1) LOS ≤ 2 weeks, patients with TB-DM; (2) LOS > 2 weeks, patients with TB-DM; (3) LOS ≤ 2 weeks, patients with TB-NDM; (4) LOS > 2 weeks, patients with TB-NDM. Among them, patients with TB with LOS > 2 weeks were defined as those who had undergone standard antituberculosis drug treatment for 2 weeks after hospitalization, at which time they had a high level of antituberculosis drug concentration in vivo, whereas patients with LOS ≤ 2 weeks had a low level of antituberculosis drug concentration in vivo.
Blood samples were obtained from 327 patients with TB. Data of patients with LOS ≤ 2 weeks were collected the morning after hospitalization, and data of patients with LOS > 2 weeks were collected 2 weeks after standard anti-tuberculosis therapy. Four milliliters of blood samples were placed in heparin intravenous anticoagulation tubes for flow cytometry analysis, IGRA-ELISPOT, and IGRA-ELISA assay. In addition, four milliliters of blood samples were placed in red tubes that did not contain any coagulants or anticoagulants to detect specific antibodies against 38kD+16kD proteins of M. tuberculosis.
IGRA Based on Enzyme-Linked Immunospot Assays (ELISPOT)
First, lymphocytes in the blood samples were isolated using a Human Lymphocyte Isolation Kit (Solarbio, Beijing, China), following the manufacturer’s instructions. The isolated lymphocytes (2.5×10⁵ per well) were added to a 96-well ELISPOT plate and incubated with serum-free medium, positive control PHA, and TB-specific recombinant antigen ESAT-6/CFP-10 at 37 °C with 5% CO2 for 18–20 hours, respectively. The lymphocytes in the ELISPOT plate were then removed, and the vessel was washed with phosphate-buffered saline (PBS). Next, anti-human IFN-γ monoclonal antibodies (7-B6-ALP) diluted 1:200 with PBS containing 0.5% fetal bovine serum (FBS) were added to each well of the ELISPOT plate, and incubated for 2 h at room temperature. The vessel was washed five times with PBS. Subsequently, 100 μL of substrate solution (BCIP/NBT-plus) was added to the ELISPOT plate and color development was stopped using tap water. After leaving the plate dry, the number of spot-forming cells (SFCs) was counted using a CTL-S5 Versa ELISPOT Reader (CTL, Cleveland, OH, USA) following our previous studies.4,26 If the number of SFCs in the blank control was < 13 and the difference between the number of SFCs in the test well and the blank control was ≥16, it was judged as positive. Otherwise, the result is negative.
IGRA Based on Enzyme-Linked Immunosorbent Assay (ELISA)
One milliliter of blood sample collected from each patient with TB were incubated with TB-specific recombinant antigen ESAT-6/CFP-10 (T tube), positive control PHA (P tube), and negative control (N tube) at 37 °C with 5% CO2 for 22±2 h. Then, 50 μL of isolated plasma (centrifuging at 3000–5000 rpm for 10 min) was added to the 96-well plate and incubated at 37 °C for 60 min. Subsequently, 50 μL of HRP labeled human IFN-γ monoclonal antibody (Wantai Bio-pharmaceutical Co., Ltd., Beijing, China) was added to a 96-well plate and incubated at 37 °C for 60 min. After adding TMB substrate, the IFN-γ level of each plasma sample was measured using a microplate reader (Thermo, Massachusetts, USA). If the value of tube N is ≤400 and the difference between tubes T and N is ≥14, it is judged as positive. Otherwise, the result is negative.
Detection of Specific Antibodies Against 38kD+16kD Proteins of M. Tuberculosis
Specific antibodies against 38kD+16kD proteins of M. tuberculosis were detected using a Rapid Gold Immuno-Assay Test for TB-IgG (GICA) kit (Beijing Zhongjian Antai Diagnostic Technology Co., Ltd., Beijing, China). In brief, 10 μL of serum collected from each patient with TB was added to the well of the test card, followed by adding 100 μL of the sample. The results were read within 15–20 min. If the quality control line (C) and test line (T) appear red simultaneously, they are considered positive. Otherwise, the result is negative.
Flow Cytometry
Four milliliters of peripheral blood samples were collected from patients with TB and placed in heparin anticoagulant tubes. Then, 50 μL of the blood sample was transferred to a new BD TruCount test tube (BD, San Jose, California, USA) with 20 μL of 6-colors TB NK reagent. Flow cytometry was used to detect CD45 cells labeled with percp-cy5.5 fluorescence (BD Biosciences, San Jose, CA, USA), CD3 cells labeled with FITC fluorescence (BD Biosciences, San Jose, CA, USA), CD4 cells labeled with pe-cy7 fluorescence (BD Biosciences, San Jose, CA, USA), CD8 cells labeled with APC-cy7 fluorescence (BD Biosciences, San Jose, CA, USA), CD16 cells and CD56 cells labeled with PE fluorescence (BD Biosciences, San Jose, CA, USA), and CD19 cells labeled with APC fluorescence (BD Biosciences, San Jose, CA, USA). After incubation at room temperature for 15 min in the dark, 1 × red blood cell lysate (BD, San Jose, CA, USA) was added to the samples and incubated in the dark for 15 min. Subsequently, FACS Arial II flow cytometry (BD, San Jose, California, USA) was used to determine the frequencies of total T lymphocytes, CD4+ T lymphocytes, CD8+ T lymphocytes, NK cells, natural killer T cells (NKT), and B lymphocytes. Finally, the results were analyzed using FACS-DIVA software.
Statistical Analysis
All data were analyzed using GraphPad Prism 9 software (San Diego, CA, USA). According to the data normality and homogeneity of variances, the measurement data of the single-factor multi-level design were compared with ordinary one-way ANOVA test or Kruskal–Wallis nonparametric test. According to normality, the measurement data of the single-factor two-level design were analyzed with an unpaired t-test or Mann–Whitney U-test. Parametric data are shown as mean ± standard deviation (SD) and nonparametric data as median and interquartile range. Differences were considered statistically significant at p < 0.05. Nominal and ordinal variables (age, sex, and results from sputum smear, sputum culture, gene-Xpert MTB/RIF, IGRA-ELISPOT, IGRA-ELISA, 38kD+16Kd antibody, and pulmonary lobe lesion) were compared using the Chi-square test or Fisher’s exact test according to the sample size. Odds ratios (ORs) and 95% confidence intervals (CIs) were calculated using the Baptista-Pike method. Differences were considered statistically significant at P < 0.05.
We performed a two-sample test to determine sample size of group A (TB-NDM) and group B (TB-DM) using an online tool at http://powerandsamplesize.com.27 According to our previous research results, α = 0.05, (1-β) = 0.8, µA = 1200 (mean of total T lymphocytes in group A), µB = 1000 (mean of total T lymphocytes in group B), ς = 500 (standard deviation), κ =1 (the ratio between the sample sizes), and the sample size of each group is n = 141.
In addition, simple linear regression was performed to evaluate the relationship between blood glucose levels and the counts of total T lymphocytes, CD4+ T lymphocytes, CD8+ T lymphocytes, NK cells, NKT cells, and B lymphocytes. Principal component analysis (PCA) was used to evaluate the impact of different measurements (age, sex, FBG, absolute counts of total T lymphocytes, CD4+ T lymphocytes, CD8+ T lymphocytes, NK cells, NKT cells, and B lymphocytes) on TB-DM. The principal component (PC) was selected according to the eigenvalue > 1, a Monte Carlo simulation was performed on the input data, and the eigenvalues of all the PCs were calculated. The eigenvalues of the input data were then compared to the mean values of the corresponding PCs in the simulation. The percentile level, number of simulations, and random seeds were set to 95%, 1000, and automatic, respectively.
Results
Participants Characteristics
Three hundred and twenty-seven TB (240 men and 87 women) were retrospectively included in this study: patients with TB without DM (TB-NDM) (n = 159) and with DM (TB-DM) (n = 168). The clinical characteristics of the TB-NDM and TB-DM groups are presented in Table 1. It was found that the mean age of the TB-DM group was significantly higher than that of the TB-NDM (59.7 ± 14.3 years vs 44.8 ± 20.0 years, P < 0.0001), suggesting that elderly patients with TB are more likely to develop diabetes. We also found that the erythrocyte sedimentation rate (ESR) in the TB-NDM group was lower than that in the TB-DM group (42.97 ± 35.34 mm/h vs 52.57±39.44 mm/h, P = 0.0217). There were no differences in sputum smear, sputum culture, and Gene-Xpert MTB/RIF between the TB-NDM and TB-DM groups (Table 1).
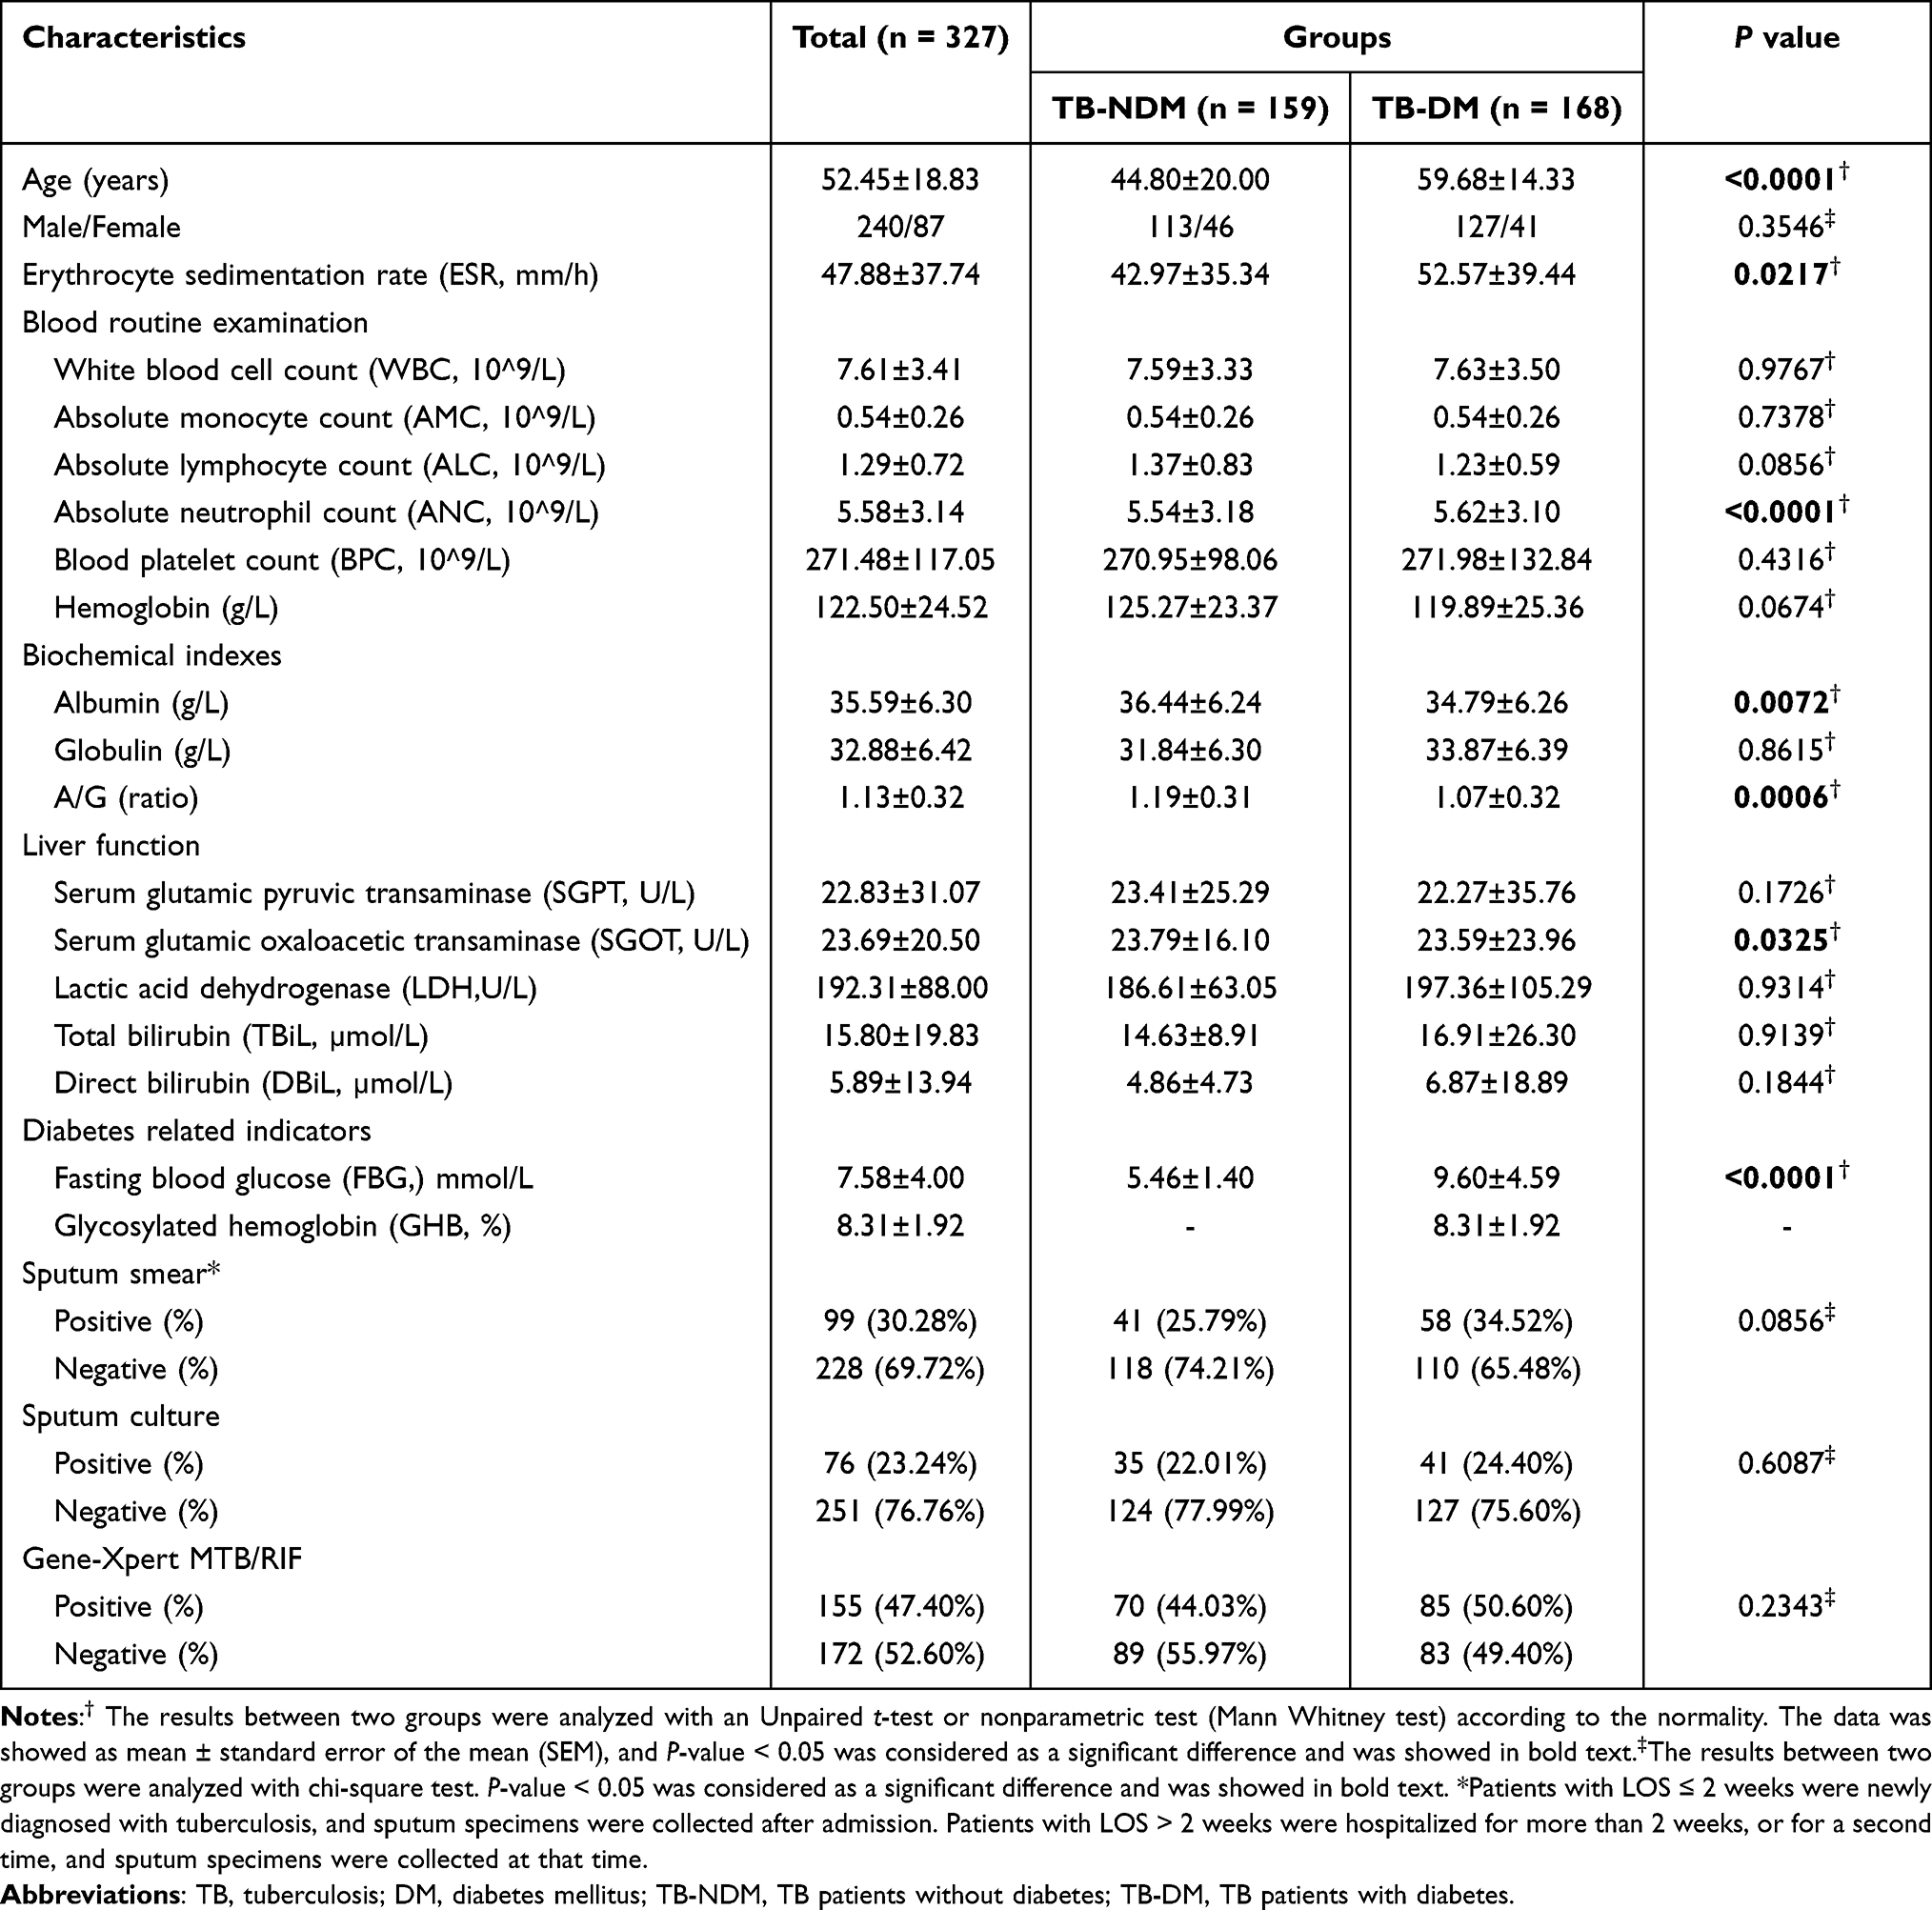 |
Table 1 Clinical Characteristics of the Study Participants (n = 327) |
The Impact of Diabetes on TB Severity and Treatment Outcomes
To further determine the relationship between the three measurements (age, blood glucose, and LOS) and immunological responses and pulmonary lesions (ELISPOT, ELISA, 38kD+16kD specific antibody, pulmonary lobe lesion, and pulmonary cavity) between patients with TB-NDM and TB-DM, patients in both groups were divided into different subgroups based on three parameters.
Comparison of Age and Immunological Responses & Pulmonary Lesions in Patients with TB with or without DM
It is well known that age is associated with immunological responses in patients with TB and DM or their comorbidities. The elderly have significantly reduced immunity, are more likely to be infected with M. tuberculosis during diabetes, and have poorer treatment outcomes.28 The patients with TB-NDM and TB-DM were divided into two subgroups: age < 60 years (n = 115 or n = 87) and age ≥ 60 years (n = 44 or n = 81), respectively. As shown in Table 2, the number of patients with pulmonary cavities in the TB-DM group aged ≥ 60 years was significantly higher than that of patients in the Age < 60 years TB-NDM group (P = 0.0050, OR = 2.725, 95% CI [1.390, 5.249]). The number of patients with pulmonary cavities in the TB-DM group was significantly higher than that in the TB-NDM group (P = 0.0242, OR = 1.899, 95% CI [1.109, 3.296]). Interestingly, we found that the probability of lung cavity formation in elderly patients with TB with DM was 2.725 times higher than that in young patients with TB without DM. The probability of lung cavity formation in patients with TB with DM is 1.899 times higher than that in patients with TB without DM, suggesting that DM is a possible risk factor for cavity formation in the lungs of patients with TB. Furthermore, we found that the results of ELISPOT, ELISA, 38kD+16kD specific antibodies, and the pulmonary lobe lesions were not different between subgroups or TB-NDM and TB-DM groups.
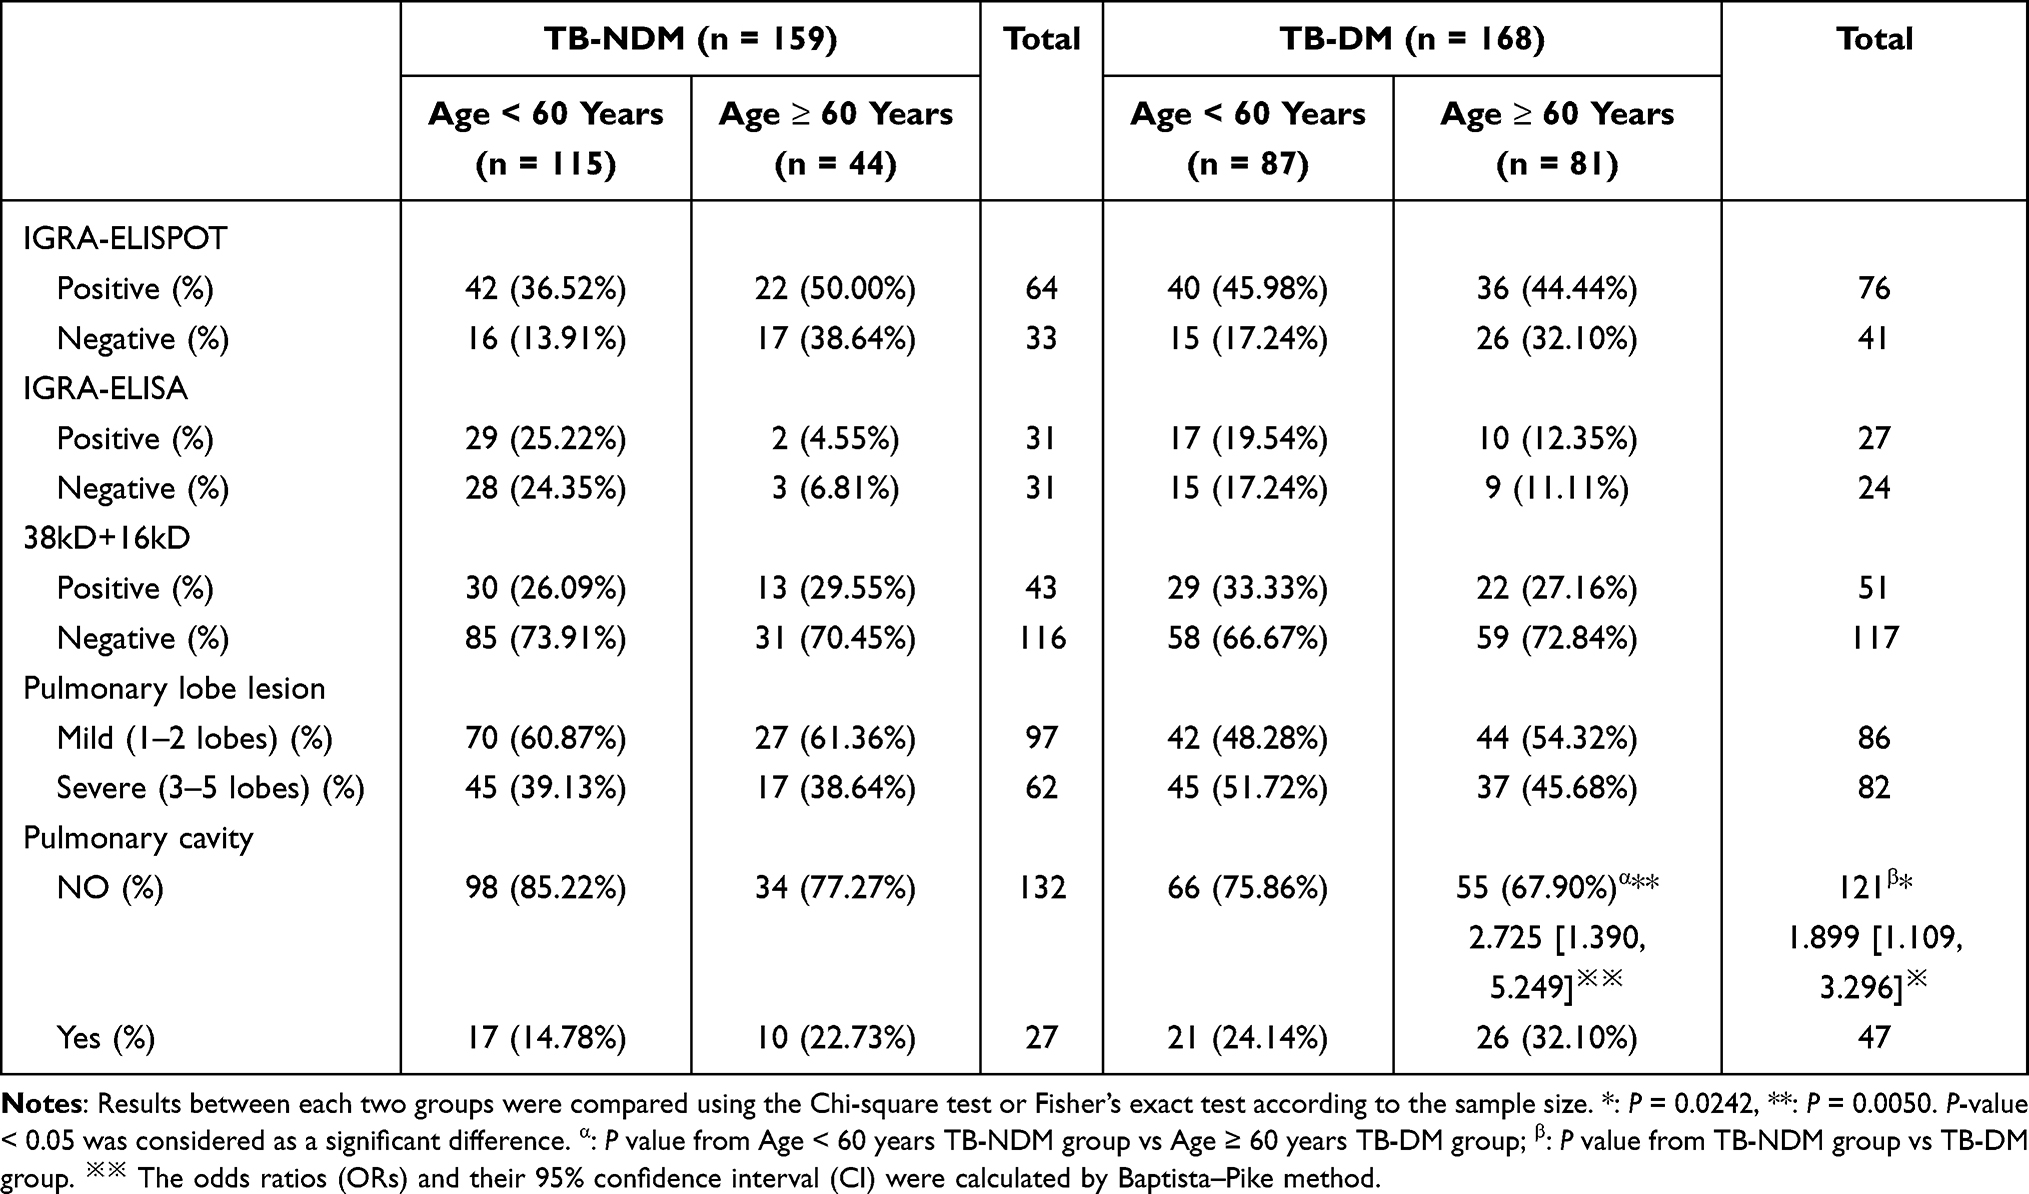 |
Table 2 The Association Between Age and Immunological Responses & Pulmonary Lesions in TB Patients with or without Diabetes Mellitus |
Comparison of the Hospital LOS and Immunological Responses & Pulmonary Lesions in Patients with TB with or without DM Treatment
Considering that hospital LOS has a particular impact on the immune status of patients with TB, we divided those with TB-NDM and TB-DM into two subgroups based on hospital LOS: LOS ≤ 2 weeks (n = 100 or n = 111) and LOS > 2 weeks (n = 59 or n = 57) (Table 3). In patients with TB-NDM, the degree of lung lobe lesions in the LOS > 2 weeks subgroup was significantly higher than that in the LOS ≤ 2 weeks subgroup (P = 0.0112, OR = 2.464, 95% CI [1.250, 4.699]). Furthermore, the number of pulmonary cavities in the LOS ≤ 2 weeks subgroup was significantly higher than that in patients with TB-NDM in the LOS ≤ 2 weeks subgroup (P = 0.0460, OR = 2.099, 95% CI [1.038, 4.151]). Moreover, we found that the number of pulmonary cavities in patients with TB-DM was significantly higher than that in patients with TB-NDM (P = 0.0089, OR = 5.038, 95% CI [2.976, 4.415]). These results indicate that the degree of pulmonary lobe lesions in patients with TB-NDM with LOS > 2 weeks was 2.464 times higher than that in patients with TB-NDM with LOS ≤ 2 weeks, and the probability of lung cavity formation in patients with TB-DM with LOS ≤ 2 weeks was 2.099 times higher than that in those with TB-DM with LOS ≤ 2 weeks, suggesting that extended hospital LOS greatly aggravated pathological lung damage in patients with TB. In addition, it was revealed that results of ELISPOT, ELISA, and 38kD+16kD specific antibodies had no differences between subgroups or TB-NDM and TB-DM groups.
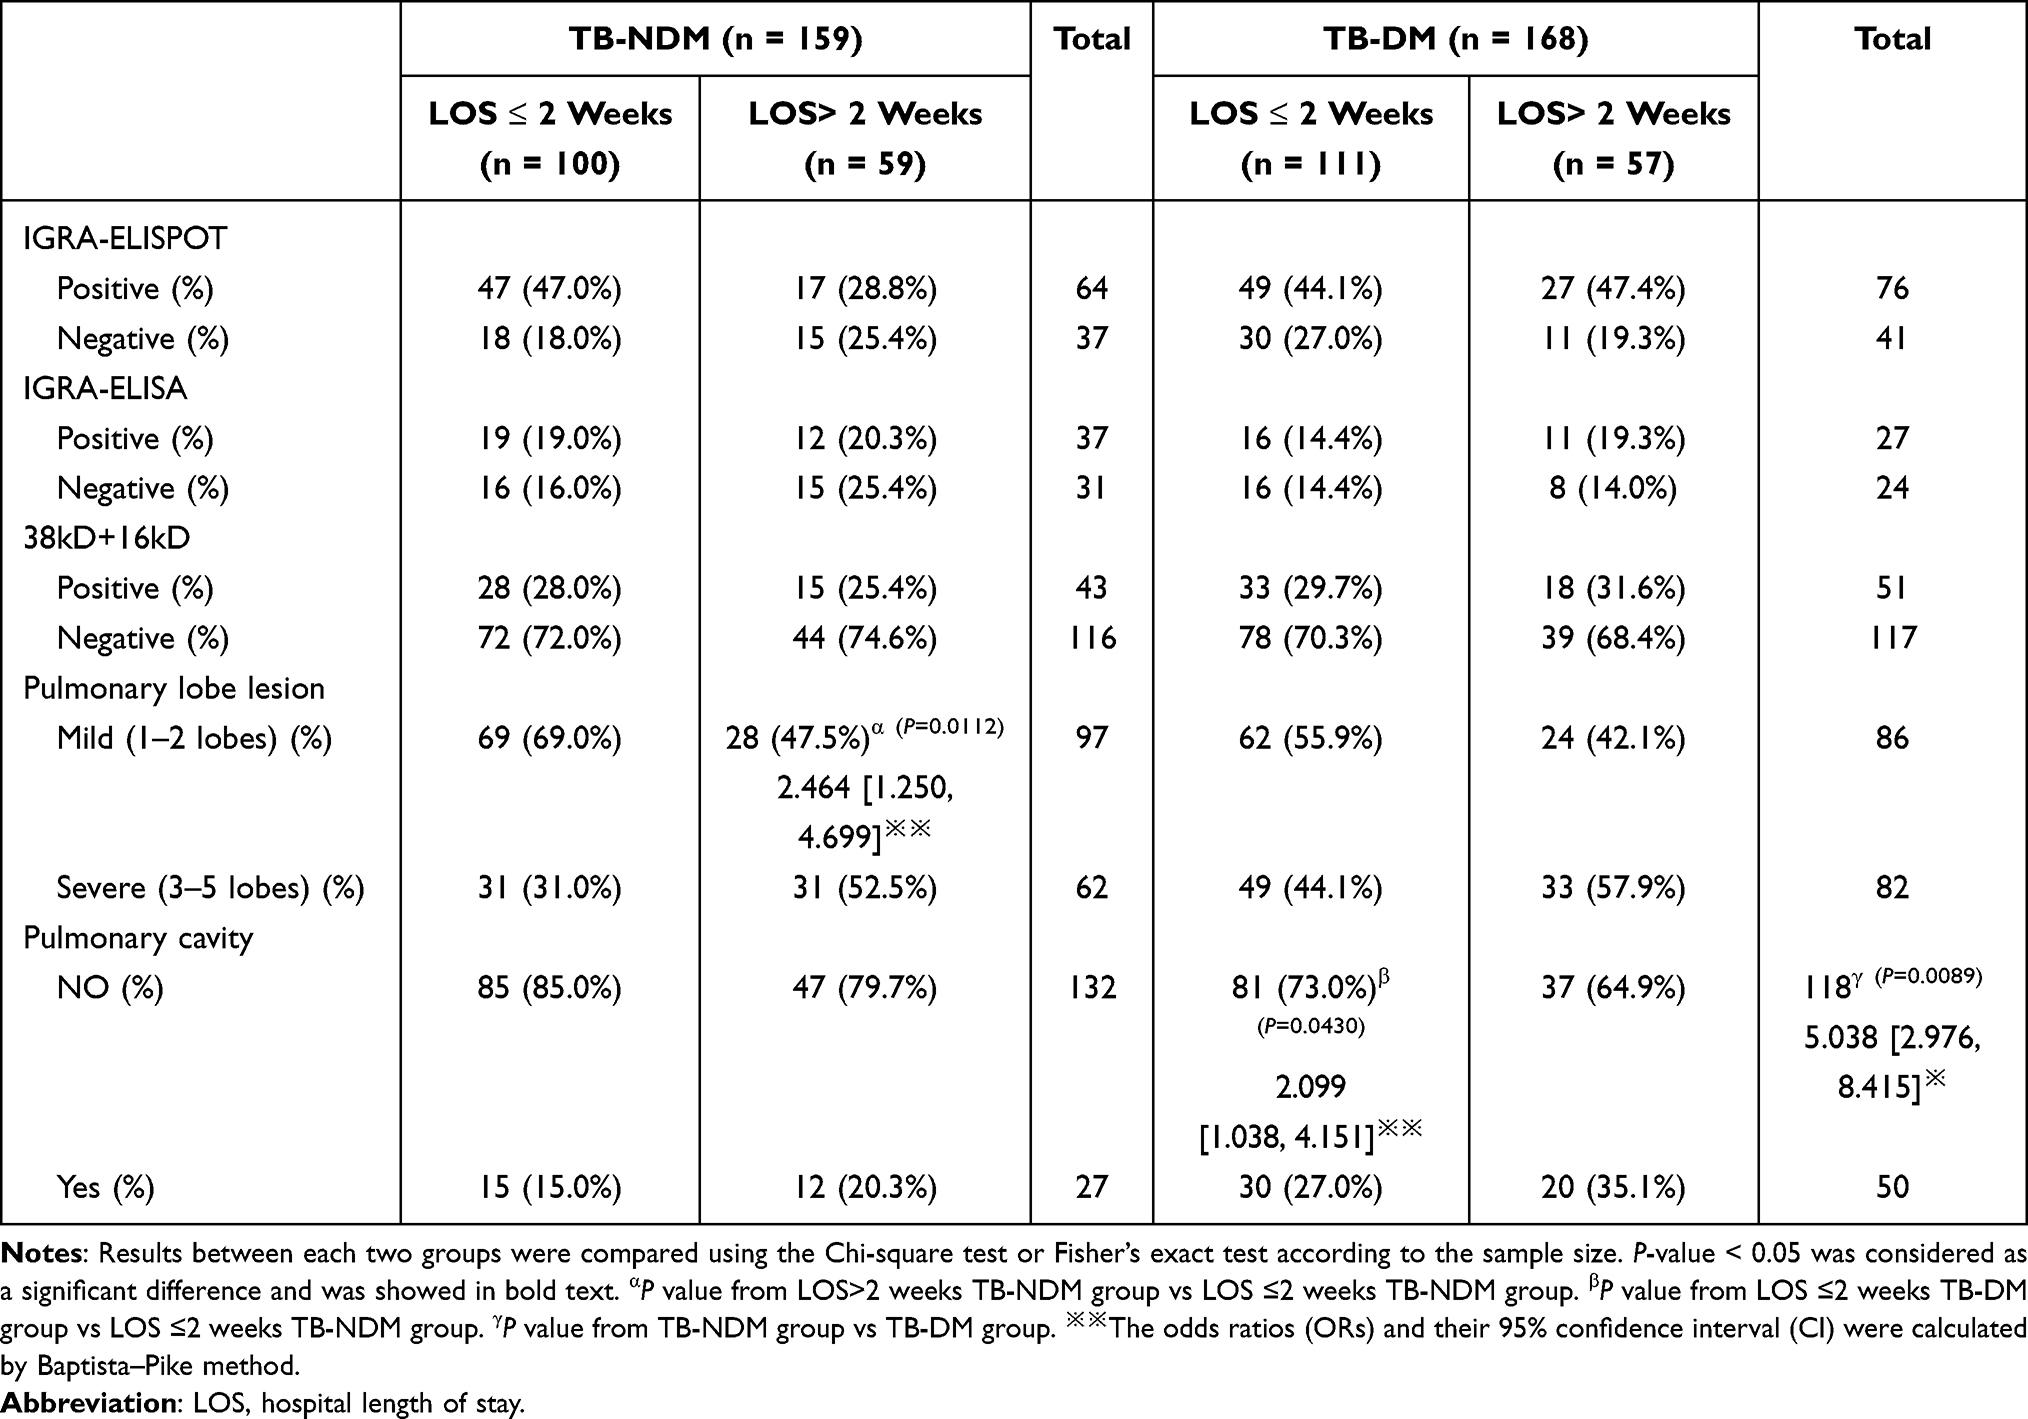 |
Table 3 The Association Between Hospital Length of Stay (LOS) and Immunological Responses & Pulmonary Lesions in TB Patients with or without DM |
Comparison of the FBG and Immunological Responses & Pulmonary Lesions in Patients with TB with or without DM
All patients with TB were divided into three subgroups based on DM and FBG levels (Table 4): TB-NDM (n = 159), TB-DM euglycemia (n = 68), and TB-DM hyperglycemia (n = 100). We confirmed the relationship between FBG, ELISPOT, ELISA, 38kD+16kD specific antibodies, and pulmonary lesions between patients with TB-NDM and TB-DM. Our results revealed that the degree of lung lobe lesions in the TB-DM hyperglycemia subgroup was observably higher than that in the TB-NDM group (P = 0.0401, OR = 1.695, 95% CI [1.032, 2.809]), and the number of pulmonary cavities in the TB-DM hyperglycemia subgroup was markedly higher than that in the patients with TB-NDM (P = 0.0010, OR = 2.750, 95% CI [1.565, 4.978]) or TB-DM euglycemia subgroup (P = 0.0392, OR = 2.107, 95% CI [1.092, 4.581]). These data suggest that even in patients with comorbidities of TB and DM, if the FBG level is controlled within the normal range, the pathological lesions in the lungs of the patient will not worsen. In contrast, patients with TB-DM with hyperglycemia are 1.695 times more likely to have pulmonary lobe lesions than those with TB-NDM. The probability of lung cavitation is 2.75 times or 2.17 times that in patients with TB-NDM TB-DM with euglycemia.
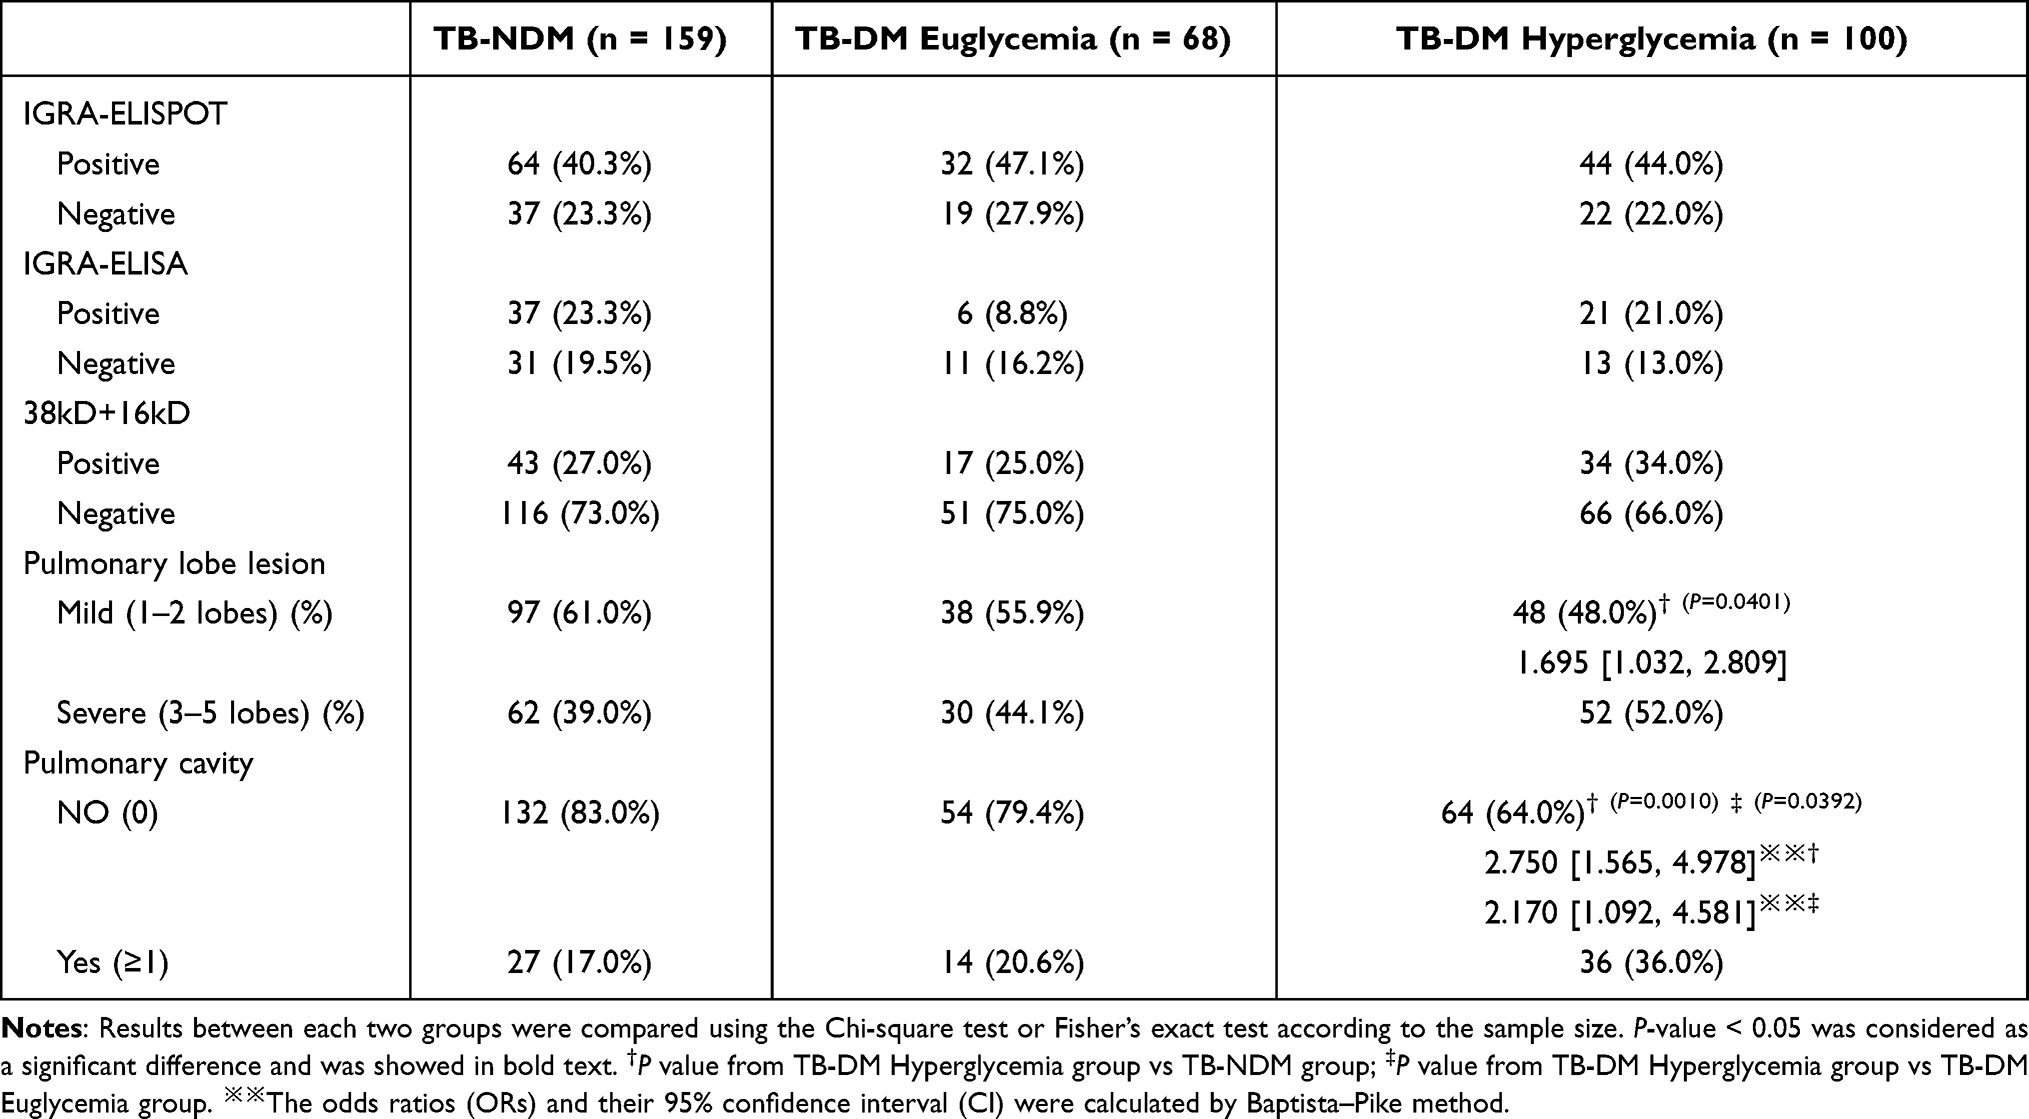 |
Table 4 The Association Between Blood Glucose Levels and Immunological Responses & Pulmonary Lesions in TB Patients with or without Diabetes Mellitus |
The Impact of Different Measurements on the Patients with TB-DM
The impact of different measurements on patients with TB-DM (n = 168), including age, sex, FBG, absolute counts of total T lymphocytes, CD4+ T lymphocytes, CD8+ T lymphocytes, NK cells, NKT cells, and B lymphocytes, were evaluated using PCA (Figure 1). Two potential PCs (PC1eigenvalue = 3.661 and PC2eigenvalue = 1.301) were selected according to the eigenvalue > 1, and their cumulative variance accounted for 62.02% (PC1 45.786%, PC2 16.26%). The loading plot depicts the correlation between the eight measurements. The results showed that age and FBG levels were associated with PC2. The rest six measurements (absolute counts of total T lymphocytes, CD4+ T lymphocytes, CD8+ T lymphocytes, NK cells, NKT cells, and B lymphocytes) were associated with PC1 (Figure 1A). The PC score plot showed that the data from 168 patients with TB-DM were significant (Figure 1B). Furthermore, a biplot was used to show both the loading and PC scores (Figure 1C).
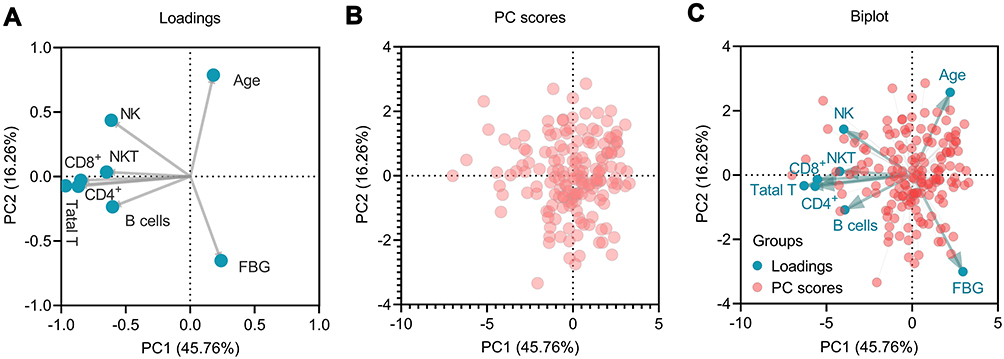 |
Figure 1 Principal component analysis (PCA). The loading plot depicted the correlation of eight measurements and showed that age and FBG were associated with PC2, and the rest six measures were associated with PC1 (A). The PC scores plot showed that the data from 168 TB-DM patients were significant (B). Finally, a biplot was used to show both the loadings and PC scores (C). NK, NK cells; NKT, NKT cells; Total T, Total T lymphocytes; CD4+, CD4+ T lymphocytes; CD8+, CD8+ T lymphocytes. |
The Impact of Diabetes on TB Innate Immunity and Adaptive Immunity
Comparison of the FBG and Absolute Counts of Lymphocyte Subsets in Patients with TB-NDM and TB-DM
As shown in Figure 2, the absolute counts of total T lymphocytes (P = 0.0315), CD8+ T lymphocytes (P = 0.0222), and B lymphocytes (P = 0.0425) were distinctly higher in patients with TB-NDM than in those with TB-DM. Additionally, the absolute counts of CD4+ T lymphocytes, NK cells, and NKT cells were not significantly different between the patients with TB-NDM and TB-DM. Interestingly, compared with patients with TB-NDM, a declining trend in the absolute counts of CD4+ T lymphocytes, NK cells, and NKT cells was observed in patients with TB-DM. These results indicate that the complication of DM in patients with TB significantly affects the immune system, resulting in a decrease in the number of these six immune cells.
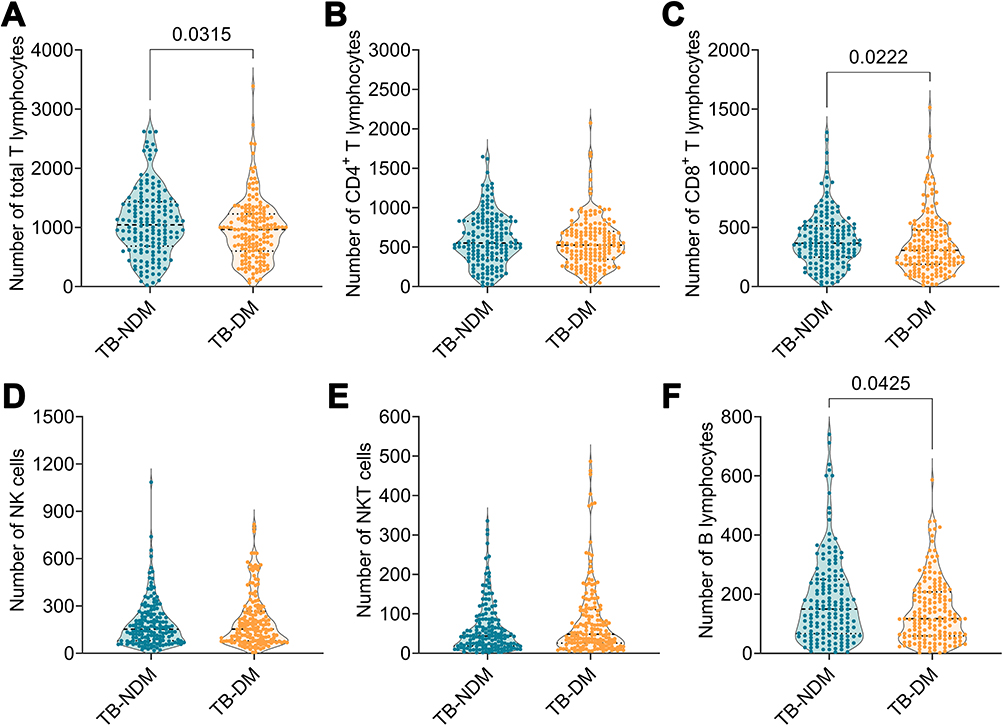 |
Figure 2 The comparison of lymphocyte subsets between TB-NDM and TB-DM patients. The absolute counts of total T lymphocytes (A), CD4+ T lymphocytes (B), CD8+ T lymphocytes (C), NK cells (D), NKT cells (E), and B lymphocytes (F) between TB-NDM and TB DM patients were analyzed with Unpaired t-test or nonparametric test (Mann Whitney test) according to the normality. The data was shown as mean ± SD, and P value < 0.05 was considered a significant difference. |
Comparison of the FBG and Absolute Counts of Lymphocyte Subsets in Patients with TB-NDM and Subgroups of Those with TB-DM
To further explore the relationship between absolute counts of lymphocyte subsets and FBG levels, patients with TB-DM were divided into two subgroups: TB-DM euglycemia (n = 68) and TB-DM hyperglycemia (n = 100). Although the absolute counts of total T lymphocytes (P = 0.0193) and CD8 + T lymphocytes (P = 0.0139) in patients with TB-DM with hyperglycemia were lower than those in patients with TB-DM, the absolute count of NK cells in patients with TB-DM with euglycemia was higher than that in patients with TB-DM (P = 0.0092) and TB-DM with hyperglycemia (P = 0.0003) (Figure 3). In addition, the absolute counts of CD4+ T lymphocytes, NKT cells, and B lymphocytes were not significantly different among the three groups. It is worth noting that, compared with patients with TB-DM with euglycemia, a decline in the absolute counts of all lymphocyte subsets was observed in patients with TB-DM with hyperglycemia, indicating that the higher level of blood glucose in patients with TB-DM resulted in a decrease in the number of these lymphocyte subsets.
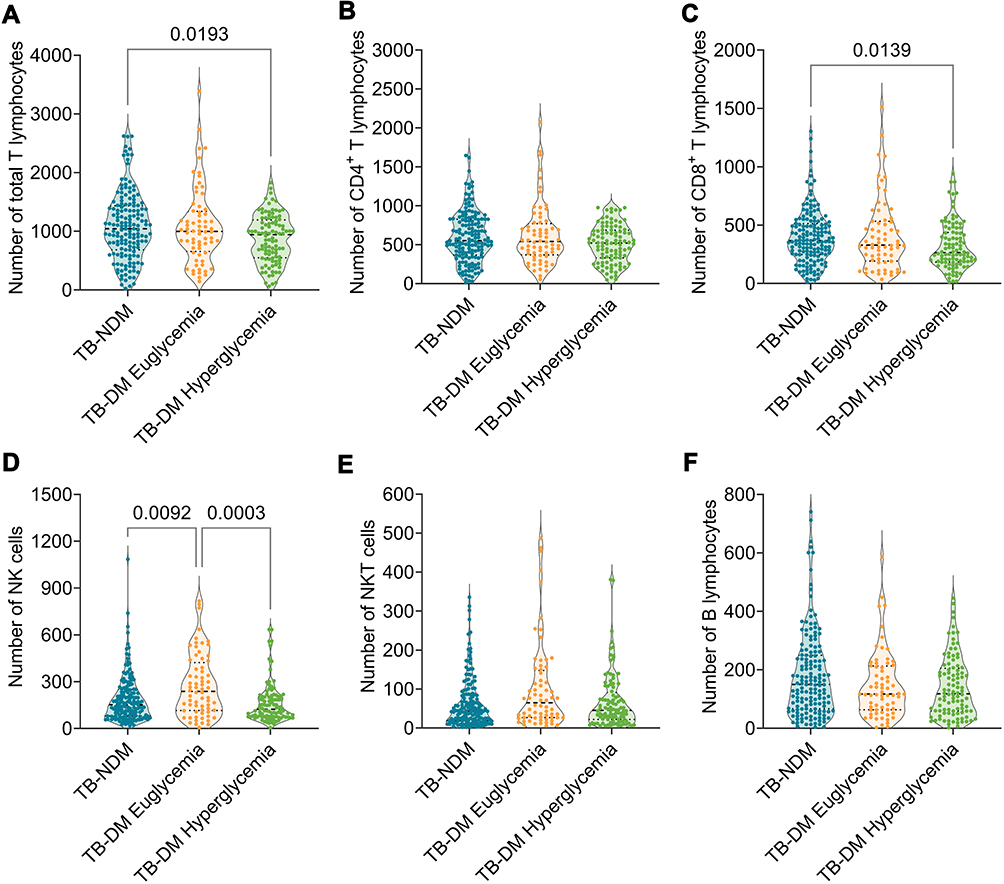 |
Figure 3 The comparison of lymphocyte subsets among TB-NDM, TB-DM patients with euglycemia and TB-DM patients with hyperglycemia. The absolute counts of total T lymphocytes (A), CD4+ T lymphocytes (B), CD8+ T lymphocytes (C), NK cells (D), NKT cells (E), and B lymphocytes (F) among TB-NDM, TB-DM patients with euglycemia and TB-DM patients with hyperglycemia were compared with Ordinary one-way ANOVA test or Kruskal–Wallis nonparametric test according to the data normality and homogeneity of variances. The data were shown as mean ± SD, and P value < 0.05 was considered a significant difference. |
Comparison of the Hospital LOS and Absolute Counts of Lymphocyte Subsets in Patients with TB-NDM and TB-DM
The patients with TB-NDM and TB-DM were divided into six subgroups based on the hospital LOS and FBG levels: patients with TB-NDM with LOS ≤ 2 weeks (TB-NDM-L≤2, n = 100), patients with TB-NDM with LOS > 2 weeks (TB-NDM-L>2, n = 59), patients with TB-DM with euglycemia and LOS ≤ 2 weeks (TB-DME-L≤2, n = 44), patients with TB-DM with euglycemia and LOS > 2 weeks (TB-DME-L>2, n = 24), patients with TB-DM with hyperglycemia and LOS ≤ 2 weeks (TB-DMH-L≤2, n = 67), and patients with TB-DM with hyperglycemia and LOS > 2 weeks (TB-DMH-L>2, n = 33). As shown in Figure 4, the absolute counts of NK cells in the TB-DME-L≤2 subgroup were significantly higher than those in the TB-NDM-L≤2 subgroup (P = 0.0374), TB-DMH-L≤2 subgroup (P = 0.0055), TB-NDM-L>2 subgroup (P = 0.0027), and TB-DMH-L >2 subgroup (P = 0.0001). Furthermore, although the absolute counts of total T lymphocytes, CD4+ T lymphocytes, CD8+ T lymphocytes, NKT cells, and B lymphocytes were not significantly different among the remaining five subgroups, a declining trend was observed in the TB-DMH-L > 2 subgroup compared to patients with TB-NDM. These results indicate that higher FBG levels and longer LOS may be risk factors for TB-DM. The potential mechanism may involve the downregulation of innate and adaptive immune responses.
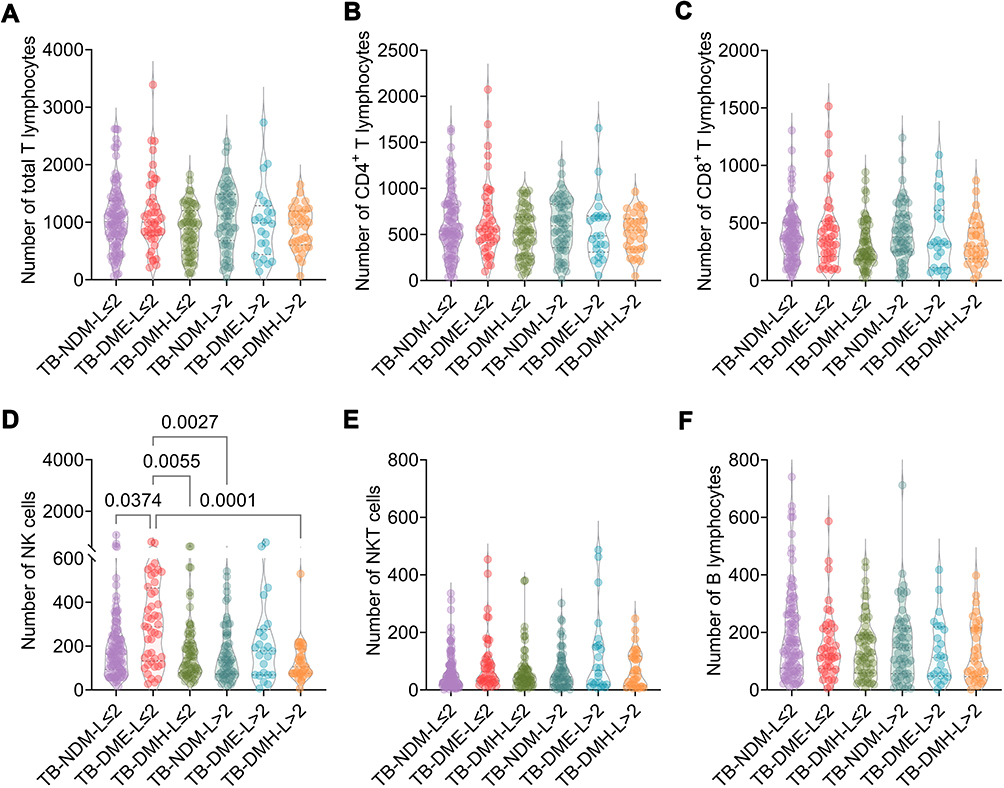 |
Figure 4 The comparison of the hospital LOS and absolute counts of lymphocyte subsets in TB-NDM patients and TB-DM patients. The absolute counts of total T lymphocytes (A), CD4+ T lymphocytes (B), CD8+ T lymphocytes (C), NK cells (D), NKT cells (E), and B lymphocytes (F) among TB-NDM with hospital LOS ≤ 2 weeks (TB-NDM-L≤2), TB-NDM with hospital LOS > 2 weeks (TB-NDM-L>2), TB-DM with euglycemia and hospital LOS ≤ 2 weeks (TB-DME-L≤2), TB-DM with euglycemia and hospital LOS > 2 weeks (TB-DME-L>2), TB-DM with hyperglycemia and hospital LOS ≤ 2 weeks (TB-DMH-L≤2), and TB-DM with hyperglycemia and hospital LOS > 2 weeks (TB-DMH-L>2) were compared with Ordinary one-way ANOVA test or Kruskal–Wallis nonparametric test according to the data normality and homogeneity of variances. The data were shown as mean ± SD, and P value < 0.05 was considered a significant difference. |
Linear Regression Analysis Between FBG and Absolute Counts of Lymphocytes in Patients with TB-DM
All the above data point to the conclusion that FBG Significantly influence the immune response of patients with TB-DM. Hence, we performed a linear regression analysis to determine the relationship between FBG levels and absolute lymphocyte counts in patients with TB-DM (Figure 5). The regression equations indicated that the absolute counts of total T lymphocytes (P = 0.0253, R2 = 0.02997, Y = −20.25*X + 1180), CD8+ T lymphocytes (P = 0.0263, R2 = 0.02958, Y = −9.607*X + 458.5), and NK cells (P = 0.0015, R2 = 0.05925, Y = −9.306*X + 307.3) in patients with TB-DM significantly decreased with increasing FBG levels. Similarly, the results showed no significant linear relationship between the absolute counts of CD4+ T lymphocytes, NKT cells, and FBG levels in patients with TB-DM. However, we observed that the absolute counts of CD4+ T lymphocytes and NKT cells in Patients with TB-DM showed a decreasing trend with increasing FBG levels. Furthermore, the absolute counts of B cells did not change with an increase in FBG levels.
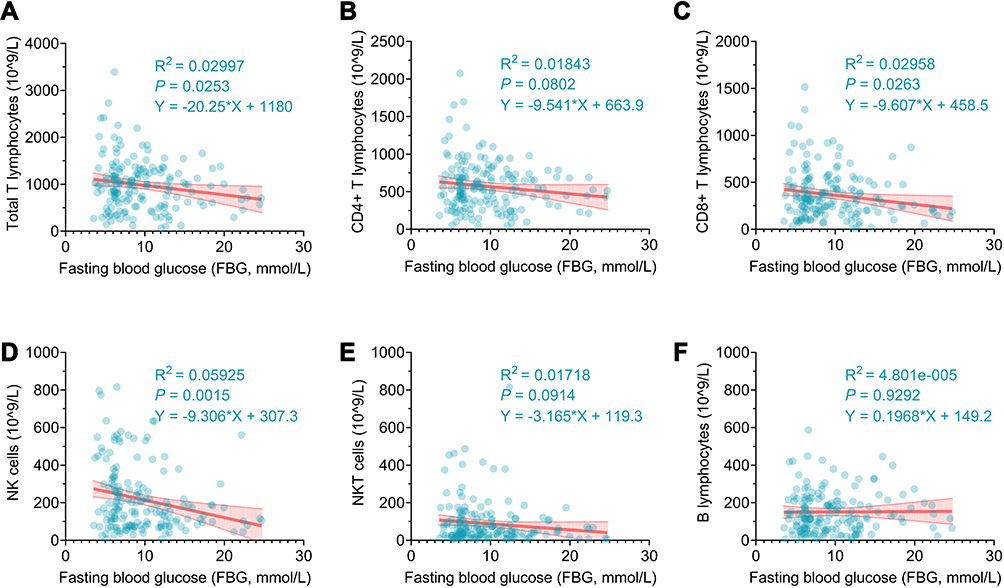 |
Figure 5 Linear regression analysis of the relationship between FBG level and absolute counts of lymphocyte subsets in TB-DM patients. The potential association between the FBG level and the absolute counts of total T lymphocytes (A), CD4+ T lymphocytes (B), CD8+ T lymphocytes (C), NK cells (D), NKT cells (E), or B lymphocytes (F) in TB-DM patients was analyzed with simple linear regression. P-value < 0.05 was considered as a significant linear relationship. |
Discussion
In recent years, patients with TB and DM have shown a significant upward trend, especially in countries where TB is endemic. The most striking feature of DM is the disorder of glucose metabolism, which may affect the innate and adaptive immune systems, resulting in impaired response functions of innate and adaptive immune T cells and differentiation of T cell subsets.29 Our previous studies have found that TB is not only an infectious disease but also an immune disease. The imbalance between Mycobacterium tuberculosis invasiveness and host immunity is key to the progression of latent tuberculosis infection (LTBI) into active TB.3,4,26,30,31 Recently, a meta-analysis based on 14 studies involving 22, 616, and 623 participants showed that DM in patients with TB is a significantly increased risk factor that can be reduced by improving glycemic control.32
Immunological impairment plays an essential role in the susceptibility of patients with DM to TB infection.33 In this study, we compared the immune responses of individuals with TB-NDM and those with TB-DM. The probability of lung cavity formation in elderly patients with TB-DM was 2.725 times higher than that in young patients with TB-NDM, and 1.899 times higher in patients with TB-DM than in those with TB-NDM. These results suggest that older age and DM are possible risk factors for cavity formation in patients with TB. Previous studies have indicated that the comorbidity of TB and DM is conducive to the formation of TB cavities and the occurrence of multidrug resistance (MDR).34,35 Furthermore, weak host immunity causes cavity formation in the lungs of patients with TB compared to the decisive invasion of M. tuberculosis.3,36 This has been suggested to be associated with the predominant presence of Th2 lymphocyte subsets in alveoli.37 We also found that hospital LOS >2 weeks might be a risk factor for cavity formation in patients with TB-NDM and TB-DM. This is not surprising; although the immune cell functions of patients with TB-DM and TB-NDM recovered to a certain extent after a period of anti-tuberculosis drug treatment, the growth of hospital LOS exhausts many innate and adaptive immune cells, inhibiting phagocytosis and clearance of M. tuberculosis, leading to patients with TB having more severe pathological lung damage.38
To determine the potential effects of DM on lymphocyte subsets in patients with TB, we analyzed the absolute counts of total T lymphocytes, CD4+ and CD8+ T lymphocytes, and B lymphocytes by flow cytometry. We found that the absolute counts of total T lymphocytes, CD4+ T lymphocytes, and CD8+T lymphocytes in patients with TB-DM with hyperglycemia were lower than those in patients with TB-DM with euglycemia, suggesting that poor glycemic control in patients with TB-DM changes the immunophenotype of lymphocyte subsets, which manifests as a decrease in the number of CD4+ T lymphocytes and CD8+ T lymphocytes as well as a deficiency in immune response function.39 Furthermore, our results showed that the absolute count of CD8+ T lymphocytes in patients with TB-DM with euglycemia was lower than that in patients with TB-NDM, indicating that after hypoglycemic treatment, the differentiation of CD8+ T lymphocytes and expression of pro-inflammatory factors were inhibited, which would alleviate their mediated immune damage.40
It has been reported that CD4+ and CD8+ T lymphocytes play essential roles in the fight against M. tuberculosis infection.4,8,26,41 A recent study found that compared with patients with TB-NDM, those with TB-DM are characterized by increased frequencies of central memory CD4+ and CD8+ T lymphocytes and depressed frequencies of effector CD4+ and CD8+ T lymphocytes,16 which is consistent with our results. In contrast, other studies have revealed that patients with TB-DM are characterized by increased CD4+ Th1 and Th17 lymphocytes.42 The heterogeneity of these results may be due to several factors, such as differences in genetic background, age, disease course, and anti-TB treatment strategy. These results suggest that the differentiation and proliferation of CD4+ T lymphocytes and CD8+ lymphocytes in patients with TB-DM are inhibited.19,43 Compared to patients with TB-NDM, those with TB-DM are dominated by central memory CD4+ and CD8+ T lymphocytes, indicating that DM changes the distribution frequency of T lymphocyte subsets in patients with TB.16 Anti-TB therapy restores the functions of CD4+ and CD8+ T lymphocytes, weakens the inhibition of T lymphocyte subsets by high blood glucose levels, and re-establishes anti-inflammatory balance.44
In addition, DM affects NKT lymphocyte function. In this study, the absolute count of NKT cells in patients with TB-DM was significantly higher than in patients with TB-NDM. In comparison, the absolute count of NKT cells in patients with TB-DM with poor glycemic control was significantly lower than that in those with normal glycemic control. This result is consistent with that of Zhang et al.45 The potential reason for this may be that patients with TB-DM have higher mycobacterial loads and more severe pathological damage than patients with TB-NDM. In addition, NKT cells can kill or clear intracellular M. tuberculosis by upregulating IFN-γ and granulysin expression. However, the differentiation and proliferation of NKT cells is inhibited if hyperglycemia persists in patients with TB-DM.
DM affects adaptive immune cells and changes the functions of innate immune cells such as neutrophils, macrophages, and NK cells.33 NK cells enhance T cell-mediated protective immunity (CMI) by activating relevant receptors to promote the expression of the pro-inflammatory factor IL-6.46 The function of NK cells may be impaired by hyperglycemia,33 which is consistent with our findings. We found that the absolute NK cell count of patients with TB-DM with poor glycemic control was significantly lower than that of those with normal glycemic control. We also observed that the absolute count of NK cells was synchronized with that of NKT cells, suggesting that NK cell activation depends on NKT cells.47
From what has been discussed above, it is not difficult to find that the absolute counts of total T lymphocytes, CD4+T lymphocytes, CD8+T lymphocytes, NK cells, NKT cells, and the number of spots in IGRA ELISOPT in patients with TB-DM showed a decreasing trend with the increase in blood glucose level. These results indicate that with the increase in blood glucose levels, the inhibition of the anti-TB immune response of the host is enhanced, resulting in a continuous decrease in the activity of various immune cells.48 However, the absolute count of B lymphocytes did not change significantly with the increase in blood glucose level, indicating that the rise in blood glucose level in patients with TB-DM biased the differentiation direction of lymphocyte subsets towards memory B cells.15 In addition, the apoptosis of B lymphocytes is inhibited by high blood glucose levels.49
This study had several limitations. First, ELISA and ELISPOT were shown as qualitative rather than quantitative data, which may reduce the effect of blood glucose levels on IFN-γ secretion in patients with TB with or without DM. Second, the HOS data of each patient were not available, and this study could not track the dynamic changes in the immunological characteristics of patients with TB-DM in response to antituberculosis and hypoglycemic therapy. Third, due to data limitations, this study only analyzed the differences in absolute counts of lymphocyte subsets between TB-NDM and patients with TB-DM but did not analyze the differences in Th1, Th2, and Th17 cytokines between patients with TB-NDM and TB-DM.
Conclusions
In summary, this cross-sectional study retrospectively evaluated the impact of DM on the immunity of 327 patients with TB. Our results showed that extended hospital LOS and hyperglycemia are possible risk factors for pulmonary cavity formation and lobe lesions in patients with TB with DM; however, this unfavorable situation can be reversed by effectively controlling blood glucose levels. Furthermore, we explored the effect of FBG levels on lymphocyte subsets in patients with TB-DM and TB-NDM. Compared to patients with TB-NDM, those with TB-DM showed a significantly lower absolute count of total T lymphocytes, CD8+ T lymphocytes, and B lymphocytes. However, patients with TB-DM with hyperglycemia showed an observably lower absolute count of total T lymphocytes and CD8+ T lymphocytes. Furthermore, linear regression analysis suggested that the absolute counts of total T lymphocytes, CD8+ T lymphocytes, and NK cells in patients with TB-DM significantly decreased with an increase in FBG levels. Interestingly, although our results showed no significant differences in the absolute counts of CD4+ T lymphocytes, NK cells, and NKT cells between patients with TB-DM and TB-NDM, there was a trend of decline as FBG levels increased. These data suggest that although many factors can influence the immune response function of patients with TB, such as genetic background, age, disease course, and differences in anti-tuberculosis treatment strategies, DM is a very important risk factor for patients with TB, and the potential mechanism may involve downregulation of innate and adaptive immune responses.
Institutional Review Board Statement
The study was conducted according to the guidelines of the Declaration of Helsinki, and approved by the Ethics Committee of the Eighth Medical Center of PLA General Hospital (Approval number: 309202109061503).
Data Sharing Statement
All the data from this study have been included in the manuscript.
Informed Consent Statement
Informed consent was obtained from all subjects involved in the study. Written informed consent has been obtained from the patients to publish this paper.
Acknowledgments
We thank the staff in the Department of Tuberculosis of the Eighth Medical Center of the PLA General Hospital for providing blood samples.
Author Contributions
All authors made a significant contribution to the work reported, whether that is in the conception, study design, execution, acquisition of data, analysis and interpretation, or in all these areas; took part in drafting, revising or critically reviewing the article; gave final approval of the version to be published; have agreed on the journal to which the article has been submitted; and agree to be accountable for all aspects of the work.
Funding
This research received no external funding.
Disclosure
The authors declare no conflicts of interest in this work.
References
1. Locutura J. [English in Enfermedades Infecciosas y Microbiologia Clinica]. El ingles en Enfermedades Infecciosas y Microbiologia Clinica. Enferm Infecc Microbiol Clin. 2002;20(7):368. doi:10.1016/s0213-005x(02)72817-6
2. World Health Organization. Global tuberculosis report 2021. Genevapp: World Health Organization; 2021.
3. Gong W, Wu X. Differential diagnosis of latent tuberculosis infection and active tuberculosis: a key to a successful tuberculosis control strategy. Front Microbiol. 2021;12(3126). doi:10.3389/fmicb.2021.745592
4. Gong W, Liang Y, Mi J, et al. Peptides-based vaccine MP3RT induced protective immunity against Mycobacterium tuberculosis infection in a humanized mouse model. Front Immunol. 2021;12(1393):666290. doi:10.3389/fimmu.2021.666290
5. Aspatwar A, Gong W, Wang S, Wu X, Parkkila S. Tuberculosis vaccine BCG: the magical effect of the old vaccine in the fight against the COVID-19 pandemic. Int Rev Immunol. 2021:1–14. doi:10.1080/08830185.2021.1922685
6. Ayelign B, Negash M, Genetu M, Wondmagegn T, Shibabaw T. Immunological impacts of diabetes on the susceptibility of Mycobacterium tuberculosis. J Immunol Res. 2019;2019:6196532. doi:10.1155/2019/6196532
7. Zheng Y, Ley SH, Hu FB. Global aetiology and epidemiology of type 2 diabetes mellitus and its complications. Nat Rev Endocrinol. 2018;14(2):88–98. doi:10.1038/nrendo.2017.151
8. Kumar Nathella P, Babu S. Influence of diabetes mellitus on immunity to human tuberculosis. Immunology. 2017;152(1):13–24. doi:10.1111/imm.12762
9. Calvet HM, Yoshikawa TT. Infections in diabetes. Infect Dis Clin North Am. 2001;15(2):407–421. doi:10.1016/s0891-5520(05)70153-7
10. Lopez-Lopez N, Martinez AGR, Garcia-Hernandez MH, et al. Type-2 diabetes alters the basal phenotype of human macrophages and diminishes their capacity to respond, internalise, and control Mycobacterium tuberculosis. Mem Inst Oswaldo Cruz. 2018;113(4):e170326. doi:10.1590/0074-02760170326
11. Vance J, Santos A, Sadofsky L, Morice A, Cervantes J. Effect of high glucose on human alveolar macrophage phenotype and phagocytosis of mycobacteria. Lung. 2019;197(1):89–94. doi:10.1007/s00408-018-0181-z
12. Kumar NP, Moideen K, Sivakumar S, et al. Modulation of dendritic cell and monocyte subsets in tuberculosis-diabetes co-morbidity upon standard tuberculosis treatment. Tuberculosis. 2016;101:191–200. doi:10.1016/j.tube.2016.10.004
13. Kumar NP, Sridhar R, Nair D, Banurekha VV, Nutman TB, Babu S. Type 2 diabetes mellitus is associated with altered CD8(+) T and natural killer cell function in pulmonary tuberculosis. Immunology. 2015;144(4):677–686. doi:10.1111/imm.12421
14. Boillat-Blanco N, Tumbo AN, Perreau M, et al. Hyperglycaemia is inversely correlated with live M. bovis BCG-specific CD4(+) T cell responses in Tanzanian adults with latent or active tuberculosis. Immun Inflamm Dis. 2018;6(2):345–353. doi:10.1002/iid3.222
15. Kumar NP, Moideen K, Dhakshinraj SD, et al. Profiling leucocyte subsets in tuberculosis-diabetes co-morbidity. Immunology. 2015;146(2):243–250. doi:10.1111/imm.12496
16. Kumar NP, Moideen K, Viswanathan V, Kornfeld H, Babu S. Effect of standard tuberculosis treatment on naive, memory and regulatory T-cell homeostasis in tuberculosis-diabetes co-morbidity. Immunology. 2016;149(1):87–97. doi:10.1111/imm.12632
17. Magee MJ, Trost SL, Salindri AD, Amere G, Day CL, Gandhi NR. Adults with Mycobacterium tuberculosis infection and pre-diabetes have increased levels of QuantiFERON interferon-gamma responses. Tuberculosis. 2020;122:101935. doi:10.1016/j.tube.2020.101935
18. Stalenhoef JE, Alisjahbana B, Nelwan EJ, et al. The role of interferon-gamma in the increased tuberculosis risk in type 2 diabetes mellitus. Eur J Clin Microbiol Infect Dis. 2008;27(2):97–103. doi:10.1007/s10096-007-0395-0
19. Ponnana M, Pydi S, Gaddam S. Enumeration of lymphocyte subsets during follow-up in the pulmonary tuberculosis patients with co morbid diabetes mellitus. Clin Chim Acta. 2020;510:566–572. doi:10.1016/j.cca.2020.08.026
20. Eckold C, Kumar V, Weiner J, et al. Impact of intermediate hyperglycemia and diabetes on immune dysfunction in tuberculosis. Clin Infect Dis. 2021;72(1):69–78. doi:10.1093/cid/ciaa751
21. van Crevel R, Critchley JA. The interaction of diabetes and tuberculosis: translating research to policy and practice. Trop Med Infect Dis. 2021;6(1). doi:10.3390/tropicalmed6010008
22. NHFPC. Diagnosis for pulmonary tuberculosis (WS 288-2017). Electron J Emerg Infect Dis. 2018;3(01):59–61.
23. NHFPC. Classification of Tuberculosis (WS 196-2017). Chin J Infect Control. 2018;17(4):367–368.
24. Puavilai G, Chanprasertyotin S, Sriphrapradaeng A. Diagnostic criteria for diabetes mellitus and other categories of glucose intolerance: 1997 criteria by the expert committee on the diagnosis and classification of Diabetes Mellitus (ADA), 1998 WHO consultation criteria, and 1985 WHO criteria. World Health Organization. Diabetes Res Clin Pract. 1999;44(1):21–26. doi:10.1016/s0168-8227(99)00008-x
25. World Health Organization. Use of glycated haemoglobin (HbA1c) in the diagnosis of diabetes mellitus: abbreviated report of a WHO consultation. WHO Guidelines Approved by the Guidelines Review Committee; 2011.
26. Gong W, Liang Y, Mi J, et al. A peptide-based vaccine ACP derived from antigens of Mycobacterium tuberculosis induced Th1 response but failed to enhance the protective efficacy of BCG in mice. Indian J Tuberc. 2021. doi:10.1016/j.ijtb.2021.08.016
27. Chow SC, Shao J, Wang H. Sample Size Calculations in Clinical Research.
28. Buasroung P, Petnak T, Liwtanakitpipat P, Kiertiburanakul S. Prevalence of diabetes mellitus in patients with tuberculosis: a prospective cohort study. Int J Infect Dis. 2022;116:374–379. doi:10.1016/j.ijid.2022.01.047
29. Widjaja SS, Rusdiana SM. CD4 and its relevance to advanced glycation end products in tuberculosis patients with co-morbidity diabetes. Open Access Maced J Med Sci. 2018;6(11):2115–2118. doi:10.3889/oamjms.2018.347
30. Liang Y, Gong W, Wang X, et al. Chinese traditional medicine NiuBeiXiaoHe (NBXH) extracts have the function of antituberculosis and immune recovery in BALB/c mice. J Immunol Res. 2021;2021:6234560. doi:10.1155/2021/6234560
31. Gong W, Wu X. Is the tuberculosis vaccine BCG an alternative weapon for developing countries to defeat COVID-19? Indian J Tuberc. 2021;68(3):401–404. doi:10.1016/j.ijtb.2020.10.012
32. Hayashi S, Chandramohan D. Risk of active tuberculosis among people with diabetes mellitus: systematic review and meta-analysis. Trop Med Int Health. 2018;23(10):1058–1070. doi:10.1111/tmi.13133
33. Chumburidze-Areshidze N, Kezeli T, Avaliani Z, Mirziashvili M, Avaliani T, Gongadze N. The relationship between Type-2 diabetes and tuberculosis. Georgian Med News. 2020;300:69–74.
34. Cadena J, Rathinavelu S, Lopez-Alvarenga JC, Restrepo BI. The re-emerging association between tuberculosis and diabetes: lessons from past centuries. Tuberculosis. 2019;116S:S89–S97. doi:10.1016/j.tube.2019.04.015
35. Kim S-H, Shin YM, Yoo JY, et al. Clinical factors associated with cavitary tuberculosis and its treatment outcomes. J Pers Med. 2021;11(11):1081. doi:10.3390/jpm11111081
36. Flynn JL, Chan J. Immunology of tuberculosis. Annu Rev Immunol. 2001;19(1):93–129. doi:10.1146/annurev.immunol.19.1.93
37. Mazzarella G, Bianco A, Perna F, et al. T lymphocyte phenotypic profile in lung segments affected by cavitary and non-cavitary tuberculosis. Clin Exp Immunol. 2003;132(2):283–288. doi:10.1046/j.1365-2249.2003.02121.x
38. Kuruva P, Kandi SR, Kandi S. Clinico-radiological profile and treatment outcome of pulmonary tuberculosis with and without type 2 diabetes mellitus. Indian J Tuberc. 2021;68(2):249–254. doi:10.1016/j.ijtb.2020.09.020
39. Ronacher K, Joosten SA, van Crevel R, Dockrell HM, Walzl G, Ottenhoff TH. Acquired immunodeficiencies and tuberculosis: focus on HIV/AIDS and diabetes mellitus. Immunol Rev. 2015;264(1):121–137. doi:10.1111/imr.12257
40. Frenkel JDH, Ackart DF, Todd AK, et al. Metformin enhances protection in Guinea pigs chronically infected with Mycobacterium tuberculosis. Sci Rep. 2020;10(1):16257. doi:10.1038/s41598-020-73212-y
41. Gong W, Liang Y, Wu X. The current status, challenges, and future developments of new tuberculosis vaccines. Hum Vaccin Immunother. 2018;14(7):1697–1716. doi:10.1080/21645515.2018.1458806
42. Kumar NP, Sridhar R, Banurekha VV, Jawahar MS, Nutman TB, Babu S. Expansion of pathogen-specific T-helper 1 and T-helper 17 cells in pulmonary tuberculosis with coincident type 2 diabetes mellitus. J Infect Dis. 2013;208(5):739–748. doi:10.1093/infdis/jit241
43. Wang X, Ma A, Han X, et al. T cell profile was altered in pulmonary tuberculosis patients with Type 2 diabetes. Med Sci Monit. 2018;24:636–642. doi:10.12659/msm.905651
44. Mily A, Sarker P, Taznin I, et al. Slow radiological improvement and persistent low-grade inflammation after chemotherapy in tuberculosis patients with type 2 diabetes. BMC Infect Dis. 2020;20(1):933. doi:10.1186/s12879-020-05473-x
45. Zhang Q, Xiao HP, Cui HY, Sugawara I. Significant increase in natural-killer T cells in patients with tuberculosis complicated by type 2 diabetes mellitus. J Int Med Res. 2011;39(1):105–111. doi:10.1177/147323001103900113
46. Cheekatla SS, Tripathi D, Venkatasubramanian S, et al. NK-CD11c+ cell crosstalk in diabetes enhances IL-6-mediated inflammation during Mycobacterium tuberculosis infection. PLoS Pathog. 2016;12(10):e1005972. doi:10.1371/journal.ppat.1005972
47. Lee IF, van den Elzen P, Tan R, Priatel JJ. NKT cells are required for complete Freund’s adjuvant-mediated protection from autoimmune diabetes. J Immunol. 2011;187(6):2898–2904. doi:10.4049/jimmunol.1002551
48. Restrepo BI, Schlesinger LS. Impact of diabetes on the natural history of tuberculosis. Diabetes Res Clin Pract. 2014;106(2):191–199. doi:10.1016/j.diabres.2014.06.011
49. Nam HW, Cho YJ, Lim JA, et al. Functional status of immune cells in patients with long-lasting type 2 diabetes mellitus. Clin Exp Immunol. 2018;194(1):125–136. doi:10.1111/cei.13187
 © 2022 The Author(s). This work is published and licensed by Dove Medical Press Limited. The full terms of this license are available at https://www.dovepress.com/terms.php and incorporate the Creative Commons Attribution - Non Commercial (unported, v3.0) License.
By accessing the work you hereby accept the Terms. Non-commercial uses of the work are permitted without any further permission from Dove Medical Press Limited, provided the work is properly attributed. For permission for commercial use of this work, please see paragraphs 4.2 and 5 of our Terms.
© 2022 The Author(s). This work is published and licensed by Dove Medical Press Limited. The full terms of this license are available at https://www.dovepress.com/terms.php and incorporate the Creative Commons Attribution - Non Commercial (unported, v3.0) License.
By accessing the work you hereby accept the Terms. Non-commercial uses of the work are permitted without any further permission from Dove Medical Press Limited, provided the work is properly attributed. For permission for commercial use of this work, please see paragraphs 4.2 and 5 of our Terms.