Back to Journals » Nature and Science of Sleep » Volume 14
Impact of Desaturation Patterns versus Apnea–Hypopnea Index in the Development of Cardiovascular Comorbidities in Obstructive Sleep Apnea Patients
Authors Blekic N, Bold I, Mettay T, Bruyneel M ![]()
Received 14 May 2022
Accepted for publication 15 August 2022
Published 25 August 2022 Volume 2022:14 Pages 1457—1468
DOI https://doi.org/10.2147/NSS.S374572
Checked for plagiarism Yes
Review by Single anonymous peer review
Peer reviewer comments 4
Editor who approved publication: Prof. Dr. Ahmed BaHammam
Nathan Blekic,1 Ionela Bold,1 Thomas Mettay,2 Marie Bruyneel1,2
1Department of Pulmonary Medicine, Saint-Pierre University Hospital, Brussels, Belgium and Université Libre de Bruxelles, Brussels, Belgium; 2Department of Pulmonary Medicine, Brugmann University Hospital, Brussels, Belgium and Université Libre de Bruxelles, Brussels, Belgium
Correspondence: Marie Bruyneel, Department of Pulmonary Medicine, Saint-Pierre University Hospital, Rue Haute, 322, Brussels, 1000, Belgium, Tel +322 5354219, Fax: +322 5353362, Email [email protected]
Abstract: Various phenotypes of obstructive sleep apnea (OSA) have been recently described and are poorly assessed by the commonly used polysomnographic indices, such as the apnea–hypopnea index and oxygen desaturation index. Nocturnal hypoxemia is the hallmark of OSA and new quantitative markers, as hypoxic burden or desaturation severity, have been shown to be associated with cardiovascular (CV) mortality. The purpose of this overview is to review the endophenotypical and clinical characteristics of OSA, the current metrics, and to analyze different measurements of hypoxemia in OSA to predict the cardiovascular impact (eg hypoxic burden). Potential interest of multidimensional models to classify OSA, such as BAVENO classification, is also discussed, with the goal of focusing on specific endophenotypes that are likely to develop CV comorbidities, in order to guide clinicians to more aggressive management of OSA in these individuals.
Keywords: obstructive sleep apnea, oxygen desaturation index, hypoxic burden, apnea–hypopnea index, polysomnography, home sleep apnea testing
Introduction
Obstructive sleep apnea (OSA) syndrome is a common medical disorder, characterized by recurrent episodes of apnea or hypopnea due to total or partial pharyngeal collapse and temporary upper airway (UA) obstruction during sleep. The prevalence of OSA is increasing, due to obesity and aging, and currently affects about 30% of men and 13% of women in Europe.1 Intermittent hypoxia (IH), oxidative stress, systemic inflammation, sympathetic activation, respiratory efforts, and sleep fragmentation resulting from OSA can provoke subsequent cardiometabolic disorders, such that OSA is now recognized as an independent risk factor for hypertension (HT), arrhythmia (as atrial fibrillation), coronary heart disease (CHD), and stroke.2–6 In addition, metabolic disorders (eg, diabetes mellitus (DM), disorders of lipid metabolism) are also associated with OSA.7,8 Continuous positive airway pressure (CPAP) treatment remains the cornerstone of OSA treatment.
OSAS (OSA syndrome) diagnosis is based on criteria that combine symptoms, comorbidities, and polysomnographic (PSG) recordings that indicate the presence of obstructive respiratory events.9 In-lab PSG continues to be the reference diagnostic method,10 but home sleep apnea testing (HSAT) has become widely accepted and can be used for OSA diagnosis in patients with a high pre-test probability of moderate-to-severe OSA.11 Practically, despite some limitations (ie, lack of electroencephalogram [EEG] means correct assessment of total sleep time [TST] and arousals is not possible), HSAT is used worldwide and is reimbursed in the United States and in the majority of European countries (eg, Spain, France, Germany) for OSA diagnosis. HSAT increases the accessibility of sleep testing and hastens treatment initiation, but some comorbid disorders can be missed, such as insomnia which is very prevalent in OSA.12
Polysomnographic assessment of OSA is based on a number of different metrics. Apnea–hypopnea index (AHI) is the central metric for OSA assessment. The definition of AHI is the number of hypopneas + apnea/hour of sleep (or recording time). Obstructive apneas are respiratory events classified by a complete cessation (defined as a decrease in amplitude of > 90%) of airflow for at least 10 seconds together with continued respiratory effort. A hypopnea is similar to an apnea, although the decrease in airflow is 30%–90% in amplitude and associated with >3% oxygen desaturation or EEG arousal.9 In the past, other definitions have been used. For example, in American Academy of Sleep Medicine (AASM) scoring rules of 2007, hypopnea was defined as decrease in airflow is 30%–90% in amplitude associated with >4% oxygen desaturation.13
The severity of OSA is expressed according to obstructive AHI values of 5–14, 15–29, > 30 events/h of TST that define, respectively, mild, moderate, and severe OSA. Although there is a linear relationship between AHI and blood pressure (BP)14 and AHI correlates with overall mortality in OSA patients,15 AHI is poorly correlated with the severity of clinical symptoms.16
With the development of HSAT and the awareness of the limits of AHI measurements, other metrics have been developed to describe OSA. Oxygen desaturation index (ODI) represents the number of occurrences of desaturation (3% or 4%)/hour of sleep (or recording time). It does not necessarily mean that oxygen saturation falls below 90%: drops from 96 to 92% are often observed. Data from the European Sleep Apnoea Database (ESADA) have shown that when both AHI and ODI are used in the same statistical model, only ODI is independently associated with the prevalence of HT in OSA patients.17 However, ODI does not assess the length of oxygen desaturation consecutive to an obstructive apnea or hypopnea. Thus, there are limitations to the ability of these two parameters to assess all the aspects of OSA.
This is likely to be related to heterogeneity of OSA. The clinical picture of OSA is heterogeneous and can differ widely among patients. In the last decade, a variety of clinical phenotypes have been identified, highlighting clusters with different symptomologies and comorbidities in patients affected by the “same disease” when described in terms of AHI severity.18 Indeed, AHI is still the indicator used to classify disease severity and guide treatment, but its usefulness is limited for capturing the full clinical picture of OSA. For example, among patients with the same AHI, some exhibit long apneas with profound oxygen desaturation, and others exhibit very short apneas without significant associated hypoxia. These differences can potentially lead to several clinical OSA phenotypes for which identical management strategies may not be optimal. Moreover, additional pathophysiological processes generated by obstructive respiratory events can overlay intermittent hypoxia (IH) and are observed in the development of symptoms or comorbidities, such as sympathetic activation, systemic inflammation, oxidative stress, sleep fragmentation, and respiratory efforts.19
Several studies have identified different phenotypes of OSA patients. For example, in an analysis of 18,263 OSA patients in the OSFP (French national registry of sleep apnea), Bailly et al found six phenotypes based on baseline symptoms, physical examination, risk factor exposure, and comorbidities: young symptomatic patients, young snorers, drowsy obese, older obese, polypathological symptomatic obese, and polypathological old obese.20
In a recent review of cluster studies among OSA patients, Zinchuk and Yaggi proposed six clusters (A, B, C, D, E, F) of patients according to phenotypical and clinical criteria and PSG characteristics. Response to CPAP was also analyzed.18 Subtype A includes younger, obese, predominantly male individuals with severe OSA, “classic” symptoms (eg, sleepiness, drowsy driving) and an increased risk of incident cardiovascular disease (CVD) (hazard ratio [HR]: 2.0, [95% CI:1.21–3.31]). Subtype B consists of predominantly male, older, obese individuals with minimal to moderate symptom burden, severe OSA with marked hypoxemic burden (time spent below 90% of oxygen [T90%]: 32%-59% of TST),18 frequent comorbidities (HT, DM, and CVD), related to both age and hypoxia.15,21,22 These patients exhibit the lowest rate of CPAP success,23 although fatigue and obstructive respiratory events are improved with CPAP. Subtype C includes middle-aged, mildly obese, predominantly female subjects with symptoms of insomnia.18 CPAP adherence is lower in the “comorbid OSA with insomnia” group than in patients with OSA alone. Maintenance insomnia responds better to CPAP than other subtypes of insomnia. Subtype D includes younger, non-obese, non-sleepy, predominantly male patients with primarily upper airway (UA) symptoms and severe AHI values.18 Adherence to CPAP is low (odds ratio (OR): 0.66). Subtype E, based on PSG metrics, includes patients with hypersevere OSA (AHI 66–84/hour of sleep), the highest body mass indices (BMI) (33–38 kg/m2), the most marked hypoxemia (T90%:20%–45%), and the highest Epworth Sleepiness Scale (ESS) scores among the clusters. These patients exhibited an increased risk of incident CVD or death (HR 1.91 [95% CI:1.27–2.85]). Finally, subtype F, which is the second most common PSG phenotype, includes patients with severe OSA, low BMI, and the lowest degree of hypoxemia for a given AHI (T90%: 0%–12%). They exhibited the lowest rate of regular CPAP use (29%) among clusters with AHI > 15.18
These various phenotypes illustrate the marked heterogeneity of the disease within the patients. Response to CPAP (clinical benefit and/or impact on comorbidities) is also highly variable. OSA phenotypes are summarized in Table 1.18,20,23,24
 |
Table 1 OSA Phenotypes According to Demographics, Symptoms, PSG Pattern, CPAP Benefit and Comorbidities.18,20,23,24 |
Each OSA phenotype is ultimately the clinical expression of several endotypes, subtypes of OSA defined by a unique or distinctive functional or pathophysiological mechanism (eg UA muscle activity, obesity, arousal threshold, …). A better understanding of the specificities of each OSA endophenotype, from pathophysiological mechanisms to clinical expression (PSG, symptoms, comorbidities) seems essential today to detect OSA patients at risk of CVD for early intensive management.25
In all of these OSA clusters/subtypes, AHI is not correlated with the symptoms and daytime sleepiness, assessed by ESS, is also not present in all phenotypes (Table 1).
With regard to these data, AHI metrics exhibit several obvious limitations.26 The first is related to the validity of the metric itself, which is based on older studies and on sensors that have changed over time.16 The definition of hypopnea has also changed since the first definition from the AASM in 1999 and significantly affects the association between OSA severity and comorbidities. Indeed, in 2007 AASM scoring rules, hypopnea was defined as a decrease in airflow is 30%–90% in amplitude associated with >4% oxygen desaturation.13 The difference between AASM 2007 and 2012 definitions (4% vs 3% or EEG arousal) has led to an important underestimation of OSA diagnosis when using the AASM 2007 scoring rules, resulting in the absence of association between HT and severe OSA when using this too stringent definition.27 The change in definition of hypopnea over time is important to consider when analyzing studies.
In addition, AHI is not well correlated with symptoms28 or with comorbidities,29 and does not consider the amount of hypoxemia provoked by obstructive respiratory events, the length of the events, and other pathophysiological consequences.
Another problem is the use of a single-night estimate of OSA severity using AHI metrics when there is certainly night-to-night variability. A recent study based on data from collection of 11.6 million nights of data from over 65,000 patients, although collected with a mattress sensor (Withings Sleep Analyzer), showed that the likelihood of misdiagnosis in patients suffering from OSA based on a single night ranged between approximately 20% and 50%.30
In a study from André et al.31 AHI, apnea–hypopnea (AH) duration, reduced sleep efficiency and TST, low rapid eye movement (REM) sleep proportion, and nocturnal hypoxemia were identified as risk factors associated with all cardiovascular (CV) complications. There was a strong association between OSA severity, reflected by AHI and the presence of cardiometabolic comorbidities that share the same pathophysiological mechanisms. They also highlighted that mean duration of AH in REM and non-REM sleep is an independent predictor of the presence of cardiometabolic comorbidities. Wu et al,32 have shown, in a retrospective study, that a longer mean AH duration (but not AHI) is associated with higher odds of moderate-to-severe HT. Mokhlesi et al have shown, in the very large Wisconsin sleep Cohort, that in individuals with non-REM AHI < 5, a twofold increase in REM AHI was associated with 24% higher odds of HT.33
These observations suggest that AHI is an oversimplified measure of OSA that does not take into account the parameters related to nocturnal hypoxemia.
Nighttime hypoxemia is effectively a very interesting parameter to explore, as IH is the hallmark of OSA. Several observational studies have demonstrated that measures of nocturnal hypoxemia, such as T90%, more strongly predict CVD, postoperative complications and all-cause mortality than AHI.34–36
In the following chapter, we will explore the use of these metrics in the assessment of OSA.37
The purpose of this review is to summarize the endophenotypic and clinical features of OSA, current measures of OSA, and to analyze different measures of hypoxemia that could help predict cardiovascular impact.
The potential value of multidimensional models to classify OSA will also be discussed.
Exploring Nocturnal Hypoxemia
Patterns of Nocturnal Hypoxemia
Two patterns of hypoxemia can be observed during sleep: short intermittent high-frequency hypoxemia, as seen in OSA, and prolonged low-frequency hypoxemia as seen in chronic obstructive pulmonary disease (COPD) or at high altitude. The major difference is the cycles of reoxygenation. The cyclical changes in hypoxemia and reoxygenation are similar to those observed with an ischemia-reperfusion injury and contribute to an increased production of reactive oxygen species (ROS) and oxidative stress through NF-κB and, in lesser way, hypoxia-inducible factor (HIF).38 Chronic continuous hypoxemia leads to increased erythropoiesis and pulmonary HT, by adaptive and maladaptive responses of HIF. Prolonged sustained hypoxemia leads however to HIF-1α decay, but this is not observed in case of chronic HI. In this situation, imbalance between HIF-1α and HIF-2α contributes to oxidative stress.39,40
Pathophysiological Consequences of Nocturnal Hypoxia
Two main mechanisms are triggered by IH. On the one hand, sympathetic activation has important effects on vascular function. Activation of the sympathetic nervous system leads to vasoconstriction and elevates blood pressure by increasing vascular resistance and is a major contributing factor for OSA-associated hypertension (Figure 1). One the other hand, several inflammatory pathways are triggered by IH and can eventually lead to tumor growth, dyslipidemia and endothelial dysfunction (Figure 1).
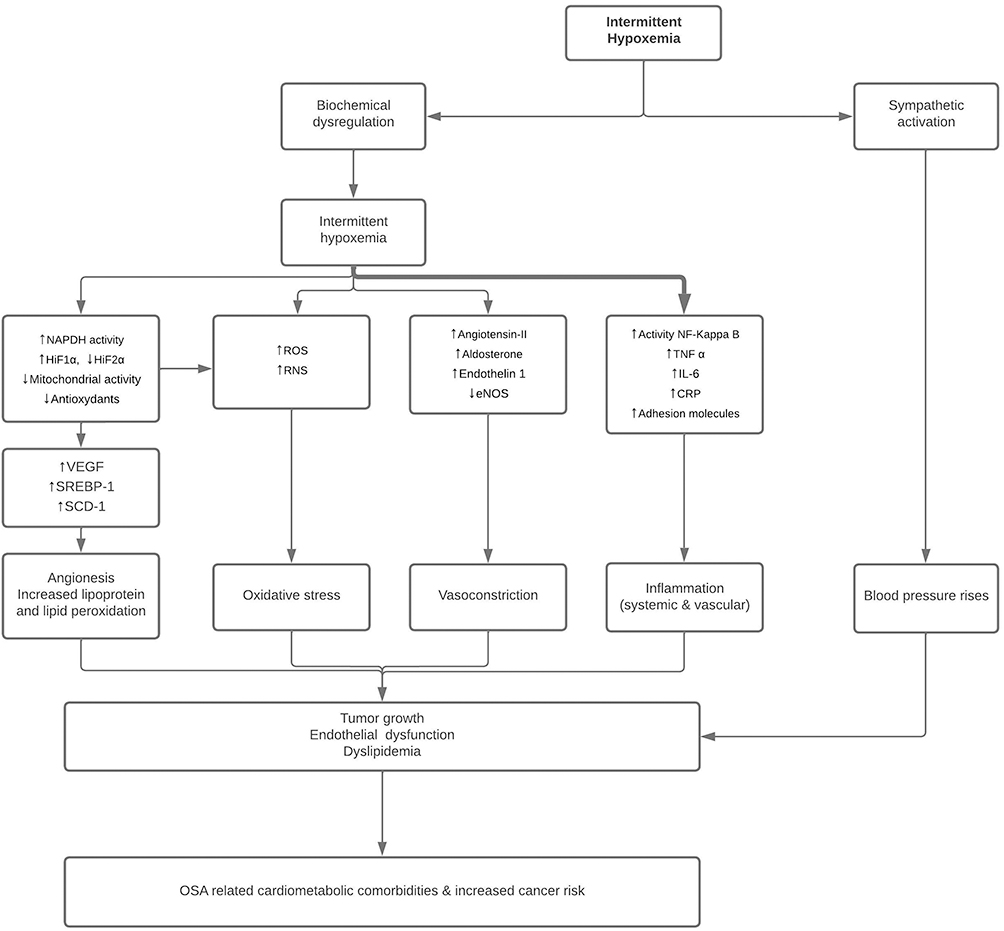 |
Figure 1 Illustration of the pathophysiological consequences of intermittent hypoxia in obstructive sleep apnea (OSA). Abbreviations: CRP, C-reactive protein; eNOS, endothelial nitric oxide synthase; HIF, hypoxia-inducible factor; NADPH, nicotinamide adenine dinucleotide phosphate hydrogen; RNS, reactive nitrogen species; ROS, reactive oxygen species; SREBP1, sterol regulatory element-binding protein 1, SCD-1, stearoyl-CoA desaturase-1; TNF-α, tumor necrosis factor, VEGF; vascular epithelial growth factor. |
IH induces also metabolic consequences via an increased activity of HIF-1 triggered by the carotid body. HIF-1 causes upregulation of lipid biosynthesis in the liver, increases in adipose tissue lipolysis with subsequent free fatty acid flux to the liver, and inhibition of lipoprotein clearance. All these mechanisms can contribute to dyslipidemia and thus indirectly to atherosclerosis.41,42
Tumor growth, dyslipidemia and endothelial dysfunction are mediated by systemic inflammation, endothelin release, and attenuated production of nitric oxide (NO).43
Hypoxemia is an important trigger for endothelial cell endothelin production,44 a highly potent vasoconstrictor, and untreated OSA results in elevation of both endothelin and BP, reversible with CPAP treatment, and for levels of circulating NO, which normalize. These hypoxemia-driven effects on systemic inflammation, endothelin, and NO are likely to contribute to the marked endothelial dysfunction present in patients with OSA.39,45
However, systemic inflammation observed in OSA patients is not only related to IH but also to obesity. Indeed, abdominal obesity is associated with low grade systemic inflammation (increased levels of C-reactive protein [CRP] and interleukin [IL]-6) and inflammatory changes in adipose tissue.46–48
An increase in leptin levels is also observed, inducing a central stimulation of ventilation through crossing of blood–brain barrier.49
Then, as obesity increases (BMI>40Kg/m2), the patient may develop obesity-hypoventilation syndrome (OHS) which leads to daytime hypercapnia through central leptin resistance. This resistance increases leptin levels again, compared to obese patients without hypercapnia. However, there is no resistance to the peripheral effects of leptin, which leads to increased sympathetic activity and cytokine production. In addition, work of breathing is higher in OHS than in obese. This leads to increased pro-inflammatory cytokine RANTE-5 (involved in atherosclerosis), decreased anti-inflammatory adipokine, and altered endothelial function.50
One factor however, the tumor necrosis factor (TNF-α) does not seem to be influenced by obesity. Indeed, in OSA patients, TNF-α level is elevated in comparison to controls, independently of obesity, age and sleepiness. The level is correlated with the severity of OSA, and the best predictor of TNF-α levels is ODI.38,51
Impact of Intermittent Hypoxia in the Development of Cardiometabolic Comorbidities
IH drives chemoreflex stimulation, leading to vasoconstriction via sympathetic activation, which plays an important in the development of CV comorbidities. This can be attenuated by stretching of the thoracic afferents and is thus more marked during apnea than during hypopnea.39,52,53 Recurrent cortical arousals also contribute to sympathetic activation. Patients with OSA retain very high levels of sympathetic activation during normoxic daytime wakefulness, comparable to patients with heart failure. When they receive 100% oxygen therapy, this lowers their sympathetic drive, BP, and heart rate, suggesting that tonic chemoreflex activation is a contributor to sustained sympathetic drive.52,53 Moreover, the primary response to hypoxemia is bradycardia, as is seen in the diving reflex. Varying degrees of bradycardia and bradyarrhythmias are seen in patients with OSA which, in some patients, may manifest as Mobitz II, complete heart block, and sinus arrest.54,55 Atrial fibrillation is very prevalent in OSA patients,5 and is related to structural and electrical remodeling in the atria caused by increase of both vagal and sympathetic activity.56
Multiple studies have demonstrated associations between IH and indices of subclinical CVD or CVD risk factors, including endothelial dysfunction, increased sympathetic activation, inflammation, oxidative stress, and metabolic dysfunction.52,57,58 The pathophysiological consequences of IH are summarized in Figure 1.
Prognostic biomarkers of IH could be useful to identify patients who suffer the most, or are most likely to suffer from cellular or tissue hypoxic injury related to IH and related oxidative stress. However, to date, even if several promising biomarkers have been identified (Specific MicroRNAs related to hypoxia, IL-6, IL-8, high-sensitivity CRP, TNF-α, homocysteine, cysteine ….), none are enough sensitive and specific to predict individual susceptibility to CV morbidity.59 Similarly, none of the markers of oxidative stress (eg thiobarbituric acid reactive substances; malondialdehyde; serum paraoxonase 1; catalase; glutathione peroxidase; superoxide dismutase) are currently able to discriminate from OSA patients with and without CV complications.60 The lack of specificity and obesity, as a major confounder, remain the major barriers to use in clinical practice. Further studies are needed to identify specific endophenotypes susceptible to develop CV comorbidities, in order to guide clinicians for more aggressive OSA management in these individuals.
Oxygen Desaturation Measurements
Hypoxemia appears to significantly impact the occurrence of CV and cardiometabolic comorbidities. For example, ODI 4% was shown to be associated with HT,17 and T90% with HT and cerebro/CV diseases.61
But, as we have already discussed for AHI, ODI metrics exhibit limits. For example, a patient with an ODI of 15/hour of sleep but with long oxygen desaturation episodes can have a two-fold higher T90% and a lower minimal saturation than a patient with an ODI of 35/hour of sleep but shorter events, associated with light levels of oxygen desaturation.62
To overcome these limitations, a new metric was proposed by Azarbarzin et al to measure hypoxic burden.63 Hypoxic burden can be defined as a value reflecting the area under the curve on the oxygen saturation curve during desaturation episodes. This value considers frequency, length, and depth of the respiratory-related oxygen desaturation. The role of hypoxic burden related to OSA in the occurrence of CV complications was studied by Azarbarzin et al in two different large cohorts: the Osteoporotic Fractures in Men Study (MrOS) and the SHHS. The researchers were able to show that OSA severity quantified as respiratory event-related hypoxic burden was independently associated with CVD mortality. This association persisted after adjusting for a large number of potential confounders and possible mediators, including prevalent CVD as well as AHI, T90%, and sleep duration. In contrast, CVD mortality was not associated with AHI when it was assessed as an independent variable. In this study, T90% was significantly associated with CVD mortality in the SHHS cohort (N=5111) but not in the MrOS cohort (N=2743), while ODI was associated with CVD mortality in the MrOS but not the SHHS cohort.63 These data suggest that CVD mortality is strongly associated with a quantitative measure of hypoxic burden caused by respiratory disturbance, and that this measurement significantly and more consistently predicts CV outcomes compared to less precise OSA impact measurements such as respiratory event frequency (AHI), overall hypoxemia (T90%), or desaturation frequency (ODI) during sleep.63
Other oxygen-related metrics have also been proposed. Kainulainen et al have proposed using “desaturation severity”, defined as the sum of the area under the curve of all desaturation events, normalized to TST, and “obstruction severity”, defined as the multiplication of the apnea duration by the desaturation area under the curve (Figure 2). In their retrospective study, they showed that these indicators have a better correlation with excessive daytime sleepiness (EDS) compared to AHI and ODI.64
 |
Figure 2 Calculation of the “obstruction severity” and “desaturation severity” metrics as proposed by Kainulainen et al42. |
Kulkas et al reported that “obstruction severity” and “desaturation severity”, calculated as shown below, vary between the AHI severity categories. Interestingly, AHI was better correlated to apnea duration than to the number of events. The area under the curve of the desaturation events is part of the obstruction severity parameter (Figure 2). Thus, both the duration and morphology of apnea, hypopnea, and desaturation events are included in the obstruction severity parameter.65
In a retrospective study (N=1068), Muraja-Murro et al compared these indices in cohorts of alive and dead OSA patients, matched according to AHI, age, BMI, smoking habits, and follow-up time. Based on a multivariate logistic regression analysis, the authors found that higher “obstruction severity index” was statistically significantly associated with mortality in the severe OSA category.66
How to Improve OSA-Related Hypoxemia Measurement in Clinical Practice?
As assessed by Azarbarzin et al,63 one challenge of some commonly used metrics is that they depend on arbitrary absolute thresholds (eg, desaturation below 90% or 80%) which may not apply across populations. Metrics such as T90% are also used to measure the impact of the individual apneas and hypopneas as it can reflect underlying lung disease or a hypoventilation disorder, and thus are less specific markers of OSA-related hypoxic stress compared with the hypoxic burden measurement. T90% also does not provide direct information on the targets for OSA treatment (eg, CPAP), which mostly address episodic UA obstruction and the ensuing hypoxemia. In contrast, the hypoxic burden index quantifies a target for CPAP, and may possibly better identify individuals who will respond to CPAP than when using AHI or T90%. Hypoxic burden is not yet used in clinical practice, but one can imagine implementing an automated analysis of this index on top of manual scoring of PSG or HSAT recordings.
Discussion
Obstructive apneas and hypopneas induce several pathophysiological modifications (eg, IH, arousals, respiratory effort, heart rate variability), provoking daytime and/or nighttime symptoms but also increasing cardiometabolic risk. PSG can capture most of these disturbances, but they are not well translated when expressing OSA severity through approximates such as AHI or T90%. The different phenotypes that have been documented in the OSA spectrum show the complexity of the disorder. Moreover, by using imperfect metrics, three recent large RCTs (the RICCADSA trial, the SAVE trial, and the ISAAC trial) failed to show a reduction in CV events with CPAP therapy in patients with a past history of CVD,67–69 and other limitations can also occur, such as the exclusion of patients suffering from EDS.70
Several studies that have been based on OSA-related hypoxemic burden have shown that these parameters better identify the OSA-related physiologic insults leading to CVD.62
To better capture the whole picture of OSA, Randerath et al have already proposed a 2-dimensional classification for OSA (BAVENO), which considers the presence/absence of EDS and the presence/absence of end-stage organ injury or comorbidities.71 This classification, in parallel to the GOLD classification in COPD, has the advantage of being multicomponent and considers several characteristics of OSA syndrome to identify the more severe patients. A slightly modified BAVENO classification has been applied to a large dataset of patients from the ESADA cohort (14,499 patients), followed between 2 and 3 years after CPAP treatment.72 The authors demonstrated a significant relationship between the defined categories (A to D, from less to more severe) and treatment impact, with symptoms and/or comorbidities improving the most in C and D categories with CPAP. Hypoxic load, assessed by T90% and ODI, was not different in category C (no EDS, presence of end-stage organ injury or comorbidities) and B (EDS, absence of end-stage organ injury or comorbidities (or well-controlled)). Adding a quantitative metric of hypoxic burden could help to focus attention on patients susceptible to future risk, according to data from Azarbazin et al, highlighting a higher CV mortality in MrOS and SHHS cohorts for the Q4 and Q5 quintiles of hypoxic burden, respectively, between 53% and 88% min/hour or >88% min/hour.63
Based on these insights, we can now imagine proposing a 3D model with 8 categories of patients exhibiting a continuum of severity. This could be tested in a large OSA population dataset to assess the impact of these changes to patient assessment and OSA management. The proposed model is illustrated in Figure 3.
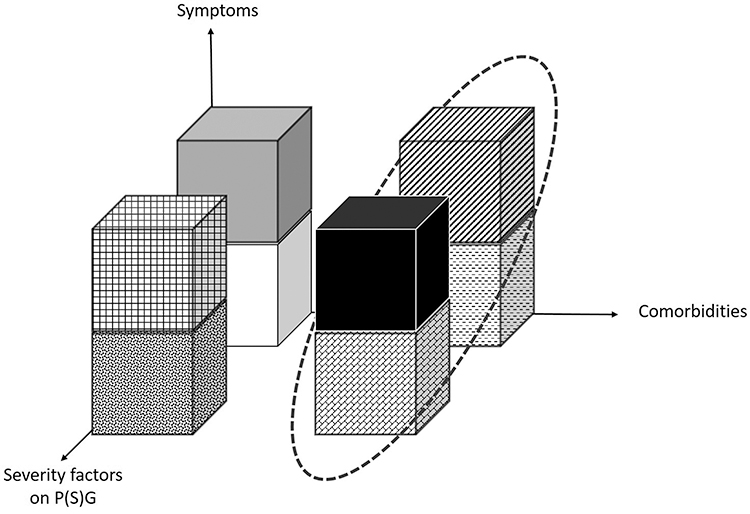 |
Figure 3 Proposed 3-dimensional model that aims to assess 8 categories of OSA severity, considering Symptoms (excessive daytime sleepiness, ESS <11 or >11), comorbidities (presence/absence of end-stage organ injury or comorbidities) and severity factors on PSG (hypoxic burden below or >53% min/hour). The circle shows the 4 categories of highest severity. In this model, the equal distribution between each severity category has been chosen arbitrarily since the prevalence of each category is currently unknown. Abbreviations: OSA, obstructive sleep apnea; ESS, Epworth Sleepiness Score; P(S)G, poly(somno)graphy. |
However, despite the potential interest in such a model, there are limitations associated with using these multidimensional models. For example, these models use arbitrarily continuous variables as categories that have been tested only on retrospective cohorts and still need to be trialed in large prospective OSA patient cohorts to assess their value for OSA treatment choice and impact. Also, BMI, age, OSA duration and sex do not appear in these models, despite their potential impact on the occurrence of comorbidities and on the category of comorbidities.73,74
Finally, if the model is too complex, which could be the case with the model presented above (8 categories), it may be difficult to use in clinical practice.
At this time, research is still ongoing to explore new metrics that assess the CV insults induced by OSA. Recently, Azarbarzin et al showed that high OSA-related heart rate response (pulse-rate response) was associated with CV events and all-cause mortality in longitudinal follow-up of the SHHS cohort (mean FU 10.7 years).75 Heart rate response relies only on measurement of respiration and pulse oximetry, easy to obtain with HSAT. Another feature of this measurement is that the analysis can be automated.
Pulse wave amplitude (PWA) drops are another avenue that is being explored to obtain an overall assessment of sympathetic activation (autonomic vasoconstriction) during the night. Indeed, PWA drops can be easily detected by photoplethysmography and an automated detection algorithm has been recently published.76 The clinical implications of this are as yet unknown, but it offers the advantage of being assessed by simplified, unobtrusive sensors. The clinical usefulness of PWA should be further studied.
Conclusion
Commonly used PSG indices, such as AHI, ODI, and T90% are poor markers of CV insults induced by OSA. Hypoxic burden index differs in terms of its quantitative features, resulting in better assessment of CV outcomes when tested retrospectively on large OSA patient cohorts. However, prospective studies are yet lacking. Other markers of OSA-induced CV stress are also being developed, but data are yet limited. A multidimensional model, the BAVENO classification, has been developed to identify the more severe patients who will derive the most benefit from CPAP. However, while taking symptoms and comorbidities into account, no PSG parameter is included in the classification. Hypoxic burden could be added to the model to improve OSA patient classification to focus on the most symptomatic and also those patients with greatest future CV risk.
Acknowledgments
The authors would like to acknowledge the contribution of a medical writer, Sandy Field, PhD, for English language editing and formatting of this manuscript.
Disclosure
The authors declare no conflicts of interest in this work.
References
1. Heinzer R, Vat S, Marques-Vidal P, et al. Prevalence of sleep-disordered breathing in the general population: the HypnoLaus study. Lancet Respir Med. 2015;3(4):310–318. doi:10.1016/S2213-2600(15)00043-0
2. Marin JM, Carrizo SJ, Vicente E, Agusti AG. Long-term cardiovascular outcomes in men with obstructive sleep apnoea-hypopnoea with or without treatment with continuous positive airway pressure: an observational study. Lancet. 2005;365(9464):1046–1053. doi:10.1016/S0140-6736(05)71141-7
3. Arzt M, Oldenburg O, Graml A, et al. Phenotyping of Sleep-Disordered Breathing in Patients With Chronic Heart Failure With Reduced Ejection Fraction—the SchlaHF Registry. J Am Heart Assoc. 2017;6(12):e005899. doi:10.1161/JAHA.116.005899
4. Mehra R, Stone KL, Varosy PD, et al. Nocturnal Arrhythmias across a spectrum of obstructive and central sleep-disordered breathing in older men: outcomes of sleep disorders in older men (MrOS sleep) study. Arch Intern Med. 2009;169(12):1147–1155. doi:10.1001/archinternmed.2009.138
5. McNicholas WT, Bonsignore MR. Bonsignore MR and the Management Committee of EU COST ACTION B26. Sleep apnoea as an independent risk factor for cardiovascular disease: current evidence, basic mechanisms and research priorities. European Respiratory Journal. 2006;29(1):156–178. doi:10.1183/09031936.00027406
6. Partinen M, Guilleminault C. Daytime Sleepiness and Vascular Morbidity at Seven-Year Follow-up in Obstructive Sleep Apnea Patients. Chest. 1990;97(1):27–32. doi:10.1378/chest.97.1.27
7. Tamura A, Kawano Y, Watanabe T, Kadota J. Relationship between the severity of obstructive sleep apnea and impaired glucose metabolism in patients with obstructive sleep apnea. Respir Med. 2008;102:1412–1416.
8. Lam JCM, Lui MMS, Ip MSM. Diabetes and metabolic aspects of OSA. Eur Respi Monogr. 2010;2:189–215.
9. American Academy of Sleep Medicine. The International Classification of Sleep Disorders.
10. Kushida CA, Littner MR, Morgenthaler T, et al. Practice Parameters for the indications for polysomnography and related procedures: an update for 2005. Sleep. 2005;28(4):499–521. doi:10.1093/sleep/28.4.499
11. Collop NA, Anderson WM, Boehlecke B, et al. Clinical guidelines for the use of unattended portable monitors in the diagnosis of obstructive sleep apnea in adult patients. Portable Monitoring Task Force of the American Academy of Sleep Medicine. J Clin Sleep Med. 2007;3(7):737–747.
12. O’Mahony AM, Garvey JF, McNicholas WT. Technologic advances in the assessment and management of obstructive sleep apnoea beyond the apnoea-hypopnoea index: a narrative review. J Thorac Dis. 2020;12(9):5020–5038. doi:10.21037/jtd-sleep-2020-003
13. Iber C, Ancoli-Israel S, Chesson A, Quan SF. The AASM Manual for the Scoring of Sleep and Associated Events: Rules, Terminology and Technical Specifications. Westchester, IL: American Academy of Sleep Medicine; 2007.
14. Peppard PE, Young T, Palta M, Skatrud J. Prospective study of the association between sleep-disordered breathing and hypertension. N Engl J Med. 2000;342(19):1378–1384. doi:10.1056/NEJM200005113421901
15. Kendzerska T, Mollayeva T, Gershon AS, Leung RS, Hawker G, Tomlinson G. Untreated obstructive sleep apnea and the risk for serious long-term adverse outcomes: a systematic review. Sleep Med Rev. 2014;18(1):49–59. doi:10.1016/j.smrv.2013.01.003
16. Pevernagie DA, Gnidovec‐Strazisar B, Grote L, et al. On the rise and fall of the apnea−hypopnea index: a historical review and critical appraisal. J Sleep Res. 2020;29(4):e13066. doi:10.1111/jsr.13066
17. Tkacova R, McNicholas WT, Javorsky M, et al. European Sleep Apnoea Database study collaborators. Nocturnal intermittent hypoxia predicts prevalent hypertension in the European Sleep Apnoea Database cohort study. Eur Respir J. 2014;44(4):931–941. doi:10.1183/09031936.00225113
18. Zinchuk A, Yaggi HK. Phenotypic Subtypes of OSA: a Challenge and Opportunity for Precision Medicine. Chest. 2020;157(2):403–420. doi:10.1016/j.chest.2019.09.002
19. Bonsignore MR, Suarez Giron MC, Marrone O, Castrogiovanni A, Montserrat JM. Personalised medicine in sleep respiratory disorders: focus on obstructive sleep apnoea diagnosis and treatment. Eur Respir Rev. 2017;26(146):170069. doi:10.1183/16000617.0069-2017
20. Bailly S, Destors M, Grillet Y, et al. Obstructive Sleep Apnea: a Cluster Analysis at Time of Diagnosis. PLoS One. 2016;11:e0157318.
21. Martinez-Garcia M-A, Campos-Rodriguez F, Catalan-Serra P, et al. Cardiovascular mortality in obstructive sleep apnea in the elderly: role of long-term continuous positive airway pressure treatment: a prospective observational study. Am J Respir Crit Care Med. 2012;186(9):909–916. doi:10.1164/rccm.201203-0448OC
22. Stone KL, Blackwell TL, Ancoli-Israel S, et al. Sleep disordered breathing and risk of stroke in older community-dwelling men. Sleep. 2016;39(3):531–540. doi:10.5665/sleep.5520
23. Gagnadoux F, Le Vaillant M, Paris A, et al. Relationship between OSA clinical phenotypes and CPAP treatment outcomes. Chest. 2016;149(1):288–290. doi:10.1016/j.chest.2015.09.032
24. Mazzotti DR, Keenan BT, Lim DC, Gottlieb DJ, Kim J, Pack AI. Symptom Subtypes of Obstructive Sleep Apnea Predict Incidence of Cardiovascular Outcomes. Am J Respir Crit Care Med. 2019;200(4):493–506. doi:10.1164/rccm.201808-1509OC
25. Subramani Y, Singh M, Wong J, Kushida CA, Malhotra A, Chung F. Understanding Phenotypes of Obstructive Sleep Apnea: applications in Anesthesia, Surgery, and Perioperative Medicine. Anesth Analg. 2017;124(1):179–191. doi:10.1213/ANE.0000000000001546
26. Cao W, Luo J, Xiao Y. A review of current tools used for evaluating the severity of obstructive sleep apnea. Nat Sci Sleep. 2020;12:1023–1031. doi:10.2147/NSS.S275252
27. Hirotsu C, Haba-Rubio J, Andries D, et al. Effect of Three Hypopnea Scoring Criteria on OSA Prevalence and Associated Comorbidities in the General Population. J Clin Sleep Med. 2019;15(2):183–194. doi:10.5664/jcsm.7612
28. Lipford MC, Wahner-Roedler DL, Welsh GA, Mandrekar J, Thapa P, Olson EJ. Correlation of the Epworth Sleepiness Scale and Sleep-Disordered Breathing in Men and Women. J Clin Sleep Med. 2019;15(1):33–38. doi:10.5664/jcsm.7564
29. Bouloukaki I, Grote L, McNicholas WT, et al. European Sleep Apnoea Database Network. Mild obstructive sleep apnea increases hypertension risk, challenging traditional severity classification. J Clin Sleep Med. 2020;16(6):889–898. doi:10.5664/jcsm.8354
30. Lechat B, Naik G, Reynolds A, et al. Multinight Prevalence, Variability, and Diagnostic Misclassification of Obstructive Sleep Apnea. Am J Respir Crit Care Med. 2022;205(5):563–569. doi:10.1164/rccm.202107-1761OC
31. André S, Andreozzi F, Van Overstraeten C, et al. Cardiometabolic comorbidities in obstructive sleep apnea patients are related to disease severity, nocturnal hypoxemia, and decreased sleep quality. Respir Res. 2020;21(1):35. doi:10.1186/s12931-020-1284-7
32. Wu H, Zhan X, Zhao M, Wei Y. Mean apnea–hypopnea duration (but not apnea–hypopnea index) is associated with worse hypertension in patients with obstructive sleep apnea. Medicine. 2016;95(48):e5493. doi:10.1097/MD.0000000000005493
33. Mokhlesi B, Finn LA, Hagen EW, et al. Obstructive sleep apnea during REM sleep and hypertension. results of the Wisconsin Sleep Cohort. Am J Respir Crit Care Med. 2014;190(10):1158–1167. doi:10.1164/rccm.201406-1136OC
34. Oldenburg O, Wellmann B, Buchholz A, et al. Nocturnal hypoxaemia is associated with increased mortality in stable heart failure patients. Eur Heart J. 2016;37(21):1695–1703. doi:10.1093/eurheartj/ehv624
35. Smagula SF, Stone KL, Redline S, et al. Actigraphy- and Polysomnography-Measured Sleep Disturbances, Inflammation, and Mortality Among Older Men. Psychosom Med. 2016;78(6):686–696. doi:10.1097/PSY.0000000000000312
36. Jung HH, Lee JH, Baek HJ, Kim SJ, Lee JJ. Nocturnal Hypoxemia and Periodic Limb Movement Predict Mortality in Patients on Maintenance Hemodialysis. Clin J Am Soc Nephrol. 2010;5(9):1607–1613. doi:10.2215/CJN.08881209
37. Malhotra A, Ayappa I, Ayas N, et al. Metrics of sleep apnea severity: beyond the apnea-hypopnea index. Sleep. 2021;44(7):zsab030. doi:10.1093/sleep/zsab030
38. Ryan S, Nicholas WT. Intermittent hypoxia and activation of inflammatory molecular pathways in OSAS. Archives of Physiology and Biochemistry. 2008;114(4):261–266. doi:10.1080/13813450802307337
39. Dewan NA, Nieto FJ, Somers VK. Intermittent hypoxemia and OSA: implications for comorbidities. Chest. 2015;147(1):266–274. doi:10.1378/chest.14-0500
40. Prabhakar NR, Semenza GL. Adaptive and maladaptive cardiorespiratory responses to continuous and intermittent hypoxia mediated by hypoxia-inducible factors 1 and 2. Physiol Rev. 2012;92(3):967–1003. doi:10.1152/physrev.00030.2011
41. Adedayo AM, Olafiranye O, Smith D, et al. Obstructive sleep apnea and dyslipidemia: evidence and underlying mechanism. Sleep and Breathing. 2014;18(1):13–18. doi:10.1007/s11325-012-0760-9
42. Barros D, García-Río F. Obstructive sleep apnea and dyslipidemia: from animal models to clinical evidence. Sleep. 2019;42(3):zsy236. doi:10.1093/sleep/zsy236
43. Wang B, Yan B, Song D, Ye X, Liu SF. Chronic intermittent hypoxia down-regulates endothelial nitric oxide synthase expression by an NF-κB-dependent mechanism. Sleep Med. 2013;14(2):165–171. doi:10.1016/j.sleep.2012.10.020
44. Belaidi E, Joyeux-Faure M, Ribuot C, Launois SH, Levy P, Godin-Ribuot D. Major role for hypoxia inducible factor-1 and the endothelin system in promoting myocardial infarction and hypertension in an animal model of obstructive sleep apnea. J Am Coll Cardiol. 2009;53(15):1309–1317. doi:10.1016/j.jacc.2008.12.050
45. Kohler M, Stradling JR. Mechanisms of vascular damage in obstructive sleep apnea. Nat Rev Cardiol. 2010;7(12):677–685. doi:10.1038/nrcardio.2010.145
46. Apovian CM, Bigornia S, Mott M, et al. Adipose macrophage infiltration is associated with insulin resistance and vascular endothelial dysfunction in obese subjects. Arterioscler Thromb Vasc Biol. 2008;28(9):1654–1659. doi:10.1161/ATVBAHA.108.170316
47. Hotamisligil GS. Inflammation and metabolic disorders. Nature. 2006;444(7121):860–867. doi:10.1038/nature05485
48. Alam I, Lewis K, Stephens JW, Baxter JN. Obesity, metabolic syndrome and sleep apnoea: all pro-inflammatory states. Obes Rev. 2007;8(2):119–127. doi:10.1111/j.1467-789X.2006.00269.x
49. Hillman D, Singh B, McArdle N, Eastwood P. Relationships between ventilatory impairment, sleep hypoventilation and type 2 respiratory failure. Respirology. 2014;19(8):1106–1116. doi:10.1111/resp.12376
50. Borel J-C, Roux-Lombard P, Tamisier R, et al. Endothelial Dysfunction and Specific Inflammation in Obesity Hypoventilation Syndrome. PLoS One. 2009;4(8):e6733. doi:10.1371/journal.pone.0006733
51. Ryan S, Taylor CT, McNicholas WT. Predictors of Elevated Nuclear Factor-κB–dependent Genes in Obstructive Sleep Apnea Syndrome. Am J Respir Crit Care Med. 2006;174(7):824–830. doi:10.1164/rccm.200601-066OC
52. Somers VK, Mark AL, Zavala DC, Abboud FM. Contrasting effects of hypoxia and hypercapnia on ventilation and sympathetic activity in humans. J Appl Physiol. 1989;67(5):2101–2106. doi:10.1152/jappl.1989.67.5.2101
53. Narkiewicz K, van de Borne PJH, Pesek CA, Dyken ME, Montano N, Somers VK. Selective potentiation of peripheral chemoreflex sensitivity in obstructive sleep apnea. Circulation. 1999;99(9):1183–1189. doi:10.1161/01.CIR.99.9.1183
54. De Burgh Daly M, Scott MJ. An analysis of the primary cardiovascular reflex effects of stimulation of the carotid body chemoreceptors in the dog. J Physiol. 1962;162(3):555–573. doi:10.1113/jphysiol.1962.sp006950
55. Daly MD, Angell-James JE, Elsner R. Role of carotid-body chemoreceptors and their reflex interactions in bradycardia and cardiac arrest. Lancet. 1979;313(8119):764–767. doi:10.1016/S0140-6736(79)91218-2
56. Hohl M, Linz B, Böhm M, Linz D. Obstructive sleep apnea and atrial arrhythmogenesis. Curr Cardiol Rev. 2014;10(4):362–368. doi:10.2174/1573403X1004140707125137
57. Sert Kuniyoshi FH, Singh P, Gami AS, et al. Patients with obstructive sleep apnea exhibit impaired endothelial function after myocardial infarction. Chest. 2011;140(1):62–67. doi:10.1378/chest.10-1722
58. Lavie L, Lavie P. Molecular mechanisms of cardiovascular disease in OSAHS: the oxidative stress link. Eur Respir J. 2009;33(6):1467–1484. doi:10.1183/09031936.00086608
59. Lebkuchen A, Freitas LS, Cardozo KHM, Drager LF. Advances and challenges in pursuing biomarkers for obstructive sleep apnea: implications for the cardiovascular risk. Trends Cardiovasc Med. 2021;31(4):242–249. doi:10.1016/j.tcm.2020.04.003
60. Fiedorczuk P, Stróżyński A, Olszewska E. Is the Oxidative Stress in Obstructive Sleep Apnea Associated with Cardiovascular Complications?—Systematic Review. J Clin Med. 2020;9(11):3734. doi:10.3390/jcm9113734
61. Bikov A, Frent S, Pleava R, et al. The Burden of Associated Comorbidities in Patients with Obstructive Sleep Apnea—Regional Differences in Two Central–Eastern European Sleep Centers. J Clin Med. 2020;9(11):3583. doi:10.3390/jcm9113583
62. Terril P. A review of approaches for analysing obstructive sleep apnoea-related patterns in pulse oximetry data. Respirology. 2020;25(5):475–485. doi:10.1111/resp.13635
63. Azarbarzin A, Sands SA, Stone KL, et al. The hypoxic burden of sleep apnoea predicts cardiovascular disease-related mortality: the Osteoporotic Fractures in Men Study and the Sleep Heart Health Study. Eur Heart J. 2019;40(14):1149–1157. doi:10.1093/eurheartj/ehy624
64. Kainulainen S, Töyräs J, Oksenberg A. Severity of Desaturations Reflects OSA-Related Daytime Sleepiness Better Than AHI. J Clin Sleep Med. 2019;15(8):1135–1142. doi:10.5664/jcsm.7806
65. Kulkas A, Tiihonen P, Julkunen P, Mervaala E, Töyräs J. Novel parameters indicate significant differences in severity of obstructive sleep apnea with patients having similar apnea–hypopnea index. Med Biol Eng Comput. 2013;51:697–708.
66. Muraja-Murro A, Kulkas A, Hiltunen M, et al. The severity of individual obstruction events is related to increased mortality rate in severe obstructive sleep apnea. J Sleep Res. 2013;22:663–669.
67. Peker Y, Glantz H, Eulenburg C, Wegscheider K, Herlitz J, Thunström E. Effect of Positive Airway Pressure on Cardiovascular Outcomes in Coronary Artery Disease Patients with Nonsleepy Obstructive Sleep Apnea. The RICCADSA Randomized Controlled Trial. Am J Respir Crit Care Med. 2016;194:613–620.
68. McEvoy RD, Antic NA, Heeley E, et al. SAVE Investigators and Coordinators. CPAP for Prevention of Cardiovascular Events in Obstructive Sleep Apnea. N Engl J Med. 2016;375:919–931.
69. Sánchez-de-la-Torre M, Sánchez-de-la-Torre A, Bertran S, et al. Spanish Sleep Network. Effect of obstructive sleep apnoea and its treatment with continuous positive airway pressure on the prevalence of cardiovascular events in patients with acute coronary syndrome (ISAACC study): a randomised controlled trial. Lancet Respir Med. 2020;8:359–367.
70. Heinzer R, Eckert D. Treatment for obstructive sleep apnoea and cardiovascular diseases: are we aiming at the wrong target? Lancet Respir Med. 2020;8(4):323–325.
71. Randerath W, Bassetti CL, Bonsignore MR, et al. Challenges and perspectives in obstructive sleep apnoea: report by an ad hoc working group of the Sleep Disordered Breathing Group of the European Respiratory Society and the European Sleep Research Society. Eur Respir J. 2018;52(3):1702616.
72. Randerath WJ, Herkenrath S, Treml M, et al. Evaluation of a multicomponent grading system for obstructive sleep apnoea: the Baveno classification. ERJ Open Res. 2021;7(1):00928–2020.
73. Serino M, Cardoso C, Carneiro RJ, et al. OSA patients not treated with PAP - Evolution over 5 years according to the Baveno classification and cardiovascular outcomes. Sleep Med. 2021;88:1–6.
74. Catalan Serra P, Soler X. Obstructive sleep apnea and cardiovascular events in elderly patients. Expert Rev Respir Med. 2022;16(2):197–210.
75. Azarbarzin A, Sands SA, Younes M, et al. The Sleep Apnea-Specific Pulse-Rate Response Predicts Cardiovascular Morbidity and Mortality. Am J Respir Crit Care Med. 2021;203(12):1546–1555.
76. Betta M, Handjaras G, Ricciardi E, et al. Quantifying peripheral sympathetic activations during sleep by means of an automatic method for pulse wave amplitude drop detection. Sleep Med. 2020;69:220–232.
 © 2022 The Author(s). This work is published and licensed by Dove Medical Press Limited. The
full terms of this license are available at https://www.dovepress.com/terms
and incorporate the Creative Commons Attribution
- Non Commercial (unported, 3.0) License.
By accessing the work you hereby accept the Terms. Non-commercial uses of the work are permitted
without any further permission from Dove Medical Press Limited, provided the work is properly
attributed. For permission for commercial use of this work, please see paragraphs 4.2 and 5 of our Terms.
© 2022 The Author(s). This work is published and licensed by Dove Medical Press Limited. The
full terms of this license are available at https://www.dovepress.com/terms
and incorporate the Creative Commons Attribution
- Non Commercial (unported, 3.0) License.
By accessing the work you hereby accept the Terms. Non-commercial uses of the work are permitted
without any further permission from Dove Medical Press Limited, provided the work is properly
attributed. For permission for commercial use of this work, please see paragraphs 4.2 and 5 of our Terms.