")
Back to Journals » Clinical Ophthalmology » Volume 18
Impact of Clinician Subjectivity on the Assessment of Dry Eye Disease Prevalence in a UK Public Health Care Patient Population
Authors Sullivan BD, Smith GT, Gupta A, Harman F, Ansari E
Received 28 November 2023
Accepted for publication 15 February 2024
Published 8 March 2024 Volume 2024:18 Pages 743—753
DOI https://doi.org/10.2147/OPTH.S452149
Checked for plagiarism Yes
Review by Single anonymous peer review
Peer reviewer comments 2
Editor who approved publication: Dr Scott Fraser
Benjamin D Sullivan,1 Guy T Smith,2 Arun Gupta,3 Francesca Harman,4 Ejaz Ansari5
1Trukera Medical, Southlake, TX, USA; 2The Great Western Hospital NHS Trust, Swindon, UK; 3Ashford and St Peters NHS Trust, Ashford, UK; 4Hillingdon Hospital NHS Foundation, Uxbridge, UK; 5Department of Ophthalmology, Maidstone & Tunbridge Wells Hospitals, Maidstone, Kent, UK
Correspondence: Benjamin D Sullivan, Email [email protected]
Purpose: To understand the impact of subjectivity on diagnosis rates of dry eye disease (DED) in an unbiased population.
Patients and Methods: A multicenter study enrolled 818 subjects with complete report forms (465 females, 67.1 ± 16.7 years, 353 males, 65.0 ± 15.9 years). Subjects were evaluated for staining, TBUT, tear osmolarity, meibomian gland disease, and OSDI.
Results: Physicians diagnosed 48.7% of subjects as having DED, ranging from 42.9% to 62.3% between sites. Positivity rates for staining (≥ grade 1) ranged from 41.3% to 84.1% (mean = 0.8 ± 0.9 grade), TBUT (< 10s) ranged from 39.1% to 61.6% (mean = 10.4 ± 6.6 seconds), osmolarity (> 308 mOsm/L) ranged from 63.7% to 72.4% (mean = 319.7 ± 20.8), MGD grading ranged from 28.9% to 51.3% (mean = 0.5 ± 0.7), and symptoms measured by OSDI ranged from 57.6% to 71.0% (mean = 23.5 ± 20.5) between sites. Tear osmolarity was the most consistent between sites (max/min positivity = 114%), followed by OSDI (123%), TBUT (158%), MGD (178%), and staining (204%). DED markers were uncorrelated (average r2 = 0.05 ± 0.07). A substantial number of subjects (N = 110) exhibited positive symptoms (OSDI = 32.4 ± 15.7) and hyperosmolarity (338.1 ± 20.1 mOsm/L) but no other obvious signs of DED (MGD grade = 0.2 ± 0.4, TBUT = 13.5 ± 7.0 seconds, staining grade = 0.4 ± 0.5).
Conclusion: Subjective signs of DED varied considerably, whereas objective measurements of OSDI and osmolarity were the most consistent between sites. A large proportion of subjects exhibited high symptoms and hyperosmolarity but no other obvious signs of dry eye disease, most of whom were undiagnosed by clinical assessment without access to the osmolarity measurement.
Keywords: corneal fluorescein staining, dry eye disease, meibomian gland disease, tear osmolarity, hyperosmolarity
Introduction
In the past decade since tear osmolarity has become more widely available in the clinic, there have been conflicting reports about the utility of the biomarker. There is broad agreement that hyperosmolarity is a potent cellular stress that negatively impacts corneal and conjunctival epithelial cells. Increasing levels of hyperosmolarity cause an increase in epithelial apoptosis through cytochrome c, capspase-3, JNK and ERK expression,1 as well as cornification of epithelial cells through increased transglutaminase activity.2 Hyperosmolarity is also a potent pro-inflammatory signal, causing increased secretion of IL-1ß, IL-6, IL-8, TNF-A, and MMP-9 from the ocular surface.3–5 A sophisticated co-culture model of the human ocular surface was able to replicate the core features of dry eye disease including elevated staining, reduced tear film breakup time (TBUT), increased cytokine and TLR-4 expression, increased NF-kB translocation and reduced lubricin expression, solely by exposure to hyperosmolarity caused by an elevated evaporation rate.6 Hyperosmolarity is also known to directly impact corneal nerves to interrupt synaptic action potentials, to fundamentally alter nerve sensitivity, and affect morphology in a dose dependent manner.7–9 These and other factors have lead to the acceptance that tear hyperosmolarity is a core pathogenic mechanism in dry eye disease.10
Numerous studies have also demonstrated the clinical utility of tear osmolarity. A recent review of 163 articles regarding tear osmolarity, found that 72% of all articles had a positive impression, 21% neutral and 7% reported a negative impression of its clinical utility.11 Importantly, the rate of positivity was independent of industry financial support, with 72% (75/104) of the independent studies rating positive.11 In addition to reports detailing its value in diagnosing DED,12–14 tracking therapeutic efficacy,15–20 and grading DED severity,21–23 tear osmolarity has been found to be important in planning for cataract surgery, as hyperosmolar tears can introduce significant variation in keratometry measurements24 and cause significant unexpected refractive error along with a seven-fold increase in patient dissatisfaction.25 Hyperosmolarity assessment has also found utility in testing asymptomatic diabetics,26 oculoplastics,27 tracking ocular surface outcomes in orthokeratology28 and monitoring the health of the ocular surface following refractive surgery.29
By contrast, a series of studies have proclaimed that tear osmolarity has little to no clinical value.30–41 Common themes were the lack of correlation between tear osmolarity and other clinical measures of dry eye disease such as corneal fluorescein staining, tear film breakup time (TBUT) and meibomian gland evaluation30–37 and the test-to-test variability of the marker.38–41 When criticizing osmolarity, these studies do not independently evaluate the aforementioned signs on their own, with relatively few studies that quantify the test-to-test variation of staining or TBUT – nor do they recognize that the DEWS II consensus on diagnosis suggests each of these tests be performed,42 given the difficulty in making a diagnosis of DED. Diagnosis is especially challenging in patients with mild to moderate severity, part of which is the subjectivity in grading these signs, and the inevitable conflicts between signs and symptoms that arise in that population.21
It is the purpose of this study to examine the relative correlation and variation of osmolarity against the most commonly used DED signs and symptoms to better understand the critiques of the marker in such a context. These data are particularly relevant for clinical trial design, defining dry eye disease, how to value novel biomarkers in DED, and understanding the dichotomous aspects of tear osmolarity in the literature.
Materials and Methods
A non-randomized prevalence study recruited consecutive patients at four different UK NHS Hospital Ophthalmology clinics. This study was designed with broad inclusion criteria. Subjects 18 years and above presenting to the clinics were invited to participate. Those who agreed and signed the relevant information and consent form were enrolled in the study. Subjects were excluded if they had used eye drops within 2 hours of their appointment so as not to interfere with the dry eye assessments. Each site was asked to enroll up to 250 subjects. Consultants participating in the study adhered to Good Clinical Practice guidelines and followed the tenets of the Declaration of Helsinki. The study was approved by the UK National Research Ethics Service, NRES Committee South East Coast – Surrey.
Following subject demographics, history and ocular surface disease index (OSDI) symptom questionnaire, bilateral tear osmolarity measurements (TearLab Osmolarity System, San Diego USA) were performed prior to other assessments to avoid interrupting tear film homeostasis. Bilateral Oxford corneal fluorescein staining (grades 0–4), manual fluorescein tear film breakup time measured in seconds using a stopwatch and meibomian gland dysfunction on a 0–3 subjective scale representing none (0), mild (1), moderate (2) and severe disease (3), were evaluated. Consultant ophthalmologists that indicated their assessment of dry eye were masked to the tear osmolarity results, but could use any available clinical information in making their diagnosis. Subjects were then exited from the study and continued with their scheduled appointments. TBUT, MGD & corneal fluorescein staining tests required a doctor’s interpretation and were, by our definition, subjective. Osmolarity and OSDI, where the measurement instrument did not change between sites, should not be significantly different if the distribution of patients is similar across sites and are considered objective.
Descriptive statistics for the biomarkers were calculated between sites in an effort to understand the impact of observer subjectivity on each of the dry eye markers. The more severe eye from each patient was used in the analysis of each marker. Diagnostic cutoffs at mild and moderate disease thresholds were assessed for each marker (Table 1).13,21 Mild fluorescein staining was evaluated ≥ grade 1 and moderate staining ≥ grade 2. Mild TBUT was set at <10 seconds and moderate TBUT ≤7 seconds. The mild osmolarity cutoff was >308 mOsm/L and the moderate osmolarity cutoff was >316 mOsm/L. MGD grading thresholds were ≥ grade 1 and ≥ grade 2. Symptoms as measured by OSDI were considered mild with a score ≥ 13 and moderate ≥ 23. Histograms of the number of mild and moderate signs according to the aforementioned thresholds were calculated across all sites. Distributions of each sign were plotted against OSDI symptoms to understand the predictive value of patient input.
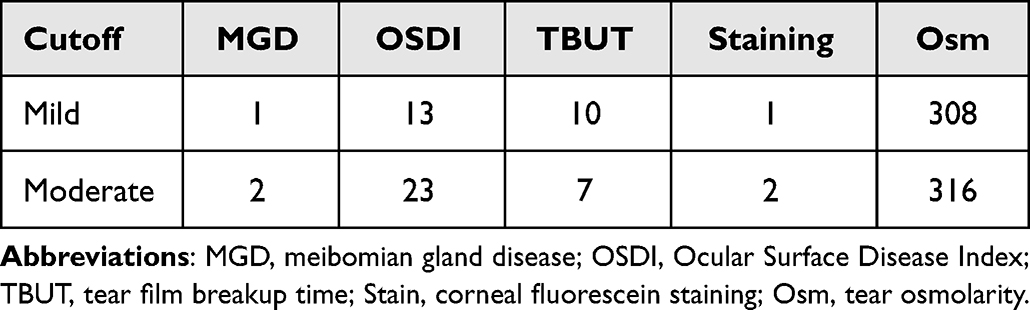 |
Table 1 Mild, Moderate Cutoffs for Dry Eye Disease Markers |
The diagnostic performance of DED signs and symptoms were explored by sequentially omitting one of the biomarkers, then using the remainder of the included markers to define normal from dry eye subjects, similar to the method of Tashbayev et al.32 When incorporated into the inclusion criteria, mild thresholds of MGD ≥ grade 1, OSDI ≥ 13, TBUT < 10 seconds, staining ≥ grade 1, and osmolarity >308 mOsm/L were used. Bonferroni’s method was used to adjust t-test values for multiple comparisons. Pearson’s correlation coefficients were calculated for each marker and against Consultant diagnosis to help elucidate interactions between the markers.
Results
A total of 818 subjects with complete data sets were included in the study, with 465 females aged 67.1 ± 16.7 years, and 353 males aged 65.0 ± 15.9 years. A total of 189 subjects were seen at The Great Western Hospital, 245 subjects at Hillingdon Hospital, 69 subjects at Medway Maritime Hospital, and 315 subjects at St. Peter’s Hospital. A total of 308 subjects were currently taking some form of medicinal eye drop, while 510 reported no data on drops. A total of 378 subjects had some form of surgery, whether cataract (299), laser vision correction (47), or trabeculectomy (19), with the remainder reporting a rare type of surgery below statistical analysis thresholds, including ectropion repair, entropion repair, detached retina, tumor removal, iridotomy, corneal grafts, foreign object removal, ptosis surgery, chalazion, and pupilloplasty. Contact lens use was reported in 43 subjects.
Site-to-site differences in dry eye markers are shown in Table 2. Each site showed a similar mild to moderate patient population. There were statistically significant site-to-site differences in each sign. MGD grading was lower in sites 3 and 4 compared to sites 1 and 2, TBUT was significantly lower at site 2 compared to site 1 and 4, corneal staining was higher at sites 2 and 3 as compared to sites 1 and 4, and osmolarity was higher at site 4 than sites 1 and 2, all p < 0.05.
 |
Table 2 Averages of Each Dry Eye Disease Marker by Site. |
Based on the presenting signs and symptoms, with the exclusion of tear osmolarity to which they were masked, consultant ophthalmologists reported a range of diagnosis rates for DED from 42.9% to 62.3%, with a mean of 48.7% across all sites. Positivity rates for each of the DED markers are shown in Table 3. Fluorescein staining gave positivity rates of 41.3% to 84.1% (57.6% averaged across all sites) for the mild threshold ≥ grade 1, and 10.6% to 40.6% (19.8% averaged across all sites) for the moderate threshold of ≥ grade 2. TBUT ranged from 39.1% positive to 61.6% positive for subjects <10 seconds (50.4% of all subjects), while at the moderate threshold of ≤ 7 seconds the TBUT positivity ranged from 23.2% to 49.8% (33.7% average across all sites). For the mild threshold of tear osmolarity >308 mOsm/L, positivity rates ranged from 63.7% to 72.4% (67.4% averaged across all sites), and the moderate threshold of >316 mOsm/L ranged from 35.1% to 56.8% positive (45.7% overall). Mild MGD ≥ grade 1 ranged from 28.9% to 51.3% (40.7% overall), while moderate thresholds of MGD ≥ grade 2 reported lower percentages of positive patients, ranging from 1.4% to 17.5% (10.5% overall). Symptoms, as measured by OSDI ≥ 13 varied between sites from 57.6% to 71.0% (60.8% overall), and at a moderate threshold of OSDI ≥ 23, symptom positivity ranged from 38.8% to 49.3% (41.8% across the sites). At the mild thresholds, the ratio of maximum to minimum positivity between sites showed tear osmolarity to be the least variable (114%), followed by OSDI (123%), TBUT (158%), MGD (178%) and staining (204%). At the moderate thresholds, the ratio of maximum to minimum positivity between sites showed OSDI (127%) to be the least variable, followed by tear osmolarity (162%), TBUT (215%), staining (383%) and MGD (1205%).
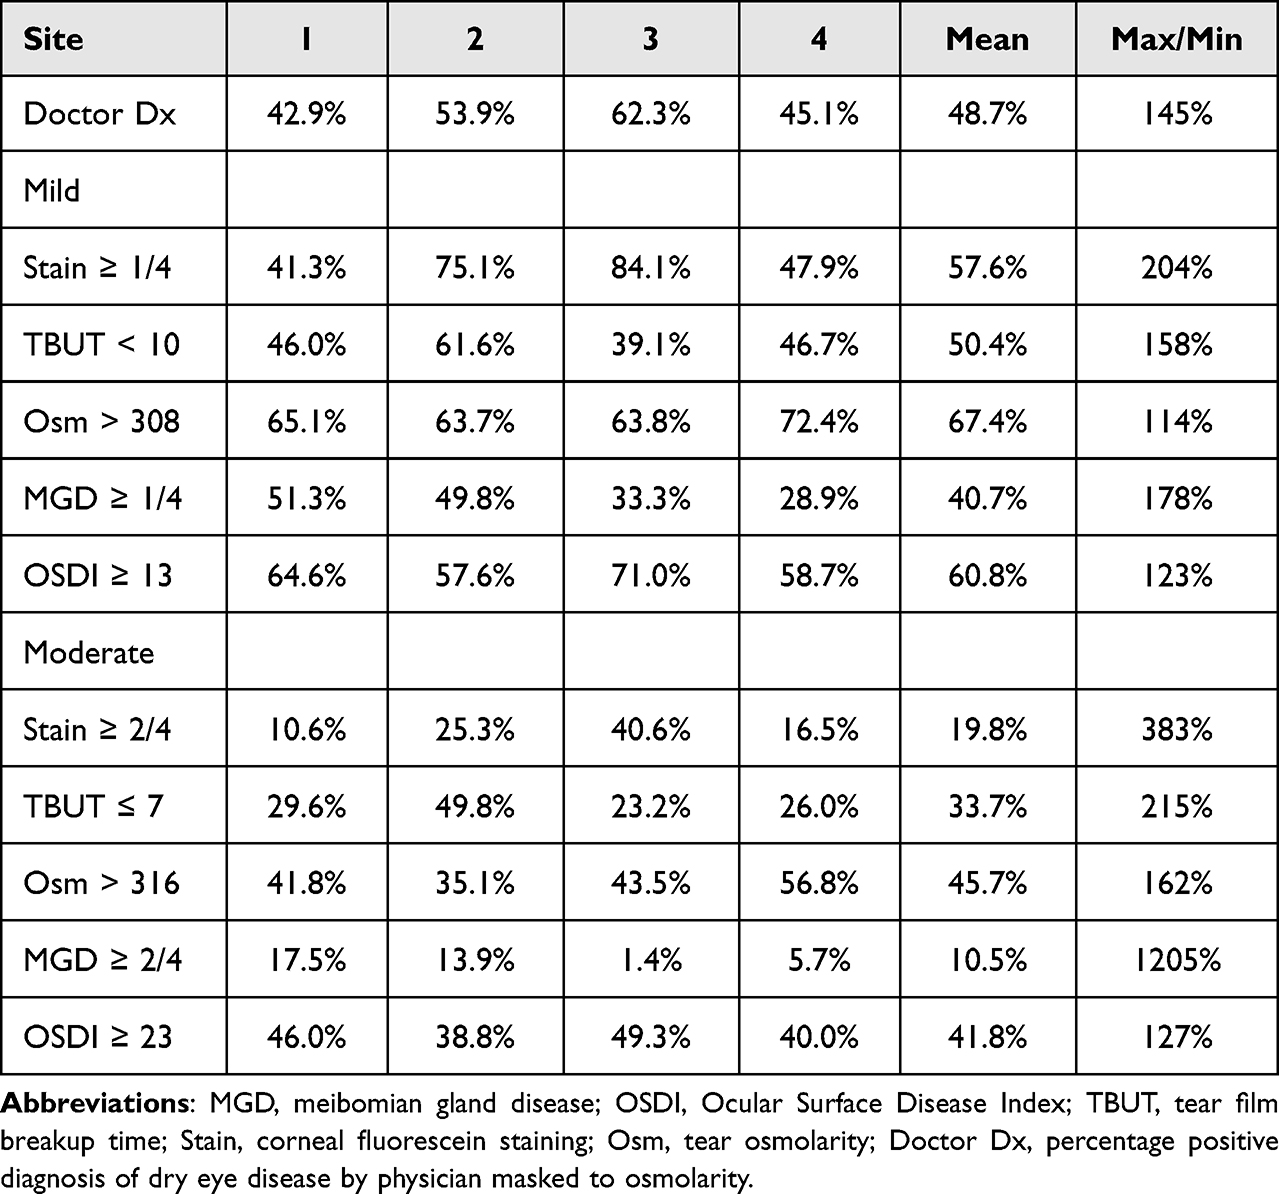 |
Table 3 Positivity Rates for Dry Eye Disease Markers |
A histogram of the dry eye measurements is shown in Figure 1, with the percentage of all patients compared to the number of observed mild or moderate assessments. The most common patient profile was a subject with one moderate sign or symptom (37.3%), followed by subjects with two mild signs/symptoms (26.0%) or two moderate signs/symptoms (26.0%). A very small fraction (2.4%) of subjects reported no sign or symptoms at all, and only 20.0% of subjects reported no moderate signs/symptoms, demonstrating that evidence of DED is highly prevalent within the general clinical population.
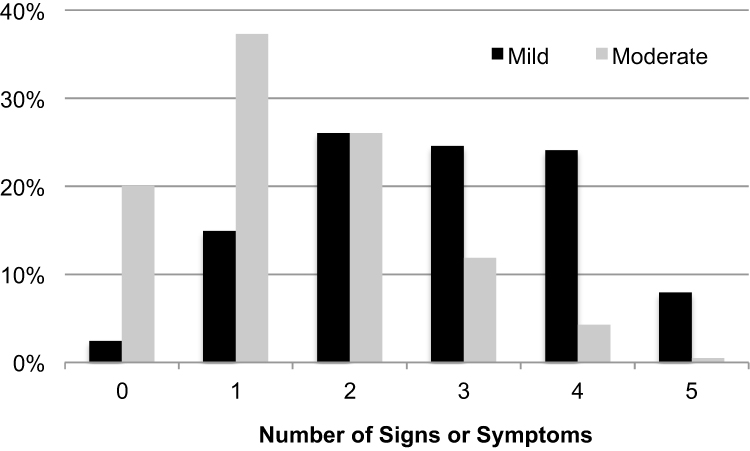 |
Figure 1 Histogram of all subjects broken down by number of mild symptoms (black), and number of moderate symptoms (light gray). |
Figure 2 shows the distribution of each classical dry eye sign against OSDI as the independent variable. The data shows no clinically meaningful relationship between any of the measurements and symptom severity; with an approximately equal chance of exhibiting either very little staining or strongly elevated staining for both asymptomatic and highly symptomatic subjects. This observation was found to be consistent for TBUT, osmolarity and MGD, establishing that these variables are orthogonal across the broad population, and that symptom intensity has no predictive power as to whether the patient will present with any of the dry eye signs.
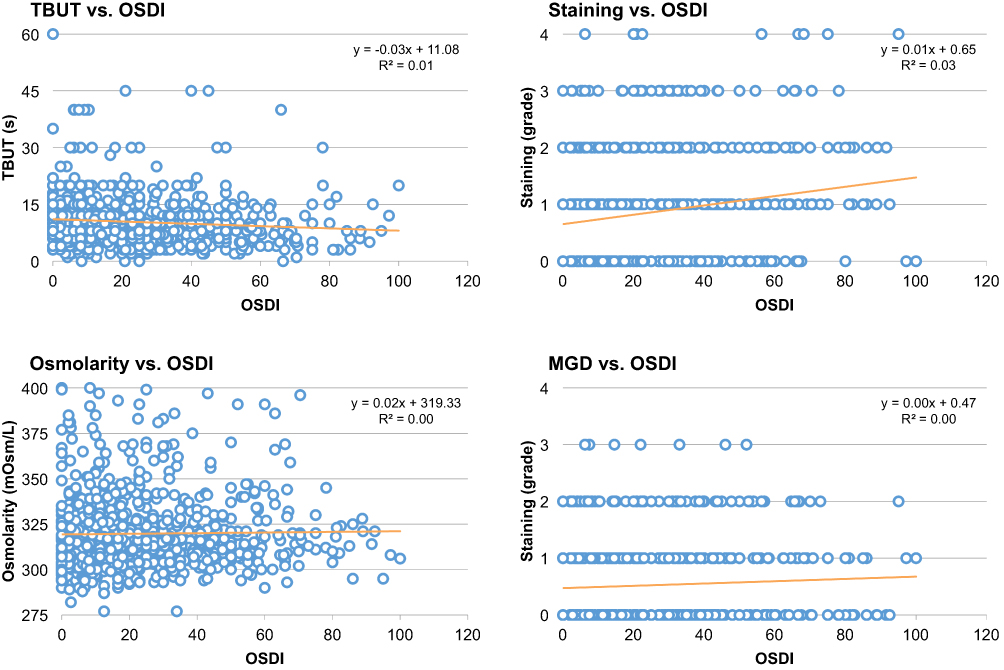 |
Figure 2 Scatterplots of ocular surface disease signs plotted against OSDI symptoms. There is no clinically meaningful relationship between any of the measurements and symptom severity. |
To quantify the predictive power between the signs, Table 4 shows the inter-marker correlations across the entire subject population. As with the OSDI score, there were no clinically meaningful associations between any of the markers (average r2=0.05±0.07), except for fluorescein staining and fluorescein TBUT which showed a small but not clinically meaningful correlation of −0.30 (p < 0.001), ostensibly because a single instillation of fluorescein is used to assess both markers consecutively during a single exam and some dependency on retained dye is expected. The consultant ophthalmologist diagnosis correlated most strongly with staining at r = 0.51 and TBUT r = −0.37, followed by MGD r = 0.24 and OSDI r = 0.18 (all p < 0.001). As osmolarity was masked to the physician, there was no correlation to the diagnosis (r = 0.01, p = 0.869).
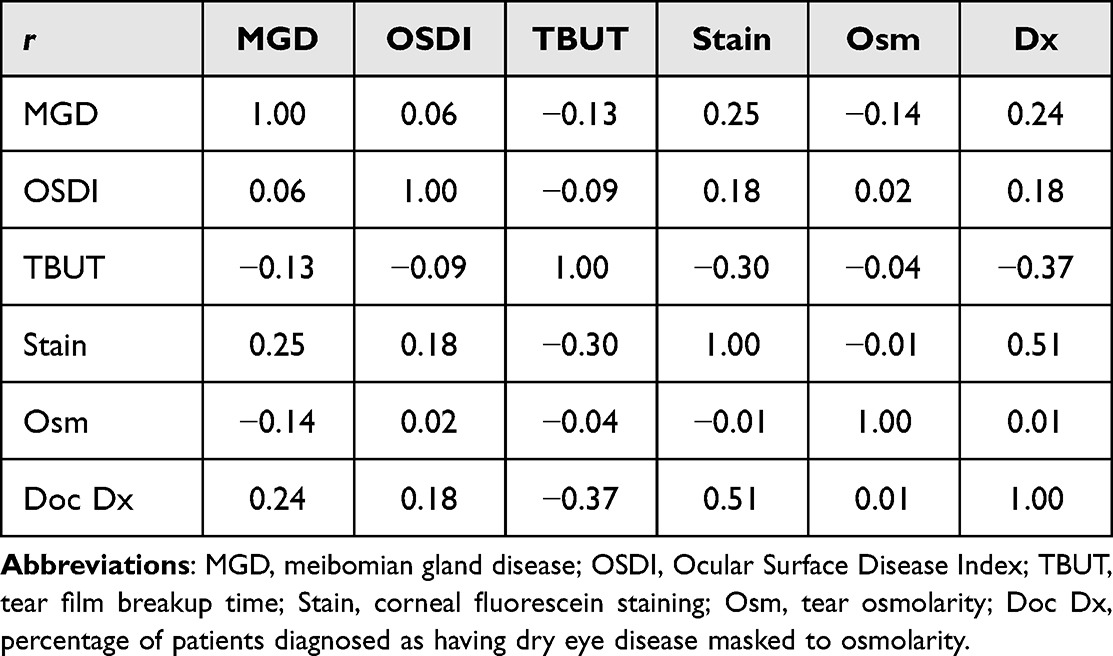 |
Table 4 Pearson Correlation Coefficients Between Dry Eye Disease Markers. |
Borderline cases in which only one sign was evident with symptoms (OSDI ≥ 13) or cases where at least one sign was evident without symptoms (OSDI < 13) are shown in Table 5. The most common type of patients in the symptomatic subset were subjects with symptoms and hyperosmolarity but no other mild (N = 67, 8.2% of study population) or moderate signs (N = 110, 13.4% of study population). Without the benefit of osmolarity to guide diagnosis, physicians identified a small percentage of these subjects as DED with 11.9% of the mild and 35.5% of the moderate subjects being diagnosed. In the few cases where staining was the only evident mild (N = 17, 2.1% of study population) or moderate sign (N = 23, 2.8% of study population), clinicians elected to diagnose DED at 52.9% and 73.9% respectively, reflecting the well known reliance on staining for DED diagnosis. Subjects with zero to low symptoms (OSDI < 13) frequently exhibited one or more signs of DED, with at least one mild sign (N = 301, 36.8% of study population), at least two mild signs (N = 206, 25.2% of study population), or at least one moderate sign (N = 207, 25.3% of study population) accounting for over 1 in 4 subjects that completed the study. Despite clinical evidence of one or more dry eye signs, these cases were diagnosed at rates of 41.5%, 52.9% and 47.8% respectively, close to a coin flip in terms of chance.
 |
Table 5 Borderline Cases in Which Only One Sign Was Evident with Apparent Symptoms (OSDI ≥ 13) or Signs Were Evident Without Symptoms (OSDI < 13) |
Given the lack of clinically meaningful relationship between the markers, the impact of inclusion criteria on the diagnostic performance of the markers is shown in Table 6. None of the measures could usefully differentiate normal and DED patients if that same marker was not part of the inclusion criteria. When TBUT was absent from the inclusion criteria, normal subjects averaged 13.1 ± 9.2 seconds as compared to 11.1 ± 6.7 seconds for the DED subjects (p = 0.295), with dry eye subjects reporting mean values above the mild TBUT threshold. Similarly, when excluded from inclusion criteria, tear film osmolarity averaged 318.4 ± 18.3 and 319.9 ± 21.1 mOsm/L for normal and dry eye subjects, respectively (p = 1.000). When MGD grading was not part of inclusion criteria, normal subjects reported a higher MGD score (grade 0.6 ± 0.7) than DED subjects (grade 0.5 ± 0.7, p = 1.000). Symptoms as measured by OSDI were unable to statistically distinguish normal subjects (19.9 ± 19.4) from DED (23.7 ± 20.5, p = 0.854) if OSDI scores were not part of the inclusion criteria. When excluded, staining showed grade 0.4 ± 0.6 for normal and grade 0.8 ± 0.8 for DED, which, while statistically significant (p = 0.034 without multiplicity correction, p = 0.17 with Bonferroni), both groups were lower than the mild cutoff, and the difference between groups was below the resolution of staining measured in the clinic.
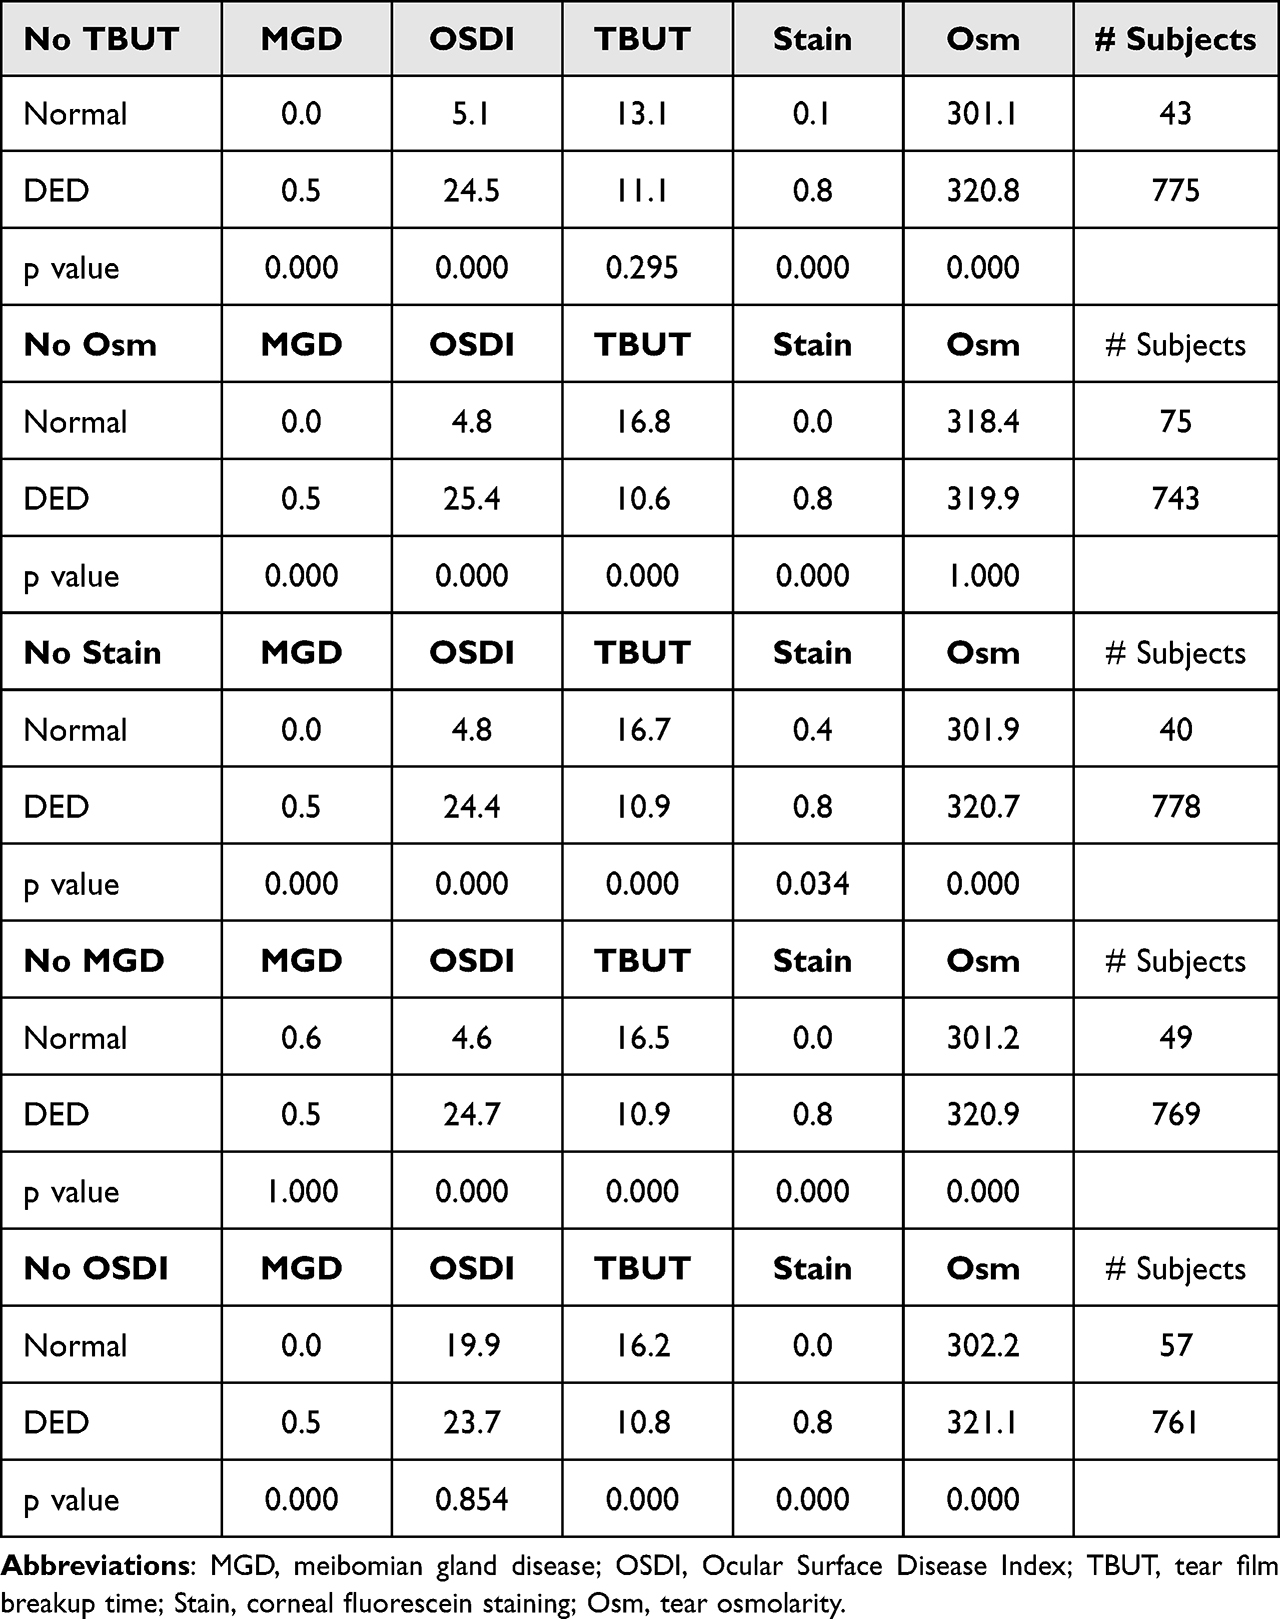 |
Table 6 Dependence on Inclusion Criteria for Distribution Dry Eye Biomarkers |
Discussion
This study evaluated the performance of DED tests within the general population of patients presenting to NHS hospitals. The objective tests of tear osmolarity and OSDI were observed to be more repeatable across sites (Table 3) as compared to the subjective tests of corneal fluorescein staining, TBUT and MGD. This finding supports the hypothesis that the distribution of disease severity was similar across the four sites, and that the variation in interpretation between tests was due primarily to the differing opinion of the consultants. An earlier study examining the longitudinal variability of these same markers also found that osmolarity and OSDI were less variable than their subjective counterparts,20 although that study did not control for site-to-site variation.
The results of this study are particularly relevant for clinical trial design, where sponsors often rely upon subjective grading of corneal staining as a primary endpoint. Corneal staining is subject to variations from the amount of fluorescein instilled, the amount of fluorescein retained due to tear turnover rates, the time of assessment since fluorescein instillation, slit lamp illumination intensity and filter selection.43 The wide variation in site-to-site corneal staining results herein echo other studies that examined staining variability, e.g., those reported in Kourukmas R et al, which found only a marginal intra-rater agreement (Cohens-Kappa = 0.436) for corneal specialists with 6–29 years of experience, with the majority of specialists below K = 0.7 for mirrored images within the same grading session.44 Despite such variation, clinicians most closely associated corneal staining with DED diagnosis in this study (Table 4), preferentially relying on staining (r = 0.51) over TBUT (r = −0.37) or symptoms (r = 0.18) when making a diagnosis. Subjects with no other signs of the disease and mild staining were diagnosed at over twice the rate as compared other signs with symptoms (Table 5). Accordingly, rates of DED inclusion to a clinical trial could range from 10.6% to 84.1% depending on the site to which a subject presents and whether the trial protocol uses a grade 1 or grade 2 threshold. Staining remains both the most relied upon42 marker and one of the most widely varying and subjective tests for DED.
MGD positivity rates ranged from 1.4% to 51.3% of subjects between sites, depending on whether grade 2 or 1 was used. While a widely cited study is often misquoted to suggest that 86% of all DED subjects have MGD,45 the denominator of that figure excluded the substantial number of patients that were deemed to have DED, but could not be classified as either aqueous deficient or evaporative due to the lack of observable meibomian gland abnormalities or low Schirmers results. When all DED subjects were included, Lemp MA et al found that 60.7% (136/224) of the recruited dry eye subjects had some level of observable MGD,45 which is closer to the 51.3% found in the current study. The implications of this perspective are profound, since the oft misquoted, co-opted marketing message of 86% of patients having MGD does not include the finer detail that of the entire population of DED patients, more likely somewhere between one-third to one-half have causative MGD, where the disease is sufficiently impactful to initiate a dry eye state.
In this study, 21.6% (177/818) of all subjects presenting to the NHS hospitals exhibited hyperosmolarity and elevated OSDI, with no other clinically observable signs of dry eye disease. An earlier investigation found 29% (65/224) of subjects in a multi-site US study followed this same pattern.45 The prevalence of these symptomatic hyperosmolar subjects was over three times that of the short TBUT type of dry eye in this study (56/818, Table 5), where the ocular surface appears completely normal, but the tear film can be compromised and accompany significant symptoms.46 Since hyperosmolarity is not observable at a slit lamp, clinicians in this study diagnosed only a fraction of these patients without access to the osmolarity result.
Similar to how short TBUT DED is classified as its own subtype of the disease,46 it is becoming clear that the symptomatic hyperosmolar cohort, without other signs, should also be considered as its own classification. In one recent study, in a cataract surgery setting this type of patient (321.0 ± 9.7 mOsm/L, 9.0 ± 1.7 second TBUT, 88% subjects grade 0–1 corneal staining, 71% symptomatic) showed significantly worse uncorrected visual acuity (0.89 ± 0.12 vs 0.76±.14, p < 0.01), significantly worse spherical equivalent (0.60 ± 0.34 vs 0.28 ± 0.25, p < 0.01) and a 10% rate of >1.0 diopter misses from target compared to 0% in a normal group (298.2 ± 7.6 mOsm/L, 87.5% asymptomatic).25 In addition, while 62.5% of the normal population was within 0.5 D of target, only 26.8% of the hyperosmolar group achieved that target.25 Another study of symptomatic, hyperosmolar patients (327.6 ± 2.8 mOsm/L, 34.6 ± 2.1 OSDI, 0.51 ± 0.1 staining, 8.1 ± 0.8 TBUT, 11.8 ± 1.5 Schirmers) found significantly lower corneal stromal reflectivity as measured by OCT in hyperosmolar eyes relative to controls (p < 0.05) and significantly thinner central corneal thickness in the upper quartile of hyperosmolar eyes (539.1 ±7.4 µm than in control eyes (583.1 ±15.0 µm, P = 0.02) or in the lower quartile of hyperosmolar subjects (622.7 ± 5.8 µm, P < 0.0001).47 In the absence of other observable signs of dry eye disease, hyperosmolarity is, by itself, predictive of surgical complications and altered corneal phenotypes.
The current study also reinforces the observation that dry eye signs are uncorrelated across the general population.48,49 As such, comparing osmolarity to a basket of other markers is problematic when there is no predictive information contained within the other measurements. This is known as selection bias. The 2017 TFOS DEWS II Diagnostic Methodology report states: “Selection bias occurs when efficacy of metrics that were used in the selection and differentiation of subjects are directly compared to a novel test that was not used as part of the inclusion criteria… Many biomarkers … provide novel insight into disease pathogenesis, but because this information is unavailable from clinical observation, comparing performance of novel diagnostic metrics against the traditional signs such as staining, TBUT and symptoms will result in an apparently poor performance”.42 Selection bias creates a false standard against which new markers are measured, as can be seen in several studies which presented largely predetermined results based on the selection bias inherent to the study design.30–33,35–37 Tashbayev et al used a near identical approach to Table 6 of this study, comparing subjects with OSDI ≥ 13, presence of staining, MGD, abnormal TBUT and Schirmer tests to osmolarity.32 Being the only non-included marker, osmolarity did not differentiate the statistically defined groups.32 Similarly, Szalai et al (≥2 of Schirmer <10 mm, TBUT < 10 seconds, fluorescein staining > 4 bright spots)35 and Messmer (≥ 3 of OSDI score >15, staining ≥ 1, TBUT < 7 seconds, Schirmer test < 7 mm, presence of blepharitis/meibomitis)30 excluded osmolarity from a statistical definition of DED and again found that osmolarity did not differentiate those groups as defined. Notably, similar to Figure 1 of this study, Messmer reported that in the “normal” group, only 16 of 200 patients showed no signs or symptoms of DED and in 71 control subjects, up to 2 signs/symptoms of DED were obvious.30 Owing to the poor correlation of dry eye markers, it is a mathematical certainty that osmolarity would not perform well in such a statistical tautology, as do any of the dry eye markers when excluded from the definition of the disease (Table 6). Accordingly, the frequently repeated criticism that osmolarity does not correlate to other markers30–37 is invalid since none of the markers correlate (Table 4). More specifically, if osmolarity did correlate strongly with staining or TBUT, there would be no additional information gained in its measurement. Criticism based on a lack of correlation offers little insight into the value of tear osmolarity or any other test evaluated in such a manner.
Rather, we suggest that novel biomarkers are best evaluated by their relevance to surgical decision making, ability to predict and track an effective therapeutic response and consistency across different clinical sites of similar demographics. Based on the current findings and existing body of literature, osmolarity remains a unique, objective biomarker that provides information not otherwise available by clinical observation alone and can meaningfully supplement clinical opinion in a variety of ophthalmic disease states.
Conclusion
A large fraction of subjects exhibit high symptoms and hyperosmolarity but no other observable signs of dry eye disease, the majority of whom were undiagnosed by clinical assessment without the benefit of tear osmolarity. Subjective signs of DED varied considerably, whereas objective measurements of OSDI and osmolarity were the most consistent between sites.
Acknowledgment
TearLab supplied the test chips for osmolarity measurement.
Disclosure
Arun Gupta, Francesca Harman and Ejaz Ansari have no conflicts of interest to disclose for this work. Guy Smith received speaker fees and travel support from TearLab. Benjamin D Sullivan discloses financial interests in TearLab Research Corp. and is an employee and stock holder of Trukera Medical. In addition, Benjamin D Sullivan also reports patent (no: 8713997) issued to Trukera Medical with royalties received.
References
1. Luo L, Li DQ, Pflugfelder SC. Hyperosmolarity-induced Apoptosis in Human Corneal Epithelial Cells Is Mediated by Cytochrome C and MAPK Pathways. Cornea. 2007;26(4):452–460. doi:10.1097/ICO.0b013e318030d259
2. Chen Z, Tong L, Li Z, et al. Hyperosmolarity-induced cornification of human corneal epithelial cells is regulated by JNK MAPK. Invest Ophthalmol Vis Sci. 2008;49(2):539–549. doi:10.1167/iovs.07-0569
3. Luo L, Li DQ, Corrales RM, Pflugfelder SC. Hyperosmolar saline is a proinflammatory stress on the mouse ocular surface. Eye Contact Lens. 2005;31(5):186–193. doi:10.1097/01.icl.0000162759.79740.46
4. Igarashi T, Fujimoto C, Suzuki H, et al. Short-time exposure of hyperosmolarity triggers interleukin-6 expression in corneal epithelial cells. Cornea. 2014;33(12):1342–1347. doi:10.1097/ICO.0000000000000256
5. Zibandeh N, Yıldız E, Özer B, Taş AY, Sahin A. Androgen Suppresses Hyperosmolarity-Induced Inflammatory Mediators in Human Corneal Epithelial Cells. Cornea. 2020;39(7):886–891. doi:10.1097/ICO.0000000000002291
6. Seo J, Byun WY, Alisafaei F, et al. Multiscale reverse engineering of the human ocular surface. Nat Med. 2019;25(8):1310–1318. doi:10.1038/s41591-019-0531-2
7. Hirata H, Mizerska K, Marfurt CF, Rosenblatt MI. Hyperosmolar Tears Induce Functional and Structural Alterations of Corneal Nerves: electrophysiological and Anatomical Evidence Toward Neurotoxicity. Invest Ophthalmol Vis Sci. 2015;56(13):8125–8140. doi:10.1167/iovs.15-18383
8. Parra A, Gonzalez-Gonzalez O, Gallar J, Belmonte C. Tear fluid hyperosmolality increases nerve impulse activity of cold thermoreceptor endings of the cornea. Pain. 2014;155(8):1481–1491. doi:10.1016/j.pain.2014.04.025
9. Hirata H, Rosenblatt MI. Hyperosmolar tears enhance cooling sensitivity of the corneal nerves in rats: possible neural basis for cold-induced dry eye pain. Invest Ophthalmol Vis Sci. 2014;55(9):5821–5833. doi:10.1167/iovs.14-14642
10. Bron AJ, de Paiva CS, Chauhan SK, et al. TFOS DEWS II pathophysiology report. Ocul Surf. 2017;15(3):438–510. doi:10.1016/j.jtos.2017.05.011
11. Potvin R, Makari S, Rapuano CJ. Tear film osmolarity and dry eye disease: a review of the literature. Clin Ophthalmol. 2015;9:2039–2047. doi:10.2147/OPTH.S95242
12. Versura P, Profazio V, Campos EC. Performance of tear osmolarity compared to previous diagnostic tests for dry eye diseases. Curr Eye Res. 2010;35(7):553–564. doi:10.3109/02713683.2010.484557
13. Lemp MA, Bron AJ, Baudouin C, et al. Tear osmolarity in the diagnosis and management of dry eye disease. Am J Ophthalmol. 2011;151(5):792–798.e1. doi:10.1016/j.ajo.2010.10.032
14. Jacobi C, Jacobi A, Kruse FE, Cursiefen C. Tear film osmolarity measurements in dry eye disease using electrical impedance technology. Cornea. 2011;30(12):1289–1292. doi:10.1097/ICO.0b013e31821de383
15. Pepose JS, Qazi MA, Devries DK. Longitudinal changes in dry eye symptoms and signs following lifitegrast therapy and relationship to tear osmolarity. Clin Ophthalmol. 2019;13:571–579. doi:10.2147/OPTH.S196593
16. Montani G. Intrasubject tear osmolarity changes with two different types of eyedrops. Optom Vis Sci. 2013;90(4):372–377. doi:10.1097/OPX.0b013e318288bdbe
17. Benelli U, Nardi M, Posarelli C, Albert TG. Tear osmolarity measurement using the TearLab Osmolarity System in the assessment of dry eye treatment effectiveness. Cont Lens Anterior Eye. 2010;33(2):61–67. doi:10.1016/j.clae.2010.01.003
18. Janulevičienė I, Derkač I, Grybauskiene L, Paulauskaitė R, Gromnickaite R, Kuzmienė L. Effects of preservative-free tafluprost on tear film osmolarity, tolerability, and intraocular pressure in previously treated patients with open-angle glaucoma. Clin Ophthalmol. 2012;6:103–109. doi:10.2147/OPTH.S28104
19. Epitropoulos AT, Donnenfeld ED, Shah ZA, et al. Effect of Oral Re-esterified Omega-3 Nutritional Supplementation on Dry Eyes. Cornea. 2016;35(9):1185–1191. doi:10.1097/ICO.0000000000000940
20. Sullivan BD, Crews LA, Sönmez B, et al. Clinical utility of objective tests for dry eye disease: variability over time and implications for clinical trials and disease management. Cornea. 2012;31(9):1000–1008. doi:10.1097/ICO.0b013e318242fd60
21. Sullivan BD, Whitmer D, Nichols KK, et al. An objective approach to dry eye disease severity. Invest Ophthalmol Vis Sci. 2010;51(12):6125–6130. doi:10.1167/iovs.10-5390
22. Gagliano C, Visalli E, Toro MD, et al. Dry Eye in Systemic Sclerosis Patients: novel Methods to Monitor Disease Activity. Diagnostics. 2020;10(6):404. doi:10.3390/diagnostics10060404
23. Kim M, Kim HS, Na KS. Correlation between Tear Osmolarity and Other Ocular Surface Parameters in Primary Sjögren’s Syndrome. Korean J Ophthalmol. 2017;31(1):25–31. doi:10.3341/kjo.2017.31.1.25
24. Epitropoulos AT, Matossian C, Berdy GJ, Malhotra RP, Potvin R. Effect of tear osmolarity on repeatability of keratometry for cataract surgery planning. J Cataract Refract Surg. 2015;41(8):1672–1677. doi:10.1016/j.jcrs.2015.01.016
25. Kursite A, Laganovska G. Effect of tear osmolarity on postoperative refractive error after cataract surgery. J.ophthalmol. 2023;1(2):11–15.
26. Fuerst N, Langelier N, Massaro-Giordano M, et al. Tear osmolarity and dry eye symptoms in diabetics. Clin Ophthalmol. 2014;8:507–515. doi:10.2147/OPTH.S51514
27. Attas-Fox L, Zhang AY, Fox BD, Arthurs BP. Evaluation of tearing in oculoplastics assisted by tear osmolarity measurement. Orbit. 2014;33(5):331–335. doi:10.3109/01676830.2014.882362
28. Nieto-Bona A, Nombela-Palomo M, Felipe-Márquez G, Teus MA. Tear Film Osmolarity in Response to Long-Term Orthokeratology Treatment. Eye Contact Lens. 2018;44(2):85–90. doi:10.1097/ICL.0000000000000347
29. Kacerovská J, Kacerovský M, Hlaváčková M, Studený P. Change of tear osmolarity after refractive surgery. Cesk Slov Oftalmol. 2018;74(1):18–22.
30. Messmer EM, Bulgen M, Kampik A. Hyperosmolarity of the tear film in dry eye syndrome. Dev Ophthalmol. 2010;45:129–138. doi:10.1159/000315026
31. Gonzales JA, Shiboski SC, Bunya VY, et al. Ocular Clinical Signs and Diagnostic Tests Most Compatible With Keratoconjunctivitis Sicca: a Latent Class Approach. Cornea. 2020;39(8):1013–1016. doi:10.1097/ICO.0000000000002311
32. Tashbayev B, Utheim TP, Utheim ØA, et al. Utility of Tear Osmolarity Measurement in Diagnosis of Dry Eye Disease. Sci Rep. 2020;10(1):5542. doi:10.1038/s41598-020-62583-x
33. Karakus S, Akpek EK, Agrawal D, Massof RW. Validation of an Objective Measure of Dry Eye Severity. Transl Vis Sci Technol. 2018;7(5):26. doi:10.1167/tvst.7.5.26
34. Amparo F, Jin Y, Hamrah P, Schaumberg DA, Dana R. What is the value of incorporating tear osmolarity measurement in assessing patient response to therapy in dry eye disease? Am J Ophthalmol. 2014;157(1):69–77.e2. doi:10.1016/j.ajo.2013.07.019
35. Szalai E, Berta A, Szekanecz Z, Szûcs G, Módis L. Evaluation of tear osmolarity in non-Sjögren and Sjögren syndrome dry eye patients with the TearLab system. Cornea. 2012;31(8):867–871. doi:10.1097/ICO.0b013e3182532047
36. Caffery B, Chalmers RL, Marsden H, et al. Correlation of tear osmolarity and dry eye symptoms in convention attendees. Optom Vis Sci. 2014;91(2):142–149. doi:10.1097/OPX.0000000000000130
37. Greiner JV, Ying GS, Pistilli M, Maguire MG, Asbell PA; Dry Eye Assessment and Management (DREAM) Study Research Group. Association of Tear Osmolarity With Signs and Symptoms of Dry Eye Disease in the Dry Eye Assessment and Management (DREAM) Study. Invest Ophthalmol Vis Sci. 2023;64(1):5. doi:10.1167/iovs.64.1.5
38. Khanal S, Millar TJ. Barriers to clinical uptake of tear osmolarity measurements. Br J Ophthalmol. 2012;96(3):341–344. doi:10.1136/bjo.2011.202754
39. Bunya VY, Fuerst NM, Pistilli M, et al. Variability of Tear Osmolarity in Patients With Dry Eye. JAMA Ophthalmol. 2015;133(6):662–667. doi:10.1001/jamaophthalmol.2015.0429
40. Szczesna-Iskander DH. Measurement variability of the TearLab Osmolarity System. Cont Lens Anterior Eye. 2016;39(5):353–358. doi:10.1016/j.clae.2016.06.006
41. Baenninger PB, Voegeli S, Bachmann LM, et al. Variability of Tear Osmolarity Measurements With a Point-of-Care System in Healthy Subjects-Systematic Review. Cornea. 2018;37(7):938–945. doi:10.1097/ICO.0000000000001562
42. Wolffsohn JS, Arita R, Chalmers R, et al. TFOS DEWS II Diagnostic Methodology report. Ocul Surf. 2017;15(3):539–574. doi:10.1016/j.jtos.2017.05.001
43. Bron AJ, Argüeso P, Irkec M, Bright FV. Clinical staining of the ocular surface: mechanisms and interpretations. Prog Retin Eye Res. 2015;44:36–61. doi:10.1016/j.preteyeres.2014.10.001
44. Kourukmas R, Roth M, Geerling G. Automated vs. human evaluation of corneal staining. Graefes Arch Clin Exp Ophthalmol. 2022;260(8):2605–2612. doi:10.1007/s00417-022-05574-0
45. Lemp MA, Crews LA, Bron AJ, Foulks GN, Sullivan BD. Distribution of aqueous-deficient and evaporative dry eye in a clinic-based patient cohort: a retrospective study. Cornea. 2012;31(5):472–478. doi:10.1097/ICO.0b013e318225415a
46. Tsubota K. Short Tear Film Breakup Time-Type Dry Eye. Invest Ophthalmol Vis Sci. 2018;59(14):DES64–DES70. doi:10.1167/iovs.17-23746
47. Deinema LA, Vingrys AJ, Chinnery HR, Downie LE. Optical Coherence Tomography Reveals Changes to Corneal Reflectivity and Thickness in Individuals with Tear Hyperosmolarity. Transl Vis Sci Technol. 2017;6(3):6. doi:10.1167/tvst.6.3.6
48. Nichols KK, Nichols JJ, Mitchell GL. The lack of association between signs and symptoms in patients with dry eye disease. Cornea. 2004;23(8):762–770. doi:10.1097/01.ico.0000133997.07144.9e
49. Sullivan BD, Crews LA, Messmer EM, et al. Correlations between commonly used objective signs and symptoms for the diagnosis of dry eye disease: clinical implications. Acta Ophthalmol. 2014;92(2):161–166. doi:10.1111/aos.12012
 © 2024 The Author(s). This work is published and licensed by Dove Medical Press Limited. The full terms of this license are available at https://www.dovepress.com/terms.php and incorporate the Creative Commons Attribution - Non Commercial (unported, v3.0) License.
By accessing the work you hereby accept the Terms. Non-commercial uses of the work are permitted without any further permission from Dove Medical Press Limited, provided the work is properly attributed. For permission for commercial use of this work, please see paragraphs 4.2 and 5 of our Terms.
© 2024 The Author(s). This work is published and licensed by Dove Medical Press Limited. The full terms of this license are available at https://www.dovepress.com/terms.php and incorporate the Creative Commons Attribution - Non Commercial (unported, v3.0) License.
By accessing the work you hereby accept the Terms. Non-commercial uses of the work are permitted without any further permission from Dove Medical Press Limited, provided the work is properly attributed. For permission for commercial use of this work, please see paragraphs 4.2 and 5 of our Terms.