Back to Journals » International Journal of Chronic Obstructive Pulmonary Disease » Volume 11 » Issue 1
Impact of air quality guidelines on COPD sufferers
Authors Liu Y, Yan S, Poh K, Liu S, Iyioriobhe E, Sterling D
Received 2 July 2014
Accepted for publication 11 February 2016
Published 21 April 2016 Volume 2016:11(1) Pages 839—872
DOI https://doi.org/10.2147/COPD.S49378
Checked for plagiarism Yes
Review by Single anonymous peer review
Peer reviewer comments 2
Editor who approved publication: Prof. Dr. Richard Russell
Youcheng Liu,1,* Shuang Yan,2,* Karen Poh,1 Suyang Liu,3 Emanehi Iyioriobhe,1 David A Sterling1
1Department of Environmental and Occupational Health Sciences, School of Public Health, University of North Texas Health Science Center, Fort Worth, TX, USA; 2Department of Endocrinology and Metabolism, Fourth Affiliated Hospital, Harbin Medical University, Harbin, Heilongjiang Province, People’s Republic of China; 3Epidemiology, Human Genetics & Environmental Sciences, School of Public Health, The University of Texas Health Science Center at Houston, Houston, TX, USA
*These authors contributed equally to this work
Background: COPD is one of the leading causes of morbidity and mortality in both high- and low-income countries and a major public health burden worldwide. While cigarette smoking remains the main cause of COPD, outdoor and indoor air pollution are important risk factors to its etiology. Although studies over the last 30 years helped reduce the values, it is not very clear if the current air quality guidelines are adequately protective for COPD sufferers.
Objective: This systematic review was to summarize the up-to-date literature on the impact of air pollution on the COPD sufferers.
Methods: PubMed and Google Scholar were utilized to search for articles related to our study’s focus. Search terms included “COPD exacerbation”, “air pollution”, “air quality guidelines”, “air quality standards”, “COPD morbidity and mortality”, “chronic bronchitis”, and “air pollution control” separately and in combination. We focused on articles from 1990 to 2015. We also used articles prior to 1990 if they contained relevant information. We focused on articles written in English or with an English abstract. We also used the articles in the reference lists of the identified articles.
Results: Both short-term and long-term exposures to outdoor air pollution around the world are associated with the mortality and morbidity of COPD sufferers even at levels below the current air quality guidelines. Biomass cooking in low-income countries was clearly associated with COPD morbidity in adult nonsmoking females.
Conclusion: There is a need to continue to improve the air quality guidelines. A range of intervention measures could be selected at different levels based on countries’ socioeconomic conditions to reduce the air pollution exposure and COPD burden.
Keywords: air pollution, biomass, chronic bronchitis, COPD, intervention
Introduction
COPD is one of the leading causes of mortality and morbidity worldwide. While cigarette smoking is the primary cause and risk factor, many other risk factors contribute to the development or exacerbation of COPD. Outdoor air pollution has been recognized for its impact on human health for centuries, and in the past 50–60 years, particularly in the past 30 years, its adverse impact on COPD sufferers has been intensively studied worldwide. Indoor air pollution using biomass fuel in low-income countries has also been found to contribute to the COPD prevalence, particularly in nonsmoking females. However, over the years, efforts have been made to regulate air pollution levels in many countries around the world, which significantly reduced exposure levels compared to earlier times. It is not very clear how these air quality standards and guidelines, particularly the current ones, impacted the COPD sufferers. This review intends to evaluate the impact of air pollution on COPD sufferers in general and the current air quality standards or guidelines on the COPD sufferers specifically. Our objective was to conduct a comprehensive and systematic literature search and review and summarize up-to-date information to present an overall picture.
Materials and methods
This article reviewed the literature on the epidemiology of COPD, air pollution and its impact on COPD sufferers, and how air quality guidelines can improve the health of COPD patients.
PubMed and Google Scholar were the main databases utilized to search for articles related to our study’s focus. Search terms included “COPD exacerbation”, “air pollution”, “air quality guidelines”, “air quality standards”, “COPD morbidity and mortality”, “chronic bronchitis”, and “air pollution control” separately and in combination. We included articles from 1990 to 2015. We also used articles prior to 1990 if they provided historic background and were relevant in understanding air pollution and COPD epidemiologic studies. While articles written in English or with an English abstract were mostly considered, articles in other languages were occasionally used if relevant, and when online, an English translation was available.
We identified 972 articles from the main databases and 750 from other sources such as Scopus and Global Health (EBSCOHost) or from the reference lists of the searched articles. We removed some duplicates and came up with 1,120 articles. These articles were further screened for relevance. We then excluded 432 articles that were irrelevant. The final full text articles further assessed were 688. We then focused on studies that addressed outdoor air pollution related to COPD mortality, hospital admissions or emergency room visits, incidence, prevalence, respiratory symptoms and lung functions, exacerbation of COPD patients in both high- and low- to middle-income countries, and indoor biomass cooking and the risk of COPD prevalence in low-income countries. As a result, 324 articles were removed, leaving us with 364 articles. We further removed 257 articles based on the following reasons: 1) animal or human subject experimental studies; 2) studies on active and passive smoking; 3) occupational exposure to dust and fumes (although some were mentioned in the introduction); 4) studies on dust storms, haze, bushfires or wildfires, and volcanoes; 5) reviews, updates, reports, and meta-analysis studies; 6) studies where COPD cases were combined with asthma or other diseases such as interstitial disease as a single category; 7) studies with pollutants measured in exhaled air; 8) farm and agricultural area exposure studies; 9) studies with both mortality and hospital admission cases combined; 10) studies on mortality and morbidity of all diseases or cardiorespiratory diseases without a specific category for COPD; 11) irrelevant genetic studies; 12) indoor air pollution studies in high-income countries; and 13) negative studies where no relationships between air pollution and mortality and morbidity of COPD were found, although a few representative studies were discussed in the text. Articles in earlier studies and indoor air pollution studies often used chronic bronchitis, while later studies focused more on COPD with or without bronchitis. This final selection left us with eleven studies on COPD mortality in both high- and low- to middle-income countries (Table 1); 27 studies on COPD hospital admissions and emergency room visits in high-income countries (Table 2); 12 studies on COPD hospital admissions and emergency room visits in low- to middle-income countries (Table 3); 15 studies on respiratory symptoms, lung functions, and prevalence and incidence of COPD (Table 4); ten panel studies conducted with COPD patients to specifically evaluate their exacerbations (Table 5); 21 studies on indoor air pollution in low- to middle-income countries (Table 6); and eleven studies on intervention effectiveness (a total of 107 studies). Figure 1 shows a summary of the article screening and selection process. Additionally, other studies are cited in the text when necessary.
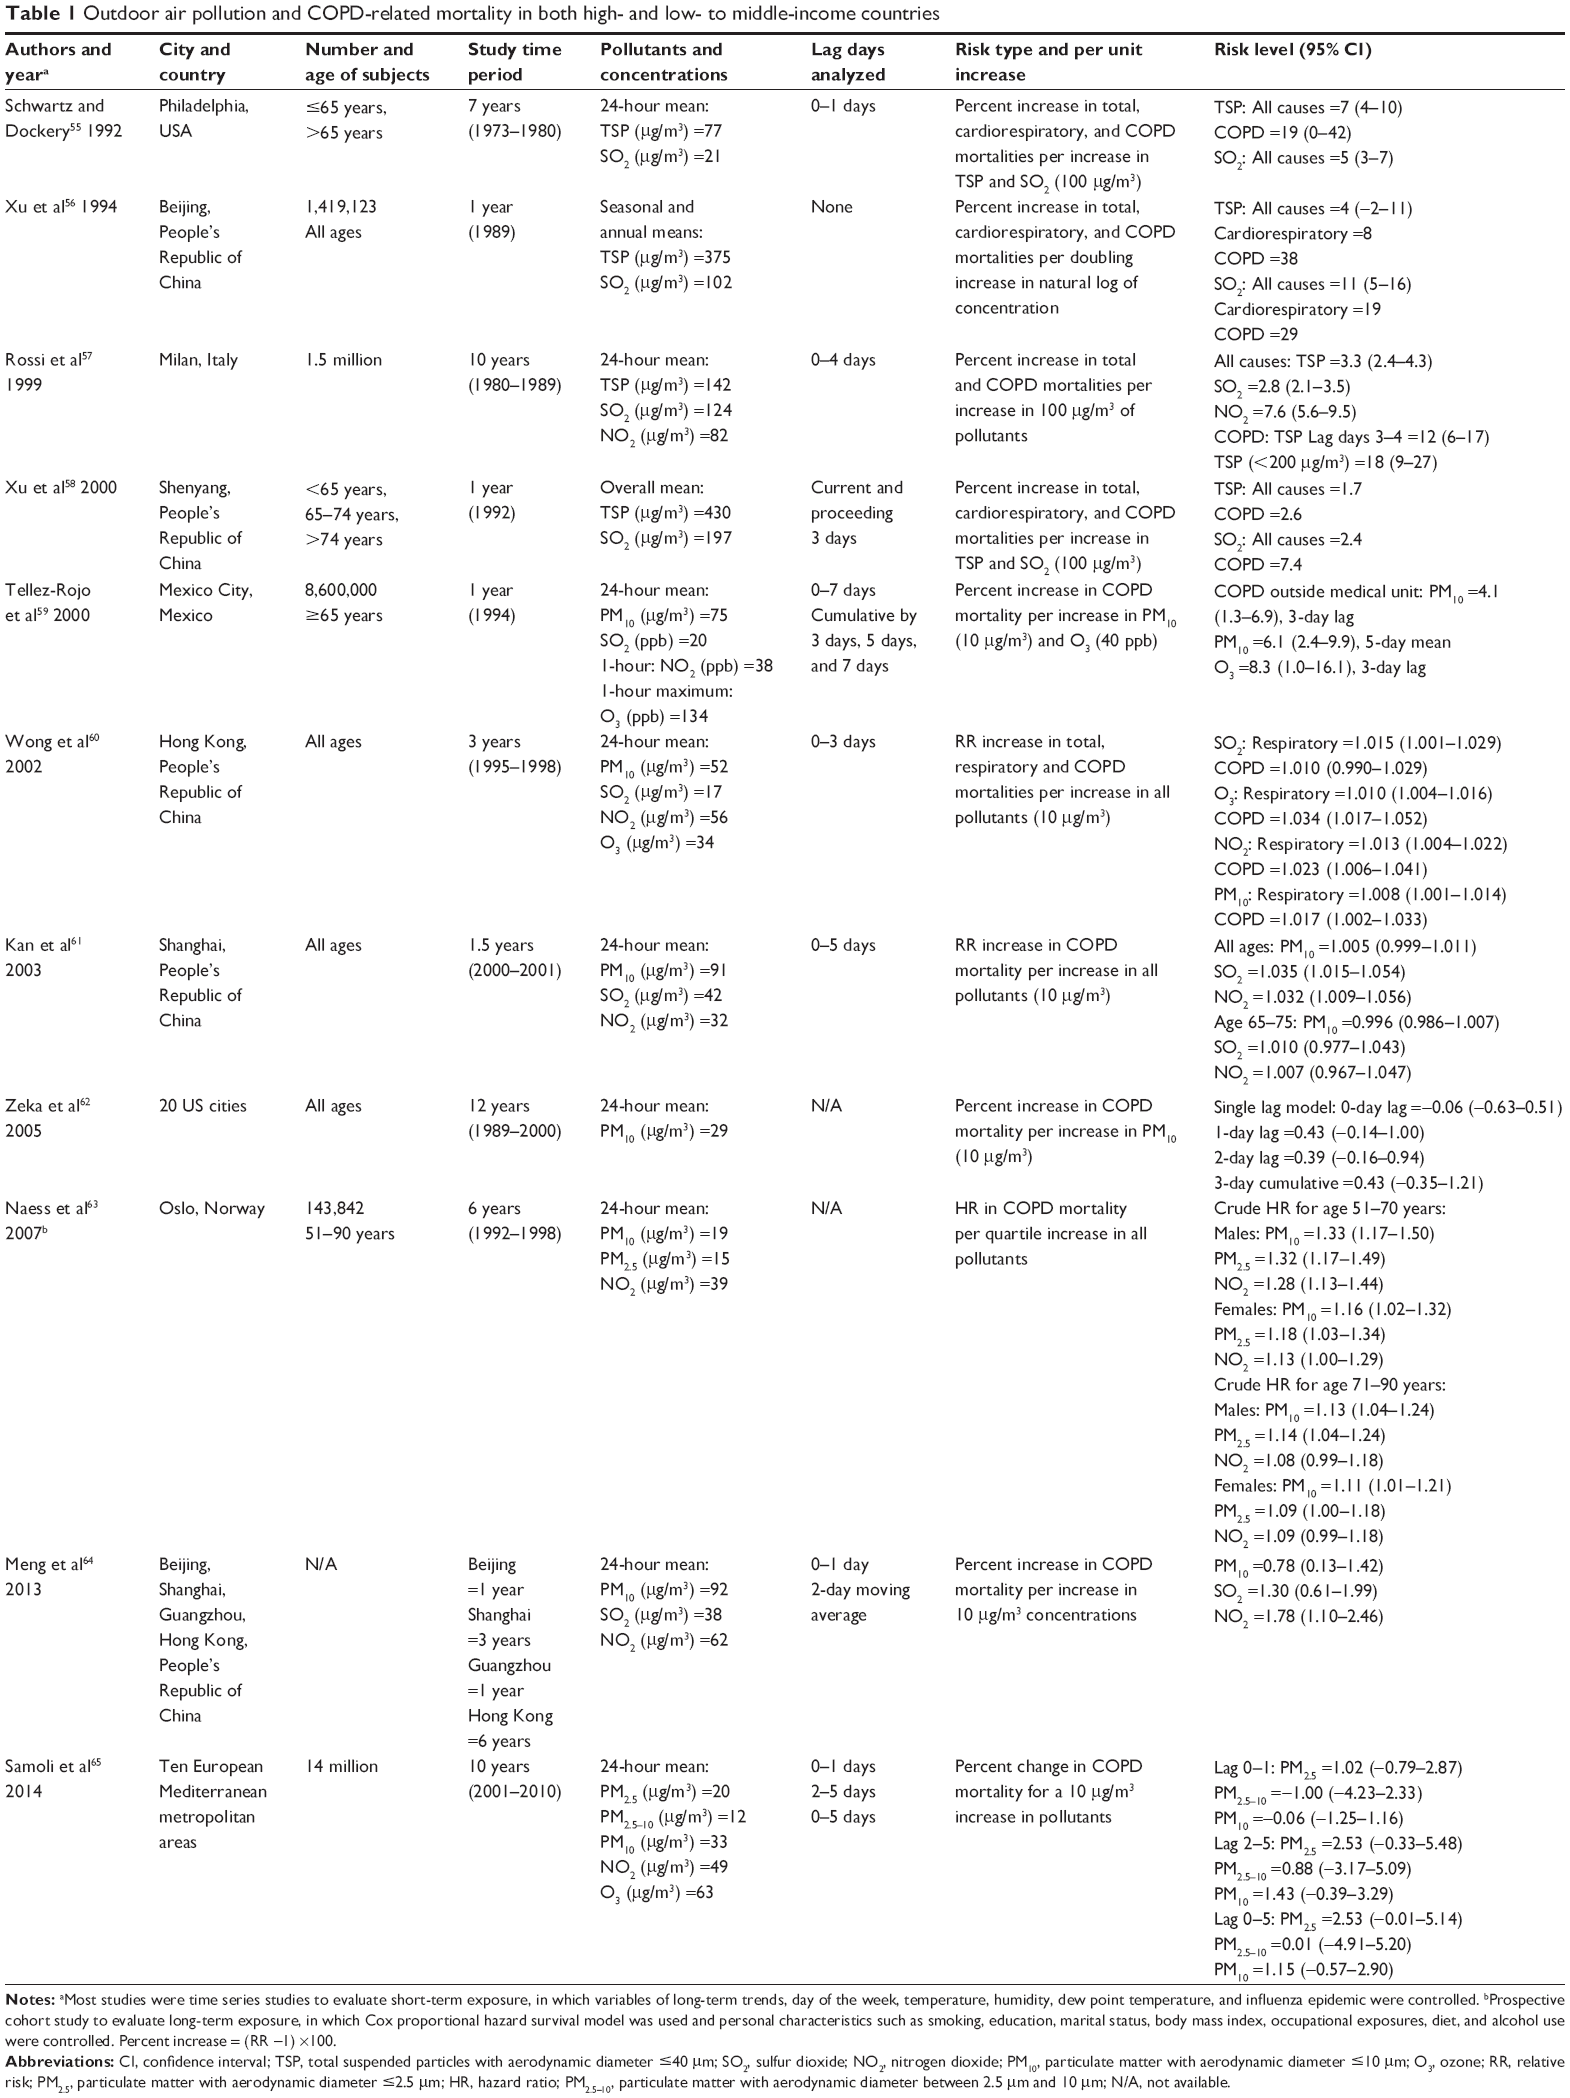 | Table 1 Outdoor air pollution and COPD-related mortality in both high- and low- to middle-income countries |
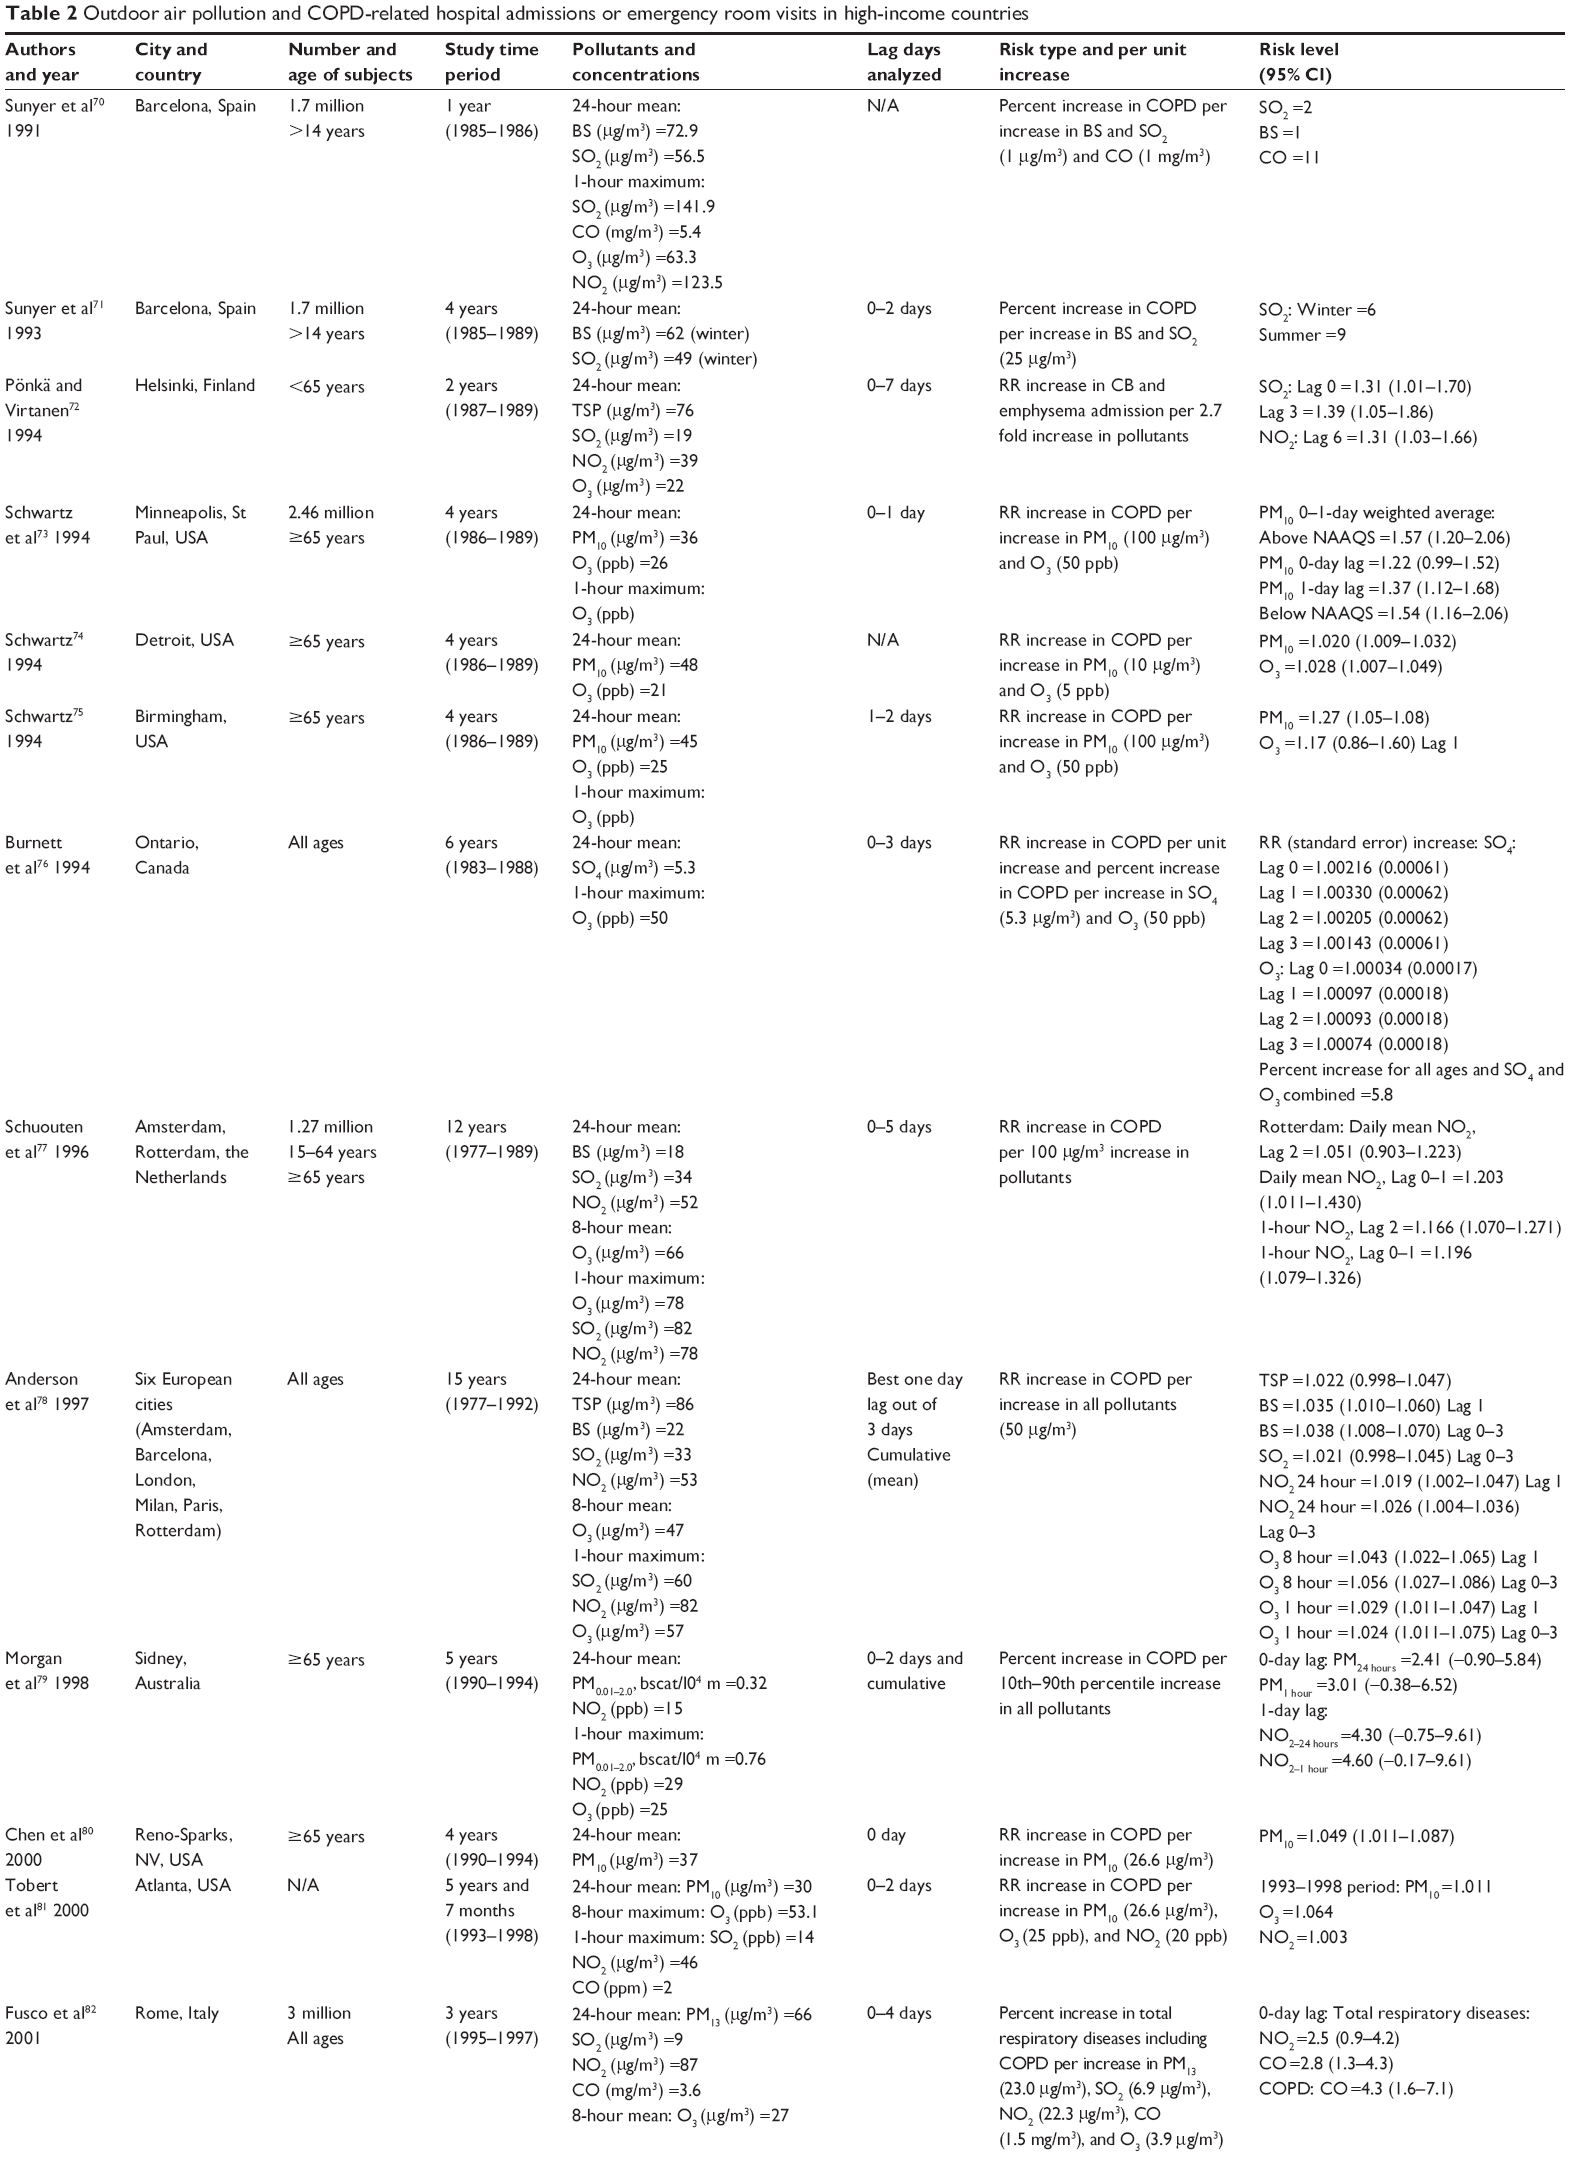  | Table 2 Outdoor air pollution and COPD-related hospital admissions or emergency room visits in high-income countries |
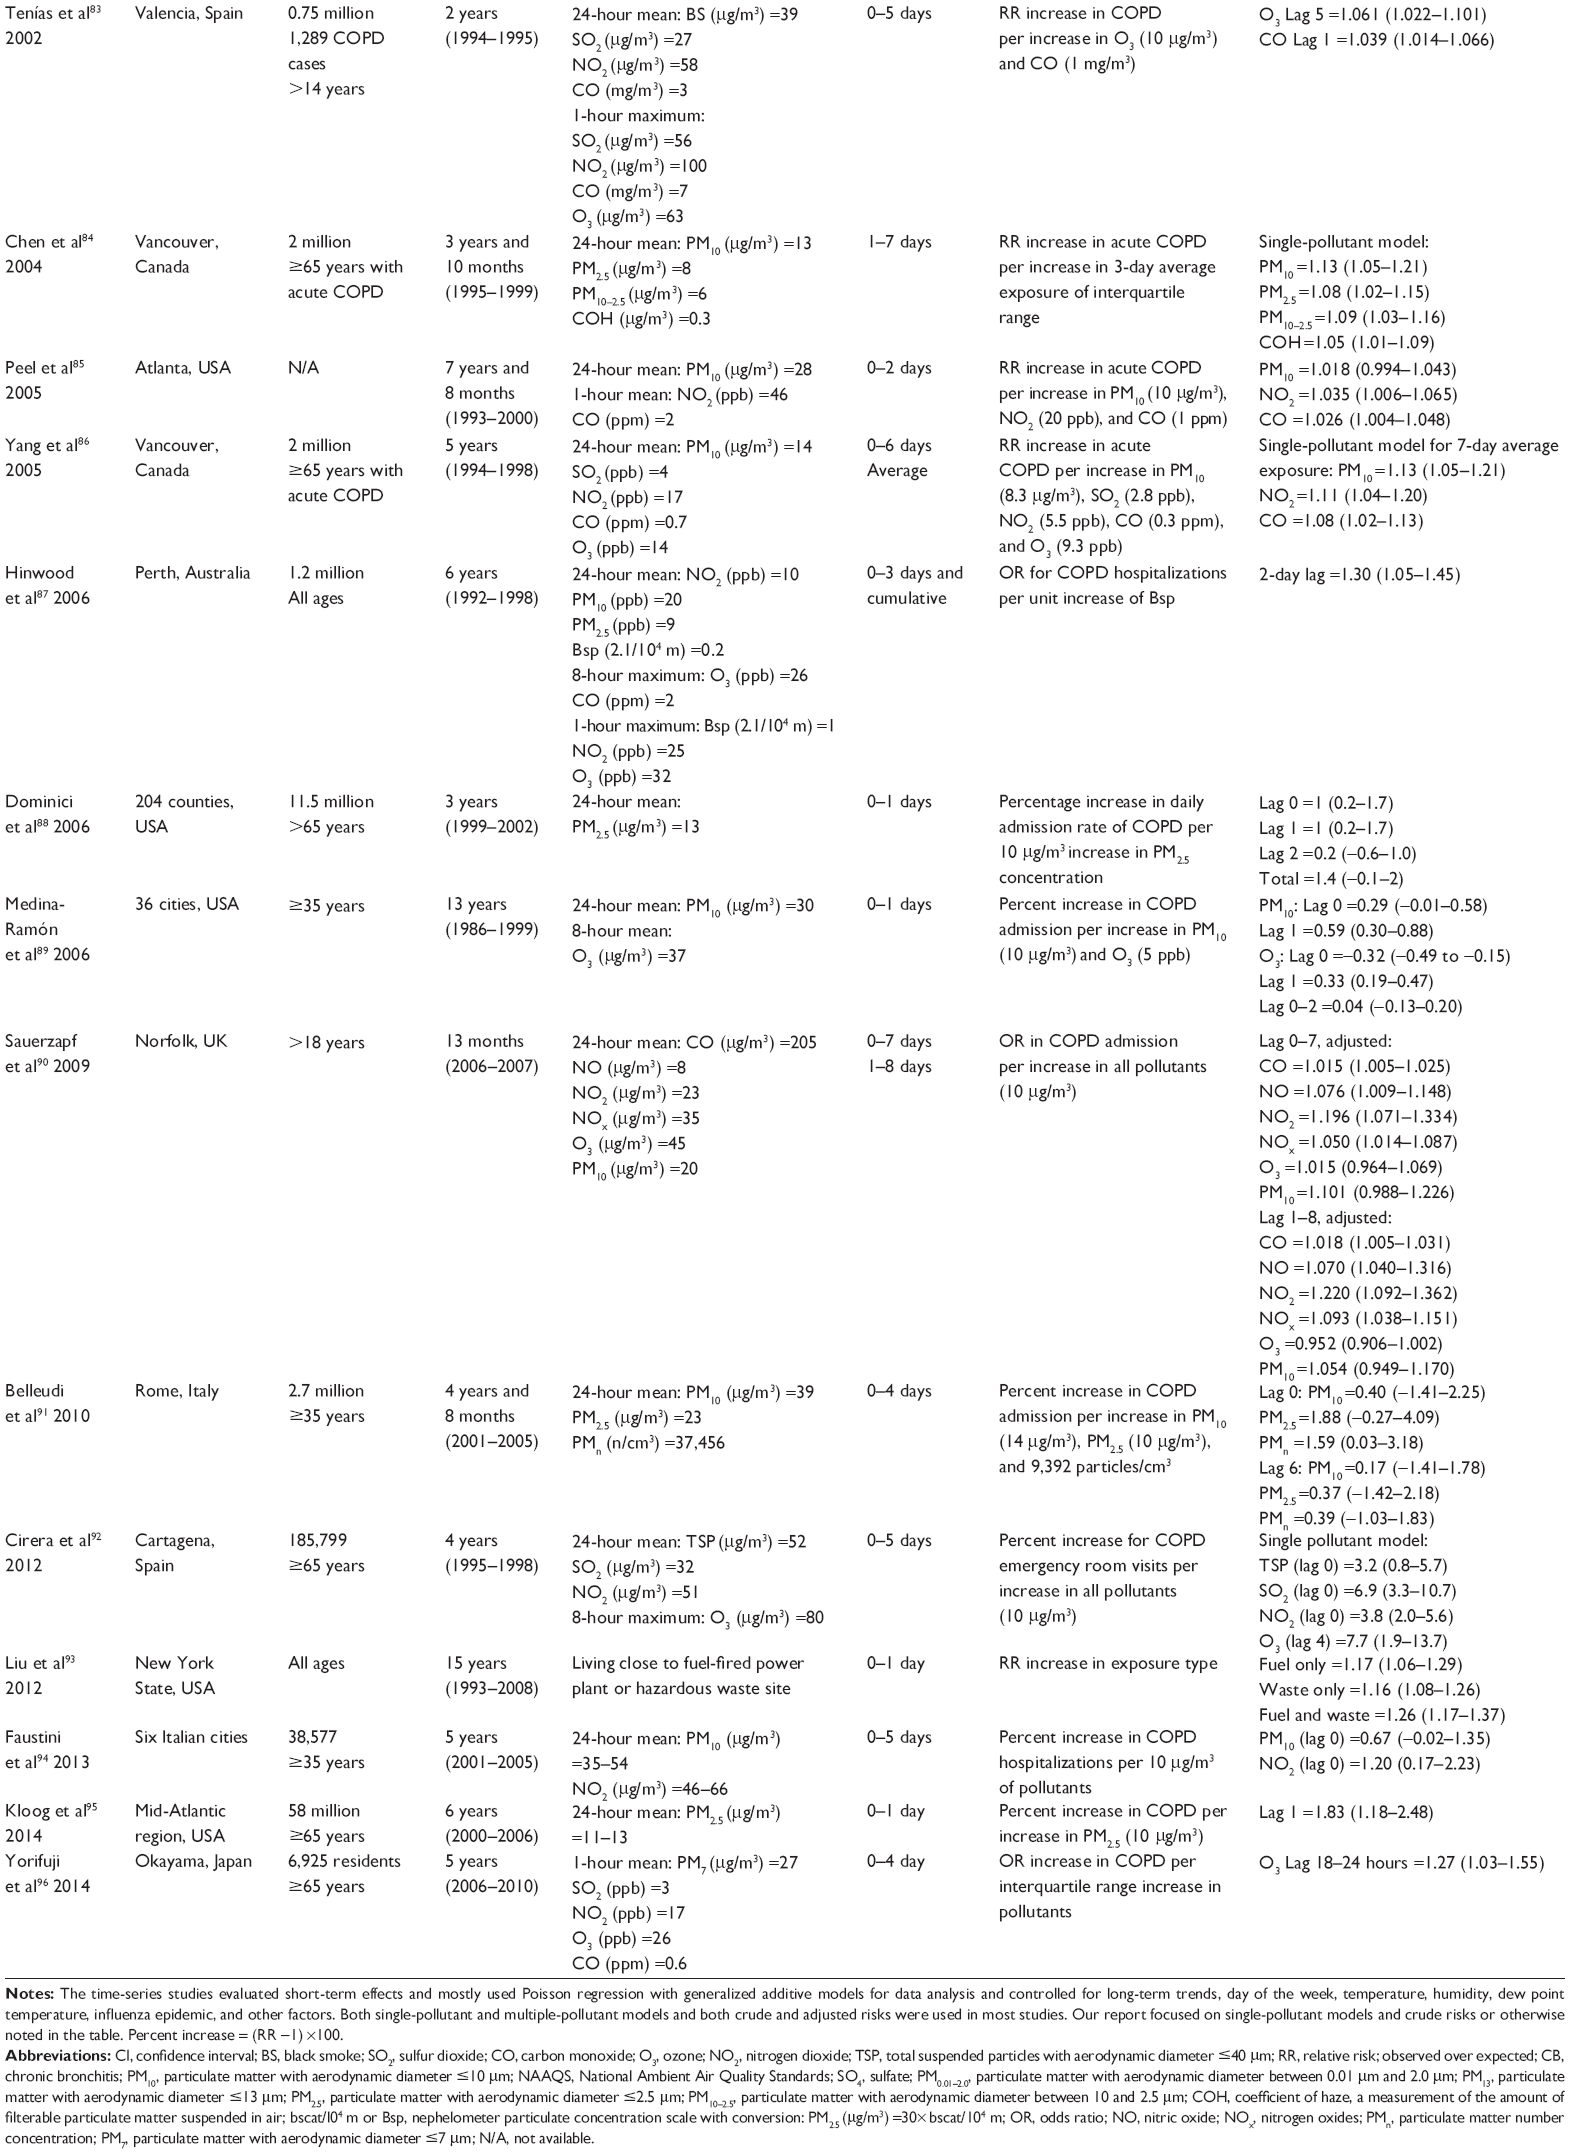
 | Table 3 Outdoor air pollution and COPD-related hospitalizations or emergency room visits in low- to middle- income countries |
 | Table 4 Outdoor air pollution and respiratory symptoms, lung function, and COPD prevalence and incidence |
 | Table 5 Outdoor air pollution on exacerbation of COPD patients |
  | Table 6 Indoor air pollution and COPD incidence or prevalence in low-income countries |
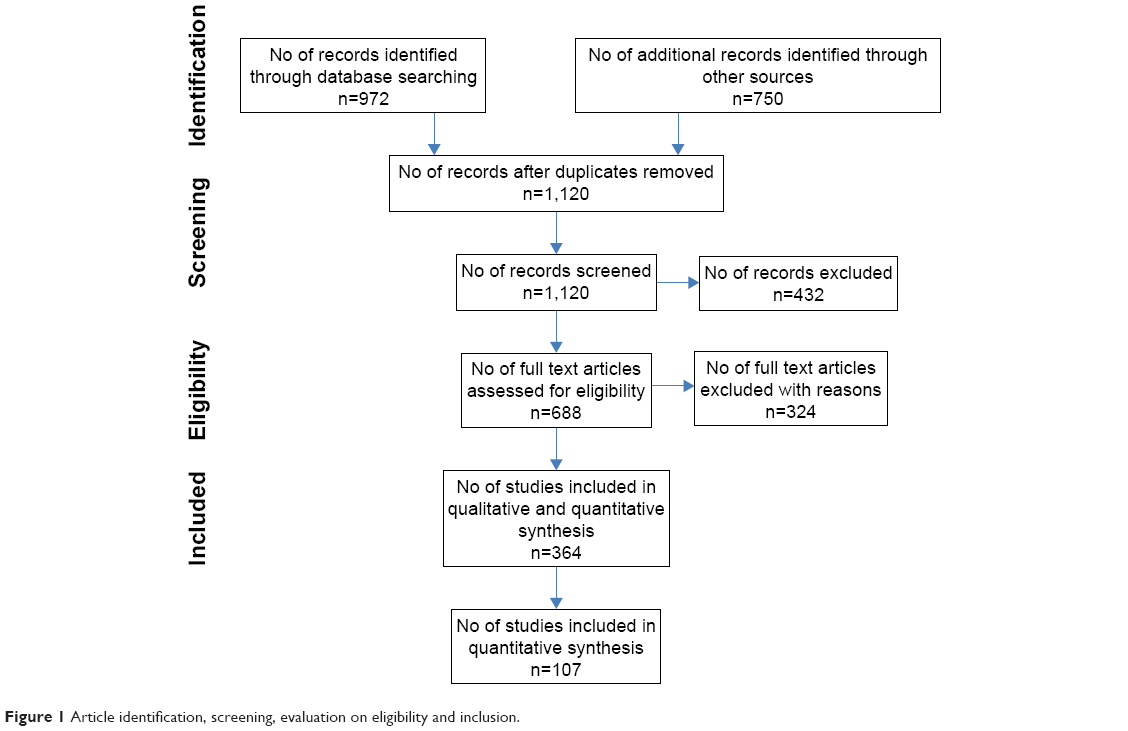 | Figure 1 Article identification, screening, evaluation on eligibility and inclusion. |
Results
Introduction to the epidemiology of COPD
Definition of COPD
In 1997, a Global Initiative for Chronic Obstructive Lung Disease (GOLD) was launched in collaboration with the US National Heart, Lung, and Blood Institute; National Institutes of Health; and the World Health Organization (WHO). GOLD works with health care professionals and public health officials around the world to raise awareness of COPD and develop and regularly update evidence-based strategy documents to guide COPD diagnosis, treatment, management, and prevention.1 In its most recent update document (2014),1 GOLD defines COPD as
a preventable and treatable disease characterized by persistent airflow limitation that is usually progressive and associated with enhanced chronic inflammatory response in the airways and the lung to hazardous particles and gases. Exacerbations and comorbidities contribute to the severity in individual patients.
This definition is similar to that in the updated position paper by the American Thoracic Society and the European Respiratory Society.2 COPD is not a single disease, but several lung diseases combined. Emphysema and chronic bronchitis are the most important conditions that compose COPD. They frequently coexist,3 but they are no longer used as separate disease categories and now are included within the COPD diagnosis.4 Although some patients with asthma also develop poorly reversible airflow limitations and are indistinguishable from patients with COPD, asthma is considered a separate entity2 not included in the diagnosis and treatment of COPD.
The significant airflow limitation in COPD patients is indicated by the value of forced expiratory volume in 1 second (FEV1) that does not return to normal and frequently worsens over time, but responds largely to bronchodilators.2 GOLD recommends that any patient with dyspnea, chronic cough or sputum production, and a history of exposure to risk factors such as tobacco smoke or occupational dusts or chemicals should be considered for a diagnosis of COPD, but spirometry is required to make the clinical diagnosis. The presence of a postbronchodilator ratio of FEV1 and forced vital capacity (FVC) <0.7 is the confirmation of obstructive airflow limitation.1 GOLD also classifies the severity of airflow limitation in COPD into four categories in patients with FEV1/FVC <0.7: GOLD 1 (mild) – FEV1 ≥80% predicted, GOLD 2 (moderate) – 50%≤ FEV1 <80% predicted, GOLD 3 (severe) – 30%≤ FEV1 <50% predicted, and GOLD 4 (very severe) – <30% predicted.1,5
COPD prevalence and disparity
COPD remains a major public health problem worldwide, and is one of the leading causes of morbidity and mortality in both high- and low-income countries. Estimated prevalence rates varied a great deal among different regions and countries possibly due to different methods used in different studies.5 In the US, based on the National Health Interview Survey conducted by the National Center for Health Statistics (NCHS) of the Centers for Disease Control and Prevention and analysis conducted by the American Lung Association,3 12.7 million US adults have been diagnosed with COPD. The actual number could be as high as 24 million if using the lung function test result, which indicates that there is an underdiagnosis. For chronic bronchitis, >10 million Americans reported a physician diagnosis in 2011. The total prevalence rate was 4.4%, whereas in 1999, the total number was 8.8 million although the prevalence was similar. For emphysema, 4.7 million Americans reported ever being diagnosed and the prevalence rate was 2.0% in 2011. This is a significant increase from 1999 where 2.8 million people were reported representing a prevalence rate of 1.4%.3
The prevalence rate of COPD was strikingly variable among different races, sexes, and age groups. The rate for chronic bronchitis in 2011 (NCHS)3 was much higher in non-Hispanic whites (4.7%) and blacks (4.9%) than in Hispanics (2.9%) and other non-Hispanics (2.4%). The rate was twice as high in females (5.7%) as in males (3.0%). Prevalence rates were the highest among those 65 years or older (6.4%) and the lowest among those 18–44 years (2.9%) with 70% of cases occurring in those older than 45 years. For emphysema, the prevalence rate in 2011 followed a similar pattern among ethnic groups, which was the highest for non-Hispanic whites (2.4%) followed by blacks (1.8%), other non-Hispanics (1.3%), and Hispanics (0.7%). Females surpassed males in the prevalence rate (2.1% vs 1.9%), although historically, the rate was lower in females. Similarly, prevalence rates for emphysema were the highest among those 65 years or older (5.5%) and the lowest among those 18–44 years (0.3%) with the rate in between (2.7%) for the age group 45–64.3
Geographically, COPD prevalence rates in the US also varied a great deal among different states as surveyed by the Behavioral Risk Factor Surveillance System in 2011. Kentucky had the highest age-adjusted rate at 9.7%, followed by Alabama at 9.4%, while Minnesota (4.0%) and Washington (4.1%) had the lowest. This geographical difference in COPD prevalence by state parallels the difference in smoking rates where Kentucky was on the top (30.2%) and Washington (17.0%) and Minnesota (15.8%) were on the lowest end.6 COPD prevalence rate was also the highest for males in Kentucky (8.4%), while the lowest for males in Washington (3.3%) and Washington DC. Among females, Tennessee had the highest age-adjusted rate (11.5%) and Minnesota the lowest (4.3%). Rates tend to be higher in the Midwest and Southeast.3
Worldwide, 65 million people have moderate-to-severe COPD,4 and the prevalence is also highly variable. Mannino and Buist5 summarized the rates from 12 sites in the Burden of Obstructive Lung Disease (BOLD) study7 and four sites in the Latin American Project for the Investigation of Obstructive Lung Disease (PLATINO) study8 and showed that in both males and females, the highest rate was in South Africa and the lowest in Mexico. The rate for the US was the fifth highest. In the BOLD study for females, the highest rate was in Cape Town, South Africa (16.7%) and the lowest in Guangzhou, People’s Republic of China (5.1%). For males, the highest rate again was in Cape Town, South Africa (22.2%) and lowest in Reykjavik, Iceland (8.5%). In the PLATINO study, crude rates of COPD ranged from 7.8% in Mexico City to 19.7% in Montevideo.5
COPD Mortality and disparity
According to Antó et al,9 50% of patients are expected to live 10 years post-diagnosis with more than one-third of patients dying due to respiratory insufficiency. COPD is the third leading cause of death in the US after cancer and heart disease.3 Based on the data from NCHS, the total number has increased from 119,524 in 1999 to 133,965 in 2009. The number of deaths was consistently higher in females than in males from 2000 to 2009. Approximately 80% of COPD deaths are in non-Hispanic whites; Hispanics had the least number of deaths counting 3,724 in 2009. The overall age-adjusted death rate was 41.2/100,000 in 2009 with the rate the highest (46.0/100,000) for non-Hispanic whites than for other ethnic groups. Overall, non-Hispanic white males had the highest age-adjusted death rates (53/100,000), while other non-Hispanic females had the lowest age-adjusted death rates (11.0/100,000 population).3
WHO estimated that globally, more than 3 million people died of COPD in 2005, which corresponds to 5% of all deaths.4 It was known that almost 90% of COPD deaths occurred in low- and middle-income countries. In 2001, WHO estimated that COPD was the fifth leading cause of death in high-income countries and the sixth leading cause of death in low- and middle-income countries.4 In 2004, WHO updated their findings and concluded that COPD was the fourth leading cause of death for all ages, resulting in 3.0 million deaths worldwide.10 WHO also estimated that total deaths from COPD are projected to increase by >30% in the next 10 years and will become the third leading cause of death worldwide by 2030.4 In terms of disability-adjusted life years, COPD is currently seventh and is expected to rise to the fifth leading cause of burden of disease by 2030.10
Causes and risk factors
The primary cause of COPD is tobacco smoke, including secondhand smoke or environmental tobacco smoke.4 Most smokers develop some respiratory impairment due to COPD.11 WHO estimates that 73% of mortality is related to smoking in high-income countries and 40% to low-to-middle-income countries.5 In a population cohort study conducted in North Sweden,12,13 it was reported that 50% of smokers would develop COPD based on GOLD guidelines.11
Many other risk factors have been identified in past research9,14 that contributed to the development or exacerbation of COPD and have been well summarized in previous reviews.5,14,15 These include genetic and phenotypic traits, occupational exposures to dust and fumes, indoor and outdoor air pollutants, aging, infections, asthma, sex, and socioeconomic status. These risk factors can act singly or synergistically.
It has been suggested that susceptibility to COPD is, at least in part, genetically determined.16 While the best described genetic factor in COPD is alpha-1 antitrypsin deficiency (PiZZ genotype), present in 1%–3% of COPD patients,15 several genes have been studied for their associations with COPD.16,17 For example, five single nucleotide polymorphisms in ADAM33 gene were associated with COPD and lung function in long-term smokers.18 The MSR1-coding single nucleotide polymorphism P275A was associated with susceptibility to COPD in smokers and a lower percent predicted FEV1, FEV1/FVC, and percent predicted forced expiratory flow (25%–75%).19 Smokers who are carriers of the surfactant protein D AG and AA polymorphic genotypes may be at a higher risk of developing COPD.16 Retinoic acid receptor-related orphan receptor-α has been implicated in the development of COPD.20 The hedgehog-interacting protein gene and family with sequence similarity 13, member A (FAM13A1) gene, were suggested to be involved in COPD susceptibility in Chinese Han population.21,22
Occupational exposure may make a substantive contribution to the etiology of COPD, particularly, in nonsmokers, females, and young people.23 Exposed agents include cotton dust,24,25 grain dust,26 western red cedar dust,27,28 coal dust,29 cement dust,30 gases31 and metal fumes,32,33 or a mixture of them. Most studies reported relative risk (RR) or odds ratio (OR), and a few studies directly reported the percentage of attributable population risk (PAR%).34 For chronic bronchitis, reported PAR% varied from 11% to 26% with a median at 19%. For lung function impairment, the reported PAR% varied from 12% to 34% with a median at 19%. The reported PAR% also varied for different symptoms.34 Overall, the PAR% due to occupational exposure was estimated to be 15% in smokers and 20% in nonsmokers.11,23
It is suggested that up to 20% of cases of COPD worldwide can be attributed to indoor air pollution from exposure to smoke from cooking and heating with biomass fuels in poorly ventilated dwellings.11 Age contributing to the risk of COPD was due to the decline in lung function.5 Infection can predispose individuals for COPD development, and socioeconomic factors represent a combination of risk factors that contribute to the susceptibility for COPD, including poor nutrition and closer proximity to hazardous pollutants.5 This review focused on air pollution as an etiological factor or risk factor for the development and exacerbation of COPD; for other risk factors, the readers are directed to other review papers in this journal or other journals.
Review of the effects of air pollution on COPD sufferers
Outdoor air pollution and COPD mortality
Although outdoor air pollution can occur naturally (eg, volcanoes and forest fires), anthropogenic activities are the major cause of environmental air pollution.35 The concern of outdoor air pollution on human health has been recognized for centuries.36 The effects of outdoor air pollution have caused a spectrum of responses, such as irritation of the upper respiratory systems, increased prevalence of respiratory infections, and symptoms and clinical signs. Symptoms and signs of respiratory responses include coughing, phlegm production, chest tightness, wheezing, and chronically reduced pulmonary function in FVC and FEV1. These symptoms lead to increased incidences in exacerbation of cardiopulmonary diseases, asthma attacks, cancer, and mortality.2 While air pollution may affect all ages of the population, the elderly, particularly those with preexisting cardiopulmonary diseases such as COPD, are the most susceptible group.
Air pollution causing COPD-related mortality was well presented when air pollution catastrophes significantly increased death rates. For example, in the UK historically, the burning of coal in homes for domestic heat often created very high levels of air pollution and caused death rates to dramatically rise. One of the most well-known pollution events was the 1952 London Smog incident that resulted in 4,000 extra deaths, with 80%–90% of the deaths due to cardiorespiratory causes. The greatest relative increase was in deaths due to bronchitis, which rose ninefold.37,38 The pollutant involved in the London Smog incident was black smoke, defined as visual blackness of particles collected on a white filter expressed as equivalent mass concentration of standard coal smoke39 and sulfur dioxide (SO2). A later estimation indicated that 12,000 extra deaths occurred from December 1952 through February 1953 because of acute and persisting effects of the 1952 London Smog incident.40 A time series analysis conducted for the data from 1958 to 1972 indicated that particulates were strongly associated with mortality rates in London even at much lower levels, and the relation was likely causal.41 A more recent study on the health effects of an air pollution episode in London, December 1991, in which concentrations of nitrogen dioxide (NO2) rose to record levels with moderate increases in black smoke showed a 23% increase in COPD mortality.42 Earlier, before the London Smog incident in 1930, the Meuse Valley, Belgium, experienced a period of intense fog in a heavy industrial area resulting in the death of 60 people.43 In October 1948, a lethal haze enveloped the town of Donora, PA, US. Over 5 days, approximately half of the town’s 14,000 residents experienced severe respiratory and cardiovascular problems. The death toll rose to ~40 people.44
The 1952 London Smog and other air pollution events symbolized the beginning of the modern air pollution epidemiologic studies. They also prompted governments to pass legislation to reduce air pollution levels. As legislation over the years has led to a decrease in traditional air pollutants particulate matter (PM) and SO2 from stationary sources, today’s major air pollutants come from motor vehicle traffic, and the main perpetrators include PM, ozone (O3), and NO2.37 A commentary and review by Dockery39 well described how studies on the health effects of particulate air pollution evolved and helped improve the air quality standards and regulations in the US. The year 1970 was a milestone year when Congress passed the Clean Air Act Amendments that required the Environmental Protection Agency (EPA) to set up the first National Ambient Air Quality Standards (NAAQS) that included six types of air pollutants: carbon monoxide (CO), lead, NO2, O3, PM, and SO2. NAAQS was promulgated in 1971. The particles used then were total suspended particles (TSP) with aerodynamic diameter between 20 μm and 50 μm, which was set up as maximum allowable ambient concentration.39 The Clean Air Act also encouraged scientists to identify pollutants that may reasonably be anticipated to endanger public health and welfare.39
One of the earliest and largest air pollution studies in the US was the Harvard prospective cohort study of the respiratory health effects of respirable particles and SO2 on a sample of adults and children in six US cities, that began in 1974. The particles measured in this study included two classes: fine particles (aerodynamic diameter <2.5 μm [PM2.5]) and inhalable particles (aerodynamic diameter <15 μm [PM15] before 1984 and <10 μm [PM10] starting in 1984).45 Over the 16-year follow-up, the study found a positive association of air pollution with both mortalities from lung cancer and cardiopulmonary causes, after adjusting for smoking and other risk factors. The adjusted mortality rate ratio for the most polluted of the cities as compared with the least polluted was 1.26 (95% confidence interval [CI], 1.08–1.47) or 26% of excess mortality. Mortality was most strongly associated with air pollution with fine particulates, including sulfates.45 This study and others46–48 provided scientific evidence that supported the US EPA’s replacement of the TSP standard with a standard for PM10 in 1987.49 In 1997, EPA further amended the particle standard and added PM2.5 to recognize the potentially different health effects.49
This switch to a more health-related exposure metric stimulated studies of the associations between ambient air PM and mortality, morbidity, and cardiopulmonary function indices. Over the past 30 years, a great number of studies, particularly time series studies, were conducted around the world to evaluate daily air pollution concentrations (short-term exposure) and the daily increased mortality with or without a few days of lag of exposure.36 PM was the focus of these studies, but gaseous criteria air pollutants were often included for their independent effects or interaction with and modification of PM effect. PM size evaluation evolved from TSP to PM10 and then to PM2.5. Earlier studies mostly focused on a single city, and many evaluated total mortality or mortality due to cardiorespiratory diseases or respiratory diseases,50–56 and the effect size was often provided with higher units of exposure (100 μg/m3 or quartile increase of the studies).55,57,58 More recent studies tend to focus on COPD as a separate category59–65 where the effect size was based on 10 μg/m3.59–62,64,65
These studies in a single city or multi cities around the world described earlier have repeatedly shown the increase in mortalities for all causes, for cardiopulmonary diseases, and for COPD associated with both short-term and long-term exposures to air pollution, although the exact percentage of increase (effect size) was variable among studies, time periods, pollutants, and cities. It was suggested that particles are the major culprit among the air pollutants and the role of other pollutants, if any, was additive and not multiplicative.38
Table 1 summarizes main studies55–65 published on outdoor air pollution and COPD mortality thus far. To be comparable, recent studies59–62,64,65 that used the same exposure unit (10 μg/m3) for particles are summarized in Figure 2. The mean percent of change in mortality per 10 μg/m3 increase in particle exposure ranged from −1 for PM2.5–10 with a 0–1-day lag in a study conducted by Samoli et al65 in ten European Mediterranean metropolitan areas to 6.1 for PM10 with a 5-day mean exposure in a study conducted by Tellez-Rojo et al59 in Mexico City, Mexico. The effect sizes for other studies60–62,64 are in between with an average effect size at 1.12. The effect size ranged from 1.0 to 3.5 for SO2 and 1.8 to 3.2 for NO2 per 10 μg/m3 and 3.4 per 10 μg/m3 to 8.3 per 80 μg/m3 for O3.
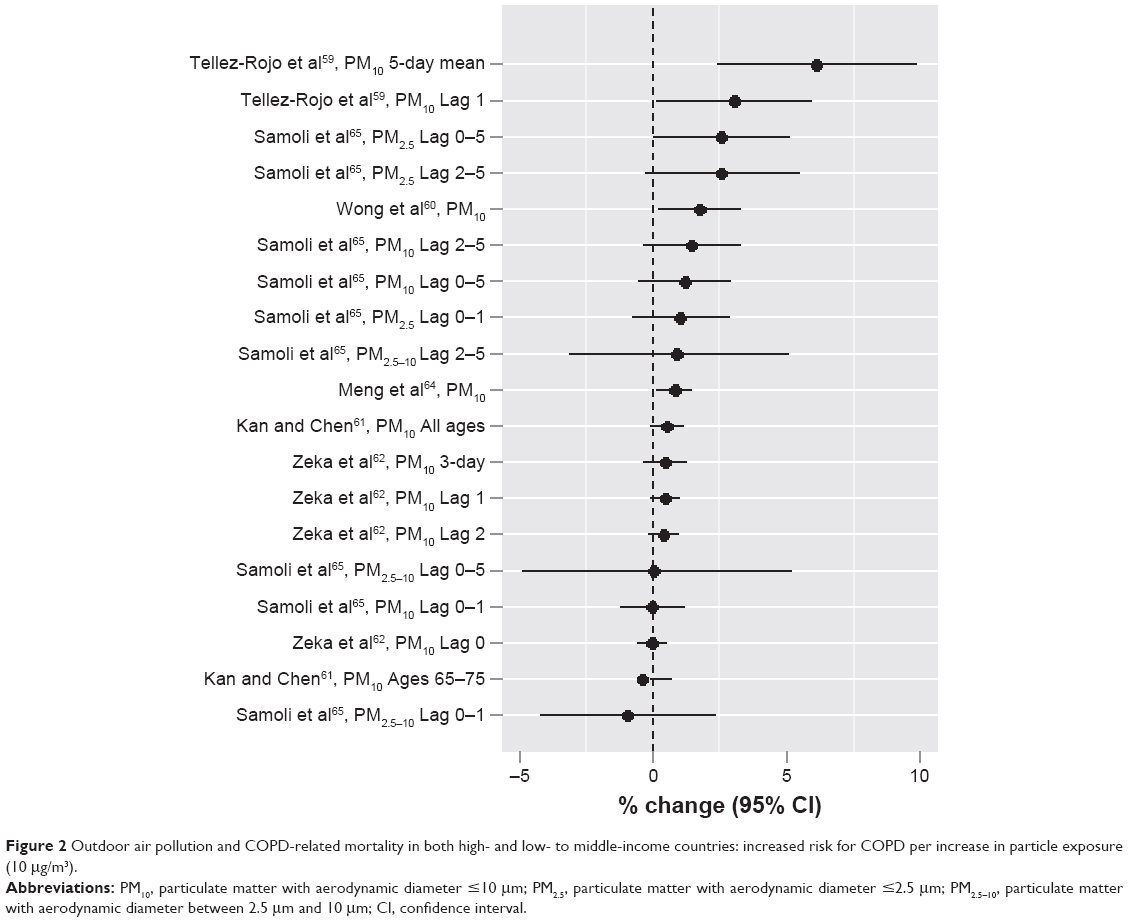 | Figure 2 Outdoor air pollution and COPD-related mortality in both high- and low- to middle-income countries: increased risk for COPD per increase in particle exposure (10 μg/m3). |
Alteration in coagulation and the autonomic control, and pollutant-related inflammation that enhances atherogenesis, are mechanisms of deaths triggered by increased air pollution.66,67 These mechanisms are relevant to patients with COPD who frequently have comorbid diseases.5 Increased susceptibilities to respiratory infections, increased airflow obstruction, and deranged gas exchange are also important contributors. Patients who die during air pollution episodes include not only those with a very short life expectancy (this mechanism has been called “harvesting”) but also patients and subjects with a much longer life expectancy.68
Outdoor air pollution and COPD morbidity
While mortality due to air pollution represents the extreme outcome for COPD sufferers, there is a continuum of health effects that also include the impact on the morbidity such as increased acute respiratory symptoms, reduced lung functions, exacerbation of COPD conditions that may be severe enough to require physician visits, use of ambulance, hospital respiratory admissions, and emergency room visits.69 COPD sufferers are particularly vulnerable to additional stress on the respiratory system caused by the toxic effects of inhaled pollutants. The London Smog incident of December 5–9, 1952, caused total hospital admissions to rise by 50% and respiratory admissions to rise by 160%.37 The later Smog event in 1991 caused a 43% increase in hospital admission.42
Similarly in the past 30 years, particularly since the early 1990s, many epidemiologic studies have been conducted around the world to evaluate short-term exposure to air pollution and the morbidity of respiratory diseases overall or COPD specifically. These studies that assessed the mortality often also evaluated the morbidity. Table 2 summarizes the 27 studies70–96 conducted in high-income countries that specifically evaluated the increased risk of hospital admission or emergency room visits due to COPD cause. Exposures assessed included both PM and gaseous pollutants, and the exposure unit used to assess the effect size of particles varied among studies and often was 50 μg/m3 and 100 μg/m3 or in the interquartile range (IQR) of the measured data in earlier studies. Recent studies tended to use 10 μg/m3. Figure 3A summarizes the effect sizes from different authors with different particle sizes and lag times per increase in 10 μg/m3.74,85,88–92,94,95 The percent increases ranged from 0.02 for PM2.5 in Lag 5 in the study conducted by Belleudi et al91 in Rome, Italy, to 10.1 for PM10 in Lag 0–7 in the study conducted by Sauerzapf et al90 in Norfork, UK. The average percent increase was 1.89. In 2006, a study in 204 counties in the US by Dominici et al88 found a total percent increase at 1.4 for PM2.5. In the same year, another study by Medina-Ramón et al89 with 36 US cities identified percent increases at 0.29 (Lag 0) and 0.59 (Lag 1) for PM10 based on per 10 μg/m3 increase in concentration. The most recent study by Kloog et al95 in the Mid-Atlantic region of the US identified a percent increase of 1.83 (Lag 1) for PM2.5. The effect sizes (percent increases) for gaseous pollutants were also variable among the studies. For SO2, the percent change ranged from 2 in a study by Sunyer et al70 in Barcelona, Spain, to as high as 39 in a study by Pönkä and Virtanen72 in Helsinki, Finland, although these studies were not directly comparable as they used different exposure units. For NO2, recent comparable studies90,92,94 showed an increase in risk from 1.2%94 to 22%.90 For O3, different studies74–76,78,81,83,89,90,92,96 using different exposure units showed a range of percent change from 0.03476 to as high as 27.96 For CO,82,83,85,86,90 the percent change ranged from 1.590 to 8,86 although again these numbers were not directly comparable because the exposure units used were different.
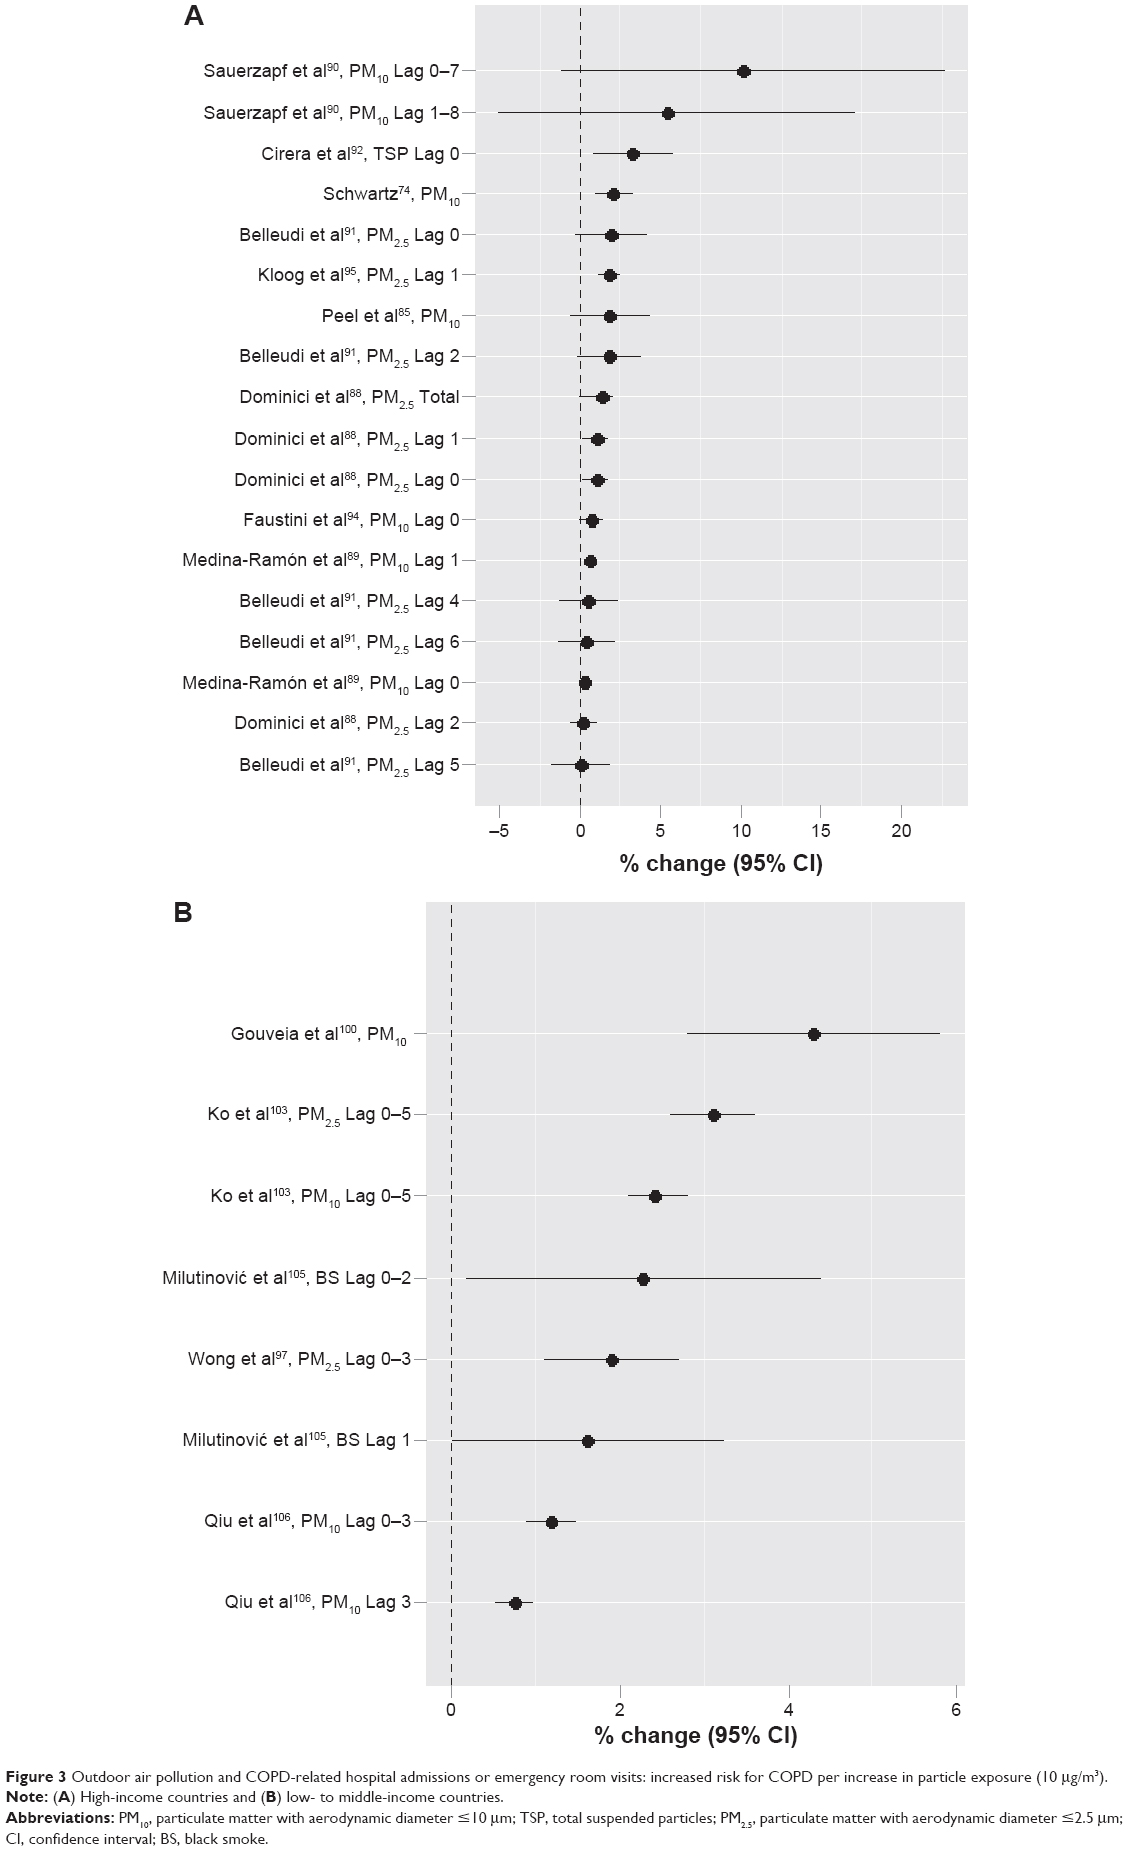 | Figure 3 Outdoor air pollution and COPD-related hospital admissions or emergency room visits: increased risk for COPD per increase in particle exposure (10 μg/m3). |
Table 3 summarizes 12 studies97–108 conducted in the low- to middle-income countries. With different exposure units used, the percent increase for particles in these studies was from 0.74 in a study conducted by Qiu et al106 in Hong Kong, People’s Republic of China, to 18.6 in a study conducted by Arbex et al104 in São Paulo, Brazil. When the same exposure unit of 10 μg/m3 was used, five studies97,100,103,105,106 showed a range of percent increase from 0.74 in Hong Kong, People’s Republic of China,106 to 4.3 in São Paolo, Brazil,100 with an average of 2.19 (Figure 3B). This is similar in magnitude to that in high-income countries. For SO2, the reported percent increase with different exposure units ranged from 0.44 in Tabriz, Iran,108 to 19 in Kaohsiung, Taiwan, when the temperature was <25°C.102 For NO2, the lowest reported was 0.38 in Tabriz, Iran,108 and the highest was 97.5 again in Kaohsiung, Taiwan.102 For O3, the percent change was 1.22 in Hong Kong, People’s Republic of China,106 to 26.6102 in Kaohsiung, Taiwan, when the temperature was <25°C. For CO, the percent change ranged from 4.9 in São Paolo, Brazil,100 to 39.8102 also in Kaohsiung, Taiwan, when the temperature was <25°C.
The above studies provided strong evidence that both particles and gaseous air pollutants can increase the hospital admissions or visits to emergency departments due to COPD exacerbation in both high-income and low- to middle-income countries, although the effect size is variable among study locations and different pollutants. The effect size also seems to be higher in gaseous pollutants, particularly in low-income countries.
Outdoor air pollution on respiratory symptoms and lung function
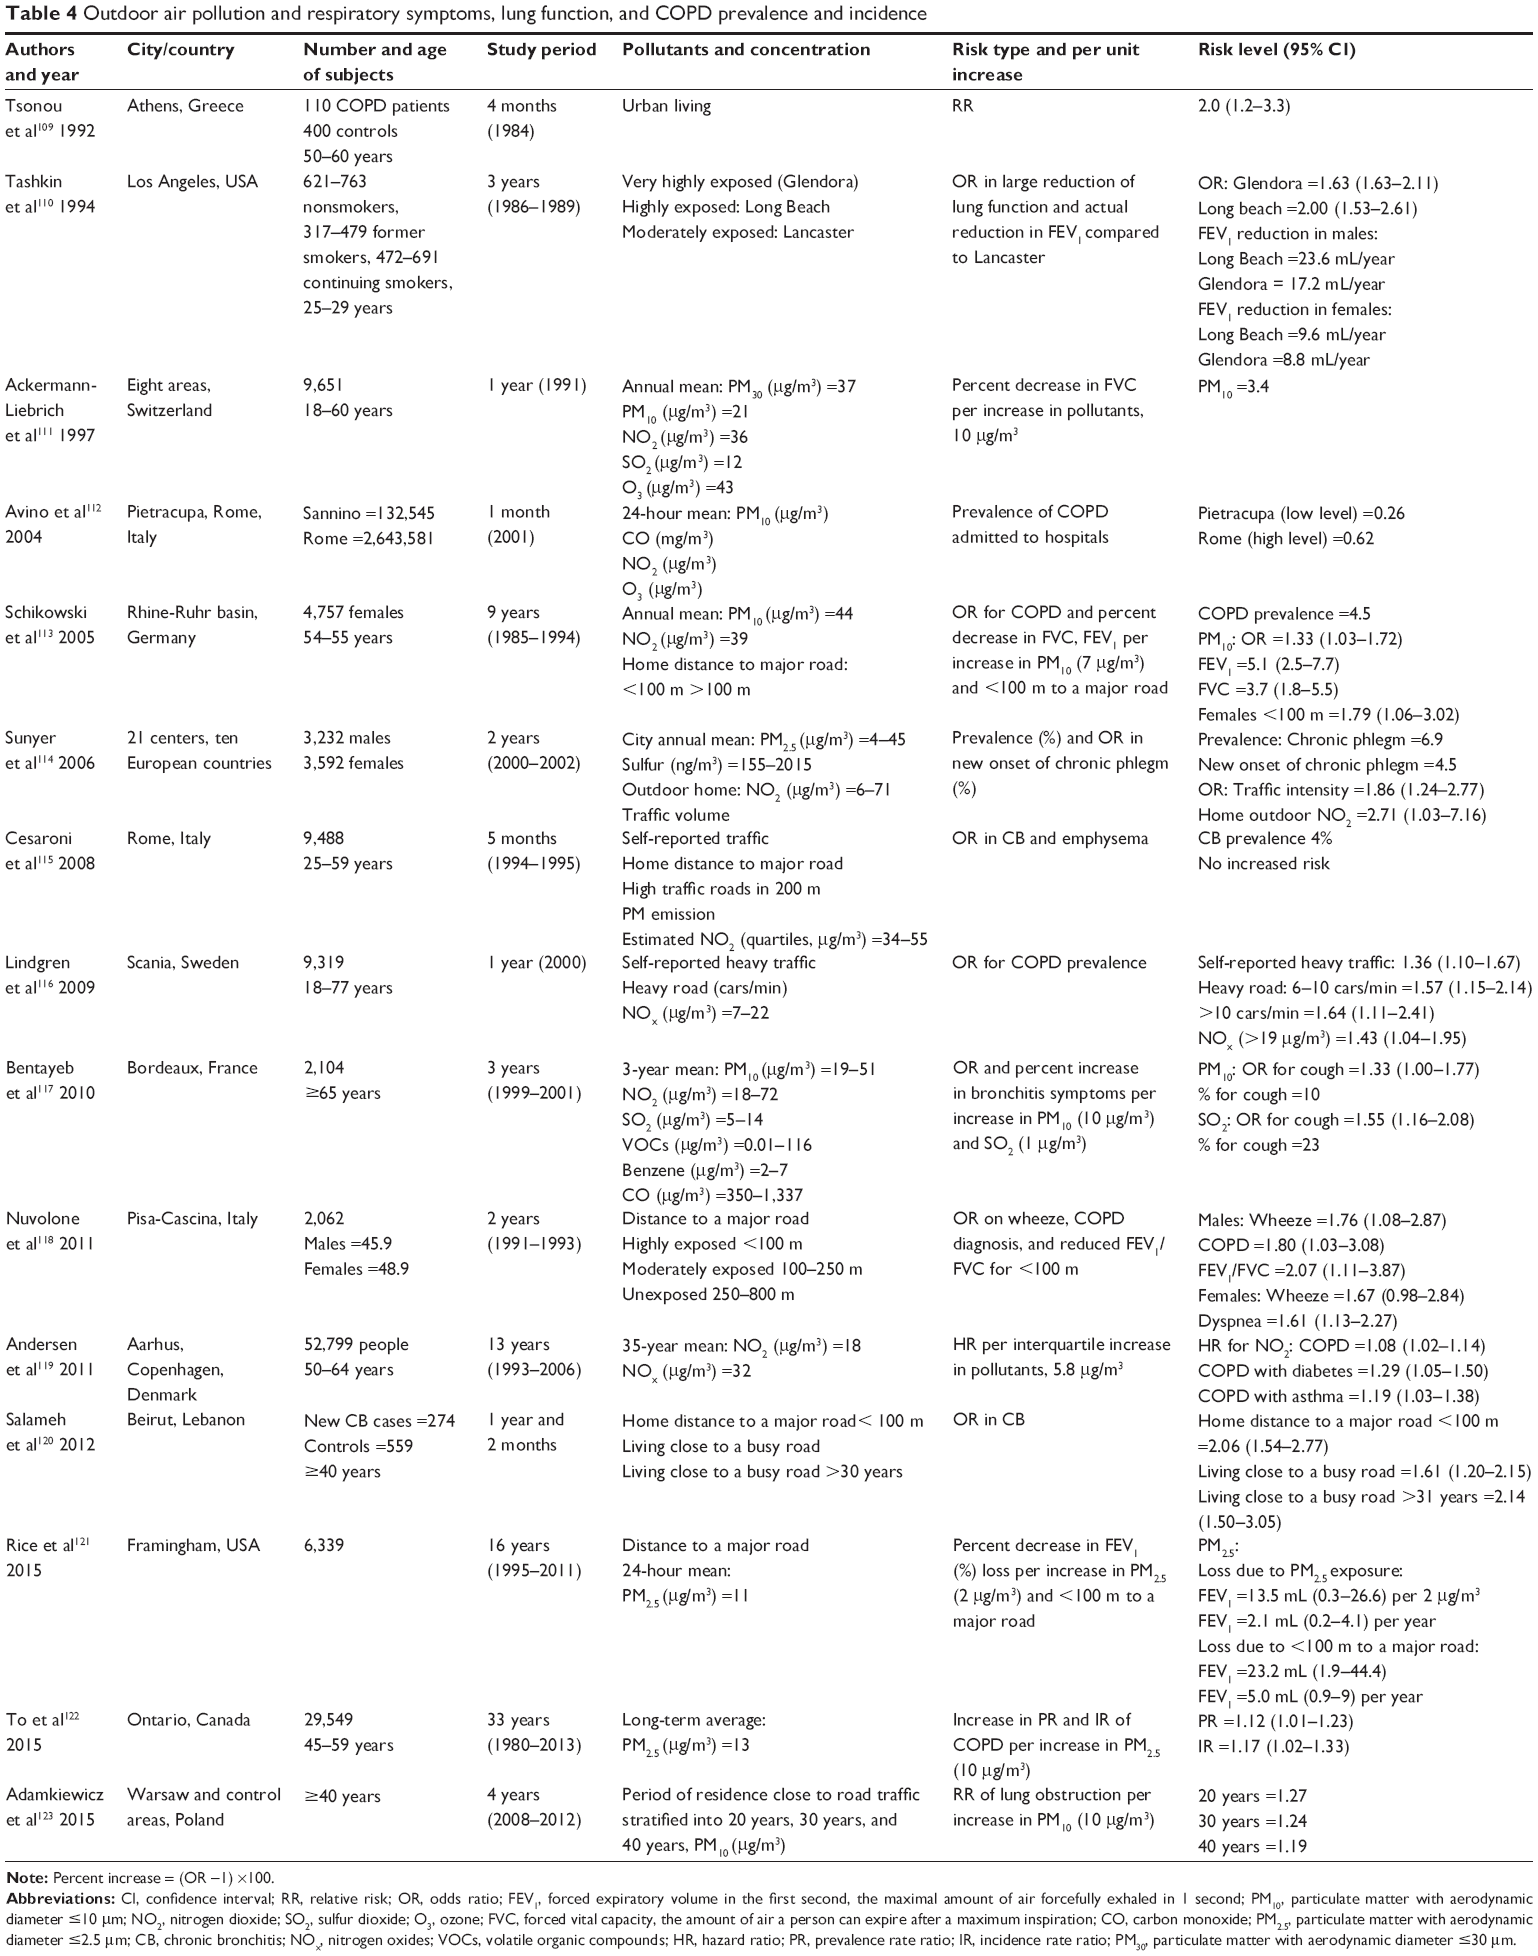
Several studies have also been conducted to evaluate the prevalence and incidence of COPD or chronic bronchitis and/or respiratory symptoms and lung functions (FVC, FEV1, or both) due to short-term or long-term exposure to outdoor air pollution. Table 4 summarizes 15 of such studies.109–123 Exposures often were measured qualitatively as how close the home was to a major road with high traffic, although air pollutants were also measured in some of the studies. The prevalence of COPD ranged from 0.26% in Pietracupa, Italy,112 to 4.5% in Rhine-Ruhr basin, Germany,113 and the prevalence of chronic bronchitis was 4%.115 Increased risks with different effect sizes were observed for symptoms such as cough and phlegm,114,117,118 reduced lung functions,110,112,113,118,121 and prevalence or incidence of COPD or chronic bronchitis113,116,118–120,122 in different populations and various regions of the world. The amount of decreased FEV1 was reported to be from 2.1 mL/year per increase in PM2.5 (2 μg/m3) or 5.0 mL/year if living in <100 m distance to a major road in Framingham, US,121 to 23.6 mL/year in males in a Los Angeles study.110 These effect sizes delineated the risks of chronic exposure to outdoor air pollution in the general population.
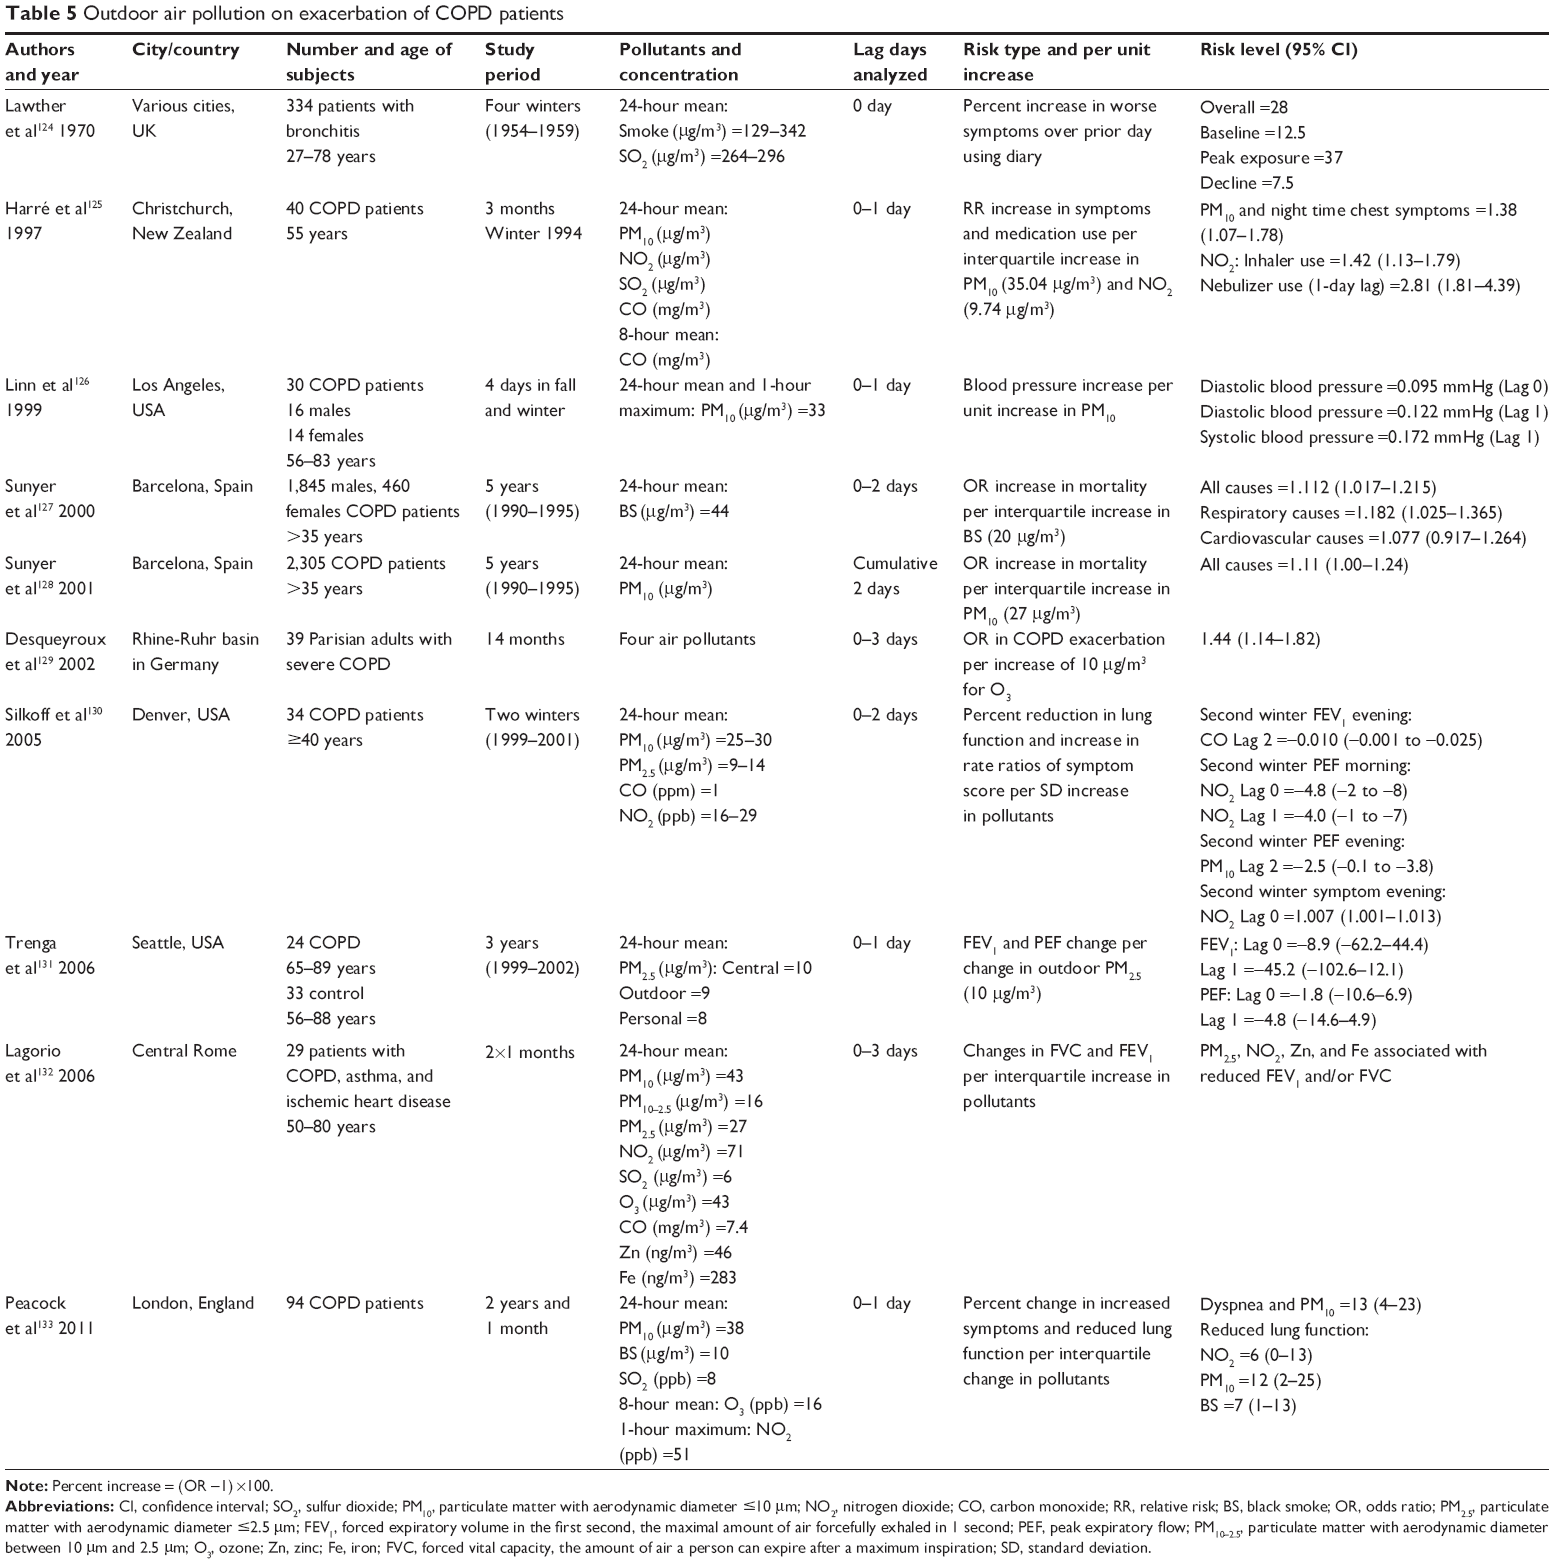
Outdoor air pollution on COPD patients
Another type of time series study is the panel study with COPD patients to evaluate the daily variations of air pollution directly on their exacerbation (increased symptoms and reduced lung functions). However, relatively fewer of such studies have been conducted, and the results on the effects are inconsistent. Table 5 presents the details for ten panel studies.124–133 One of the earliest panel studies was conducted by Lawther et al.124 They used diary cards to assess the symptoms of bronchitis related to the change in air pollution levels in patients and found a 28% overall increase in worsened symptom rates. The panel studies in the past 25 years showed a variety of exacerbations on the COPD patients ranging from increased respiratory symptoms, blood pressure, and inhaler and nebulizer use, reduced lung function, and limits in physical activities to death, although the effect sizes were variable among different studies in different regions. Most of these studies used a small number of COPD patients. The largest study identified was conducted by Sunyer and Basagaña128 in Barcelona, Spain, with 2,305 COPD patients >35 years of age. An IQR increase of 27 μg/m3 in PM10 resulted in an all-cause mortality increase of 11%.
The above review indicated that outdoor air pollution, especially particulate air pollution, has been consistently linked to various health effects on COPD sufferers ranging from increased respiratory symptoms, decreased pulmonary function, exacerbation leading to increased hospitalization admissions and emergency room visits, and mortality due to cardiopulmonary disease. These health effects are observed at levels common to many US cities, including levels below the maximum set by the US NAAQS at the time of the studies.134
Indoor air pollution and impact on COPD sufferers
Human beings spend a large part of their time indoors such as in homes, workplaces, libraries, shopping malls, school classrooms, and daycare centers and inside vehicles. For example, Americans spend ~90% of their time indoors, where the concentrations of some pollutants are often two to five times higher than typical outdoor concentrations.135 According to WHO, almost three million people or 50% of the households worldwide use biomass as the main source of energy for cooking, heating, and other household needs, such as wood, crop residues, and animal dungs in addition to coal. Biofuels have higher emission factors for PM and other pollutants, especially during incomplete combustion at lower temperatures.136 The burning of biofuels generates indoor airborne particles at levels much higher than those of cleaner fuels137 or outdoor levels,138 and well above levels in most polluted cities.139 Such particles also have small aerodynamic diameters (eg, ranging from 0.05 μm to 1 μm for wood smoke)140 and can penetrate deep into the alveolar region to induce adverse pulmonary effects.
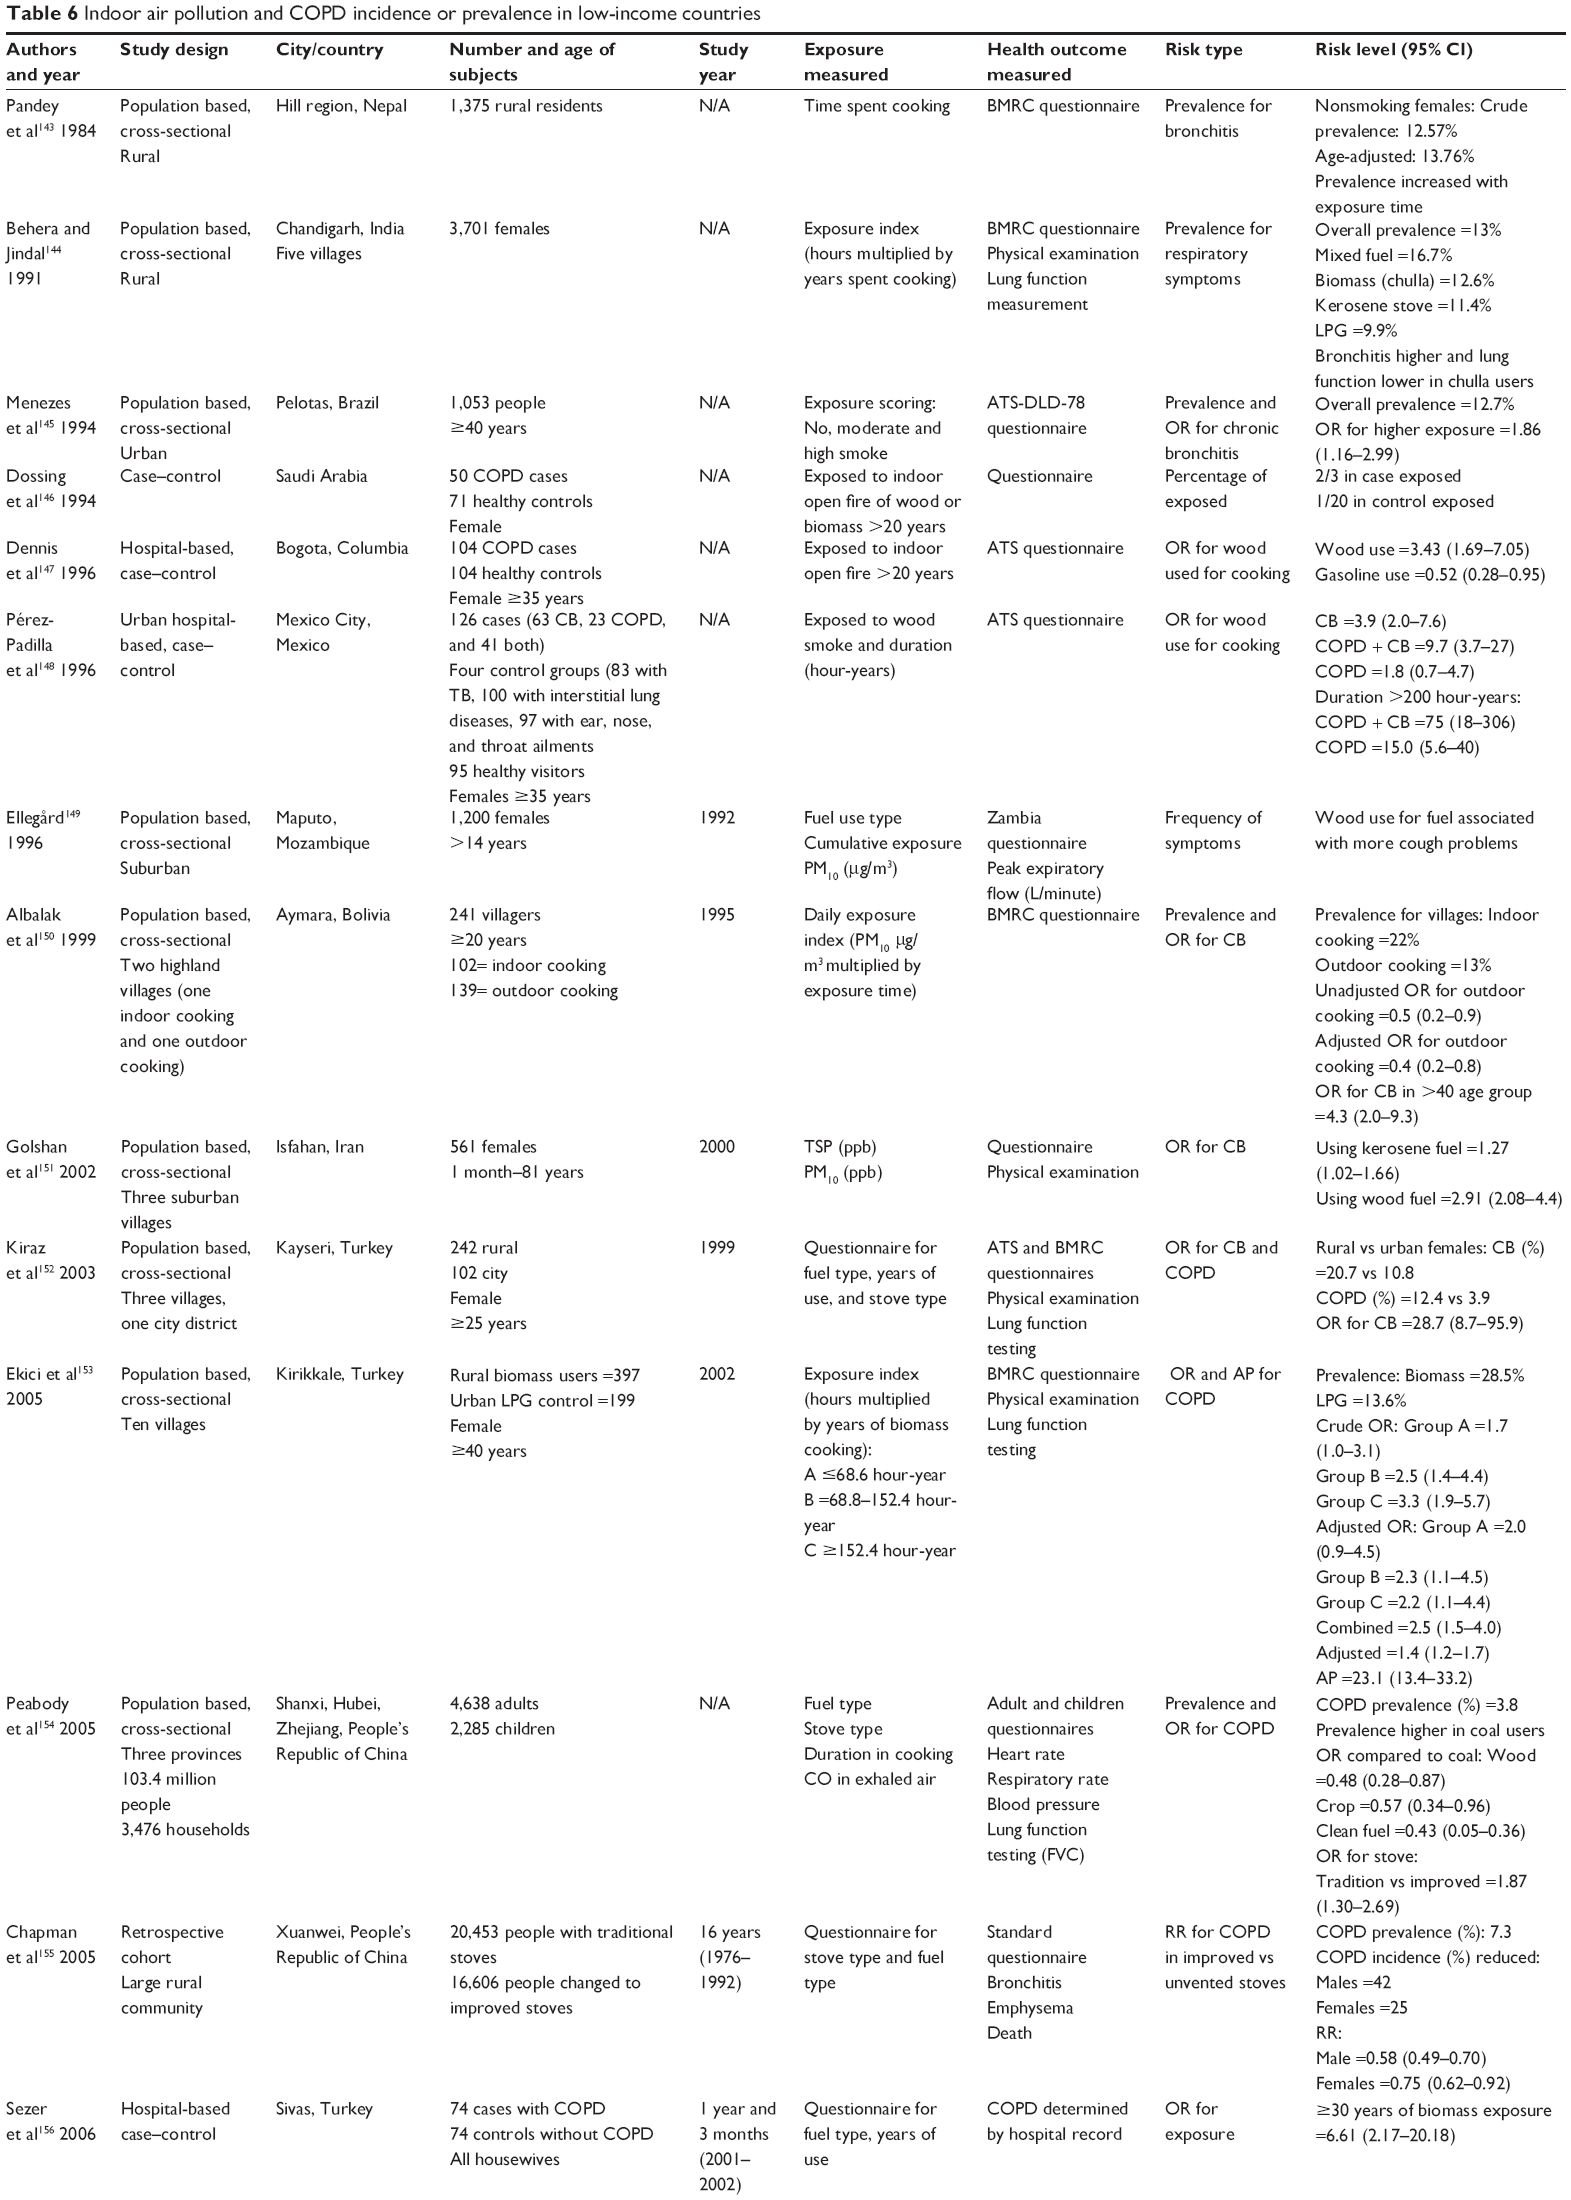
Indoor air pollution studies dated back to as early as the 1960s when wood smoke exposure and chronic lung diseases were investigated in Papua and New Guinea.140–142 Since the early 1980s, there have been quite a few studies conducted to evaluate indoor exposure to biomass air pollution and the odds of increased chronic bronchitis or/and COPD, particularly in low-income countries where only lower grade energy resources are available and affordable. Table 6 summarizes 21 studies143–163 conducted in low-income countries identified through this search in which exposed populations were largely nonsmoking females, but exposed to smoke from cooking and heating using biomass fuels since early childhood with their mothers or later as housewives. Most studies 1) were population-based cross-sectional surveys143–145,149–154,157–163 or case–control design,146–148,156 and only one study was identified as a (retrospective) cohort study;155 2) used standard questionnaires such as questionnaires from American Thoracic Society and the British Medical Research Council with adaptations appropriate to local culture, along with or without the lung function testing to identify cases, but few studies used the GOLD standard for diagnosis; 3) assessed exposure using fuel type, stove type, poor ventilation, or time spent cooking and rarely measured actual exposure levels to particles and gasses; and 4) measured the prevalence of chronic bronchitis and/or respiratory symptoms with COPD in most earlier studies or COPD only in recent studies, analyzed OR for indoor biofuel use, or conducted a crude dose–response relationship analysis using cooking time per year as a cumulative exposure measurement. Unit air concentration-based effect sizes were not available. However, a consistent relationship between indoor exposure to biomass cooking and excess risk was found from different countries. The prevalence (%) of chronic bronchitis in study villages with indoor biomass cooking varied from 1.79 in India163 to 28.5 in Turkey,153 which is overall higher than in high-income countries. The prevalence for urban control area homes, outdoor cooking practice, and cleaner fuels such as gas and electricity tended to be much lower. The prevalence of COPD varied from 2.4 in India161 to 12 in a rural community in Guangzhou, People’s Republic of China.158 The significantly increased OR for biomass cooking ranged from 1.86 (95% CI 1.16–2.99) in Brazil145 to 28.7 (95% CI 8.7–95.9) in Turkey152 for chronic bronchitis, 1.2 (95% CI 0.4–4.2) in India161 to 15.0 (95% CI 5.6–40.0) in Mexico148 for COPD, 9.7 (95% CI 3.7–27.0) overall to 75 (95% CI 18–306) when cooking was >200 hour-years in Mexico148 for chronic bronchitis and COPD combined, and 2.3 (95% CI 1.2–4.4) to 2.9 (95% CI 1.7–5.1) for various respiratory symptoms.162 It was reported that if cumulative exposure is >60 hour-years, the OR for chronic bronchitis is significantly increased.163 Reported attributable portion of risk was 23.1%.153 These results indicated that overall, evidence supporting an association between biomass smoke exposure and COPD in adult females in rural areas is fairly robust.164
Impact of current air quality guidelines on COPD sufferers
Epidemiologic studies worldwide have provided strong evidence to link air pollution, especially particulate air pollution to the mortality, morbidity, and socioeconomic burden of cardiorespiratory disease in general and COPD in particular. This has prompted the legislation around the world to continuously modify the air quality standards or guidelines to reduce the disease burden over time such as in the US.49,165 WHO provides the basis for global standards in environmental quality and effective investments for public health.166 WHO published its air quality guidelines in 1987 and revised them in 1997. Based on the research developments thereafter, they updated the guidelines for PM, O3, NO2, and SO2 in 2005.166 The values in the WHO guidelines are much lower than in the US NAAQS.167,168 We focused this part of the review on studies conducted in the last 10 years to specifically evaluate if the current air quality guidelines are protective of COPD sufferers.
A prospective cohort study119 in Copenhagen, Denmark, with 57,053 participants assessed the effect of exposure to traffic air pollution (NO2 and nitrogen oxides [NOx]) over 35 years on the incidence of COPD. The modeled 35-year mean of outdoor NO2 level was 17.0 μg/m3 or 9 ppb for the total population and 18.1 μg/m3 or 9.6 ppb for COPD patients. These levels were well below the current NAAQS NO2 standard of 53 ppb for annual mean. The study found that COPD incidence was associated with the 35-year mean NO2 level (hazard ratio 1.08; 95% CI 1.02–1.14, per IQR 5.8 μg/m3 or 3.1 ppb), with stronger associations in subjects with diabetes (hazard ratio 1.29; 95% CI 1.05–1.50) and asthma (hazard ratio 1.19; 95% CI 1.03–1.38)119 (Table 4). Another cohort study63 followed up all residents in Oslo, Norway, aged 51–90 years from 1992 to 1998 to evaluate the mortality of COPD. The elevated risk was found at NO2 levels >40 μg/m3 in the youngest age group and with a linear effect in the interval 20–60 μg/m3 for the oldest. The effects were particularly strong for COPD, which appeared to have linear effects. The levels (μg/m3) in this study were 39 for NO2 (or 20.7 ppb) and 15 for PM2.5, again well below the current NAAQS standard (24 hour mean =35 μg/m3 for PM2.5). A recent mortality study169 enrolled 145,681 COPD patients aged 35 years or older from the residents of Rome with a comparison group of 1,710,557 subjects without COPD. The annual average daily concentrations were 36.4 μg/m3 for PM10 and 20.2 μg/m3 for PM2.5, both below the limits recommended by European Union (EU) legislation (40 μg/m3 and 25 μg/m3, respectively). The annual average concentration of NO2 (60 μg/m3) was higher than the EU limit (40 μg/m3), and the 8-hour running mean concentration of O3 was <100 μg/m3. It was found that PM10, PM2.5, and NO2 (0- to 5-day lag) were associated with daily mortality with stronger effects in people with COPD. The mortality associated with PM10 (per IQR 16 μg/m3) was five times more in COPD patients (3.5%, 95% CI −0.1%–7.2%) than in other subjects (0.7%, 95% CI −0.8%–2.2%). The effects on respiratory mortality among COPD subjects were particularly elevated for PM2.5 (IQR 11 μg/m3; 11.6%, 95% CI 2.0%–22.2%) and NO2 (IQR 24 μg/m3; 19.6%, 95% CI 3.5%–38.2%).169 In Vancouver, Canada, a population-based study170 with 467,994 residents aged 45–85 years without COPD had a 5-year exposure period and a 4-year follow-up period. The 5-year average concentrations were 4.10 μg/m3 for PM2.5 and 32.2 μg/m3 (or 17 ppb) for NO2. In unadjusted single-pollutant models, PM2.5, NO2, and NO were associated with COPD hospitalization and mortality, although after adjustment for covariates, these air pollutants were not significantly associated with COPD hospitalization and mortality.170 As described earlier, Schikowski et al113 showed that chronic exposure to PM10, NO2, and living near a major road might increase the risk of developing COPD. The annual mean level was 39 μg/m3 (or 20.7 ppb) for NO2 and 44 μg/m3 for PM10 (Table 4). In a New Zealand study with COPD patients (Table 5),125 SO2 and NO2 and most PM10 concentrations were well below their air quality guidelines, but increased risk of chest symptoms for PM10 in the night time and increased use of an inhaler and nebulizer for NO2 were observed.
Sulzbach171 commented that epidemiological studies have shown that sensitive populations are prone to exacerbated health effects even when the air quality measurements are within the EPA standards. Specifically, Sulzbach investigated Minnesota to determine the constituents of the air pollution and measure the level of air pollution in the Twin Cities. The result of the study showed that Minnesota was one of eleven states that met federal air quality health standards at the time. However, there were still a significant number of days when the air quality could trigger health problems in sensitive populations.171
Bell et al172 estimated a national average relative rate of mortality associated with short-term exposure to ambient O3 for 95 large US urban communities from 1987 to 2000. They found that a 10 ppb increase in the previous week’s O3 was associated with a 0.52% increase in daily mortality (95% posterior interval [PI], 0.27%–0.77%) and a 0.64% increase in cardiovascular and respiratory mortalities (95% PI, 0.31%–0.98%). They indicated that even though the US EPA’s 8-hour regulation was met every day in each community, there was still a 0.30% increase in mortality per 10 ppb increase in the average of the same and previous days’ O3 levels (95% PI, 0.15%–0.45%). Therefore, they suggested that interventions to further reduce O3 pollution levels should be implemented so as to benefit public health, even in regions that meet current regulatory standards and guidelines.173
The WHO advised that due to the lack of thresholds of air pollutants at which adverse health effects occur, the guidelines proposed cannot fully protect human health.166
It should be noted that there were also some studies that do not support the associations between outdoor and indoor air pollution and the burden on COPD sufferers. For example, Schikowski et al174 used data from four cohort studies (10,242 subjects) participating in the European Study of Cohorts for Air Pollution Effects. The mean exposures varied from 9.5 μg/m3 to 17.8 μg/m3 for PM2.5, 15.7 μg/m3 to 26.7 μg/m3 for PM10, and 22.4 μg/m3 to 28.9 μg/m3 for NO2 among the cohorts. No association was found between NO2 and PM10 and COPD in individual cohorts. The meta-analysis with all the cohorts only found a nonsignificant association between NO2, NOx, PM10, and the traffic indicators and COPD, although a significant association was observed in females (1.57; 1.11–2.23 for prevalence and 1.79; 1.21–2.68 for incidence). Pujades-Rodríguez et al175 analyzed data from 2,644 adults aged 18–70 in Nottingham, UK, and found no significant cross-sectional associations between home proximity to the roadside or NO2 levels and COPD or lung function measurements. Similarly, a prospective cohort study in Greece with 3,046 subjects found no association between air pollution and the development of COPD.176
Although further research is needed to better assess the relationship, the majority of the literature has indicated that the impact on COPD suffers, including morbidity and mortality, due to air pollution is still detectable under the current air quality guidelines.
Discussion
Implications for future policy and decision-making
To reduce the impact of outdoor/indoor air pollution on COPD sufferers, a range of strategies and approaches need to be sought, which are summarized in the following categories based on this literature review.
Amendment to further lower current standards and guidelines
To evaluate whether improved air quality standards reduce the adverse health effects, the Harvard six cities study extended mortality follow-up for 8 years in a period of reduced air pollution concentrations.177 They focused on the PM2.5 concentrations, which were measured between 1979 and 1988 and estimated for later years from publicly available data. It was found that an increase in overall mortality was associated with each 10 μg/m3 increase in PM2.5 modeled either as the overall mean (rate ratio 1.16; 95% CI 1.07–1.26) or as exposure in the year of death (rate ratio 1.14; 95% CI 1.06–1.22). Improved overall mortality was associated with a decreased mean PM2.5 (10 μg/m3) between periods (rate ratio 0.73; 95% CI 0.57–0.95).177 This suggests that the mortality effects of long-term air pollution may be at least partially reversible.39 Pope et al found that a decrease of 10 μg/m3 in the concentration of fine PM was associated with an estimated increase in mean (± standard error) life expectancy of 0.61±0.20 years (P=0.004). Reductions in air pollution accounted for as much as 15% of the overall increase in life expectancy in the study areas.178
This indicates that it is beneficial to further tighten the current air quality guidelines around the world to reduce exposure levels and the effects on the general population and COPD sufferers.
Interventions to reduce sources of outdoor air pollution
The study conducted by Dockery et al179 in the Republic of Ireland well illustrated that reducing the air pollution from the source might be the most effective way to improve the air quality. In Ireland, domestic coal burning was a major source of repeated severe pollution episodes. The government introduced sequential bans in 1990, 1995, and 1998 on the marketing, sale, and distribution of coal in different cities. The authors compiled records of daily black smoke, total gaseous acidity (SO2), and counts of cause-specific deaths from 1981 to 2004 for several cities and counties. They also compiled daily counts of hospital admissions for cardiovascular, respiratory, and digestive diagnoses. They compared the results with counties not affected by the bans. The mean black smoke concentrations fell in all affected population centers post-ban compared with the preban period, with decreases ranging from 4 μg/m3 to 35 μg/m3 (corresponding to reductions of 45% to 70%, respectively). Respiratory mortality was reduced in association with the bans in 1990, 1995, and 1998 (17%, 9%, and 3%, respectively). A 4% decrease in hospital admissions for cardiovascular disease associated with the 1995 ban and a 3% decrease with the 1998 ban were found, and admissions for pneumonia, COPD, and asthma were reduced.179 Boogaard et al180 found that implementing local traffic policies including low emission zones directed at heavy duty vehicles (trucks) in five Dutch cities reduced all pollutant levels, especially PM2.5 levels (20%–30%) and NO2 and NOx levels (25%–41%) in various areas. A recent review indicated that overall air pollution interventions have succeeded at improving air quality and also have been associated with health benefits, mainly reduced cardiovascular and/or respiratory mortality and/or morbidity.181
These studies suggest that exposure control at the source can more efficiently reduce the air pollution level and therefore the human exposure and adverse outcomes.
Intervention to reduce indoor biomass air pollution in low-income countries
Since most countries probably do not have indoor air pollution standards and indoor air environments are generally not regulated, other measures to reduce indoor exposures to air pollutants from biomass or other solid fuels need to be developed, which could include a range of methods targeting the emission source (improved cook stoves or cleaner fuels), the indoor environment (improved ventilation and better design to separate the sources from main activity rooms), and the residents’ behaviors (to avoid direct exposure to the sources and for females not to carry young children on their back during cooking as this is a tradition in some rural areas in low-income countries). A recent review focusing on the People’s Republic of China as a typical case by Zhang and Smith182 indicated that >180 million improved stoves with chimneys were introduced since the early 1980s. These stove programs have helped reduce the exposures. While randomized trials are difficult to do in the People’s Republic of China, natural experiments from Xuanwei County in Southwest People’s Republic of China indicated that installation of a chimney on the stove was associated with distinct reduction in the incidence of COPD.155 The RR comparing stove users with or without a chimney was 0.58 (95% CI 0.49–0.70, P<0.001) in males and 0.75 (95% CI 0.62–0.92, P=0.005) in females. A 9-year prospective cohort study was conducted among 996 participants aged 40 years or older from November 1, 2002, through November 30, 2011, in 12 villages in southern People’s Republic of China by Zhou et al.183 The intervention measures included improving kitchen ventilation (providing instruction or installing exhaust fans) and promoting the use of clean fuels (ie, biogas) instead of biomass for cooking (providing instruction and installing household biogas digesters). The study found that the combined intervention measures reduced the decline in FEV1, with a slowing rate of 16 mL/year (95% CI 9–23 mL/year). The longer the duration of the intervention measures used, the slower the decline of FEV1. The reduction in the overall risk of COPD was an OR of 0.28 (95% CI 0.11–0.73) for both intervention measures.
Intervention measures such as improved stoves, cleaner fuels, and other feasible and economical methods need to be tailored to the situation in each community based on affordability, effectiveness, and local culture so as to reduce the high exposure to biomass pollution and large COPD burden in nonsmoking females in low-income countries.
Integrated intervention and management program for COPD sufferers
A total of 1,062 subjects with or without COPD in a study in Guangdong, People’s Republic of China, by Zhou et al184 randomly evaluated the effectiveness of integrated interventions, which included systematic health education, intensive and individualized intervention, treatment, and rehabilitation. The annual rate of decline in FEV1 was significantly lower in the intervention community than in the control community, with an adjusted difference of 19 mL/year (95% CI 3–36) and 0.9% (0.1%–1.8%) of predicted values (all P<0.05), as well as a lower annual rate of decline in FEV1/FVC ratio at 0.6% (0.1%–1.2%). Shofer et al185 recommended that patients at increased risk for adverse effects of inhaled air pollutants, such as those who have been diagnosed with chronic lung disease and cardiovascular disease, including asthma, COPD, coronary artery disease, congestive heart failure, and peripheral vascular disease, should be educated regarding what symptoms may be related to poor air quality and how they can monitor the Air Quality Index to modify their activity to prevent symptoms and other adverse events. Heavy outdoor exertion should be avoided on days expected to have poor air quality or performed earlier in the day on days when outdoor activity cannot be avoided.
Conclusion and future directions
While air quality standards and guidelines have reduced human exposure overall and exposure of COPD sufferers in particular to PM and gaseous air pollutants around the world, health effects measured as mortality and morbidity still occur with COPD patients in the form of exacerbation or lead to the increased incidence of COPD in the general population. Further improvement in current air quality guidelines seems necessary at the government level, but other policy and exposure control measures could be implemented locally or at the personal level. Continued epidemiologic research, particularly long-term prospective cohort studies involving multiple countries or cities to evaluate the effects of multiple pollutants and their interactions on the COPD burden, is needed in both high-income and low- to middle-income countries. Additionally, more intervention studies targeting reduced exposures and improved outcomes specifically for COPD sufferers are needed.
Disclosure
Dr Liu is the recipient of a research grant (5R03OH009815) and a contract (200-2015-M-63768) from the National Institute for Occupational Safety and Health and a Clinical Scholars Award from Cook Children’s Health Care System. The authors report no other conflicts of interest in this work.
References
Goldcopd.org [webpage on the Internet]. Global Strategy for the Diagnosis, Management and Prevention of COPD. New York, NY: Global Initiative for Chronic Obstructive Lung Disease. Available from: http://www.goldcopd.org/uploads/users/files/GOLD_Report2014_Feb07.pdf. Accessed August 10, 2015. | ||
American Thoracic Society. What constitutes an adverse health effect of air pollution? Official statement of the American Thoracic Society. Am J Respir Crit Care Med. 2000;161:665–673. | ||
Lung.org [webpage on the Internet]. Trends in COPD (Chronic Bronchitis and Emphysema): Morbidity and Mortality. Chicago: American Lung Association. Available from: http://www.lung.org/assets/documents/research/copd-trend-report.pdf. Accessed October 26, 2015. | ||
Who.int [webpage on the Internet]. COPD: Definition. Geneva: World Health Organization. Available from: http://www.who.int/respiratory/copd/burden/en/. Accessed October 26, 2015. | ||
Mannino DM, Buist AS. Global burden of COPD: risk factors, prevalence, and future trends. Lancet. 2007;370(9589):765–773. | ||
Buist AS, McBurnie MA, Vollmer WM, et al; BOLD Collaborative Research Group. International variation in the prevalence of COPD (the BOLD Study): a population-based prevalence study. Lancet. 2007;370(9589):741–750. [Erratum in: Lancet. 2012;380(9844):806]. | ||
McCarthy J [webpage on the Internet]. In U.S., Smoking Rate Lowest in Utah, Highest in Kentucky. Washington, D.C.: Gallup. Available from: http://www.gallup.com/poll/167771/smoking-rate-lowest-utah-highest-kentucky.aspx. Accessed October 26, 2015. | ||
Menezes AM, Perez-Padilla R, Jardim JR, et al; PLATINO Team. Chronic obstructive pulmonary disease in five Latin American cities (the PLATINO study): a prevalence study. Lancet. 2005;366:1875–1881. | ||
Antó JM, Vermeire P, Vestbo J, Sunyer J. Epidemiology of chronic obstructive pulmonary disease. Eur Respir J. 2001;17(5):982–994. | ||
Mathers C, Fat DM, Boerma JT; WHO. The Global Burden of Disease: 2004 Update. Geneva: WHO; 2008:1–146. | ||
Marsh S, Aldington S, Shirtcliffe P, Weatherall M, Beasley R. Smoking and COPD: what really are the risks? Eur Respir J. 2006;28(4):883–884. | ||
Lundback B, Lindberg A, Lindstrom M, et al; Obstructive Lung Disease in Northern Sweden Studies. Not 15 but 50% of smokers develop COPD? Report from the obstructive lung disease in Northern Sweden studies. Respir Med. 2003;97:115–122. | ||
Lindberg A, Bjerg A, Rönmark E, Larsson LG, Lundbäck B. Prevalence and underdiagnosis of COPD by disease severity and the attributable fraction of smoking report from the obstructive lung disease in Northern Sweden Studies. Respir Med. 2006;100(2):264–272. | ||
Viegi G, Scognamiglio A, Baldacci S, Pistelli F, Carrozzi L. Epidemiology of chronic obstructive pulmonary disease (COPD). Respiration. 2001;68(1):4–19. | ||
Diaz-Guzman E, Mannino DM. Epidemiology and prevalence of chronic obstructive pulmonary disease. Clin Chest Med. 2014;35(1):7–16. | ||
Issac MS, Ashur W, Mousa H. Genetic polymorphisms of surfactant protein D rs2243639, Interleukin (IL)-1β rs16944 and IL-1RN rs2234663 in chronic obstructive pulmonary disease, healthy smokers, and non-smokers. Mol Diagn Ther. 2014;18(3):343–354. | ||
Bossé Y. Updates on the COPD gene list. Int J Chron Obstruct Pulmon Dis. 2012;7:607–631. | ||
Sadeghnejad A, Ohar JA, Zheng SL, et al. Adam33 polymorphisms are associated with COPD and lung function in long-term tobacco smokers. Respir Res. 2009;10:21. | ||
Ohar JA, Hamilton RF Jr, Zheng S, et al. COPD is associated with a macrophage scavenger receptor-1 gene sequence variation. Chest. 2010;137(5):1098–1107. | ||
Yuan Y, Hou X, Zhang J, Chen Y, Feng Y, Su Z. Genetic variations in RORα are associated with chronic obstructive pulmonary disease. J Hum Genet. 2014;59(8):430–436. | ||
Wang B, Zhou H, Yang J, et al. Association of HHIP polymorphisms with COPD and COPD-related phenotypes in a Chinese Han population. Gene. 2013;531(1):101–105. | ||
Wang B, Liang B, Yang J, et al. Association of FAM13A polymorphisms with COPD and COPD-related phenotypes in Han Chinese. Clin Biochem. 2013;46(16–17):1683–1688. | ||
Rodriguez-Gonzalez E, Ferrer-Sancho J. Occupational exposure and COPD. Curr Respir Med Rev. 2012;8:436–440. | ||
Becklake MR. Relationship of acute obstructive airway change to chronic (fixed) obstruction. Thorax. 1995;50(suppl 1):S16–S21. | ||
Christiani DC, Wang XR, Pan LD, et al. Longitudinal changes in pulmonary function and respiratory symptoms in cotton textile workers. A 15-yr follow-up study. Am J Respir Crit Care Med. 2001;163(4):847–853. | ||
Moira CY, Enarson DA, Kennedy SM. The impact of grain dust on respiratory health. Am Rev Respir Dis. 1992;145(2 pt 1):476–487. | ||
Noertjojo HK, Dimich-Ward H, Peelen S, Dittrick M, Kennedy SM, Chan-Yeung M. Western red cedar dust exposure and lung function: a dose-response relationship. Am J Respir Crit Care Med. 1996;154(4 pt 1):968–973. | ||
Christiani DC. Organic dust exposure and chronic airway disease. Am J Respir Crit Care Med. 1996;154:833–834. | ||
Coggon D, Newman Taylor A. Coal mining and chronic obstructive pulmonary disease: a review of the evidence. Thorax. 1998;53(5):398–407. | ||
Al-Neaimi YI, Gomes J, Lloyd OL. Respiratory illnesses and ventilator function among workers at a cement factory in a rapidly developing country. Occup Med (Lond). 2001;51(6):367–373. | ||
Fishwick D, Bradshaw LM, D’Souza W, et al. Chronic bronchitis, shortness of breath, and airway obstruction by occupation in New Zealand. Am J Respir Crit Care Med. 1997;156(5):1440–1446. | ||
Davison AG, Fayers PM, Taylor AJ, et al. Cadmium fume inhalation and emphysema. Lancet. 1988;1(8587):663–667. | ||
Sferlazza SJ. The respiratory health of welders. Am Rev Respir Dis. 1991;143(5 pt 1):1134–1148. | ||
Balmes J, Becklake M, Blanc P, et al; Environmental and Occupational Health Assembly, American Thoracic Society. Environmental and Occupational Health Assembly, American Thoracic Society. American Thoracic Society Statement: occupational contribution to the burden of airway disease. Am J Respir Crit Care Med. 2003;167(5):787–797. | ||
Kampa M, Castanas E. Human health effects of air pollution. Environ Pollut. 2008;151(2):362–367. | ||
Samet JM. Air pollution and epidemiology: “déjà vu all over again?”. Epidemiology. 2002;13(2):118–119. | ||
MacNee W, Donaldson K. Exacerbations of COPD: environmental mechanisms. Chest. 2000;117(5 suppl 2):390S–397S. | ||
Sunyer J. Urban air pollution and chronic obstructive pulmonary disease: a review. Eur Respir J. 2001;17:1024–1033. | ||
Dockery DW. Health effects of particulate air pollution. Ann Epidemiol. 2009;19(4):257–263. | ||
Bell ML, David DL. Reassessment of the lethal London fog of 1952: novel indicators of acute and chronic consequences of acute exposure to air pollution. Environ Health Perspect. 2001;109(suppl 3):389–394. | ||
Schwartz J, Marcus A. Mortality and air pollution in London: a time series analysis. Am J Epidemiol. 1990;131(1):185–194. | ||
Anderson HR, Limb ES, Bland JM, Ponce de Leon A, Strachan DP, Bower JS. Health effects of an air pollution episode in London, December 1991. Thorax. 1995;50(11):1188–1193. | ||
Nemery B, Hoet PH, Nemmar A. The Meuse Valley fog of 1930: an air pollution disaster. Lancet. 2001;357(9257):704–708. | ||
EPA.gov [webpage on the Internet]. Then, Now and Future. Washington, DC: EPA’s Air, Climate, and Energy Research. Available from: www2.epa.gov/air-research/history-air-pollution. Accessed October 26, 2015. | ||
Dockery DW, Pope CA 3rd, Xu X, et al. An association between air pollution and mortality in six U.S. cities. N Engl J Med. 1993;329:1753–1759. | ||
Ware JH, Ferris BG Jr, Dockery DW, Spengler JD, Stram DO, Speizer FE. Effects of ambient sulfur oxides and suspended particles on respiratory health of preadolescent children. Am Rev Respir Dis. 1986;133(5):834–842. | ||
Dassen W, Brunekreef B, Hoek G, et al. Decline in children’s pulmonary function during an air pollution episode. J Air Pollut Control Assoc. 1986;36:1223–1227. | ||
Dockery DW, Ware JH, Ferris BG Jr, Speizer FE, Cook NR, Herman SM. Change in pulmonary function in children associated with air pollution episodes. J Air Pollut Control Assoc. 1982;32:937–942. | ||
Greenbaum DS, Bachmann JD, Krewski D, Samet JM, White R, Wyzga RE. Particulate air pollution standards and morbidity and mortality: case study. Am J Epidemiol. 2001;154(12 suppl):S78–S90. | ||
Katsouyanni K, Touloumi G, Spix C, et al. Short-term effects of ambient sulphur dioxide and particulate matter on mortality in 12 European cities: results from time series data from the APHEA project. Air pollution and health: a European approach. BMJ. 1997;314:1658–1663. | ||
Katsouyanni K, Touloumi G, Samoli E, et al. Confounding and effect modification in the short-term effects of ambient particles on total mortality: results from 29 European cities within the APHEA2 project. Epidemiology. 2001;12:521–531. | ||
Samet JM, Dominici F, Zeger SL, Schwartz J, Dockery DW. The national morbidity, mortality, and air pollution study. Part I: methods and methodologic issues. Res Rep Health Eff Inst. 2000;94(pt 1):5–14. | ||
Samet JM, Zeger SL, Dominici F, et al. The national morbidity, mortality, and air pollution study. Part II: morbidity and mortality from air pollution in the United States. Res Rep Health Eff Inst. 2000;94(pt 2):5–70. | ||
Pope CA 3rd, Burnett RT, Thun MJ, et al. Lung cancer, cardiopulmonary mortality, and long-term exposure to fine particulate air pollution. JAMA. 2002;287:1132–1141. | ||
Schwartz J, Dockery DW. Increased mortality in Philadelphia associated with daily air pollution concentrations. Am Rev Respir Dis. 1992;145(3):600–604. | ||
Xu X, Gao J, Dockery DW, Chen Y. Air pollution and daily mortality in residential areas of Beijing, China. Arch Environ Health. 1994;49(4):216–222. | ||
Rossi G, Vigotti MA, Zanobetti A, Repetto F, Gianelle V, Schwartz. Air pollution and cause-specific mortality in Milan, Italy, 1980–1989. Arch Environ Health. 1999;54(3):158–164. | ||
Xu Z, Yu D, Jing L, Xu X. Air pollution and daily mortality in Shenyang, China. Arch Environ Health. 2000;55(2):115–120. | ||
Tellez-Rojo MM, Romieu I, Ruiz-Velasco S, Lezana MA, Hernandez-Avila MM. Daily respiratory mortality and PM10 pollution in Mexico City: importance of considering place of death. Eur Respir J. 2000;16:391–396. | ||
Wong TW, Tam WS, Yu TS, Wong AH. Associations between daily mortalities from respiratory and cardiovascular diseases and air pollution in Hong Kong, China. Occup Environ Med. 2002;59(1):30–35. | ||
Kan H, Chen B. Air pollution and daily mortality in Shanghai: a time-series study. Arch Environ Health. 2003;58:360–367. | ||
Zeka A, Zanobetti A, Schwartz J. Short term effects of particulate matter on cause specific mortality: effects of lags and modification by city characteristics. Occup Environ Med. 2005;62:718–725. | ||
Naess Ø, Nafstad P, Aamodt G, Claussen B, Rosland P. Relation between concentration of air pollution and cause-specific mortality: four-year exposures to nitrogen dioxide and particulate matter pollutants in 470 neighborhoods in Oslo, Norway. Am J Epidemiol. 2007;165(4):435–443. | ||
Meng X, Wang C, Cao D, Wong C, Kan H. Short-term effect of ambient air pollution on COPD mortality in four Chinese cities. Atmos Environ. 2013;77:149–154. | ||
Samoli E, Stafoggia M, Rodopoulou S, et al; MED-PARTICLES Study Group. Which specific causes of death are associated with short term exposure to fine and coarse particles in southern Europe? Results from the MED-PARTICLES project. Environment Int. 2014;67:54–61. | ||
Rhoden CR, Wellenius GA, Ghelfi E, Lawrence J, Gonzalez-Flecha B. PM-induced cardiac oxidative stress and dysfunction are mediated by autonomic stimulation. Biochim Biophys Acta. 2005;1725:305–313. | ||
Roberts ES, Richards JH, Jaskot R, Dreher KL. Oxidative stress mediates air pollution particle-induced acute lung injury and molecular pathology. Inhal Toxicol. 2003;15:1327–1346. | ||
Rabl A. Air pollution mortality: harvesting and loss of life expectancy. J Toxicol Environ Health A. 2005;68:1175–1180. | ||
Bates DV. Health indices of the adverse effects of air pollution: the question of coherence. Environ Res. 1992;59(2):336–349. | ||
Sunyer J, Antó JM, Murillo C, Saez M. Effects of urban air pollution on emergency room admissions for chronic obstructive pulmonary disease. Am J Epidemiol. 1991;134(3):277–286. [discussion 287–289]. | ||
Sunyer J, Sáez M, Murillo C, Castellsague J, Martínez F, Antó JM. Air pollution and emergency room admissions for chronic obstructive pulmonary disease: a 5-year study. Am J Epidemiol. 1993;137(7):701–705. | ||
Pönkä A, Virtanen M. Chronic bronchitis, emphysema, and low-level air pollution in Helsinki, 1987–1989. Environ Res. 1994;65(2):207–217. | ||
Schwartz J. PM10, ozone, and hospital admissions for the elderly in Minneapolis-St. Paul, Minnesota. Arch Environ Health. 1994;49:366–374. | ||
Schwartz J. Air pollution and hospital admissions for the elderly in Detroit, Michigan. Am J Respir Crit Care Med. 1994;150:648–655. | ||
Schwartz J. Air pollution and hospital admissions for the elderly in Birmingham, Alabama. Am J Epidemiol. 1994;139(6):589–598. | ||
Burnett RT, Dales RE, Raizenne ME, et al. Effects of low ambient levels of ozone and sulfates on the frequency of respiratory admissions to Ontario hospitals. Environ Res. 1994;65(2):172–194. | ||
Schouten JP, Vonk JM, de Graaf A. Short term effects of air pollution on emergency hospital admissions for respiratory disease: results of the APHEA project in two major cities in the Netherlands, 1977–89. J Epidemiol Community Health. 1996;50(suppl 1):S22–S29. | ||
Anderson HR, Spix C, Medina S, et al. Air pollution and daily admissions for chronic obstructive pulmonary disease in 6 European cities: results from the APHEA project. Eur Respir J. 1997;10:1064–1071. | ||
Morgan G, Corbett S, Wlodarczyk J. Air pollution and hospital admissions in Sydney, Australia, 1990 to 1994. Am J Public Health. 1998;88:1761–1766. | ||
Chen L, Yang W, Jennison BL, Omaye ST. Air particulate pollution and hospital admissions for chronic obstructive pulmonary disease in Reno, Nevada. Inhal Toxicol. 2000;12:281–298. | ||
Tolbert PE, Klein M, Metzger KB, et al. Interim results of the study of particulates and health in Atlanta (SOPHIA). J Expo Anal Environ Epidemiol. 2000;10(5):446–460. | ||
Fusco D, Forastiere F, Michelozzi P, et al. Air pollution and hospital admissions for respiratory conditions in Rome, Italy. Eur Respir J. 2001;17:1143–1150. | ||
Tenías JM, Ballester F, Pérez-Hoyos S, Rivera ML. Air pollution and hospital emergency room admissions for chronic obstructive pulmonary disease in Valencia, Spain. Arch Environ Health. 2002;57(1):41–47. | ||
Chen Y, Yang Q, Krewski D, Shi Y, Burnett RT, McGrail K. Influence of relatively low level of particulate air pollution on hospitalization for COPD in elderly people. Inhal Toxicol. 2004;16(1):21–25. | ||
Peel JL, Tolbert PE, Klein M, et al. Ambient air pollution and respiratory emergency department visits. Epidemiology. 2005;16(2):164–174. | ||
Yang Q, Chen Y, Krewski D, Burnett RT, Shi Y, McGrail KM. Effect of short-term exposure to low levels of gaseous pollutants on chronic obstructive pulmonary disease hospitalizations. Environ Res. 2005;99:99–105. | ||
Hinwood AL, De Klerk N, Rodriguez C, et al. The relationship between changes in daily air pollution and hospitalizations in Perth, Australia 1992–1998: a case-crossover study. Int J Environ Health Res. 2006;16(1):27–46. | ||
Dominici F, Peng RD, Bell ML, et al. Fine particulate air pollution and hospital admission for cardiovascular and respiratory diseases. JAMA. 2006;295(10):1127–1134. | ||
Medina-Ramón M, Zanobetti A, Schwartz J. The effect of ozone and PM10 on hospital admissions for pneumonia and chronic obstructive pulmonary disease: a national multicity study. Am J Epidemiol. 2006;163(6):579–588. | ||
Sauerzapf V, Jones AP, Cross J. Environmental factors and hospitalisation for chronic obstructive pulmonary disease in a rural county of England. J Epidemiol Community Health. 2009;63(4):324–328. | ||
Belleudi V, Faustini A, Stafoggia M, et al. Impact of fine and ultrafine particles on emergency hospital admissions for cardiac and respiratory diseases. Epidemiology. 2010;21(3):414–423. | ||
Cirera L, García-Marcos L, Giménez J, et al. Daily effects of air pollutants and pollen types on asthma and COPD hospital emergency visits in the industrial and Mediterranean Spanish city of Cartagena. Allergol Immunopathol (Madr). 2012;40(4):231–237. | ||
Liu X, Lessner L, Carpenter DO. Association between residential proximity to fuel-fired power plants and hospitalization rate for respiratory diseases. Environ Health Perspect. 2012;120(6):807–810. | ||
Faustini A, Stafoggia M, Colais P, et al; EpiAir Collaborative Group. Air pollution and multiple acute respiratory outcomes. Eur Respir J. 2013;42(2):304–313. | ||
Kloog I, Nordio F, Zanobetti A, Coull BA, Koutrakis P, Schwartz JD. Short term effects of particle exposure on hospital admissions in the Mid-Atlantic States: a population estimate. PLoS One. 2014;9(2):e88578. | ||
Yorifuji T, Suzuki E, Kashima S. Hourly differences in air pollution and risk of respiratory disease in the elderly: a time-stratified case-crossover study. Environ Health. 2014;13:67. | ||
Wong TW, Lau TS, Yu TS, et al. Air pollution and hospital admissions for respiratory and cardiovascular diseases in Hong Kong. Occup Environ Med. 1999;56(10):679–683. | ||
Burrillo JM, Díez FB, Pérez-Hoyos S. Use of different hospital data bases in the estimation of the relation between air pollution and chronic obstructive pulmonary disease. Epidemiology. 2001;12(2):280. | ||
Pande JN, Bhatta N, Biswas D, et al. Outdoor air pollution and emergency room visits at a hospital in Delhi. Indian J Chest Dis Allied Sci. 2002;44(1):13–19. | ||
Gouveia N, de Freitas CU, Martins LC, Marcilio IO. Hospitalizações por causas respiratórias e cardiovasculares associadas à contaminação atmosférica no Município de São Paulo, Brasil [Respiratory and cardiovascular hospitalizations associated with air pollution in the city of Sao Paulo, Brazil]. Cad Saúde Pública. 2006;22:2669–2677. [Portuguese]. | ||
Yang CY, Chen CJ. Air pollution and hospital admissions for chronic obstructive pulmonary disease in a subtropical city: Taipei, Taiwan. J Toxicol Environ Health A. 2007;70(14):1214–1219. | ||
Lee IM, Tsai SS, Chang CC, Ho CK, Yang CY. Air pollution and hospital admissions for chronic obstructive pulmonary disease in a tropical city: Kaohsiung, Taiwan. Inhal Toxicol. 2007;19(5):393–398. | ||
Ko FW, Tam W, Wong TW, et al. Temporal relationship between air pollutants and hospital admissions for chronic obstructive pulmonary disease in Hong Kong. Thorax. 2007;62(9):780–785. | ||
Arbex MA, de Souza Conceição GM, Cendon SP, et al. Urban air pollution and chronic obstructive pulmonary disease-related emergency department visits. J Epidemiol Community Health. 2009;63(10):777–783. | ||
Milutinović S, Nikić D, Stosić L, Stanković A, Bogdanović D. Short-term association between air pollution and emergency room admissions for chronic obstructive pulmonarydisease in Nis, Serbia. Cent Eur J Public Health. 2009;17(1):8–13. | ||
Qiu H, Yu ITS, Wang X, Tian L, Tse LA, Wong TW. Season and humidity dependence of the effects of air pollution on COPD hospitalizations in Hong Kong. Atmos Environ. 2013;76:74–80. | ||
Tsai SS, Chang CC, Yang CY. Fine particulate air pollution and hospital admissions for chronic obstructive pulmonary disease: a case-crossover study in Taipei. Int J Environ Res Public Health. 2013;10(11):6015–6026. | ||
Ghozikali MG, Mosaferi M, Safari GH, Jaafari J. Effect of exposure to O3, NO2, and SO2 on chronic obstructive pulmonary disease hospitalizations in Tabriz, Iran. Environ Sci Pollut Res Int. 2015;22(4):2817–2823. | ||
Tzonou A, Maragoudakis G, Trichopoulos D, et al. Urban living, tobacco smoking, and chronic obstructive pulmonary disease: a study in Athens. Epidemiology. 1992;3(1):57–60. | ||
Tashkin DP, Detels R, Simmons M, et al. The UCLA population studies of chronic obstructive respiratory disease: XI. Impact of air pollution and smoking on annual change in forced expiratory volume in one second. Am J Respir Crit Care Med. 1994;149:1209–1217. | ||
Ackermann-Liebrich U, Leuenberger P, Schwartz J, et al. Lung function and long term exposure to air pollutants in Switzerland. Study on air pollution and lung diseases in adults (SAPALDIA) Team. Am J Respir Crit Care Med. 1997;155:122–129. | ||
Avino P, De Lisio V, Grassi M, et al. Influence of air pollution on chronic obstructive respiratory diseases: comparison between city (Rome) and hillcountry environments and climates. Ann Chim. 2004;94(9–10):629–635. | ||
Schikowski T, Sugiri D, Ranft U, et al. Long-term air pollution exposure and living close to busy roads are associated with COPD in women. Respir Res. 2005;6:152. | ||
Sunyer J, Jarvis D, Gotschi T, et al. Chronic bronchitis and urban air pollution in an international study. Occup Environ Med. 2006;63(12):836–843. | ||
Cesaroni G, Badaloni C, Porta D, Forastiere F, Perucci CA. Comparison between various indices of exposure to traffic-related air pollution and their impact on respiratory health in adults. Occup Environ Med. 2008;65(10):683–690. | ||
Lindgren A, Stroh E, Montnémery P, Nihlén U, Jakobsson K, Axmon A. Traffic-related air pollution associated with prevalence of asthma and COPD/chronic bronchitis. A cross-sectional study in Southern Sweden. Int J Health Geogr. 2009;8:2. | ||
Bentayeb M, Helmer C, Raherison C, Tessier JF, Annesi-Maesano I. Bronchitis-like symptoms and proximity air pollution in French elderly. Respir Med. 2010;104(6):880–888. | ||
Nuvolone D, Della Maggiore R, Maio S, et al. Geographical information system and environmental epidemiology: a cross-sectional spatial analysis of the effects of traffic-related air pollution on population respiratory health. Environ Health. 2011;10:12. | ||
Andersen ZJ, Hvidberg M, Jensen SS, et al. Chronic obstructive pulmonary disease and long-term exposure to traffic-related air pollution: a cohort study. Am J Respir Crit Care Med. 2011;183(4):455–461. | ||
Salameh P, Salame J, Khayat G, et al. Exposure to outdoor air pollution and chronic bronchitis in adults: a case-control study. Int J Occup Environ Med. 2012;3(4):165–177. | ||
Rice MB, Ljungman PL, Wilker EH, et al. Long-term exposure to traffic emissions and fine particulate matter and lung function decline in the Framingham heart study. Am J Respir Crit Care Med. 2015;191(6):656–664. | ||
To T, Zhu J, Villeneuve PJ, et al. Chronic disease prevalence in women and air pollution – a 30-year longitudinal cohort study. Environ Int. 2015;80:26–32. | ||
Adamkiewicz Ł, Gayer A, Mucha D, Badyda AJ, Dąbrowiecki P, Grabski P. Relative risk of lung obstruction in relation to PM10 concentration as assessed by pulmonary function tests. Adv Exp Med Biol. 2015;849:83–91. | ||
Lawther PJ, Waller RE, Henderson M. Air pollution and exacerbations of bronchitis. Thorax. 1970;5:525–539. | ||
Harré ES, Price PD, Ayrey RB, Toop LJ, Martin IR, Town GI. Respiratory effects of air pollution in chronic obstructive pulmonary disease: a three month prospective study. Thorax. 1997;52(12):1040–1044. | ||
Linn WS, Gong H Jr, Clark KW, Anderson KR. Day-to-day particulate exposures and health changes in Los Angeles area residents with severe lung disease. J Air Waste Manag Assoc. 1999;49(9 Spec No):108–115. | ||
Sunyer J, Schwartz J, Tobias A, Macfarlane D, Garcia J, Anto JM. Patients with chronic obstructive pulmonary disease are at increased risk of death associated with urban particle air pollution: a case-crossover analysis. Am J Epidemiol. 2000;151(1):50–56. | ||
Sunyer J, Basagaña X. Particles, and not gases, are associated with the risk of death in patients with chronic obstructive pulmonary disease. Int J Epidemiol. 2001;30(5):1138–1140. | ||
Desqueyroux H, Pujet JC, Prosper M, Le Moullec Y, Momas I. Effects of air pollution on adults with chronic obstructive pulmonary disease. Arch Environ Health. 2002;57(6):554–560. | ||
Silkoff PE, Zhang L, Dutton S, et al. Winter air pollution and disease parameters in advanced chronic obstructive pulmonary disease panels residing in Denver, Colorado. J Allergy Clin Immunol. 2005;115(2):337–344. | ||
Trenga CA, Sullivan JH, Schildcrout JS, et al. Effect of particulate air pollution on lung function in adult and pediatric subjects in a Seattle panel study. Chest. 2006;129(6):1614–1622. | ||
Lagorio S, Forastiere F, Pistelli R, et al. Air pollution and lung function among susceptible adult subjects: a panel study. Environ Health. 2006;5:11. | ||
Peacock JL, Anderson HR, Bremner SA, et al. Outdoor air pollution and respiratory health in patients with COPD. Thorax. 2011;66(7):591–596. | ||
Pope CA 3rd, Bates DV, Raizenne ME. Health effects of particulate air pollution: time for reassessment? Environ Health Perspect. 1995;103(5):472–480. | ||
EPA.gov [webpage on the Internet]. Indoor Air Quality. Washington, DC: EPA. Available from: http://cfpub.epa.gov/roe/chapter/air/indoorair.cfm. Accessed on October 26, 2015. | ||
Zhang J, Smith KR, Ma Y, et al. Greenhouse gases and other airborne pollutants from household stoves in China: a database for emission factors. Atmos Environ. 2000;34:4537–4549. | ||
Shrestha IL, Shrestha SL. Indoor air pollution from biomass fuels and respiratory health of the exposed population in Nepalese households. Int J Occup Environ Health. 2005;11:150–160. | ||
Naeher LP, Brauer M, Lipsett M, et al. Woodsmoke health effects: a review. Inhal Toxicol. 2007;19:67–106. | ||
Smith KR. Inaugural article: national burden of disease in India from indoor air pollution. Proc Natl Acad Sci U S A. 2000;97:13286–13293. | ||
Smith KR. Biofuels, Air Pollution and Health: A Global Review. New York, NY: Plenum Press; 1987. | ||
Woolcock AJ, Blackburn CR. Chronic lung disease in the territory of Papula and New Guinea-an epidemiological study. Australas Ann Med. 1967;16:11–19. | ||
Cleary GJ, Blackburn RB. Air pollution in native huts in the highlands of New Guinea. Arch Environ Health. 1968;17:785–794. | ||
Pandey MR. Domestic smoke pollution and chronic bronchitis in a rural community of the Hill Region of Nepal. Thorax. 1984;39(5):337–339. | ||
Behera D, Jindal SK. Respiratory symptoms in Indian women using domestic cooking fuels. Chest. 1991;100(2):385–388. | ||
Menezes AM, Victora CG, Rigatto M. Prevalence and risk factors for chronic bronchitis in Pelotas, RS, Brazil: a population-based study. Thorax. 1994;49(12):1217–1221. | ||
Dossing M, Khan J, al-Rabiah F. Risk factors for chronic obstructive lung disease in Saudi Arabia. Respir Med. 1994;88:519–522. | ||
Dennis RJ, Maldonado D, Norman S, Baena E, Martinez G. Woodsmoke exposure and risk for obstructive airways disease among women. Chest. 1996;109:115–119. | ||
Perez-Padilla R, Regalado J, Vedal S, et al. Exposure to biomass smoke and chronic airway disease in Mexican women. A case-control study. Am J Respir Crit Care Med. 1996;154:701–706. | ||
Ellegård A. Cooking fuel smoke and respiratory symptoms among women in low-income areas in Maputo. Environ Health Perspect. 1996;104(9):980–985. | ||
Albalak R, Frisancho AR, Keeler GJ. Domestic biomass fuel combustion and chronic bronchitis in two rural Bolivian villages. Thorax. 1999;54(11):1004–1008. | ||
Golshan M, Faghihi M, Marandi MM. Indoor women jobs and pulmonary risks in rural areas of Isfahan, Iran, 2000. Respir Med. 2002;96(6):382–388. | ||
Kiraz K, Kart L, Demir R, et al. Chronic pulmonary disease in rural women exposed to biomass fumes. Clin Invest Med. 2003;26:243–248. | ||
Ekici A, Ekici M, Kurtipek E, et al. Obstructive airway diseases in women exposed to biomass smoke. Environ Res. 2005;99:93–98. | ||
Peabody JW, Riddell TJ, Smith KR, et al. Indoor air pollution in rural China: cooking fuels, stoves, and health status. Arch Environ Occup Health. 2005;60:86–95. | ||
Chapman RS, He X, Blair AE, Lan Q. Improvement in household stoves and risk of chronic obstructive pulmonary disease in Xuanwei, China: retrospective cohort study. BMJ. 2005;331(7524):1050. | ||
Sezer H, Akkurt I, Guler N, Berk S. A case-control study on the effect of exposure to different substances on the development of COPD. Ann Epidemiol. 2006;16(1):59–62. | ||
Akhtar T, Ullah Z, Khan MH, Nazli R. Chronic bronchitis in women using solid biomass fuel in rural Peshawar, Pakistan. Chest. 2007;132(5):1472–1475. | ||
Liu S, Zhou Y, Wang X, et al. Biomass fuels are the probable risk factor for chronic obstructive pulmonary disease in rural South China. Thorax. 2007;62:889–897. | ||
Zhong N, Wang C, Yao W, et al. Prevalence of chronic obstructive pulmonary disease in China: a large, population-based survey. Am J Respir Crit Care Med. 2007;176(8):753–760. [Erratum in: Am J Respir Crit Care Med. 2007;176(11):1169]. | ||
Desalu OO, Adekoya AO, Ampitan BA. Increased risk of respiratory symptoms and chronic bronchitis in women using biomass fuels in Nigeria. J Bras Pneumol. 2010;36(4):441–446. | ||
Johnson P, Balakrishnan K, Ramaswamy P, et al. Prevalence of chronic obstructive pulmonary disease in rural women of Tamilnadu: implications for refining disease burden assessments attributable to household biomass combustion. Glob Health Action. 2011;4:7226. | ||
da Silva LF, Saldiva SR, Saldiva PH; Bandeira Científica Project. Impaired lung function in individuals chronically exposed to biomass combustion. Environ Res. 2012;112:111–117. | ||
Mahesh PA, Jayaraj BS, Prabhakar AK, Chaya SK, Vijaysimha R. Identification of a threshold for biomass exposure index for chronic bronchitis in rural women of Mysore district, Karnataka, India. Indian J Med Res. 2013;137(1):87–94. | ||
Diette GB, Accinelli RA, Balmes JR, et al. Obstructive lung disease and exposure to burning biomass in the indoor environment. Glob Heart. 2012;7(3):265–270. | ||
EPA. National ambient air quality standards for particulate matter; final rule. Fed Regist. 1997;62(138):38651–38701. | ||
Who.int [webpage on the Internet]. Air Quality Guidelines – Global Update 2005. Geneva: World Health Organization. Available from: http://whqlibdoc.who.int/hq/2006/WHO_SDE_PHE_OEH_06.02_eng.pdf?ua=1. Accessed October 26, 2015. | ||
Krzyzanowski M. WHO air quality guidelines for Europe. J Toxicol Environ Health A. 2008;71(1):47–50. | ||
Krzyzanowski M, Cohen A. Update of WHO air quality guidelines. Air Qual Atmos Health. 2008;1(1):7–13. | ||
Faustini A, Stafoggia M, Cappai G, Forastiere F. Short-term effects of air pollution in a cohort of patients with chronic obstructive pulmonary disease. Epidemiology. 2012;23(6):861–879. | ||
Gan WQ, FitzGerald JM, Carlsten C, Sadatsafavi M, Brauer M. Associations of ambient air pollution with chronic obstructive pulmonary disease hospitalization and mortality. Am J Respir Crit Care Med. 2013;187(7):721–727. | ||
Sulzbach M. What’s driving Twin Cities air quality? Min Med. 2006;89(5):36–39. | ||
Bell ML, McDermott A, Zeger SL, Samet JM, Dominici F. Ozone and short-term mortality in 95 US urban communities, 1987–2000. JAMA. 2004;292(19):2372–2378. | ||
Bell ML, Roger DP, Dominici F. The exposure-response curve for ozone and risk of mortality and the adequacy of current ozone regulations. Environ Health Perspect. 2006;144:532–536. | ||
Schikowski T, Adam M, Marcon A, et al. Association of ambient air pollution with the prevalence and incidence of COPD. Eur Respir J. 2014;44(3):614–626. | ||
Pujades-Rodríguez M, McKeever T, Lewis S, Whyatt D, Britton J, Venn A. Effect of traffic pollution on respiratory and allergic disease in adults: cross-sectional and longitudinal analyses. BMC Pulm Med. 2009;9:42. | ||
Sichletidis L, Spyratos D, Tsiotsios A, et al. Exposure to PM10 as a risk factor for the development of nasal obstruction and chronic obstructive pulmonary disease. Int J Occup Environ Health. 2014;20(1):9–15. | ||
Laden F, Schwartz J, Speizer FE, Dockery DW. Reduction in fine particulate air pollution and mortality: extended follow-up of the Harvard Six Cities study. Am J Respir Crit Care Med. 2006;173(6):667–672. | ||
Pope CA 3rd, Ezzati M, Dockery DW. Fine-particulate air pollution and life expectancy in the United States. N Engl J Med. 2009;360(4):376–386. | ||
Dockery D, Rich DQ, Goodman PG, et al. Effect of air pollution control on mortality and hospital admissions in Ireland. Res Rep Health Eff Inst. 2013;(176):3–109. | ||
Boogaard H, Janssen NA, Fischer PH, et al. Impact of low emission zones and local traffic policies on ambient air pollution concentrations. Sci Total Environ. 2012;43(5–436):132–140. | ||
Henschel S, Atkinson R, Zeka A, et al. Air pollution interventions and their impact on public health. Int J Public Health. 2012;57(5):757–768. | ||
Zhang JJ, Smith KR. Household air pollution from coal and biomass fuels in China: measurements, health impacts, and interventions. Environ Health Perspect. 2007;115(6):848–855. | ||
Zhou Y, Zou Y, Li X, et al. Lung function and incidence of chronic obstructive pulmonary disease after improved cooking fuels and kitchen ventilation: a 9-year prospective cohort study. PLoS Med. 2014;11(3):e1001621. | ||
Zhou Y, Hu G, Wang D, et al. Community based integrated intervention for prevention and management of chronic obstructive pulmonary disease (COPD) in Guangdong, China: cluster randomised controlled trial. BMJ. 2010;341:c6387. | ||
Shofer S, Chen TM, Gokhale J, Kuschner WG. Outdoor air pollution: counseling and exposure risk reduction. Am J Med Sci. 2007;333(4):257–260. |
 © 2016 The Author(s). This work is published and licensed by Dove Medical Press Limited. The
full terms of this license are available at https://www.dovepress.com/terms
and incorporate the Creative Commons Attribution
- Non Commercial (unported, 3.0) License.
By accessing the work you hereby accept the Terms. Non-commercial uses of the work are permitted
without any further permission from Dove Medical Press Limited, provided the work is properly
attributed. For permission for commercial use of this work, please see paragraphs 4.2 and 5 of our Terms.
© 2016 The Author(s). This work is published and licensed by Dove Medical Press Limited. The
full terms of this license are available at https://www.dovepress.com/terms
and incorporate the Creative Commons Attribution
- Non Commercial (unported, 3.0) License.
By accessing the work you hereby accept the Terms. Non-commercial uses of the work are permitted
without any further permission from Dove Medical Press Limited, provided the work is properly
attributed. For permission for commercial use of this work, please see paragraphs 4.2 and 5 of our Terms.