")
Back to Journals » Clinical, Cosmetic and Investigational Dermatology » Volume 14
Identifying the Potential Therapeutic Targets for Atopic Dermatitis Through the Immune Infiltration Analysis and Construction of a ceRNA Network
Authors Peng S, Chen M, Yin M, Feng H
Received 10 March 2021
Accepted for publication 2 April 2021
Published 7 May 2021 Volume 2021:14 Pages 437—453
DOI https://doi.org/10.2147/CCID.S310426
Checked for plagiarism Yes
Review by Single anonymous peer review
Peer reviewer comments 2
Editor who approved publication: Dr Jeffrey Weinberg
Shixiong Peng, Mengjiao Chen, Ming Yin, Hao Feng
Department of Dermatology, The First Affiliated Hospital of Hunan Normal University/Hunan Provincial People’s Hospital, Changsha, People’s Republic of China
Correspondence: Hao Feng
Department of Dermatology, The First Affiliated Hospital of Hunan Normal University/Hunan Provincial People’s Hospital, No. 61, Jiefang West Road, Changsha, 410000, Hunan Province, People’s Republic of China
Tel/Fax +86 731 83929236
Email [email protected]
Purpose: This study was meant to analyze immune infiltration and construct a ceRNA network to explore the new therapeutic targets for atopic dermatitis (AD) through bioinformatics way.
Patients and Methods: We downloaded the AD patients’ RNA expression profile datasets (GSE63741, GSE124700) from the Gene Expression Omnibus (GEO) database, which were analyzed through the GEO2R. We explored the hub genes by the enrichment analysis and the protein–protein interaction (PPI) analysis. Moreover, we estimated immune cell types and their proportions by ImmucellAI. GSE121212 dataset validation was performed to verify the robustness of the hub genes. Then, a ceRNA network was constructed by the miRWalk, miRNet, miRDB, DIANA, TargetScan, and starbase database. Finally, gene expression analysis was performed by using RT-qPCR.
Results: In total, we detected 22 differentially expressed genes (DEGs), which contained 8 downregulated genes and 14 upregulated genes. There were 5 hub genes confirmed as key genes through PPI network analysis and the ROC curves. KEGG pathway analysis revealed that they were significantly enriched in the IL-17 signaling pathway and GO analysis showed mainly in the immune cell chemotaxis. The immune infiltration profiles were different between normal controls and AD, and each of the key genes (S100A7, S100A8, S100A9, and LCE3D) was significantly correlated with the main infiltration cell of AD. A lncRNA–miRNA–mRNA ceRNA network containing the key genes was constructed, and NEAT1 and XIST, the core of ceRNA network, were significantly overexpressing verified by RT-qPCR in AD patients.
Conclusion: Altogether, the key genes and their ceRNA network provided a novel perspective to the immunomodulation of AD, which may be potential and new therapeutic targets for AD.
Keywords: atopic dermatitis, immunomodulation, ceRNA network, bioinformatics
Introduction
Atopic dermatitis (AD) is a chronic, recurrent, inflammatory skin disease, which is one of the core challenges for dermatological research in the world.1 With increasing the risk of allergic rhinitis, asthma, and other immune-mediated inflammatory diseases, AD is considered as a systemic disease.2 Over the past 30 years, the prevalence of AD has been increasing worldwide, which has reached 10%~20% in developed countries, and children’s are higher than adults’.3,4 The persistence and recurrence of AD not only has a great impact on patients’ life and mental health but also brings a certain economic burden to both their families and society.5 Although current kinds of research reveal a combination of genetic, environmental, and immunological factors are considered to take part in the pathogenesis of AD, its pathogenesis has been still unclear.6 Therefore, it is important and urgently required to identify the causes, molecular biomarkers and molecular mechanisms for early diagnosis and personalized therapy.
Although the pathogenesis of AD has not been fully understood, more and more studies suggest that immune dysregulation is a potentially key contributor to the pathogenesis of this disease.7,8 It has been found that AD is the non-specific inflammation of the skin caused by the interaction of various immune cells (especially T cells, eosinophils, mast cells, and a small amount of monocytes/macrophages) and their chemokines, cytokines, and inflammation-related factors, such as IL-4, IL-5, IL-6, IFN-γ, CCL22 and so on.1,8 In this setting, there are a few immunotherapy medicine strategies such as Dupilumab, the first systemic biological medicine ratified to AD by Food and Drug Administration (FDA), could block IL-4 related to IL-13 signaling; Crisaborole, a new no steroidal drug, blocks phosphodiesterase 4 (PDE4) and inhibits proinflammatory cytokines, which was approved for AD by FDA in 2016; Nemolizumab, a humanized anti-IL-31 receptor antibody, could reduce the pruritus and the extension of moderate-to-severe AD. These strategies seem to be promising options for AD.9 However, reducing the relapse of AD remains a worldwide challenge.10 Therefore, fuller and further understanding of the immune response mechanism of AD has important theoretical significance for the clinical diagnosis as well as the research of immunotherapy.
In recent years, microarray technology has been used in scientific research, especially in life sciences. Bioinformatics data mining of microarray data such as non-coding RNA and mRNA expression is a valuable tool for exploring the key genes involved in disease pathogenesis and provides useful insights and a basis for further new study. Moreover, Wang et al have suggested that the competing endogenous RNA (ceRNA) network played a part of pivotal regulatory in the development of various skin diseases including AD.11 And the ceRNA network is also involved in various pathophysiological processes such as immunomodulation, apoptosis and so on.12,13 In this research, through using bioinformatic methods, we analyzed the data (GSE63741, GSE124700, etc.) generated by microarray technology from the Gene Expression Omnibus (GEO), to identify the hub genes and construct a ceRNA network, and further investigate their potential role in AD immunomodulation.
Materials and Methods
Microarray Data
The AD patients’ RNA expressed datasets (GSE63741, GSE124700) were downloaded from the GEO database (https://www.ncbi.nlm.nih.gov/geo/).14 GSE63741 included an RNA expression profile of 150 samples, containing 30 control samples and 30 AD samples, while GSE124700 included RNA expression datasets for 2 control samples and 2 AD samples (6 subjects). All control samples were assembled from healthy volunteers’ skin biopsies, and AD samples were harvested from lesions of AD skin biopsies (Table 1).
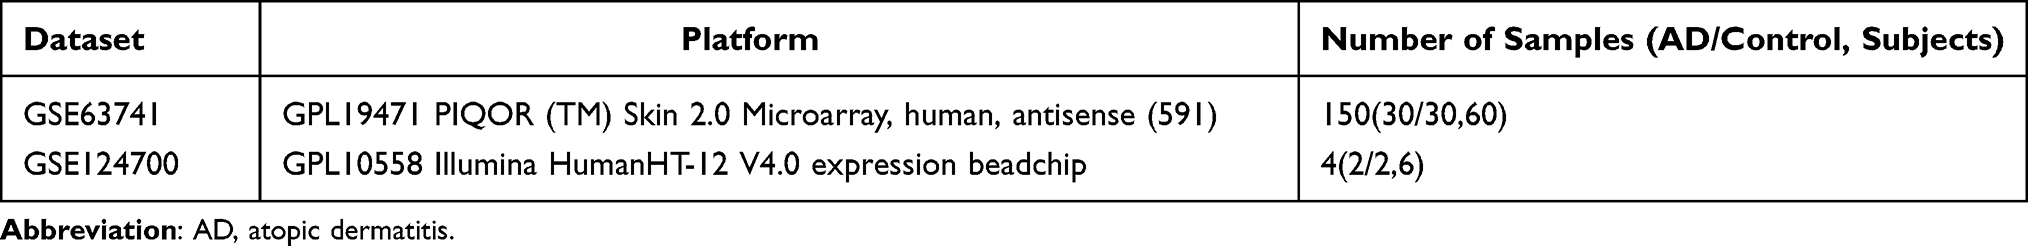 |
Table 1 Details of the GEO AD Data |
Recognization of Differentially Expressed Genes (DEGs)
The online tool, GEO2R (http://www.ncbi.nlm.nih.gov/geo/geo2r/),15 was employed in preprocessing data and screening for mRNAs that were differentially expressed between control tissue samples and AD. p<0.05 and |log FC| >1 were selected as the difference.
Function and Pathway Enrichment Analyses
GSEA was performed to analyze the biological function of the DEGs. The idiographic flow acted under the recommended protocol of the WEB-based GEne SeT AnaLysis Toolkit database (http://www.webgestalt.org/),16 and set FDR q-value < 0.05 as the cut-off criteria. GO (included molecular function (MF), cellular component (CC), and biological process (BP)), and KEGG pathway analysis were performed through Metascape tool (https://WWW.metascape.org/).17 P< 0.01 was recognized as the cut-off criterion.
Protein–Protein Interaction (PPI) Network and Module Analysis
The STRING database (http://string-db.org)18 was carried out to explore a PPI network, and the Cytoscape software19 to build the PPI network and analyze the reciprocities of the DEGs. The hub genes were identified by the cytoHubba plug-in. The modules of the PPI network were developed by the Molecular Complex Detection (MCODE) plug-in. The ClueGO plugin was used for enrichment analysis of the hub genes.
Data Verification
The GSE121212 downloaded from the GEO database was utilized for verifying the hub genes’ reliability, which contained 27 non-lesion samples and 27 AD lesion samples. In addition, GraphPad Prism 8.0.2 (Graph-Pad Software Inc., San Diego, CA, USA) was used to construct the ROC curves and estimate the areas under the curve (AUCs).
Immune Infiltration and Association Analysis
The immune infiltration was calculated based on the gene expression data using the web tool ImmucellAI (http://bioinfo.life.hust.edu.cn/ImmuCellAI#!/),20 of which 24 immune cells are composed of 6 immune cell types and 18 T-cell subtypes. The difference of immune cell infiltration between the tissue of AD and control was analyzed through the principal component analysis (PCA). The proportion of immune cells of the two groups and the correlation between the hub genes and immune cells in AD were analyzed in GraphPad Prism 8.0.2.
The ceRNA Network Analysis
To explore the lncRNA-miRNA-miRNA ceRNA network, DIANA Tools (http://diana.imis.athena-innovation.gr/DianaTools/index.php?r=microT_CDS/index),21 the miRNet (https://www.mirnet.ca/miRNet/home.xhtml),22 TargetScan (http://www.targetscan.org/vert_72/),23 miRWalk (http://mirwalk.uni-hd.de/)24 and miRDB (http://www.mirdb.org/)25 online databases were performed to identify possible miRNA targeting hub genes, and those identified in ≥3 object databases were considered as true. The starbase (http://starbase.sysu.edu.cn/index.php),26 miRNet, lncbase v.3(https://diana.e-ce.uth.gr/lncbasev3),27 lncbase v.2 (http://carolina.imis.athena-innovation.gr/diana_tools/web/index.php?r=lncbasev2%2Findex)28 online databases were utilized for predicting potential lncRNA targeting the miRNA, and those identified in ≥4 object databases were considered as true. The web-based tools, the Cytoscape software, Wei Sheng Xin (http://bioinformatics.com.cn/) and Draw Venn Diagram (http://bioinformatics.psb.ugent.be/webtools/Venn/) were used for data visualization.
The RT-qPCR Analysis
To confirm the core lncRNAs of ceRNA network, serums from 3 patients with OA and 3 healthy control were harvested for RT-qPCR validation. The experiment was executed following the authorization of the ethics committee of The First Affiliated Hospital of Hunan Normal University (Hunan Province People’s Hospital) (2021 Scientific Research Ethics Review NO: 05). All patients signed the informed consent. The TRIzol reagent (Thermo Fisher Scientific, Waltham, MA, USA) was used to extract the total RNA from the serum. The cDNA was created by reverse transcription with RNA samples from total RNA, and RT-qPCR was performed by using the Revert Aid First Strand cDNA Synthesis Kit (Kangweishiji, Beijing, China). β-actin was set as the internal reference. All primers were engineered and compounded by Sheng Gong Company (Shanghai, China) (Table 2). Relative lncRNA expression was computed using the 2−ΔΔCt method.29 The experiment was done independently 3 times.
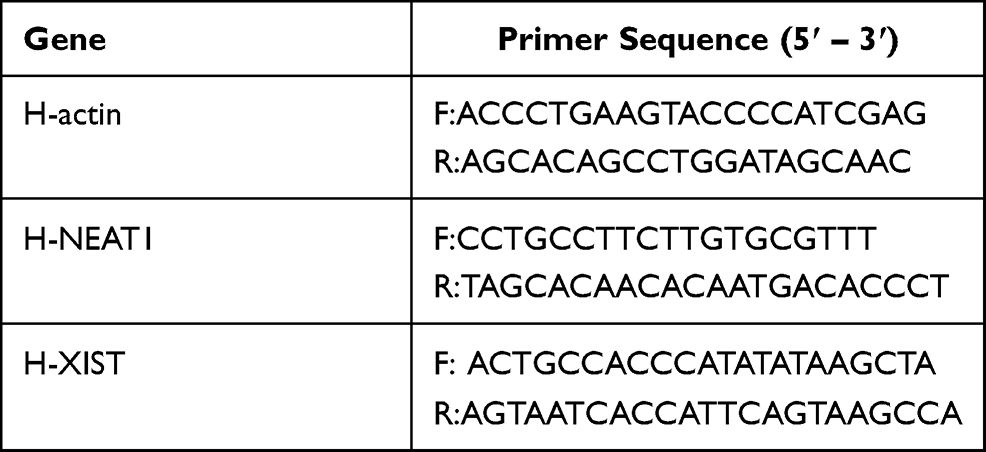 |
Table 2 The Primer Used in RT-qPCR |
Statistical Analysis
Two groups’ data were analyzed through the unpaired Student’s t-test. P<0.05 indicated to be significantly different. GraphPad Prism 8.0.2 (Graph-Pad Software Inc., San Diego, CA, USA) was recognized as the statistical software.
Results
Identification of DEGs in AD
As shown in Figure 1, the AD RNA expression profile datasets (GSE63741, GSE124700) were normalized. The GSE63741 dataset included 66 different genes, and the GSE124700 dataset contained 434 differential genes, whose volcano plot are shown in Figure 2A and B. Utilizing integrated bioinformatics analysis, altogether consistent 22 DEGs (containing 8 consistently downregulated genes and 14 consistently upregulated genes) were identified (Figure 2C and D, and Table 3). Figure 3 shows the heat map of DEGs.
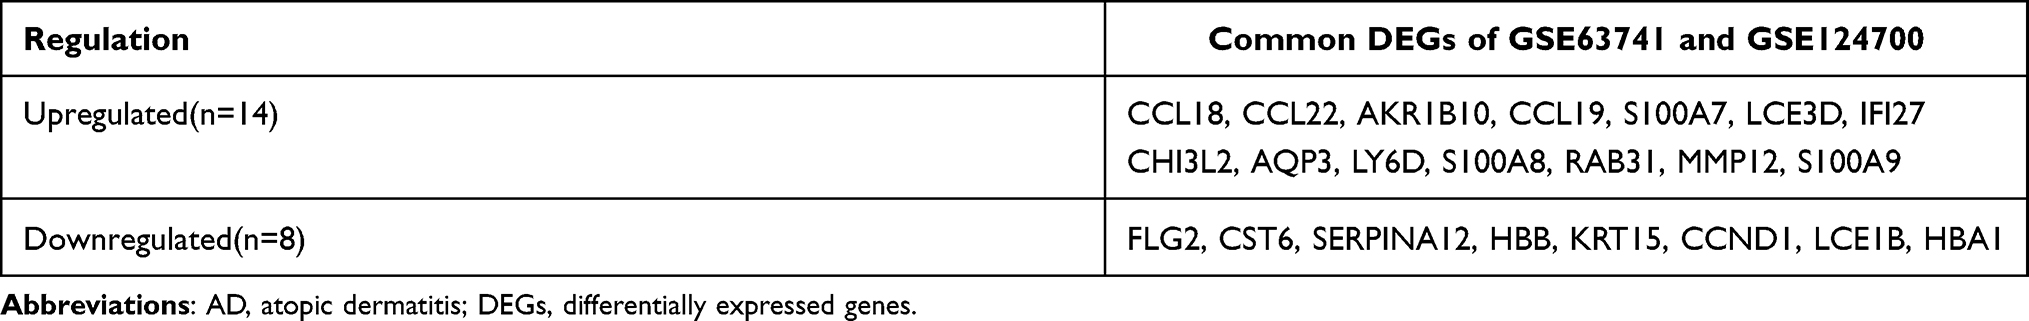 |
Table 3 The DEGs of AD |
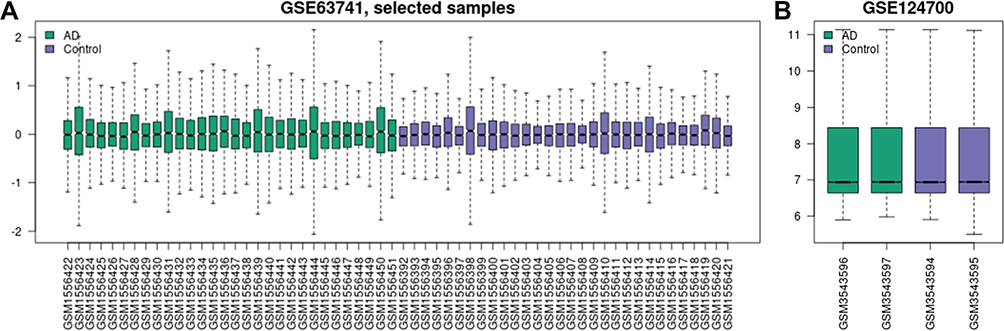 |
Figure 1 Data after normalization. (A) Standardization of selected samples of GSE63741. (B) Standardization of GSE124700. Green bars represent AD, blue bars represent control. Abbreviation: AD, atopic dermatitis. |
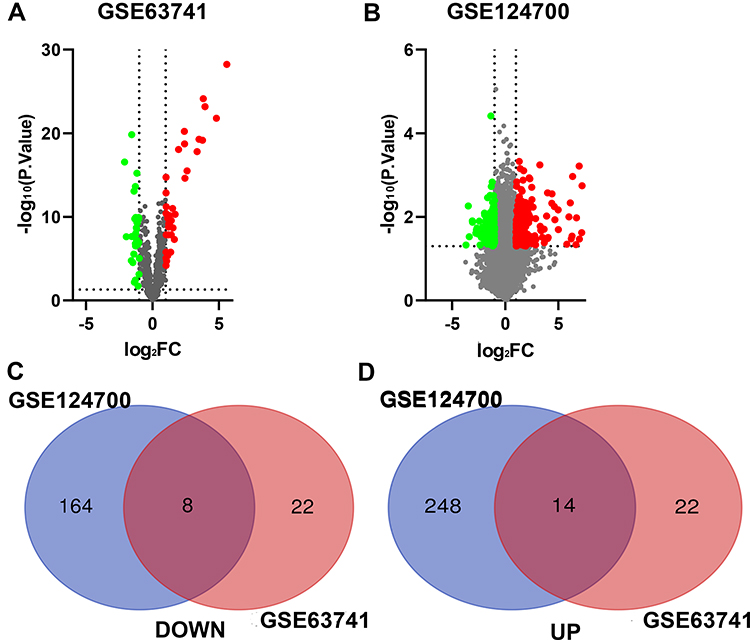 |
Figure 2 Identification of DEGs in AD. (A) The differentially expressed genes of GSE63741. (B) The differentially expressed genes of GSE124700. (C) 8 DEGs were consistently downregulated in the two datasets. (D) 14 DEGs were consistently upregulated in the two datasets. The green point represents downregulated genes, the red point represents upregulated. |log FC|>1 and p-value <0.05 were set as the difference. Abbreviation: FC, fold change. |
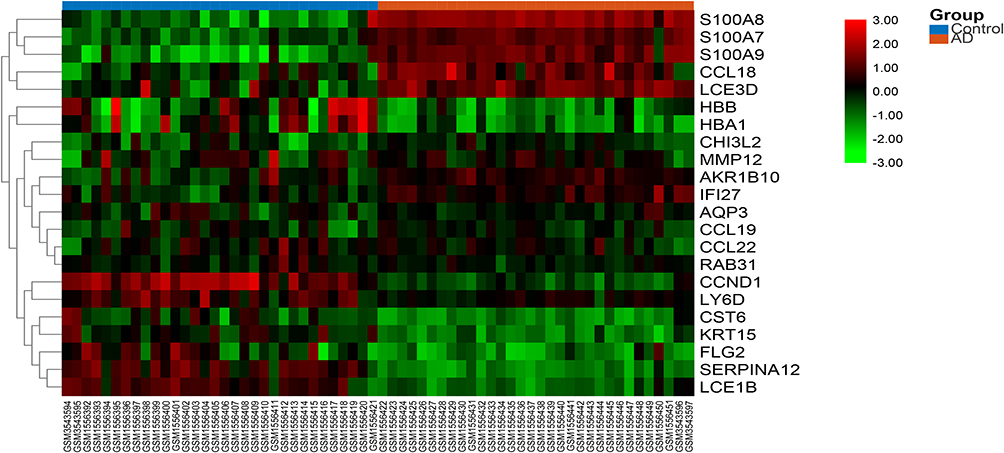 |
Figure 3 The heat map of the DEGs. The color from green to red indicates the expression of genes from low to high. Abbreviation: AD, atopic dermatitis. |
Function and Pathway Enrichment Analyses of the DEGs
GSEA was used for enrichment analysis of the DEGs to explore their biological roles. The results by GSEA show that in the biological processes categories, most of DEGs were enriched in response to stimulus, biological regulation and developmental process etc; In the cellular component categories, the DEGs were mostly involved in membrane and extracellular space; In the molecular function categories, the major DEGs were involved in enzyme regulator activity and protein binding (Figure 4A). The results shown in Figure 4B indicated that the significantly enriched pathway was the IL-17 signaling pathway. Utilizing Metascape online database to further validate our results, the top ten GO and KEGG items of DEGs enriched showed that they were obviously involved in epidermis development, granulocyte chemotaxis, lymphocyte chemotaxis, and monocyte chemotaxis in BPs; collagen-containing extracellular matrix and extracellular matrix in CCs; cytokine activity, cytokine receptor binding, and chemokine receptor binding in MFs; IL-17 signaling pathway, Cytokine-cytokine receptor interaction, and Chemokine signaling pathway in KEGG pathway (Table 4 and Figure 5).
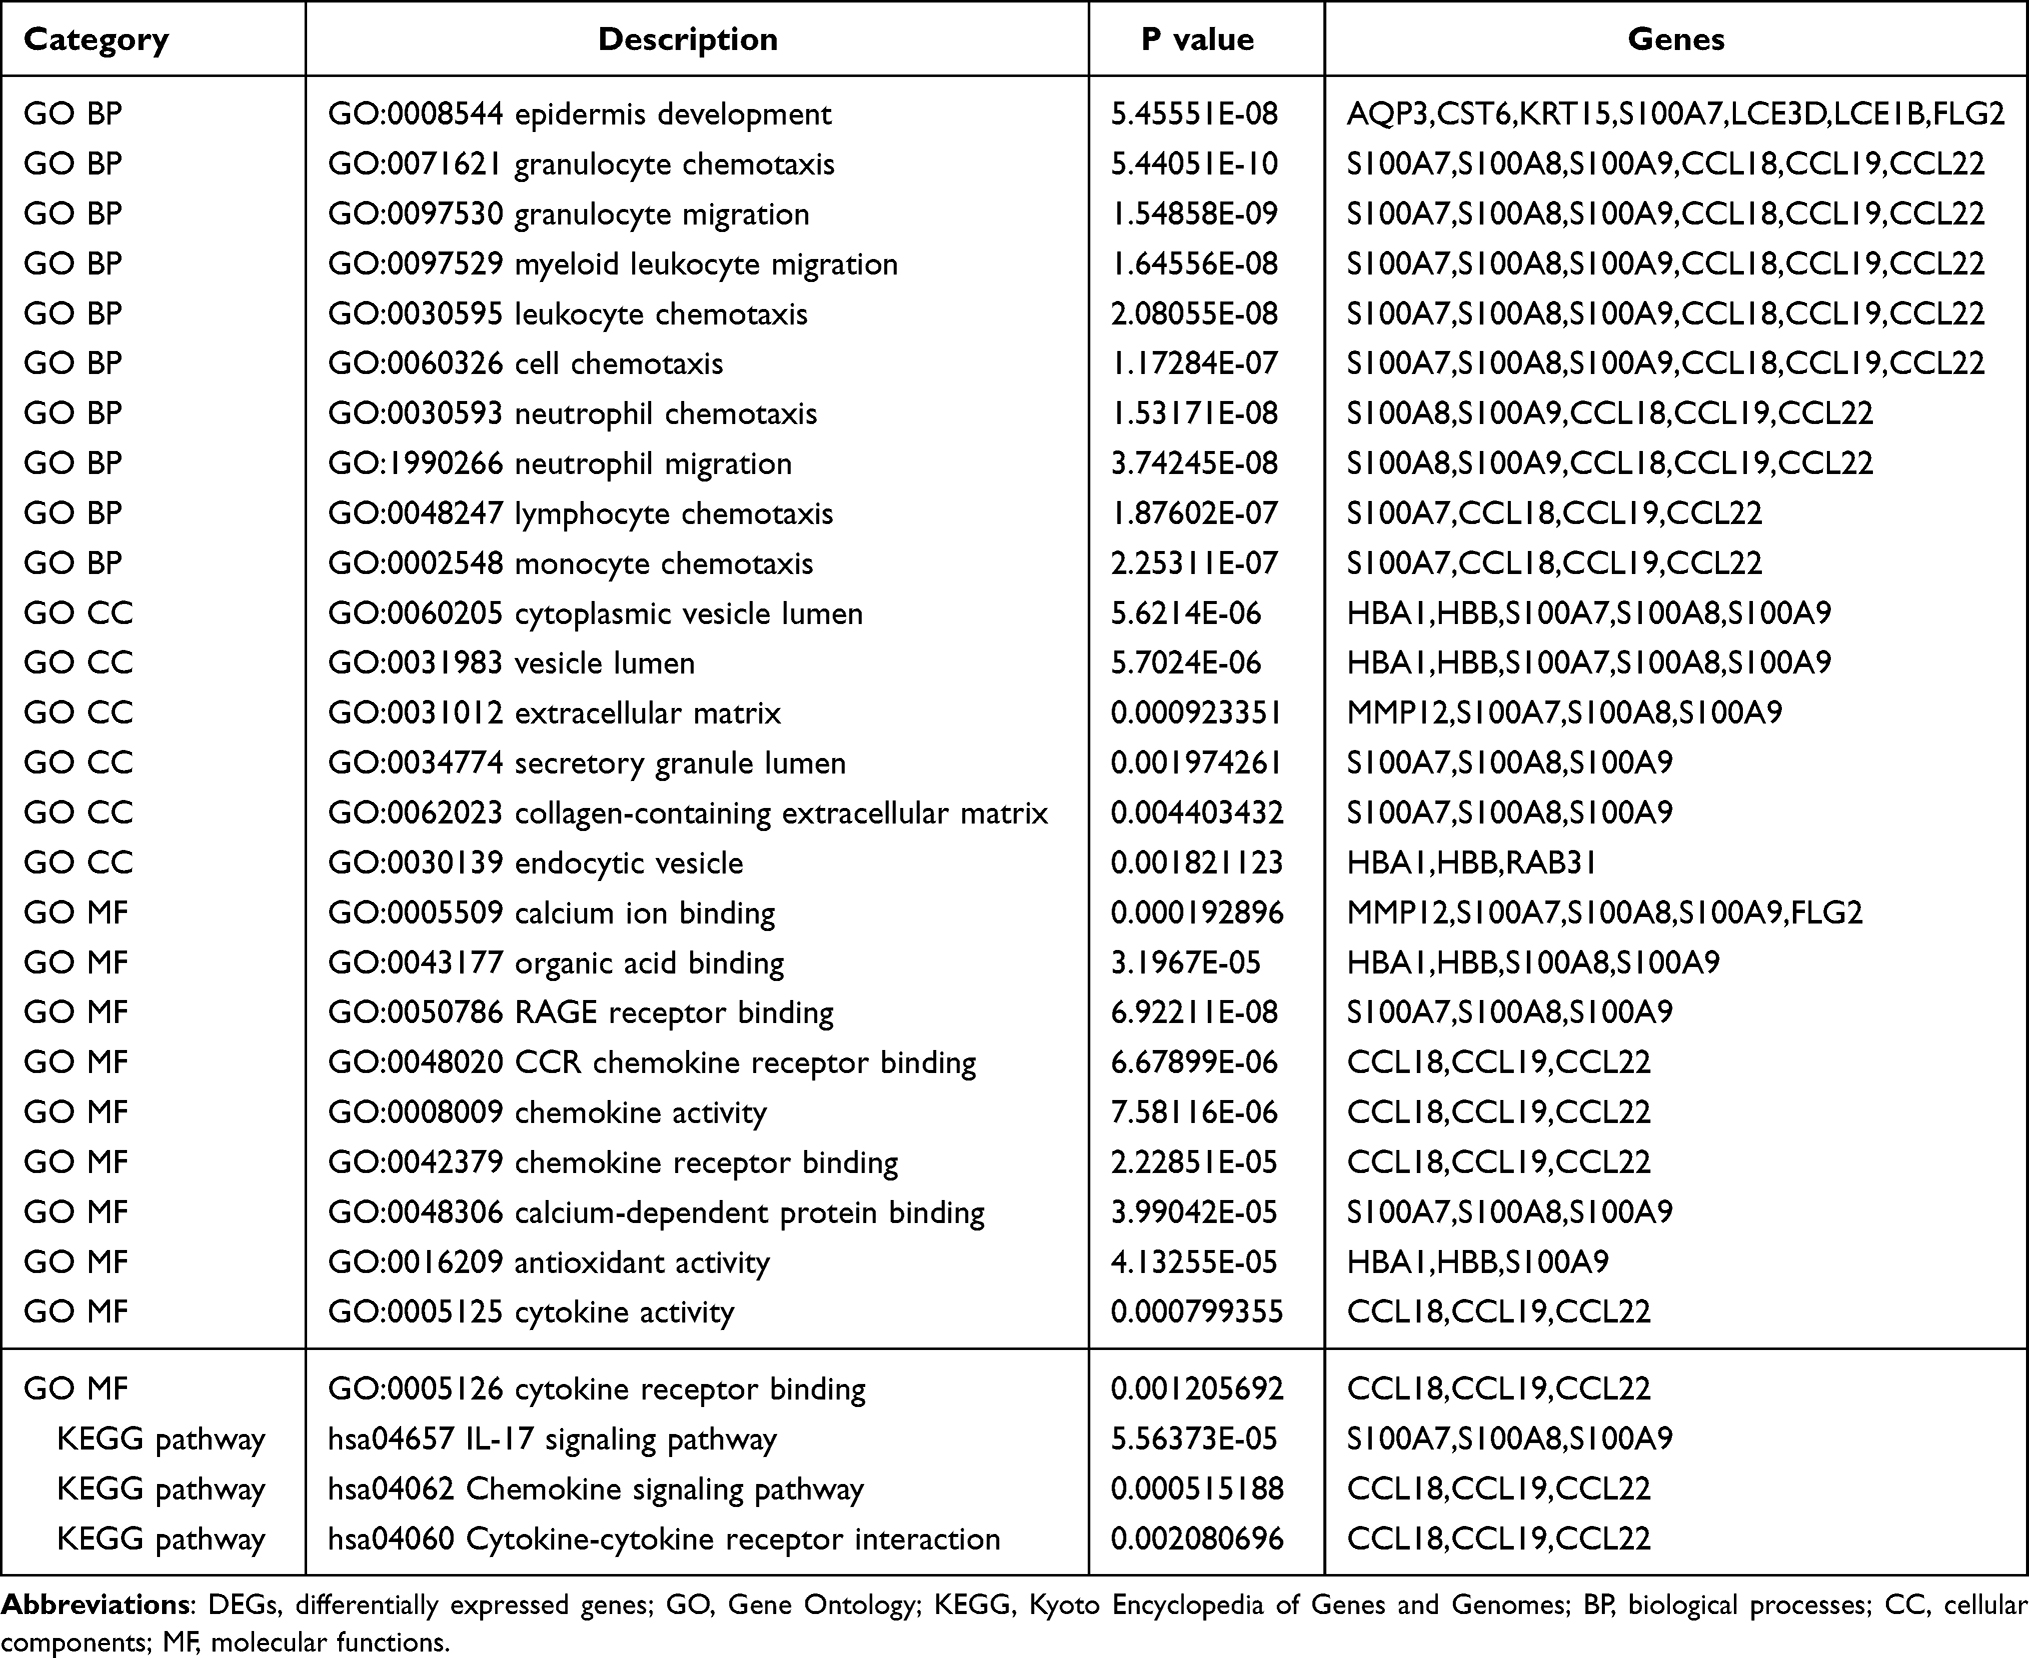 |
Table 4 The Top 10 Function and Pathway Enrichment Items of the DEGs |
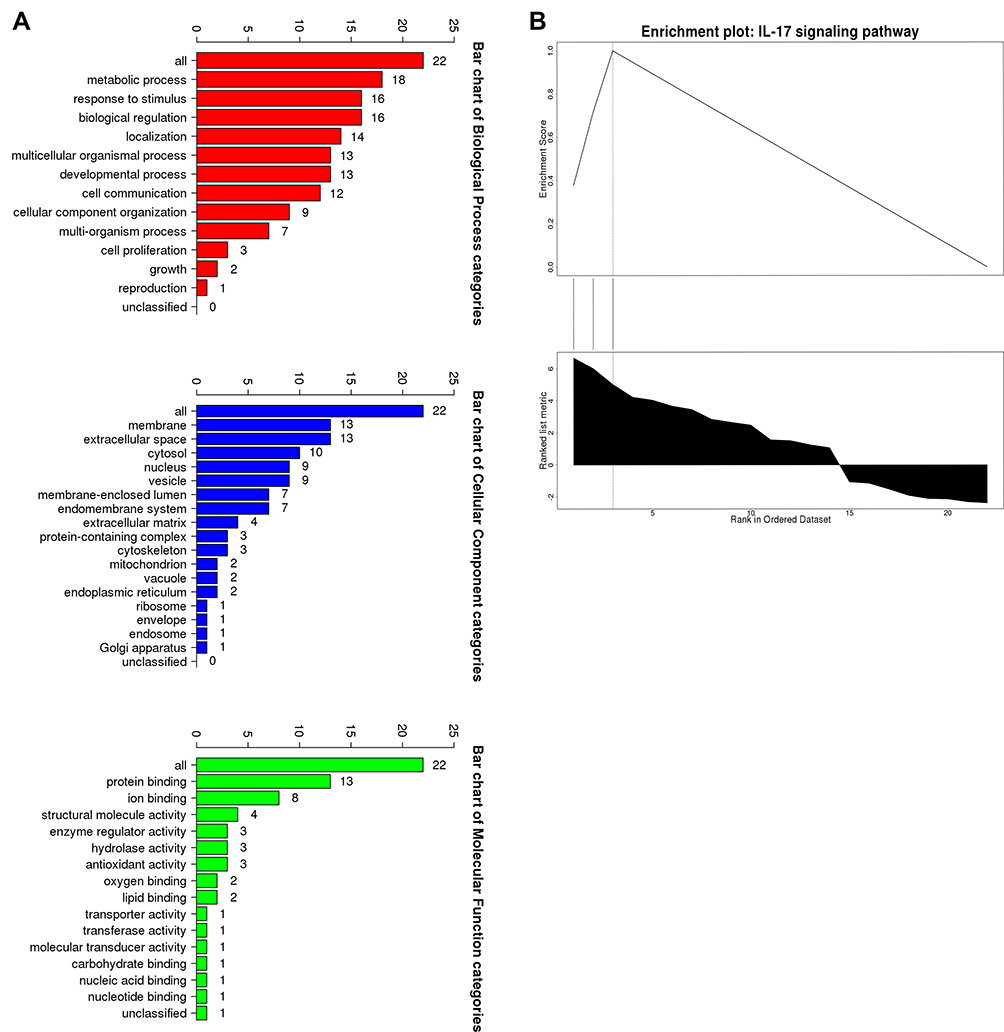 |
Figure 4 The GSEA analysis of the DEGs. (A) Biological processes, cellular components and molecular functions. (B) The signaling pathways. |
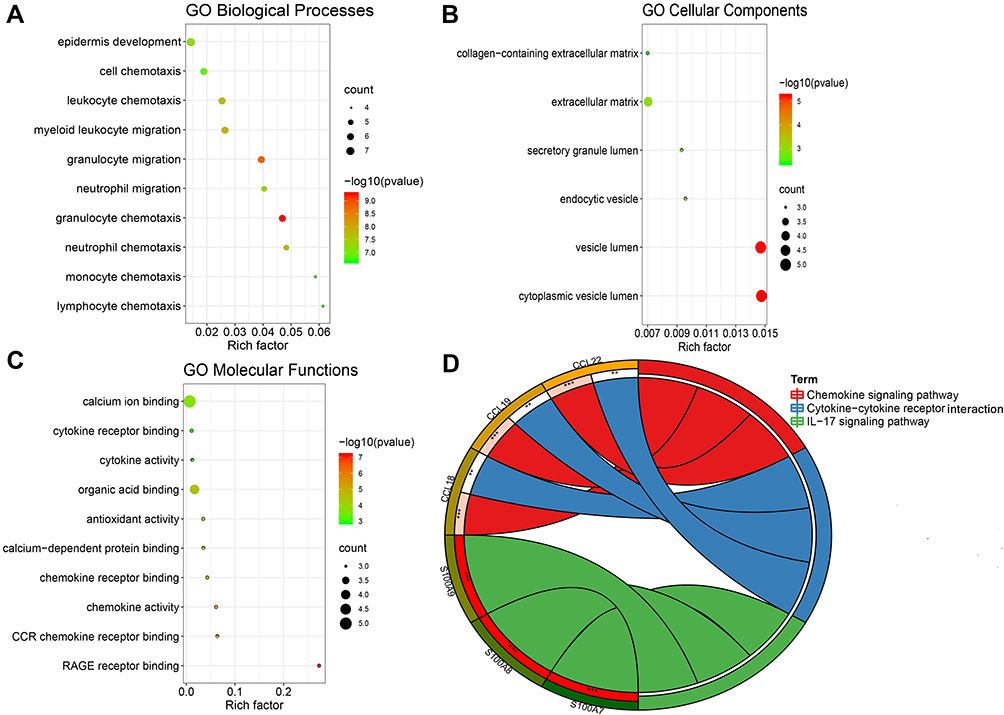 |
Figure 5 The top 10 items of GO and KEGG enrichment analysis of DEGs. (A) GO Biological processes. (B) GO cellular components. (C) GO molecular functions. (D) KEGG signaling pathways. **p<0.01; ***p<0.001. Abbreviations: GO, Gene Ontology; KEGG, Kyoto Encyclopedia of Genes and Genomes. |
PPI Network and Module Analyses
Based on the STRING database, the PPI network of the DEGs was built through Cytoscape software, including 15 edges and 14 nodes. Furthermore, among the 14 nodes, 9 nodes were upregulated, while 5 were downregulated (Figure 6A). As shown in Figure 6B, the most important module containing 6 nodes and 9 edges was selected. Using two algorithms (degree and MCC), the cytoHubba was used to detect hub genes. The 5 highest-scoring genes were recognized as hub genes of the PPI network: HBB, LCE3D, S100A7, S100A8, and S100A9 (Figure 6C and Table 5).
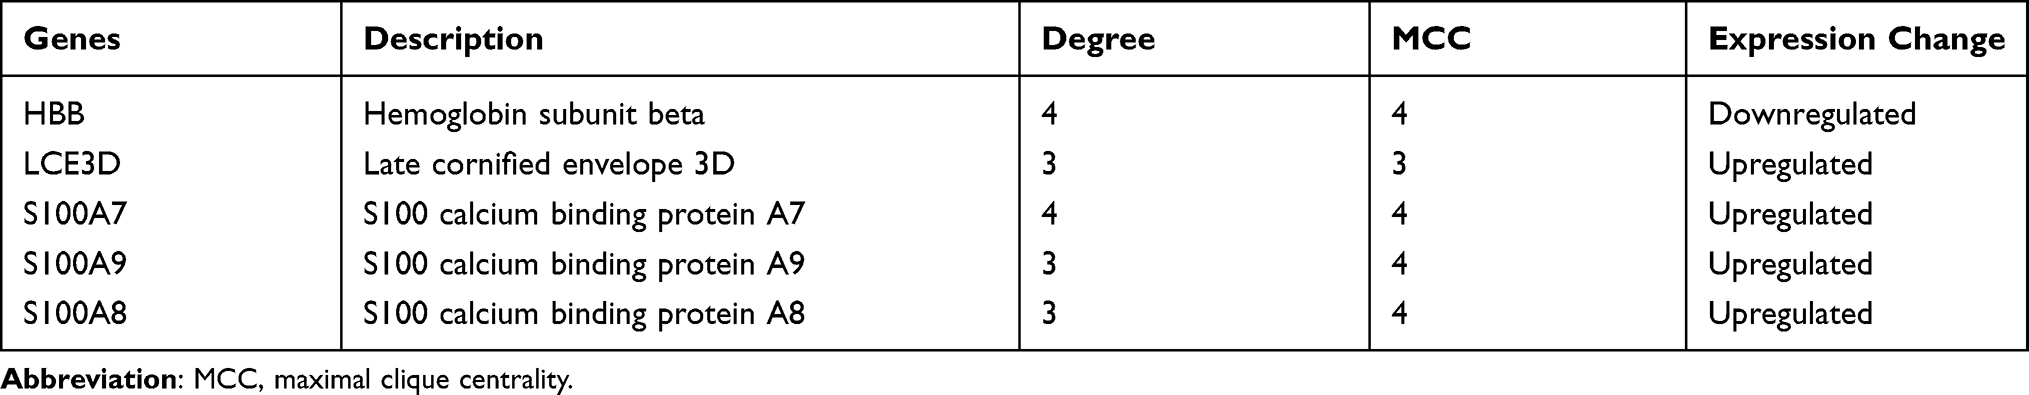 |
Table 5 The Top 5 Hub Genes |
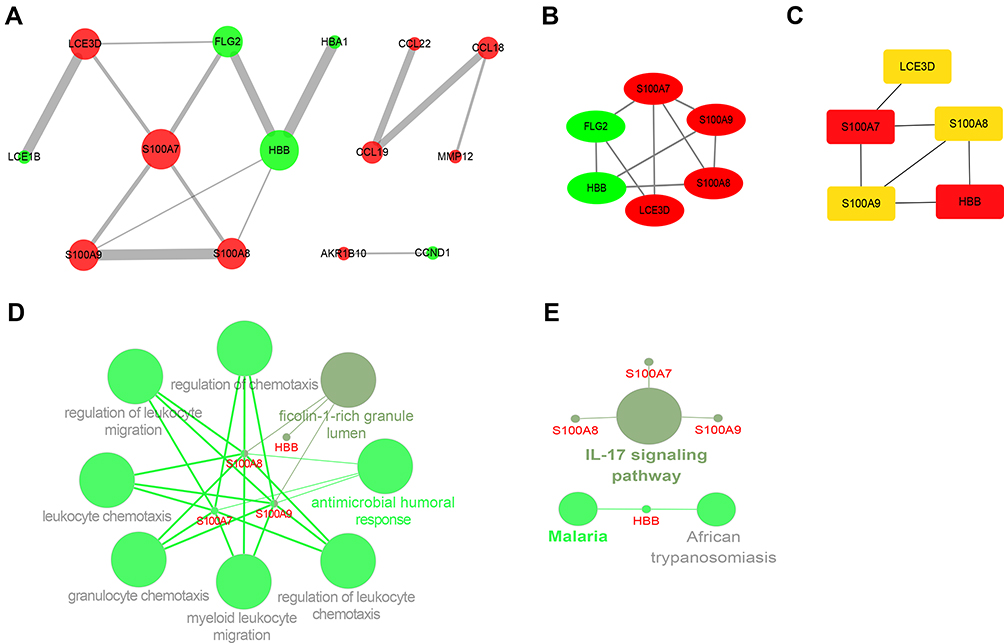 |
Figure 6 The PPI network analysis and identification of hub genes. (A) PPI network of the DEGs. The sizes of the edges and nodes represent the degree, which is the bigger size representing the higher degree. The green node represents downregulated gene and the red represents upregulated. (B) The first module of the PPI network. The green node represents downregulated gene and the red represents upregulated. (C) 5 hub genes were identified through the cytoHubba plug-in. (D) The biological process of hub genes through ClueGO plug-in. (E) Signaling pathways of hub genes through ClueGO plug-in. |
Enrichment Analysis of the Hub Genes
Due to the fact that the most closely-knit genes in a network are keys to regulatory, the ClueGO plugin was used to further investigate the functions of the hub genes. As Figure 6D and E exhibited, they are still mostly associated with immunomodulation including antimicrobial humoral response, regulation of chemotaxis, leukocyte chemotaxis, granulocyte chemotaxis, and IL-17 signaling pathway (Figure 6D and E).
Data Validation of the Hub Genes
The validation data GSE121212 was used to ensure the reliability of the hub genes. The gene-level of the hub genes in AD and control tissue exhibited in Figure 7A indicated that, compared with the control, HBB is significantly lower expression while S100A7, S100A8, S100A9 and LCE3D are significantly overexpression in AD, which is the same as the above results. GraphPad Prism 8.0.2 was used to perform ROC curve analysis, and the results exhibited the hub genes correlated with AD were identified as possible biomarkers for AD diagnosis, which suggested that they are the key genes of AD (Figure 7B and Table 6).
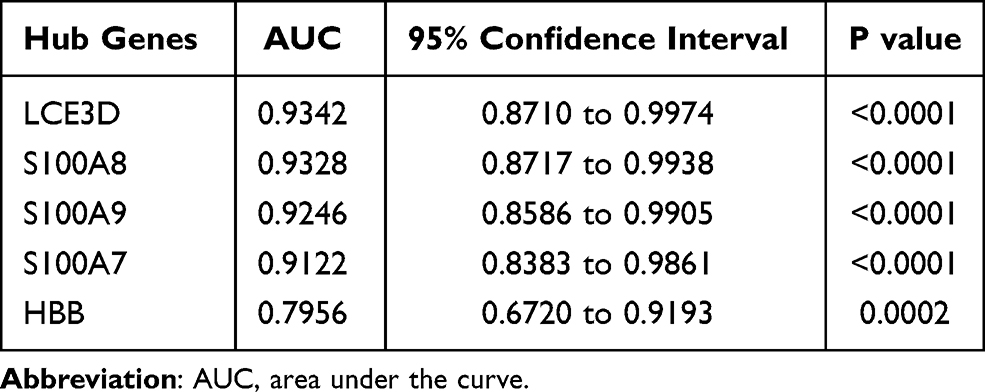 |
Table 6 Results of AUCs for Hub Genes |
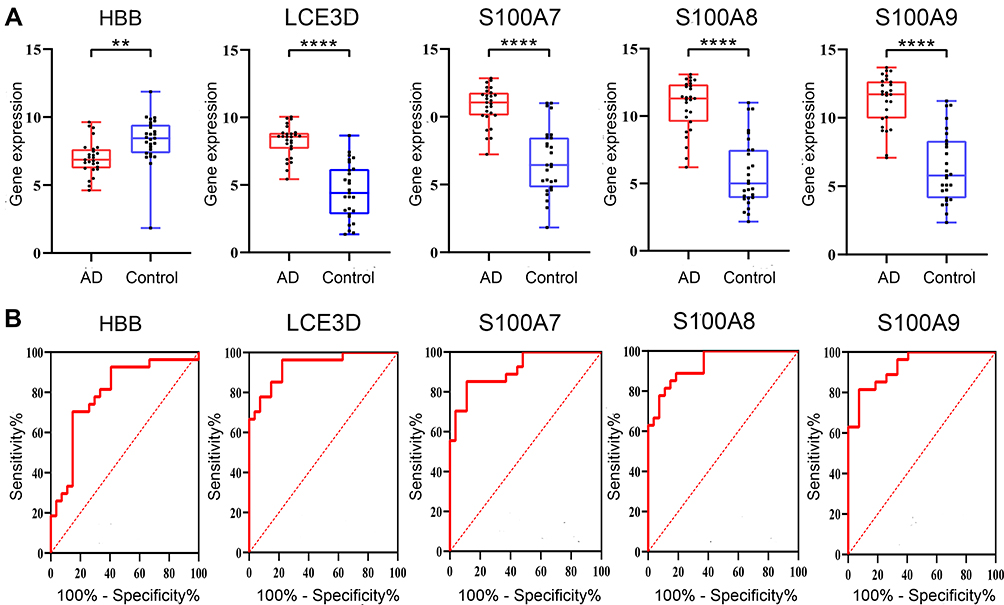 |
Figure 7 Data verification of hub genes through GSE121212. (A) Gene expression of each hub gene. (B) The ROC curve of each hub gene. **p<0.01; ****p<0.0001. Abbreviation: AD, atopic dermatitis. |
Immune Infiltration and Association Analyses
To reveal the landscape of immune infiltration in AD, the ImmucellAI algorithm was used to investigate the difference between normal tissues and AD in immune infiltration. The proportions of immune cells from the tissues of AD and normal control displayed group-bias clustering by PCA (Figure 8A). In comparison to control tissue, AD tissue owned a higher proportion of CD4 T cell, Th2 cell, DC cell, Tfh cell, Tr1 cell, iTreg cell, nTreg cell, CD8 T cell, and cytotoxic cell, but the proportions of NKT cell, Th17 cell, CD8 naive cell, and neutrophil cell were relatively lower (Figure 8B). Subsequently, we studied the correlation between hub genes expression and the abundance of the immune cell based on the Pearson’s correlation coefficient. The results shown in Figure 9 indicated that each of S100A7, S100A8, S100A9, and LCE3D was significantly positively correlated with the expression of Th2 cell, DC cell, Tfh cell, Tr1 cell, nTreg cell, iTreg cell, and CD8+T cell, but negatively correlated with the expression of CD8 naive cell, NKT cell, and Th17 cell. HBB was just significantly correlated with neutrophil cell, Tfh cell, and Th17 cell.
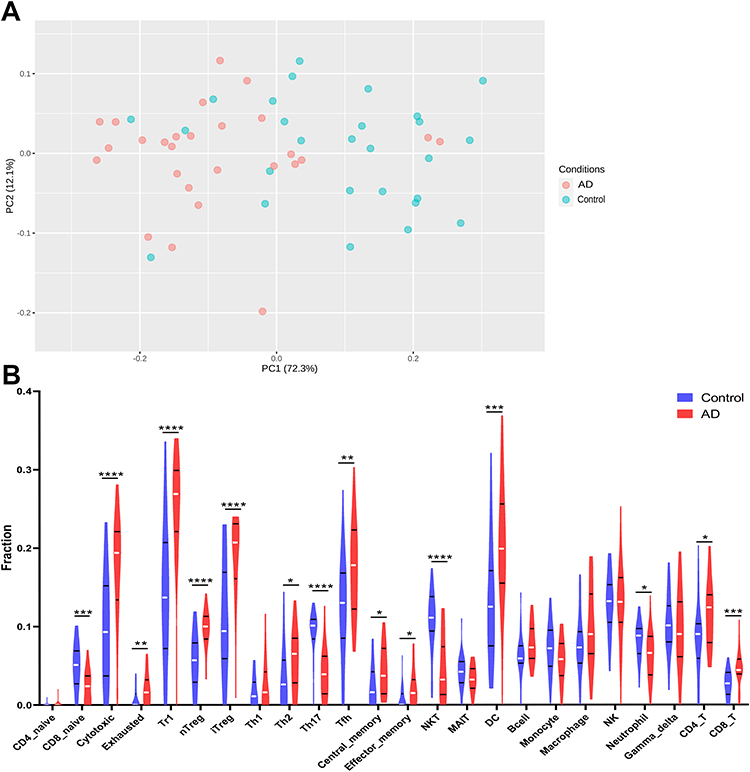 |
Figure 8 The difference of immune infiltration between AD and controls. (A) PCA performed on all samples. (B) The proportion of immune cells in AD and controls. *p<0.05; **p<0.01; ***p<0.001; ****p<0.0001; blue represents control and red represents AD. Abbreviation: AD, atopic dermatitis. |
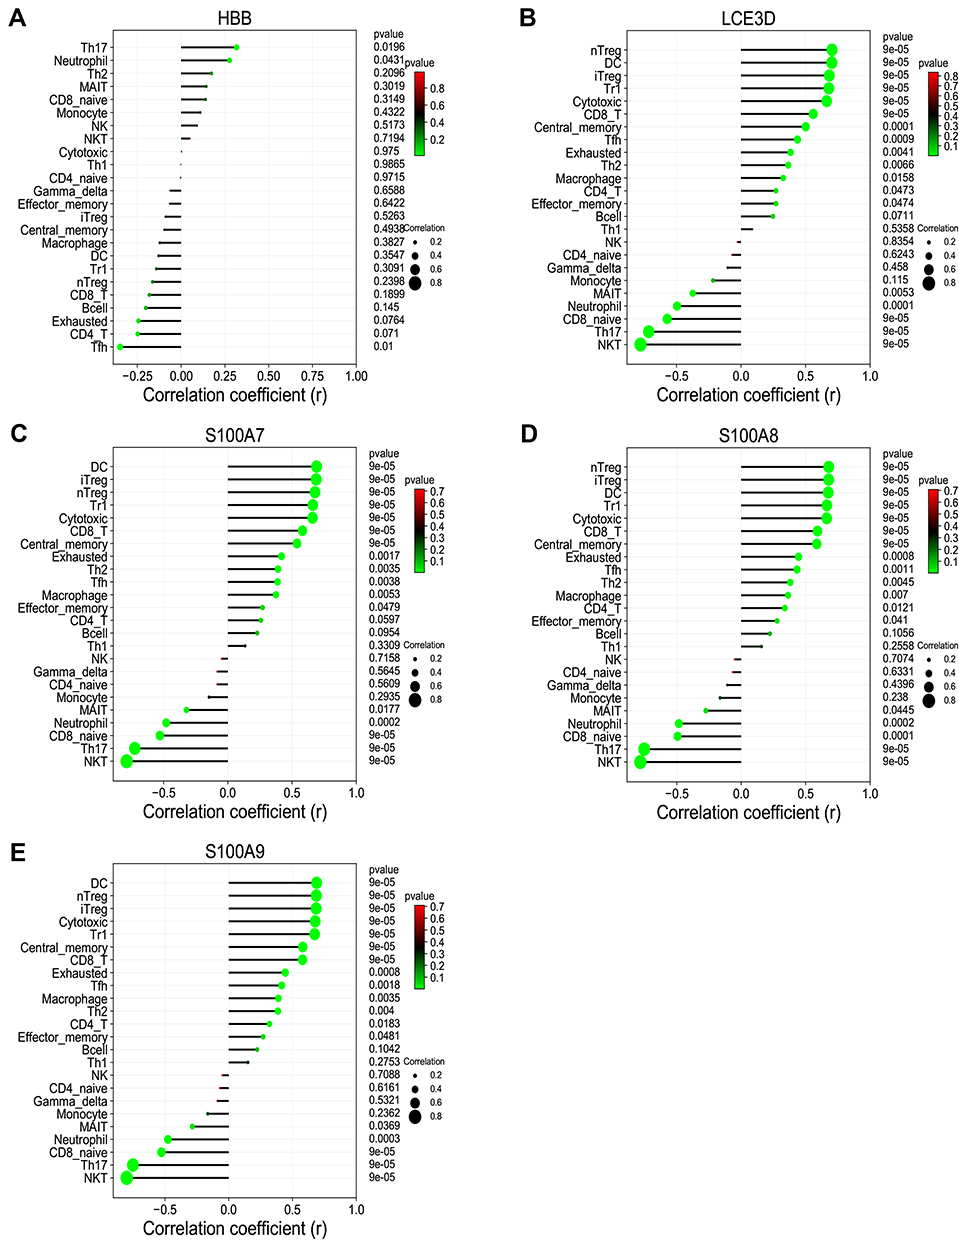 |
Figure 9 The correlation between hub genes and immune cells. (A) HBB. (B) LCE3D. (C) S100A7. (D) S100A8. (E) S100A9. P< 0.05 was considered as statistical significance. |
The lncRNA-miRNA-mRNA ceRNA Network of AD
LncRNA can act as a competitive endogenous RNA to play an opposite role with miRNA in regulating mRNA because of containing the miRNA binding sites.30 Five online databases were carried out to predict potential miRNA targeting hub genes, and the Venn diagram to get the intersection between each of the databases, and the results were shown in Figure 10. Being identified in ≥3 object databases was set as the cut-off criteria, and the miRNAs are shown in Table 7. Subsequently, we used four online databases to predict potential lncRNA targeted by the miRNA and the Venn diagram to get the intersection between each of the databases, and the result as shown in Figure 11. Being identified in ≥4 object databases were set as the cutoff criteria and there are a total of 13 lncRNAs identified. Finally, the ceRNA network containing S100A9/hsa-miR-588/NEAT1, S100A9/hsa-miR-588/NEAT1, LCE3D/hsa-miR-1224-5p/NEAT1, S100A8/hsa-miR-98-5p/XIST, S100A9/hsa-miR-766-5p/XIST, S100A9/hsa-miR-588/XIST and hence a total of 18 axes, was constructed (Figure 12 and Table 8).
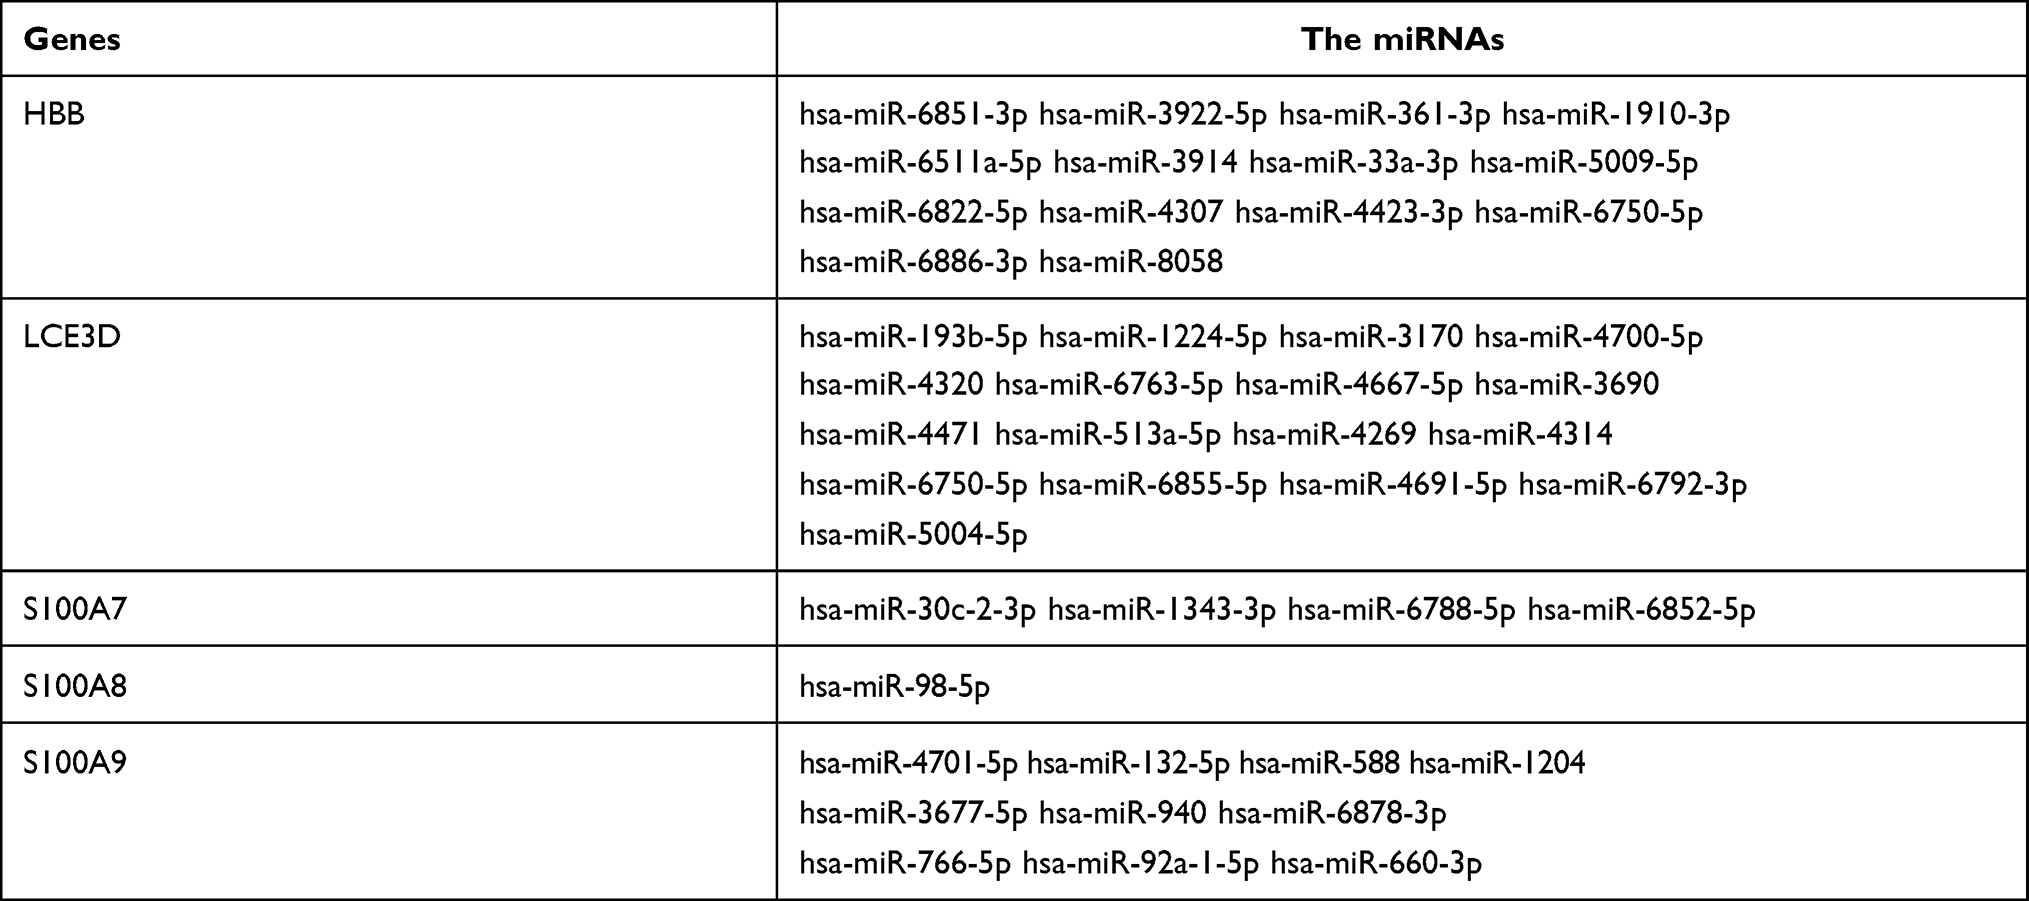 |
Table 7 The miRNAs Targeting Hub Genes |
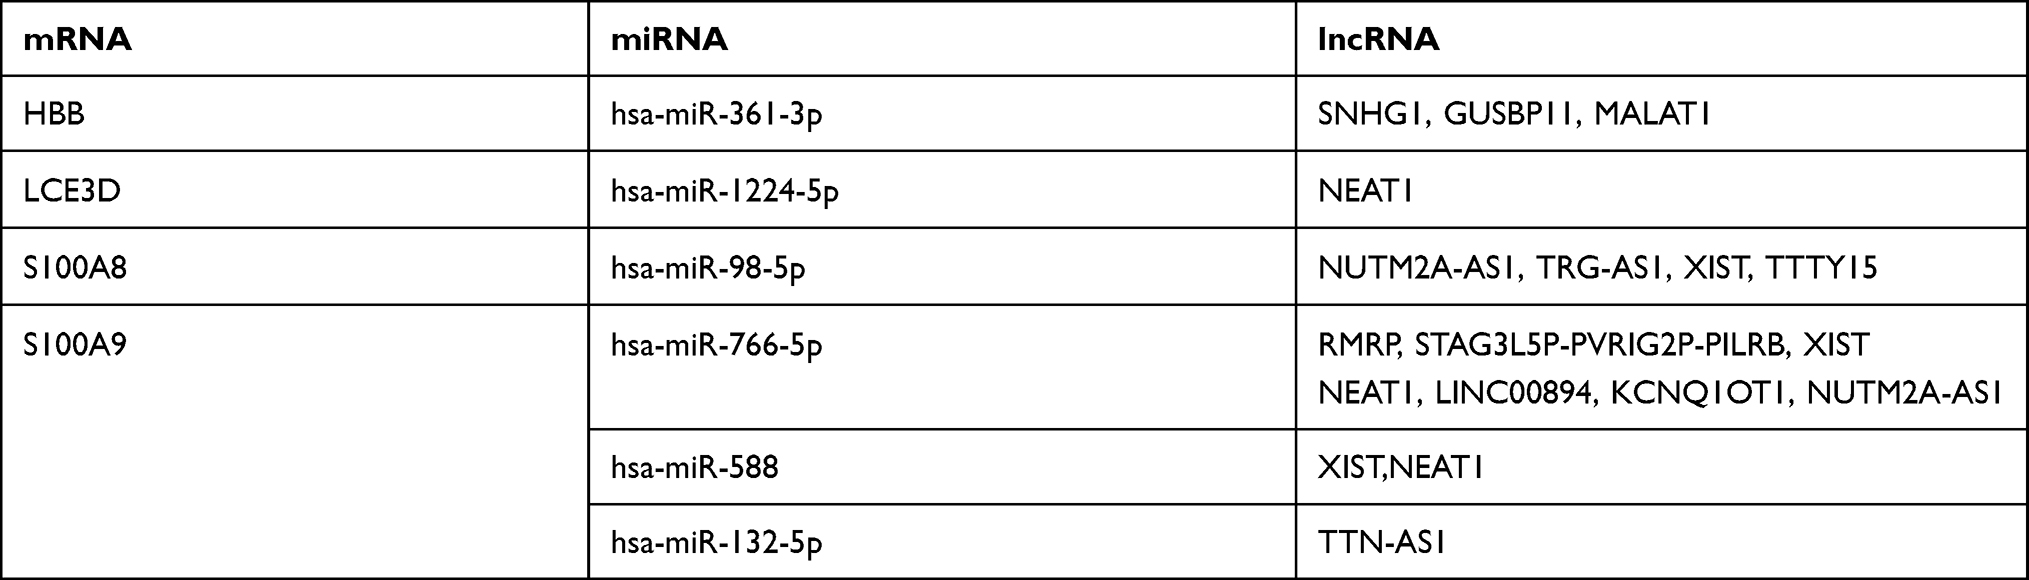 |
Table 8 The ceRNA Network of AD |
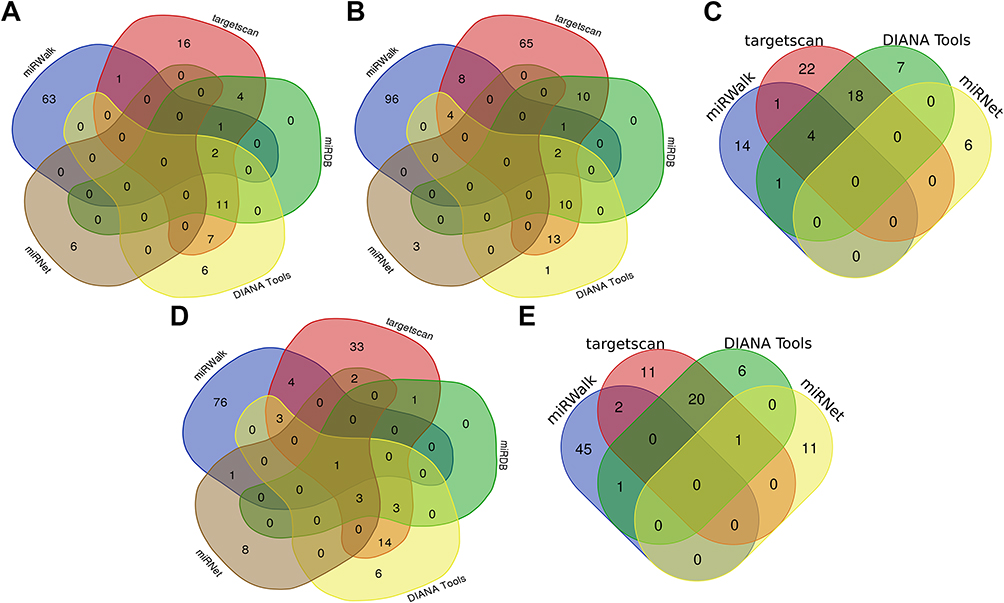 |
Figure 10 Venn diagram showed the miRNAs targeting each hub gene which were predicted in the online database. (A) HBB. (B) LCE3D. (C) S100A7. (D) S100A9. (E) S100A8. Predicted in ≥3 object databases were considered as true. |
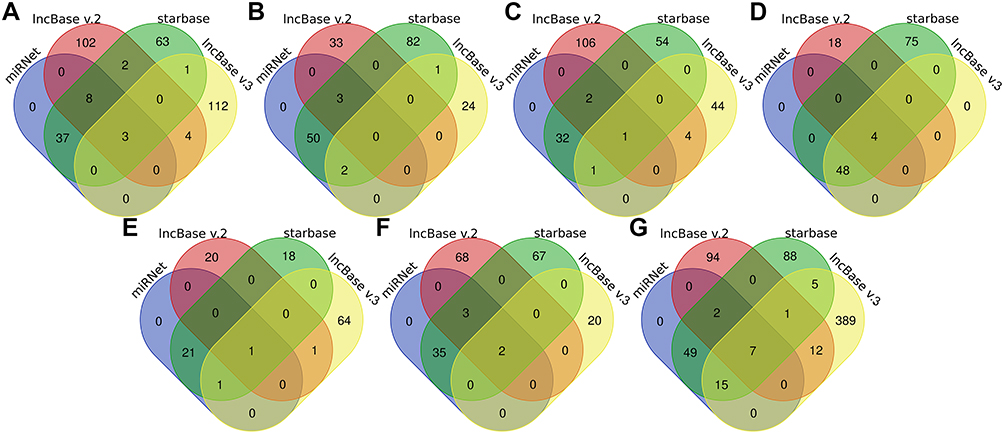 |
Figure 11 Venn diagram showed the lncRNAs which were predicted to target the identified miRNA in online database. (A) hsa-miR-361-3p. (B) hsa-miR-513a-5p. (C) hsa-miR-1224-5p. (D) hsa-miR-98-5p. (E) hsa-miR-132-5p. (F) hsa-miR-766-5p. (G) hsa-miR-588. Predicted in ≥4 object databases were considered as true. |
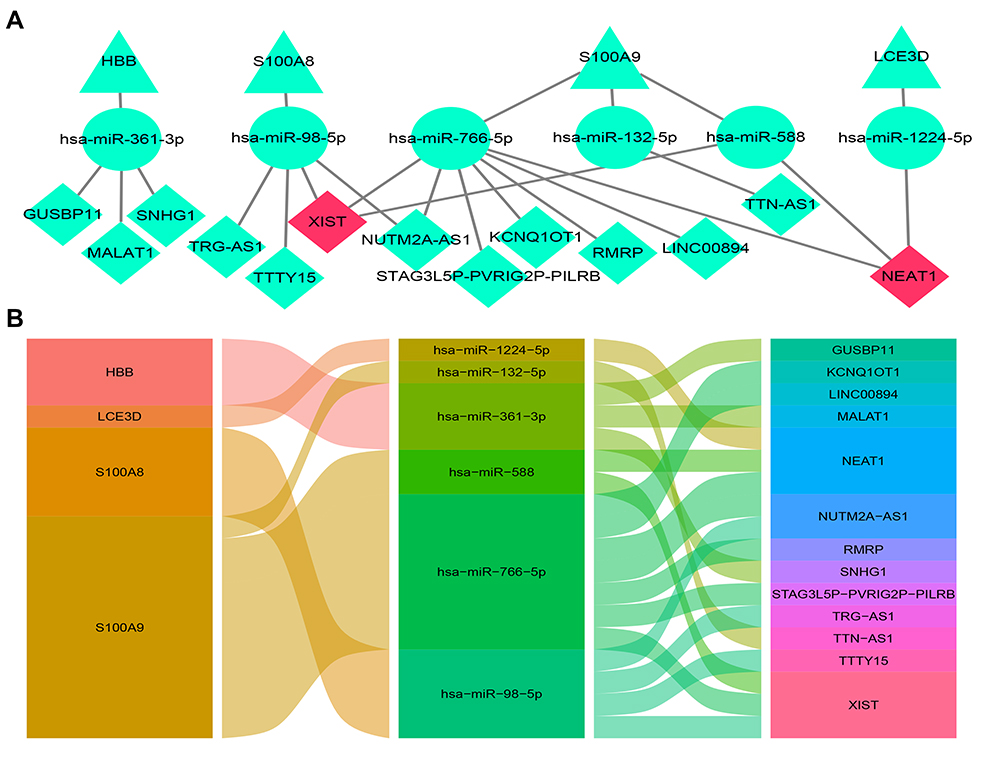 |
Figure 12 The lncRNA–miRNA–mRNA ceRNA network of AD. (A) The ceRNA network was constructed through Cytoscape software. The triangle represents the hub gene, and the circle represents the miRNA and the rhombus represents the lncRNA. The lncRNA whose degree was highest was painted red. (B) The alluvial diagram of the ceRNA network. |
RT-qPCR Validation of the Core lncRNAs of ceRNA Network
NEAT1 and XIST are identified as the core lncRNAs, which have the most degree of connectivity because they both are the intersection of three axes of the ceRNA network (Figure 12). Due to the fact that the downstream target genes of ceRNA (S100A8, S100A9, and LCE3D) are overexpression, they are predicted to be equally overexpressed based on the mechanism of ceRNA. NEAT1 and XIST were validated in AD patients’ serum using RT-qPCR analysis. The results show that NEAT1 and XIST are obviously overexpressed in AD compared to healthy controls (Figure 13), which is consistent with the bioinformatics prediction.
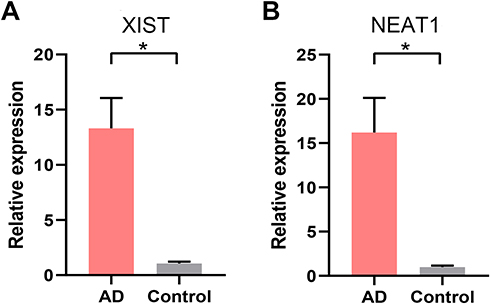 |
Figure 13 RT-qPCR validation of the core lncRNAs of the ceRNA network. (A) The relative expression of XIST between AD and healthy control. (B) The relative expression of NEAT1 between AD and healthy control. *p<0.05. Abbreviation: AD, atopic dermatitis. |
Discussion
AD is a common chronic inflammatory skin disease, which has presented a leading non-fatal health burden attributable worldwide.31 Although immunotherapy of AD got some effectiveness, how to alleviate and prevent recurrence more effectively is a worldwide problem for AD at present owing to the fact that there still are many uncertainties in the mechanism.32 With the fast development of science, bioinformatics has provided a powerful strategy for exploring potential molecular markers and pathophysiological mechanisms.33 Therefore, this study aims to develop and validate the potential key genes and molecular mechanisms of AD through bioinformatics analysis, especially in immunomodulation, to propose a new perspective into the pathogenesis and treatment strategies of AD.
In this study, we analyzed three RNA expression profile datasets (GSE63741 and GSE124700 as the training datasets, and GSE121212 as the validation datasets), and only selected the DEGs that overlapped in the two training datasets, which can prevent from resulting in a high probability of false-positive results that may ensue from most of previous research focused on the single dataset. 22 DEGs, which included 14 upregulated genes and 8 downregulated genes, were identified and subjected to gene enrichment analyses. The results of the databases, including GSEA and Metascape, confirmed each other, which showed that these genes were mainly involved in immune response (including leukocyte chemotaxis, granulocyte chemotaxis, lymphocyte chemotaxis and so on), developmental process (including epidermis development), biological regulation (including cytokine activity, chemokine receptor binding and so on), most of which are commonly accepted components of the pathogenesis and pathological changes of AD.34 The researchers found that lesional atopic dermatitis skin shows the dysregulated expression of a wide range of cytokines, mostly related to keratinocyte activity and T-cell infiltration, especially for Th22-associated (IL-22) and Th2-associated (IL-4, IL-5).35,36 The IL−17 signaling pathway was the main result of pathway enrichment. IL-17 was not only produced by Th17 cells, but also excreted by various innate cells such as γδ-T cells, lymphoid tissue inducer, natural killer T, natural killer, dendritic cells (DC), and macrophages.37 The pro-inflammatory effect of IL-17 was initially confirmed in fibroblasts, in which it could stimulate NF-kappa-B and related cytokines.38,39 Epithelial cells could be stimulated by IL-17 to express IL-6 and IL-8 and granulocyte colony-stimulating factor, inducing neutrophils migration and activation, which might mediate AD-related immune dysregulation.40 The DEGs were also involved in cytokine−cytokine receptor interaction and Chemokine signaling pathway. To some extent, these suggest that the DEGs have the function of participating in the immunomodulation of AD.
We identified the five hub genes by the PPI network and module analysis, which were HBB, S100A7, S100A8, S100A9, and LCE3D. ROC curve analysis verified the reliability of their diagnostic value, which suggests that they are the key genes and could be potential prognostic and diagnostic biomarkers. S100A7, S100A8, and S100A9 are known as antimicrobial peptides (AMPs) in the epidermis.41 They can kill microorganisms, such as bacteria, viruses and so on, and also exhibit immunomodulatory activities, inducing altering cytokine/chemokine expression, cell migration, proliferation, and differentiation, as one of the first defensive reaction of the natural immune system.42,43 Gittler et al identified that increased expression of S100A9, S100A8, and S100A7 genes were associated with AD initiation and activation of Th2 and Th22 cytokines.44 Son et al suggested that S100A7-related signaling molecules might be effective targets for restoring skin barrier function in AD where S100A7 is accumulated excessively.45 In agreement with these studies, we also find that S100A7, S100A8, and S100A9 were significantly overexpression in AD, and the results of functional enrichment analysis showed that they mediated the IL−17 signaling pathway, and developed antimicrobial humoral response, leukocyte chemotaxis, granulocyte chemotaxis and so on, which made it more systematically explained that S100A7, S100A8, and S100A9 played a role in AD. HBB and LCE3D have not been found to be associated with AD before. It is well known that defect of the HBB gene leads to the occurrence of β-thalassemia, and LCE3D is associated with susceptibility to psoriasis.46,47 They may also be important for AD because they could, respectively, interact with S100A7, S100A8, and S100A9 as described above, which may be new perspective to the pathogenesis of AD.
To further clarify immune dysregulation of AD, we analysed the immune infiltration. It was determined that there was some diversity between the tissue of normal controls and that of AD patients in immune cell infiltration through the PCA. The basic feature of AD was Th2-type inflammation, and IL 4 and IL 13 were important cytokines mediating the pathogenesis of AD, which were mainly produced by Th2 cells, basophil, and type 2 innate lymphoid cells.48 Brunner et al indicated that skin barrier dysfunction allowed external environmental substances (instance of microorganisms and allergens) to easily enter the epidermis and initiated Th2 type inflammation, which Langerhans cells and dermal dendritic cells participated in by presenting allergens.49 These were further confirmed in our study. We found that CD4+ T cell, Th2 cell, and DC cell were higher proportion in AD. Besides, there were also Tr1 cell, iTreg cell, and nTreg cell polarization, Tfh cell, and other cells infiltration. Our further research showed that each of S100A7, S100A8, S100A9, and LCE3D was significantly and positively correlated with most of the infiltration cells in AD like Th2 cell, DC cell, and iTreg cell, which indicated that S100A7, S100A8, S100A9, and LCE3D correlated with immune dysregulation of AD and might be its the potential critical immunomodulation sites.
Moreover, to screen out key molecules and axes and unveil a systematic regulatory network in AD, a ceRNA network was constructed, in which the S100A9/hsa-miR-588/NEAT1, S100A9/hsa-miR-588/NEAT1, LCE3D/hsa-miR-1224-5p/NEAT1, S100A8/hsa-miR-98-5p/XIST, S100A9/hsa-miR-766-5p/XIST, S100A9/hsa-miR-588/XIST and hence a total of 18 axes might serve critical roles in AD. The fact that NEAT1 and XIST, the core lncRNAs of ceRNA network, were significantly overexpressing was verified in Clinical AD patient serum by RT-qPCR, which was consistent with the bioinformatics prediction based on the ceRNA mechanism. Both NEAT1 and XIST played a pivotal regulatory part in the immunomodulation of various diseases, however, they have not been found to be associated with AD before, so our findings may bring a new perspective for the immunomodulation pathogenesis of AD.
In addition, there are also aware of some limitations in this study. We determined the level of NEAT1 and XIST using Clinical AD patient’ serum but not tissue, which is not as good as possible but still have Clinical representative. And it is insufficient to conduct a secondary analysis of existing data only through bioinformatics.
Conclusion
Based on the bioinformatic analysis, we identified 5 key genes including HBB, S100A7, S100A8, S100A9, and LCE3D, which are mainly involved in immune response in AD. Especially the four of them, S100A7, S100A8, S100A9, and LCE3D, were significantly correlated with the main infiltration cell of AD in particular, indicating they were the potential new therapeutic targets for AD to ameliorate immune dysregulation. Moreover, we set up a ceRNA network containing the key genes and verified the core lncRNAs of the network by RT-qPCR to make it more reliable, which provided a more detailed molecular mechanism to understand AD development. In the future, we are going to do further experimental studies of these genes to further validate these predicted results of bioinformatics analysis.
Funding
This research was supported by Hunan Provincial Innovation Foundation For Postgraduate (CX20200547) and Scientific Research Projects of Hunan Health and Family Planning Commission (20200597, B2019055).
Disclosure
The authors report no conflicts of interest in this work.
References
1. Langan SM, Irvine AD, Weidinger S. Atopic dermatitis. Lancet. 2020;396(10247):345–360. doi:10.1016/S0140-6736(20)31286-1
2. Charlesworth EN. Atopic dermatitis: the epidemiology, causes and prevention of atopic eczema. Ann Allergy Asthma Immunol. 2001;86(3):349. doi:10.1016/S1081-1206(10)63313-3
3. Silverberg JI, Hanifin JM. Adult eczema prevalence and associations with asthma and other health and demographic factors: a US population-based study. J Allergy Clin Immunol. 2013;132(5):1132–1138. doi:10.1016/j.jaci.2013.08.031
4. Beasley R; of Asthma TI. Worldwide variation in prevalence of symptoms of asthma, allergic rhinoconjunctivitis, and atopic eczema: ISAAC. The international study of asthma and allergies in childhood (ISAAC) steering committee. Lancet. 1998;351(9111):1225–1232. doi:10.1016/S0140-6736(97)07302-9
5. Cipriani F, Dondi A, Ricci G. Recent advances in epidemiology and prevention of atopic eczema. Pediatr Allergy Immunol. 2014;25(7):630–638. doi:10.1111/pai.12309
6. Katoh N, Ohya Y, Ikeda M, et al. Japanese guidelines for atopic dermatitis 2020. Allergol Int. 2020;69(3):356–369. doi:10.1016/j.alit.2020.02.006
7. Boguniewicz M, Leung DY. Atopic dermatitis: a disease of altered skin barrier and immune dysregulation. Immunol Rev. 2011;242(1):233–246. doi:10.1111/j.1600-065X.2011.01027.x
8. Werfel T, Allam JP, Biedermann T, et al. Cellular and molecular immunologic mechanisms in patients with atopic dermatitis. J Allergy Clin Immunol. 2016;138(2):336–349. doi:10.1016/j.jaci.2016.06.010
9. Dattola A, Bennardo L, Silvestri M, Nisticò SP. What’s new in the treatment of atopic dermatitis? Dermatol Ther. 2019;32(2):e12787. doi:10.1111/dth.12787
10. Chu CY. Treatments for childhood atopic dermatitis: an update on emerging therapies. Clin Rev Allergy Immunol. 2020. doi:10.1007/s12016-020-08799-1
11. Wang X, Bao K, Wu P, et al. Integrative analysis of lncRNAs, miRNAs, and mRNA-associated ceRNA network in an atopic dermatitis recurrence model. Int J Mol Sci. 2018;19(10):3263.
12. Zhao Y, Yu Z, Ma R, et al. lncRNA-Xist/miR-101-3p/KLF6/C/EBPα axis promotes TAM polarization to regulate cancer cell proliferation and migration. Mol Ther Nucleic Acids. 2021;23:536–551. doi:10.1016/j.omtn.2020.12.005
13. Zhong Y, Du Y, Yang X, et al. Circular RNAs function as ceRNAs to regulate and control human cancer progression. Mol Cancer. 2018;17(1):79. doi:10.1186/s12943-018-0827-8
14. Edgar R, Domrachev M, Lash AE. Gene expression omnibus: NCBI gene expression and hybridization array data repository. Nucleic Acids Res. 2002;30(1):207–210. doi:10.1093/nar/30.1.207
15. Barrett T, Wilhite SE, Ledoux P, et al. NCBI GEO: archive for functional genomics data sets–update. Nucleic Acids Res. 2013;41(Database issue):D991–995. doi:10.1093/nar/gks1193
16. Liao Y, Wang J, Jaehnig EJ, Shi Z, Zhang B. WebGestalt 2019: gene set analysis toolkit with revamped UIs and APIs. Nucleic Acids Res. 2019;47(W1):W199–w205. doi:10.1093/nar/gkz401
17. Zhou Y, Zhou B, Pache L, et al. Metascape provides a biologist-oriented resource for the analysis of systems-level datasets. Nat Commun. 2019;10(1):1523. doi:10.1038/s41467-019-09234-6
18. Szklarczyk D, Franceschini A, Wyder S, et al. STRING v10: protein-protein interaction networks, integrated over the tree of life. Nucleic Acids Res. 2015;43(Database issue):D447–452. doi:10.1093/nar/gku1003
19. Shannon P, Markiel A, Ozier O, et al. Cytoscape: a software environment for integrated models of biomolecular interaction networks. Genome Res. 2003;13(11):2498–2504. doi:10.1101/gr.1239303
20. Miao YR, Zhang Q, Lei Q, et al. ImmuCellAI: a unique method for comprehensive T-cell subsets abundance prediction and its application in cancer immunotherapy. Adv Sci. 2020;7(7):1902880. doi:10.1002/advs.201902880
21. Paraskevopoulou MD, Georgakilas G, Kostoulas N, et al. DIANA-microT web server v5.0: service integration into miRNA functional analysis workflows. Nucleic Acids Res. 2013;41(WebServer issue):W169–173. doi:10.1093/nar/gkt393
22. Chang L, Zhou G, Soufan O, Xia J. miRNet 2.0: network-based visual analytics for miRNA functional analysis and systems biology. Nucleic Acids Res. 2020;48(W1):W244–w251. doi:10.1093/nar/gkaa467
23. Lewis BP, Burge CB, Bartel DP. Conserved seed pairing, often flanked by adenosines, indicates that thousands of human genes are microRNA targets. Cell. 2005;120(1):15–20. doi:10.1016/j.cell.2004.12.035
24. Dweep H, Sticht C, Pandey P, Gretz N. miRWalk–database: prediction of possible miRNA binding sites by “walking” the genes of three genomes. J Biomed Inform. 2011;44(5):839–847. doi:10.1016/j.jbi.2011.05.002
25. Wong N, Wang X. miRDB: an online resource for microRNA target prediction and functional annotations. Nucleic Acids Res. 2015;43(Databaseissue):D146–152. doi:10.1093/nar/gku1104
26. Li JH, Liu S, Zhou H, Qu LH, Yang JH. starBase v2.0: decoding miRNA-ceRNA, miRNA-ncRNA and protein-RNA interaction networks from large-scale CLIP-Seq data. Nucleic Acids Res. 2014;42(Database issue):D92–97. doi:10.1093/nar/gkt1248
27. Karagkouni D, Paraskevopoulou MD, Tastsoglou S, et al. DIANA-LncBase v3: indexing experimentally supported miRNA targets on non-coding transcripts. Nucleic Acids Res. 2020;48(D1):D101–d110. doi:10.1093/nar/gkz1036
28. Paraskevopoulou MD, Vlachos IS, Karagkouni D, et al. DIANA-LncBase v2: indexing microRNA targets on non-coding transcripts. Nucleic Acids Res. 2016;44(D1):D231–238. doi:10.1093/nar/gkv1270
29. Pagani IS, Spinelli O, Mattarucchi E, et al. Genomic quantitative real-time PCR proves residual disease positivity in more than 30% samples with negative mRNA-based qRT-PCR in chronic myeloid leukemia. Oncoscience. 2014;1(7):510–521. doi:10.18632/oncoscience.65
30. Thomson DW, Dinger ME. Endogenous microRNA sponges: evidence and controversy. Nat Rev Genet. 2016;17(5):272–283. doi:10.1038/nrg.2016.20
31. Weidinger S, Novak N. Atopic dermatitis. Lancet. 2016;387(10023):1109–1122. doi:10.1016/S0140-6736(15)00149-X
32. Saini S, Pansare M. New insights and treatments in atopic dermatitis. Pediatr Clin North Am. 2019;66(5):1021–1033. doi:10.1016/j.pcl.2019.06.008
33. Kulasingam V, Diamandis EP. Strategies for discovering novel cancer biomarkers through utilization of emerging technologies. Nat Clin Pract Oncol. 2008;5(10):588–599. doi:10.1038/ncponc1187
34. Nakahara T, Kido-Nakahara M, Tsuji G, Furue M. Basics and recent advances in the pathophysiology of atopic dermatitis. J Dermatol. 2021;48(2):130–139. doi:10.1111/1346-8138.15664
35. Gooderham MJ, Hong HC, Eshtiaghi P, Papp KA. Dupilumab: a review of its use in the treatment of atopic dermatitis. J Am Acad Dermatol. 2018;78(3 Suppl 1):S28–s36. doi:10.1016/j.jaad.2017.12.022
36. He H, Guttman-Yassky E. JAK Inhibitors for Atopic Dermatitis: an Update. Am J Clin Dermatol. 2019;20(2):181–192. doi:10.1007/s40257-018-0413-2
37. Amatya N, Garg AV, Gaffen SL. IL-17 signaling: the Yin and the Yang. Trends Immunol. 2017;38(5):310–322. doi:10.1016/j.it.2017.01.006
38. Fossiez F, Djossou O, Chomarat P, et al. T cell interleukin-17 induces stromal cells to produce proinflammatory and hematopoietic cytokines. J Exp Med. 1996;183(6):2593–2603. doi:10.1084/jem.183.6.2593
39. Awane M, Andres PG, Li DJ, Reinecker HC. NF-kappa B-inducing kinase is a common mediator of IL-17-, TNF-alpha-, and IL-1 beta-induced chemokine promoter activation in intestinal epithelial cells. J Immunol. 1999;162(9):5337–5344.
40. Sugaya M. The role of Th17-related cytokines in atopic dermatitis. Int J Mol Sci. 2020;21(4):1314. doi:10.3390/ijms21041314
41. Abtin A, Eckhart L, Gläser R, Gmeiner R, Mildner M, Tschachler E. The antimicrobial heterodimer S100A8/S100A9 (calprotectin) is upregulated by bacterial flagellin in human epidermal keratinocytes. J Invest Dermatol. 2010;130(10):2423–2430. doi:10.1038/jid.2010.158
42. Kang HK, Kim C, Seo CH, Park Y. The therapeutic applications of antimicrobial peptides (AMPs): a patent review. J Microbiol. 2017;55(1):1–12. doi:10.1007/s12275-017-6452-1
43. Sierra JM, Fusté E, Rabanal F, Vinuesa T, Viñas M. An overview of antimicrobial peptides and the latest advances in their development. Expert Opin Biol Ther. 2017;17(6):663–676. doi:10.1080/14712598.2017.1315402
44. Gittler JK, Shemer A, Suárez-Fariñas M, et al. Progressive activation of T(H)2/T(H)22 cytokines and selective epidermal proteins characterizes acute and chronic atopic dermatitis. J Allergy Clin Immunol. 2012;130(6):1344–1354. doi:10.1016/j.jaci.2012.07.012
45. Son ED, Kim HJ, Kim KH, et al. S100A7 (psoriasin) inhibits human epidermal differentiation by enhanced IL-6 secretion through IκB/NF-κB signalling. Exp Dermatol. 2016;25(8):636–641. doi:10.1111/exd.13023
46. Wu S, Wei H, Chu M, Weng Z. Generation of a human iPSC line CIBi008-A from amniotic fluid-derived cells of a fetus with β-thalassemia carrying variants of −28A > G and IVS-II-654C > T in HBB. Stem Cell Res. 2020;49:102074. doi:10.1016/j.scr.2020.102074
47. Tang H, Jin X, Li Y, et al. A large-scale screen for coding variants predisposing to psoriasis. Nat Genet. 2014;46(1):45–50. doi:10.1038/ng.2827
48. Blauvelt A, de Bruin-weller M, Gooderham M, et al. Long-term management of moderate-to-severe atopic dermatitis with dupilumab and concomitant topical corticosteroids (LIBERTY AD CHRONOS): a 1-year, randomised, double-blinded, placebo-controlled, Phase 3 trial. Lancet. 2017;389(10086):2287–2303. doi:10.1016/S0140-6736(17)31191-1
49. Brunner PM, Leung DYM, Guttman-Yassky E. Immunologic, microbial, and epithelial interactions in atopic dermatitis. Ann Allergy Asthma Immunol. 2018;120(1):34–41. doi:10.1016/j.anai.2017.09.055
 © 2021 The Author(s). This work is published and licensed by Dove Medical Press Limited. The full terms of this license are available at https://www.dovepress.com/terms.php and incorporate the Creative Commons Attribution - Non Commercial (unported, v3.0) License.
By accessing the work you hereby accept the Terms. Non-commercial uses of the work are permitted without any further permission from Dove Medical Press Limited, provided the work is properly attributed. For permission for commercial use of this work, please see paragraphs 4.2 and 5 of our Terms.
© 2021 The Author(s). This work is published and licensed by Dove Medical Press Limited. The full terms of this license are available at https://www.dovepress.com/terms.php and incorporate the Creative Commons Attribution - Non Commercial (unported, v3.0) License.
By accessing the work you hereby accept the Terms. Non-commercial uses of the work are permitted without any further permission from Dove Medical Press Limited, provided the work is properly attributed. For permission for commercial use of this work, please see paragraphs 4.2 and 5 of our Terms.