
Back to Journals » International Journal of Chronic Obstructive Pulmonary Disease » Volume 20
Identifying the Core Symptoms in Chinese Patients of Chronic Obstructive Pulmonary Disease: A Contemporaneous Symptom Network Analysis
Authors Yang Z, Cui M, Zhang J, Wang Z, Yao G, Fu X
Received 12 December 2024
Accepted for publication 29 June 2025
Published 22 July 2025 Volume 2025:20 Pages 2569—2579
DOI https://doi.org/10.2147/COPD.S511879
Checked for plagiarism Yes
Review by Single anonymous peer review
Peer reviewer comments 2
Editor who approved publication: Professor Min Zhang
Zhenjiao Yang,1 Miaoling Cui,2 Jianquan Zhang,1 Zixiu Wang,3 Guirui Yao,1 Xia Fu4
1Department of Respiratory and Critical Care Medicine, The Eighth Affiliated Hospital, Sun Yat-Sen University, Shenzhen, Guangdong, People’s Republic of China; 2Department of Nursing, The First Hospital Affiliated to Guangxi Medical University, Nanning, Guangxi, People’s Republic of China; 3Department of Respiratory and Critical Care Medicine, The First Hospital Affiliated to Guangxi Medical University, Nanning, Guangxi, People’s Republic of China; 4Department of Nursing, The Eighth Affiliated Hospital, Sun Yat-Sen University, Shenzhen, Guangdong, People’s Republic of China
Correspondence: Xia Fu, Department of Nursing, The Eighth Affiliated Hospital, Sun Yat-sen University, No. 3025 Shennan Middle Road, Shenzhen, Guangdong Province, 518000, Email [email protected]
Context: Patients with chronic obstructive pulmonary disease (COPD) exhibit various patterns of co-occurring complex symptoms. However, identifying core symptoms based on these distinct symptom patterns remains limited.
Objective: The aims of this current study were to explore symptom subgroups among patients with COPD based on their unique symptom experiences and to identify the core symptoms within these subgroups, along with the correlation of these core symptoms with laboratory indicators.
Methods: From May 2018 to December 2023, we recruited 252 participants with COPD through a convenience sample in China. Participants were investigated using the Revised Memorial Symptom Assessment Scale (RMSAS). Latent profile analysis (LPA) was conducted to identify symptom subgroups, while network analysis was used to reveal core symptoms among subgroups identified by LPA.
Results: Based on symptom experiences, two subgroups of patients were identified: the “low” symptom burden subgroup and the “high” symptom burden subgroup. In both the total sample and the low symptom burden subgroup, “feeling sad” was identified as the core symptom, whereas “feeling drowsy” was the core symptom in the high symptom burden subgroup. The neutrophil-to-lymphocyte ratio was associated with the severity of drowsiness.
Conclusion: This study highlights the heterogeneity among COPD patients with multiple symptoms, resulting in the identification of two distinct symptom subgroups. Addressing symptoms of sadness and drowsiness may serve as a crucial target for alleviating the overall symptom burden in individuals with COPD.
Keywords: COPD, symptom subgroup, core symptom, heterogeneity, network analysis
Introduction
Chronic obstructive pulmonary disease (COPD) is the third most prevalent cause of death across the world.1 In China, its prevalence reaches 8.6% among adults aged 20 years and older, increases to 13.7% for those aged 40 and above, and exceeds 27% among individuals over 60.2 By 2050, projections suggest that the global prevalence of COPD could surpass 600 million cases,1,3 highlighting a rising burden in the coming decades.4
COPD is a heterogeneous lung condition.5 The ratio of forced expiratory volume in the first second (FEV1%) does not fully capture the differences among COPD patients; and a comprehensive evaluation should incorporate multidimensional indicators, including symptoms, airflow limitation, risk of acute exacerbations, and comorbidities.5,6 According to prior literature,7,8 patients with COPD typically experience more than 10 co-occurring psychological and physical symptoms, which can interact synergistically to form symptom clusters throughout the disease trajectory.9,10 This results in varied patterns of symptomatology among patients. Given this symptom variability, identifying heterogeneous symptom subgroups may enhance symptom management efforts, as highlighted by the American Symposium on Symptom Science.11
Recent studies have sought to classify patients based on unique symptom patterns, reflecting interest in COPD’s symptomatic diversity. For example, a study conducted by Christensen et al employed latent class analysis to identify patient subgroups based on distinct symptom experiences.12 This study identified three subgroups: “high”, “intermediate”, and “low”, demonstrating that patients in the “high” exhibited a significantly poorer quality of life compared to the other two subgroups. A longitudinal follow-up by the same group confirmed that approximately 65% of participants initially classified in the “high” burden group remained there after 12 months, indicating the stability of these subgroup distinctions.13 However, those studies either explored how symptoms interact with each other or pinpointed a core symptom that exhibited the highest correlation with other symptoms. Furthermore, network analysis, as a modern theoretical framework, offers an innovative approach to elucidating the complex nature of comorbid symptoms while identifying core symptoms. In recent years, network analysis has been employed to study symptom interactions among patients with acute leukemia,14 HIV/AIDS,15 breast cancer,16 and lung cancer post-chemotherapy.17 For instance, Jing et al16 demonstrated that emotional symptoms were pivotal for breast cancer patients undergoing endocrine therapy, whereas Teng et al17 identified the sickness behavior symptom cluster as central for lung cancer patients post-chemotherapy. However, little is known about identifying core symptoms based on distinct symptom patterns in COPD patients, as well as the relationship between these core symptoms and laboratory indicators.
Examining the core symptoms could facilitate the identification of targets for precise intervention strategies.14 Therefore, in this study, we aimed to 1) generate symptom subgroups among patients with COPD based on their individualized symptom experiences; 2) identify the core symptoms within these subgroups; and 3) determine their relationship with laboratory indicators.
Materials and Methods
Design and Settings
This cross-sectional study was conducted at the First Affiliated Hospital of Guangxi Medical University in China, with data collected from COPD patients in the Respiratory and Critical Care Department between May 2018 and December 2023.
Study Population
Eligibility criteria for study participation consisted of the following requirements: (1) a clinical diagnosis consistent with the Global Initiative for Chronic Obstructive Lung Disease (GOLD) 2023 classification of airflow limitation, where a post-bronchodilator FEV1/forced vital capacity ratio of <0.7 confirms persistent airflow limitation;5 (2) aged 40 years or older; (3) possessing clear consciousness along with normal comprehension and expression abilities; and (4) expressing willingness to participate. Patients with cognitive impairments, or unable to understand were excluded.
Measures
Demographic and Clinical Data
Participant baseline data were obtained through investigator-designed survey instruments. The collected sociodemographic variables included: age, gender, education level, medical insurance, place of residence, and smoking status. The clinical assessment included evaluation of airflow limitation severity based on GOLD criteria: stage 1 (mild: FEV1≥80% predicted), stage 2 (moderate: 50%≤FEV1<80% predicted), stage 3 (severe: 30%≤FEV1<50% predicted), and stage 4 (very severe: FEV1 <30% predicted),5 as well as disease duration and number of comorbidities.
Laboratory Indicators
Laboratory indicators included procalcitonin (PCT), C-reactive protein (CRP), neutrophil-to-lymphocyte ratio (NLR), eosinophil count (EOS), and red cell volume distribution width (RDW) level. All these laboratory indicator data were collected by the electronic medical record system.
Self-Reported Symptoms
The Revised Memorial Symptom Assessment Scale (RMSAS),18 derived from the Memorial Symptom Assessment Scale (MSAS),19 was validated by Cheng et al for use in Chinese populations.20 This instrument exhibits strong psychometric properties, with an overall Cronbach’s α of 0.86 among COPD patients, indicating high internal consistency.18 Participants were instructed to report whether they had experienced any of the 19 listed symptoms within the previous week (ie, occurrence). For symptoms endorsed as present, severity was rated on a 4-point Likert scale (ie, 1= slight, 2=moderate, 3= severe, and 4 = very severe), yielding a total possible score ranging from 0 to 76, where higher values reflect greater symptom burden. In the current study, the RMSAS showed excellent reliability, with a Cronbach’s α of 0.851. Factor analysis supported its structural validity, as evidenced by a Kaiser-Meyer-Olkin measure of 0.836 and a significant Bartlett’s test (P < 0.05). The analysis identified five principal components, accounting for 61.78% of the cumulative variance, further confirming the scale’s robustness.
Data Collection
This study was approved by the Medical Ethics Committee of the First Affiliated Hospital of Guangxi Medical University, China. All procedures followed the Declaration of Helsinki, and all eligible patients provided written informed consent. Before the investigation, researchers provided a detailed explanation to the patients. A questionnaire survey was conducted, with disease-related data and laboratory indicators collected by researchers from hospital electronic records, while all other information was self-reported by patients. For patients who are unable to complete the form independently, we provided guidance to family members in filling out the forms using standardized instructions or assisted them in completing questionnaires based on the symptoms reported.
Statistical Analysis
Statistical analyses were conducted using IBM SPSS Statistics (version 22.0). Continuous variables were expressed as mean±standard deviation, while categorical variables were summarized as frequencies and percentages. To assess associations between core symptom centrality and clinical biomarkers, Spearman correlation was employed. A two-tailed significance threshold of P < 0.05 was applied for all statistical tests.
To identify distinct symptom-based subgroups among patients with COPD, we performed latent profile analysis (LPA) in Mplus 8.3, incorporating 15 symptoms from the RMSAS that were present in at least 25% of the study population. Model selection was guided by multiple statistical indices including the Akaike information criterion (AIC), Bayesian information criterion (BIC), sample-size-adjusted BIC (aBIC), and the entropy for each model.15 The optimal solution was determined by selecting the configuration demonstrating the smallest AIC, BIC, and aBIC values while maintaining an entropy threshold ≥0.8. Using the Lo-Mendell-Rubin likelihood ratio test (LMR), adjusted LMR (aLMR), and bootstrapped likelihood ratio test (BLRT), the estimated model was compared to a model with one class less.21,22 Statistical significance (P<0.05) across all three tests provided evidence for the superiority of the K-class solution over the (K-1)-class alternative.
Network analysis was implemented in R 4.4.1 using the “qgraph” package to characterize symptom-symptom associations and network properties, with LPA groupings serving as the analytical framework. Firstly, within this framework, we constructed a weighted, undirected network in which nodes represented symptoms and edges reflected conditional independence relationships among them. These associations were estimated using Spearman correlation coefficients, calculated from either individual symptom severity scores or standardized symptom severity scores. In the network visualization, nodal proximity corresponded to connection density, and edge width represented the magnitude of inter-nodal associations.15,23 Next, to enhance network sparsity and minimize false connections, we subsequently implemented the EBICglasso algorithm using a γ tuning parameter of 0.5. Finally, the network was visualized utilizing the Fruchterman-Reingold algorithm and spring layout, where edge width was proportional to correlation strength and color indicated directionality.24
Four centrality indices: strength (rs), betweenness (rb), closeness (rc), and expected influence (re)were employed to determine the most central symptoms in the network analysis.25 Strength measures the sum of the absolute weights of the correlation coefficients between a symptom and others, reflecting its importance and influence within the network; Betweenness centrality quantifies a node’s role as a bridge within the network by measuring its position in the shortest paths connecting other node pairs, thereby demonstrating its impact on the overall network; Closeness was described as the average distance from a node and other nodes.15 Previous studies have demonstrated that strength centrality is consistently identified as the major and dependable indicator among the three indices (strength, closeness, and betweenness); when ranking inconsistencies occur among the three centrality measures, the ordering based on strength centrality is conventionally prioritized.15,26,27 Furthermore, a prior study demonstrated that the ranking of strength centrality exhibited greater stability compared to the rankings of closeness and betweenness centrality.28 Additionally, expected influence, which assesses the influence of a node within the network, serves as a reliable indicator for evaluating relationships between nodes.17,29 Therefore, this study primarily utilized strength and expected influence as the major indicators for identifying core symptoms among the four indices.
Results
Participant Characteristics
In this study, a total of 261 patients with COPD were analyzed. Six patients withdrew from the study due to providing identical answers to the questionnaire, and three were excluded for not returning the questionnaires. Consequently, 252 participants were included, resulting in a questionnaire return rate of 96.5%. Most of them were male (n=219, 86.9%), with the age group of 60–80 years comprising the highest proportion (n=216, 85.7%). Additionally, 38.1% had attained only a primary school education, and 25 participants lacked medical insurance. Concurrent illnesses were prevalent, with over half (n =130, 51.6%) having more than three additional diagnoses. GOLD stage 3 was the most prevalent, affecting 58 patients (38.4%). Additional demographic and clinical details are provided in Table 1.
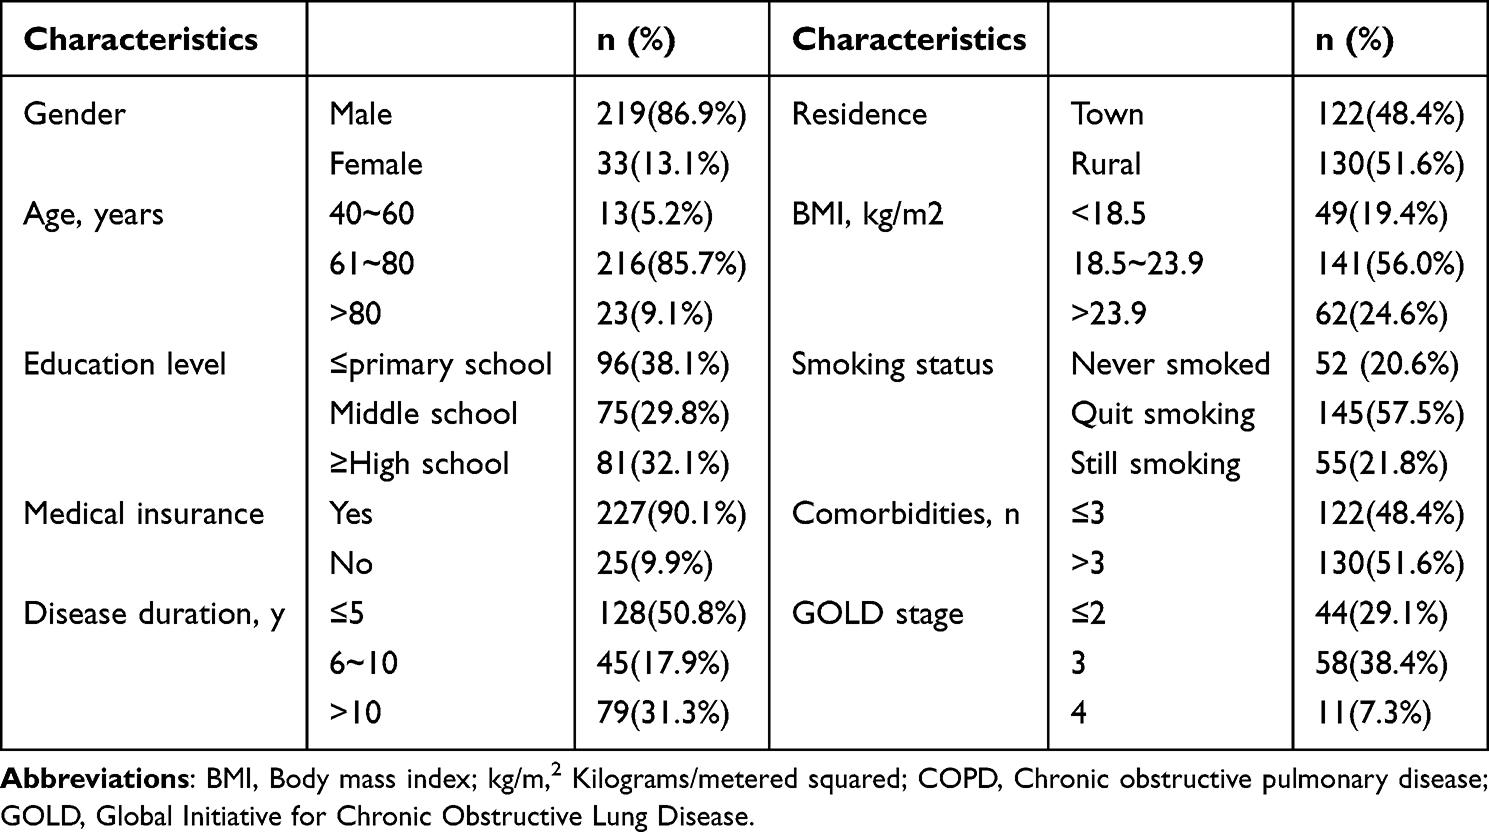 |
Table 1 Demographic and Clinical Characteristics of Patients with COPD |
Prevalence and Severity of Symptoms
As presented in Table 2. Among the 19 symptoms assessed, cough (n=248, 98.4%) was the most frequently reported, followed by shortness of breath (n=243, 96.4%) and difficulty sleeping (n=237, 94.0%). Regarding severity, shortness of breath was identified as the most severe symptom, with a median score (interquartile range) of 2.60 (1.85–3.37), followed by cough (2.50 [1.87–3.14]) and lack of energy (2.20 [1.36–2.88]). It is evident that the severity levels for these initial three symptoms range from moderate to severe.
 |
Table 2 Prevalence and Severity of 19 Symptoms in Patients with COPD |
Symptom Subgroups Identified by LPA
Table 3 presents the LPA model fitting results based on the severity of 15 symptoms. While the five-profile solution demonstrated optimal information criteria values (AIC=9657.709, BIC=9989.476, aBIC=9691.482), the LMR test failed to reach statistical significance when comparing 3-to-5-class models. This suggests that the two-profile solution is the most parsimonious model with an acceptable fit.
 |
Table 3 Comparison of Different Latent Profile Analysis Models of Symptoms of Patients with COPD |
As illustrated in Figure 1, most participants in the first profile (blue line) displayed lower symptom severity across dimensions, forming the “low” symptom burden subgroup. In contrast, the second profile (orange line) represented participants with higher symptom severity, labeled the “high” symptom burden subgroup. Significant differences were noted in the mean number of reported symptoms between these subgroups (“high” =25.39±9.00 vs “low”=20.29±6.51, P<0.001). Among the participants, 56.7% (n=143) were categorized into the low symptom burden subgroup, while 43.3% (n=109) belonged to the high symptom burden subgroup.
 |
Figure 1 Estimated mean scores of 2 latent profile symptoms of multiple symptom severity. |
Networks of Symptom Subgroups
As depicted in Figures 2 and 3, “feeling sad” served as the core symptom in the total sample network, with the highest values for strength (rs=1.108), betweenness (rb=14.000), closeness (rc=0.006), and expected influence (re=1.108), strongly linked to “worrying”. In the low symptom burden subgroup, “feeling sad” remained the core symptom across all centrality indices (rs=1.078, rb=16.000, rc=0.005, re=1.079) and was strongly linked to “worrying”. In the high symptom burden subgroup, “feeling drowsy” emerged as the most central symptom (rs=1.604, rb=36.000, rc=0.011, re=0.914), showing the highest values for strength, betweenness, and closeness. Among respiratory symptoms, “feeling drowsy” was strongly connected to “dry mouth” and “cough”.
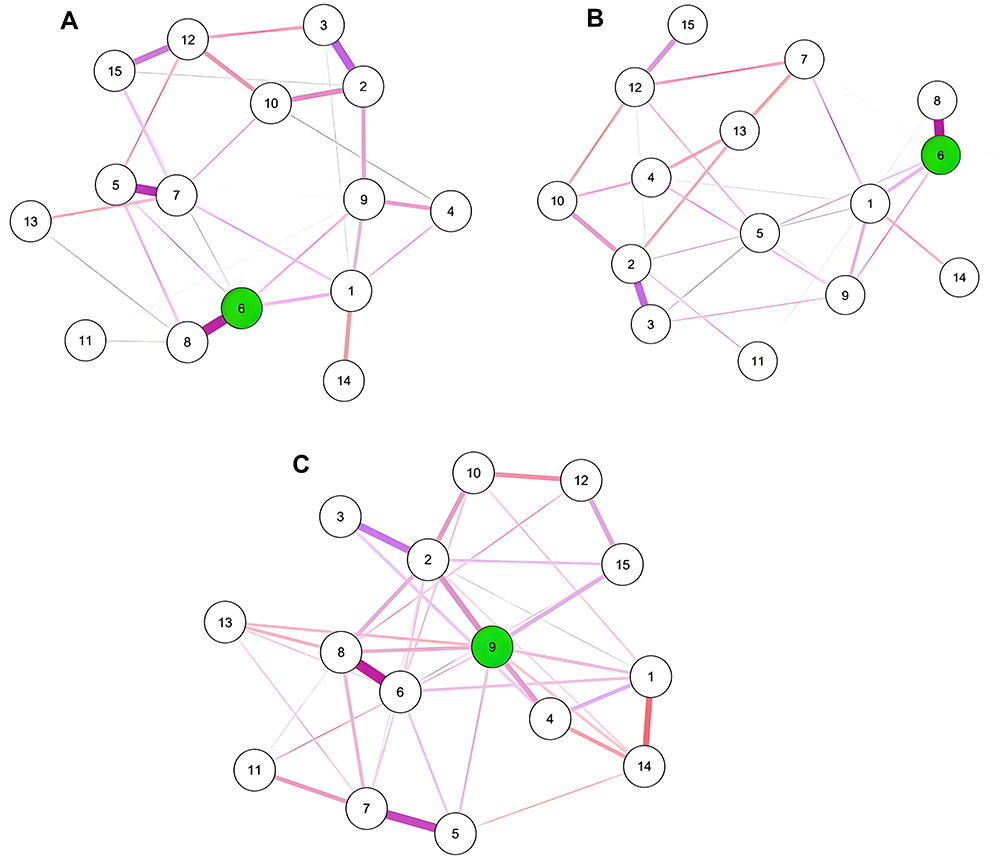 |
Figure 2 Symptom networks for the total sample and two subgroups: (A) Total sample, (B). Low symptom burden subgroup, and (C) High symptom burden subgroup. The dark nodes represent the nodes with the highest intensity, and light colors represent other nodes. The circles depicted in green illustrate the core symptoms. 1: Shortness of breath; 2: Dry mouth; 3: Lack of energy; 4: Cough; 5: Feeling nervous; 6: Feeling sad; 7: Feeling irritable; 8: Worrying; 9: Feeling drowsy; 10: Difficulty sleeping; 11: Pain; 12: Difficulty concentrating; 13: Problems with sexual interest or activity; 14: Swelling of arms and/or legs; 15: I do not look like myself. |
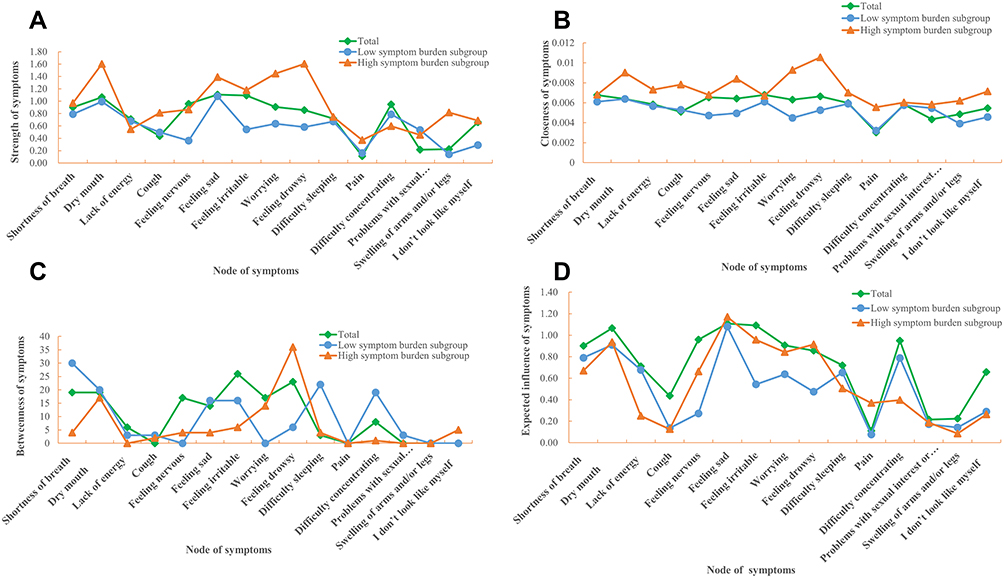 |
Figure 3 Centrality indices of the networks of the total sample and two subgroups: (A) Strength, (B) Closeness, (C) Betweenness, and (D) Expected Influence. |
Differences in Laboratory Indicators Between Core Symptoms
Table 4 shows that only the neutrophil-to-lymphocyte ratio (NLR) was significantly associated with the primary symptom “feeling drowsy”, indicating that patients with a lower NLR tended to experience a higher burden of this symptom (r = −0.138, P < 0.05).
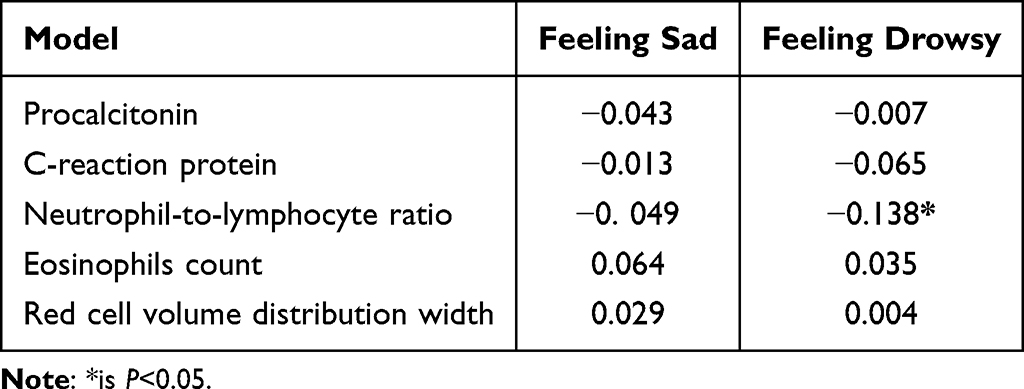 |
Table 4 Correlation Analysis of Core Symptoms with Laboratory Indicators of Patients with COPD |
Discussion
As far as we know, this is the first study to identify core symptoms within two distinct subgroups of Chinese COPD patients using network analysis and to examine their relationships with laboratory indicators.
Symptom Burden
Our study indicates that shortness of breath, cough, lack of energy, and difficulty sleeping are the most severe and burdensome symptoms reported by Chinese patients with COPD. This finding is consistent with previous studies that assessed multiple symptoms using the MSAS for COPD patients’ symptom experiences.7,8 One of our prior studies demonstrated that shortness of breath, cough, and lack of energy are interrelated, forming a respiratory functional cluster,10 and are associated with low functional performance30 and indirect negative impacts on health-related quality of life in this cohort.31
Additionally, evidence from our investigation demonstrates that the severity of symptom burden may be exacerbated by the number of comorbidities and the duration of the disease, leading to a higher burden of these symptoms.10 Therefore, based on our findings, we recommend that greater attention be given to these symptom experiences among COPD patients, particularly those with a higher number of comorbidities and longer disease durations.
Patterns of Symptom Burden
Through latent profile analysis, we identified two patient subgroups based on the severity of 15 symptoms, each with a prevalence exceeding 25%. Consequently, 56.7% of participants were classified into the low symptom burden subgroup, while 43.3% were in the high symptom burden subgroup. Our findings suggest a high degree of heterogeneity in symptom burden, reflecting varied patterns of symptoms in patients with COPD, which is consistent with previous studies.32–34 Comparing our results to earlier symptom profile analyses is challenging due to inconsistencies in subgroup composition across studies, stemming from variations in assessment tools and statistical approaches. For instance, Houben-Wilke et al34 identified three clusters based on the severity of various respiratory and non-respiratory symptoms in COPD patients, including low, medium, and high symptom burden clusters. Similarly, Christensen et al12 assessed COPD patient subgroups based on their distinct experiences with 14 symptoms using the MSAS, leading to the identification of three subgroups termed “high”, “intermediate”, and “low”. In alignment with the study conducted by Christensen et al, this research employed the MSAS to examine distinct symptom experiences, revealing three subgroups (ie, “high”, “intermediate”, and “low”) identified through latent class analyses, with 64.7% remaining in the “high” class, 43.7% in the “intermediate” class, and 81.8% in the “low” class after 12 months.13 Based on five psychological and physical symptoms (depression, anxiety, dyspnea, fatigue, and pain), another report identified four distinct symptom classes via latent class analyses, including low physical/psychological symptom class, high physical/moderate psychological symptom class, and high physical/psychological symptom class.35 Therefore, future studies should aim to validate and standardize symptom assessment instruments and statistical methodologies to accurately evaluate and compare findings across studies.
Core Symptoms
Interestingly, our findings extend the current knowledge on COPD by identifying “feeling sad” as the core symptom in both the total sample and the low symptom burden subgroup, while “feeling drowsy” emerged as a prominent symptom within the high symptom burden subgroup. Our results reveal a different symptom profile from established findings regarding fatigue in cancer patients36 and irritability in post-chemotherapy lung cancer.17 These findings demonstrate that psychological factors play a primary role in exacerbating symptom burden among COPD patients. Although few studies have focused on core symptoms in COPD using network analysis, earlier research has suggested that anxiety symptoms significantly contribute to psychological distress in COPD patients.37 Early studies indicated that between 10% and 46% of COPD patients exhibit symptoms of anxiety or depression.38,39 Despite this prevalence, these symptoms often go unrecognized by both healthcare providers and patients, as many symptoms are subtle and may be overshadowed by those associated with COPD.5,40 Consequently, clinical nursing practice should emphasize psychological care as a fundamental component of patient management. By accurately identifying these psychological issues, timely interventions can enhance the overall quality of life for affected individuals.
Correlation of Core Symptoms with Laboratory Indicators
In contrast to earlier studies,35,41 we found no association between laboratory indicators and symptom subgroup membership, except for the neutrophil-to-lymphocyte ratio (NLR). Our analysis revealed a negative correlation between drowsiness and NLR. Current literature on the relationship between drowsiness and NLR is limited, making our findings a valuable contribution. A cross-sectional study based on NHANES data found a positive association between daytime sleepiness and NLR.42 Additionally, a recent study by Meng’s team provided evidence of a nonlinear relationship between NLR and depressive symptoms.43 A systematic review indicated that inflammatory mediators such as tumor necrosis factor-c (TNF-c) and interleukin-2 (IL-2) may play a role in the relationship between COPD and depression.44 Excessive TNF-c production can lead to depressive symptoms such as fatigue, headaches, loss of appetite, and difficulties with concentration, while elevated IL-2 levels are often associated with symptoms like drowsiness and irritability.44 The present investigation specifically examined associations between central symptoms and specific inflammatory biomarkers (ie, CRP, PCT, NLR, EOS, and RDW). Future research should explore additional factors related to core symptoms, such as IL-2, IL-6, and TNF-c.
Limitations
This study is the first to investigate the core symptoms of symptom burden subgroups and their relationships with laboratory indicators in Chinese patients with COPD. However, several limitations must be acknowledged. Firstly, the cross-sectional study design permitted data collection at a single time point during hospitalization, limiting our ability to determine changes in subgroup characteristics and core symptoms throughout the treatment journey. Longitudinal analyses are necessary to explore the stability of symptom subgroups and core symptoms over time. Secondly, we identified symptom burden subgroups based solely on one dimension of self-reported symptoms (ie, severity), which may affect the reliability of our findings. Future research should incorporate evaluations of various dimensions, including symptom occurrence and distress, to enhance the reliability of identifying symptom burden subgroups and core symptoms. Lastly, this study examined relationships only between core symptoms and specific laboratory indicators (CRP, PCT, NLR, EOS, and RDW). Further research is needed to identify whether other potential factors (eg, IL-2, IL-6, and TNF-c) are associated with these core symptoms.
Conclusion
This study provides novel insights into the complex symptom experiences of patients with COPD through the application of network analysis. Two distinct symptom subgroups were identified: the low symptom burden subgroup and the high symptom burden subgroup. The emotion of sadness emerged as a central feature in both the overall sample and the low symptom burden subgroup, while drowsiness was predominant in the high symptom burden subgroup. These findings have significant implications for clinical nursing practice, highlighting the need for tailored symptom management strategies to alleviate the overall symptom burden in this patient population.
Ethics Statement
This study was performed in line with the principles of the Declaration of Helsinki. The approval was granted by the Research topic of Guangxi Health Commission (Z20210816). Informed consent was provided from all participants included in the study.
Acknowledgments
We would like to sincerely thank all patients who participated in this study.
Disclosure
The authors report no conflicts of interest in this work.
References
1. Ntritsos G, Franek J, Belbasis L, et al. Gender-specific estimates of COPD prevalence: a systematic review and meta-analysis. Int J Chron Obstruct Pulmon Dis. 2018;13:1507–1514. doi:10.2147/COPD.S146390
2. Wang C, Xu J, Yang L, et al. Prevalence and risk factors of chronic obstructive pulmonary disease in China (the China Pulmonary Health [CPH] study): a national cross-sectional study. Lancet. 2018;391:1706–1717. doi:10.1016/S0140-6736(18)30841-9
3. Boers E, Barrett M, Su JG, et al. Global burden of chronic obstructive pulmonary disease through 2050. JAMA Network Open. 2023;6:e2346598. doi:10.1001/jamanetworkopen.2023.46598
4. Celli BR, Wedzicha JA. Update on clinical aspects of chronic obstructive pulmonary disease. N Engl J Med. 2019;381:1257–1266. doi:10.1056/NEJMra1900500
5. Agusti A, Celli BR, J CG, et al. Global initiative for chronic obstructive lung disease 2023 report: GOLD executive summary. Eur Respir J. 2023;61.
6. global strategy for prevention, diagnosis and management of COPD:2024[EB/OL]. Available from: https://goldcopd.org/2024-gold-report/.
7. ALHosni F, Al QM, Omari OA, et al. Symptom prevalence, severity, distress and management among patients with chronic diseases. BMC Nurs. 2023;22(1):155. doi:10.1186/s12912-023-01296-8
8. Melhem O, Savage E, Lehane E. Symptom burden in patients with chronic obstructive pulmonary disease. Appl Nurs Res. 2021;57:151389. doi:10.1016/j.apnr.2020.151389
9. Xu M, Yu C, Lin X, et al. Identification of symptom clusters and change trajectories in patients with acute exacerbation of chronic obstructive pulmonary disease. Heliyon. 2024;10:e33745. doi:10.1016/j.heliyon.2024.e33745
10. Yang Z, Cui M, Zhang X, et al. Identification of symptom clusters and their influencing factors in subgroups of Chinese patients with acute exacerbation of chronic obstructive pulmonary disease. J Pain Symptom Manage. 2020;60:559–567. doi:10.1016/j.jpainsymman.2020.03.037
11. Miaskowski C, Barsevick A, Berger A, et al. Advancing symptom science through symptom cluster research: expert panel proceedings and recommendations. J Natl Cancer Inst. 2017;109(4):djw253. doi:10.1093/jnci/djw253
12. Christensen VL, Rustoen T, Cooper BA, et al. Distinct symptom experiences in subgroups of patients with COPD. Int J Chron Obstruct Pulmon Dis. 2016;11:1801–1809. doi:10.2147/COPD.S105299
13. L CV, Rustoen T, Thoresen M, et al. Stability of distinct symptom experiences in patients with chronic obstructive pulmonary disease (COPD). Respir Med. 2022;201:106944. doi:10.1016/j.rmed.2022.106944
14. Fang J, Wong CL, Liu CQ, et al. Identifying central symptom clusters and correlates in children with acute leukemia undergoing chemotherapy: a network analysis. Front Oncol. 2023;13:1236129. doi:10.3389/fonc.2023.1236129
15. Yang Z, Zhu Z, Wen H, et al. Identifying subtypes of HIV/AIDS-related symptoms in China using latent profile analysis and symptom networks. Sci Rep. 2022;12:13271. doi:10.1038/s41598-022-17720-z
16. Jing F, Zhu Z, Qiu J, et al. Contemporaneous symptom networks and correlates during endocrine therapy among breast cancer patients: a network analysis. Front Oncol. 2023;13:1081786. doi:10.3389/fonc.2023.1081786
17. Teng L, Zhou Z, Yang Y, et al. Identifying central symptom clusters and correlates in patients with lung cancer post-chemotherapy: a network analysis. Asia Pac J Oncol Nurs. 2024;11:100383. doi:10.1016/j.apjon.2024.100383
18. Jablonski A, Gift A, Cook KE. Symptom assessment of patients with chronic obstructive pulmonary disease. West J Nurs Res. 2007;29:845–863. doi:10.1177/0193945906296547
19. Portenoy RK, Thaler HT, Kornblith AB, et al. The memorial symptom assessment scale: an instrument for the evaluation of symptom prevalence, characteristics and distress. Eur J Cancer. 1994;30A:1326–1336. doi:10.1016/0959-8049(94)90182-1
20. Cheng KK, Wong EM, Ling WM, et al. Measuring the symptom experience of Chinese cancer patients: a validation of the Chinese version of the memorial symptom assessment scale. J Pain Symptom Manage. 2009;37:44–57. doi:10.1016/j.jpainsymman.2007.12.019
21. Kim SY. Determining the number of latent classes in single- and multi-phase growth mixture models. Struct Equation Model. 2014;21:263–279. doi:10.1080/10705511.2014.882690
22. Tein JY, Coxe S, Cham H. Statistical power to detect the correct number of classes in latent profile analysis. Struct Equation Model. 2013;20:640–657. doi:10.1080/10705511.2013.824781
23. Shen A, Qiang W, Zhao H, et al. Contemporaneous symptom networks of breast cancer-related upper limb lymphedema: a network analysis. Ann Surg Oncol. 2024;31:6611–6622. doi:10.1245/s10434-024-15676-0
24. Harris CS, Dodd M, Kober KM, et al. Advances in conceptual and methodological issues in symptom cluster research: a 20- year perspective. ANS Adv Nurs Sci. 2022;45:309–322. doi:10.1097/ANS.0000000000000423
25. Hevey D. Network analysis: a brief overview and tutorial. Health Psychol Behav Med. 2018;6:301–328. doi:10.1080/21642850.2018.1521283
26. Hallquist MN, Wright AGC, Molenaar PCM. Problems with centrality measures in psychopathology symptom networks: why network psychometrics cannot escape psychometric theory. Multivar Behav Res. 2021;56:199–223. doi:10.1080/00273171.2019.1640103
27. Epskamp S, Borsboom D, Fried EI. Estimating psychological networks and their accuracy: a tutorial paper. Behav Res Methods. 2018;50:195–212. doi:10.3758/s13428-017-0862-1
28. Armour C, Fried EI, Deserno MK, et al. A network analysis of DSM-5 posttraumatic stress disorder symptoms and correlates in U.S. military veterans. J Anxiety Disord. 2017;45:49–59. doi:10.1016/j.janxdis.2016.11.008
29. Robinaugh DJ, Millner AJ, McNally RJ. Identifying highly influential nodes in the complicated grief network. J Abnorm Psychol. 2016;125:747–757. doi:10.1037/abn0000181
30. Melhem O, Savage E, Al HN, et al. Symptom burden and functional performance in patients with chronic obstructive pulmonary disease. Appl Nurs Res. 2021;62:151510. doi:10.1016/j.apnr.2021.151510
31. Fei F, R JS, Zhang X, et al. Symptom clusters, associated factors and health-related quality of life in patients with chronic obstructive pulmonary disease: a structural equation modelling analysis. J Clin Nurs. 2023;32:298–310. doi:10.1111/jocn.16234
32. Park SK, Larson JL. Symptom cluster, healthcare use and mortality in patients with severe chronic obstructive pulmonary disease. J Clin Nurs. 2014;23:2658–2671. doi:10.1111/jocn.12526
33. Park SK, Meldrum CA, Larson JL. Subgroup analysis of symptoms and their effect on functioning, exercise capacity, and physical activity in patients with severe chronic obstructive pulmonary disease. Heart Lung. 2013;42:465–472. doi:10.1016/j.hrtlng.2013.08.008
34. Houben-Wilke S, Deng Q, Janssen D, et al. Symptom burden and its associations with clinical characteristics in patients with COPD: a clustering approach. ERJ Open Res. 2024;10.
35. Nguyen HQ, Herting JR, Pike KC, et al. Symptom profiles and inflammatory markers in moderate to severe COPD. BMC Pulm Med. 2016;16:173. doi:10.1186/s12890-016-0330-1
36. Rha SY, Lee J. Stable symptom clusters and evolving symptom networks in relation to chemotherapy cycles. J Pain Symptom Manage. 2021;61:544–554. doi:10.1016/j.jpainsymman.2020.08.008
37. Yohannes AM, Murri MB, Hanania NA, et al. Depressive and anxiety symptoms in patients with COPD: a network analysis. Respir Med. 2022;198:106865. doi:10.1016/j.rmed.2022.106865
38. Wu D, Zhao X, Huang D, et al. Outcomes associated with comorbid anxiety and depression among patients with stable COPD: a patient registry study in China. J Affect Disord. 2022;313:77–83. doi:10.1016/j.jad.2022.06.059
39. Volpato E, Toniolo S, Pagnini F, et al. The relationship between anxiety, depression and treatment adherence in chronic obstructive pulmonary disease: a systematic review. Int J Chron Obstruct Pulmon Dis. 2021;16:2001–2021. doi:10.2147/COPD.S313841
40. Christenson SA, Smith BM, Bafadhel M, et al. Chronic obstructive pulmonary disease. Lancet. 2022;399(10342):2227–2242. doi:10.1016/S0140-6736(22)00470-6
41. Long J, Ouyang Y, Duan H, et al. Multiple factor analysis of depression and/or anxiety in patients with acute exacerbation chronic obstructive pulmonary disease. Int J Chron Obstruct Pulmon Dis. 2020;15:1449–1464. doi:10.2147/COPD.S245842
42. Kadier K, Dilixiati D, Ainiwaer A, et al. Analysis of the relationship between sleep-related disorder and systemic immune-inflammation index in the US population. BMC Psychiatry. 2023;23:773. doi:10.1186/s12888-023-05286-7
43. Meng F, Yan X, Qi J, et al. Association of neutrophil to lymphocyte ratio, platelet to lymphocyte ratio, and monocyte to lymphocyte ratio with depression: a cross-sectional analysis of the NHANES data. J Affect Disord. 2022;315:168–173. doi:10.1016/j.jad.2022.08.004
44. Willgoss TG, Yohannes AM. Anxiety disorders in patients with COPD: a systematic review. Respir Care. 2013;58:858–866. doi:10.4187/respcare.01862
 © 2025 The Author(s). This work is published and licensed by Dove Medical Press Limited. The
full terms of this license are available at https://www.dovepress.com/terms
and incorporate the Creative Commons Attribution
- Non Commercial (unported, 4.0) License.
By accessing the work you hereby accept the Terms. Non-commercial uses of the work are permitted
without any further permission from Dove Medical Press Limited, provided the work is properly
attributed. For permission for commercial use of this work, please see paragraphs 4.2 and 5 of our Terms.
© 2025 The Author(s). This work is published and licensed by Dove Medical Press Limited. The
full terms of this license are available at https://www.dovepress.com/terms
and incorporate the Creative Commons Attribution
- Non Commercial (unported, 4.0) License.
By accessing the work you hereby accept the Terms. Non-commercial uses of the work are permitted
without any further permission from Dove Medical Press Limited, provided the work is properly
attributed. For permission for commercial use of this work, please see paragraphs 4.2 and 5 of our Terms.