Back to Journals » OncoTargets and Therapy » Volume 11
Identifying miRNA and gene modules of colon cancer associated with pathological stage by weighted gene co-expression network analysis
Authors Zhou X, Huang X, Liang S, Tang S ![]() , Wu S, Huang T
, Wu S, Huang T ![]() , Mo Z, Wang Q
, Mo Z, Wang Q
Received 27 January 2018
Accepted for publication 23 March 2018
Published 15 May 2018 Volume 2018:11 Pages 2815—2830
DOI https://doi.org/10.2147/OTT.S163891
Checked for plagiarism Yes
Review by Single anonymous peer review
Peer reviewer comments 2
Editor who approved publication: Dr Carlos E Vigil
Xian-guo Zhou,1,2,* Xiao-liang Huang,1,2,* Si-yuan Liang,1–3 Shao-mei Tang,1,2 Si-kao Wu,1,2 Tong-tong Huang,1,2 Zeng-nan Mo,1,2,4 Qiu-yan Wang1,2,5
1Center for Genomic and Personalized Medicine, Guangxi Medical University, Nanning, Guangxi Zhuang Autonomous Region, People’s Republic of China; 2Guangxi Key Laboratory for Genomic and Personalized Medicine, Guangxi Collaborative Innovation Center for Genomic and Personalized Medicine, Nanning, Guangxi Zhuang Autonomous Region, People’s Republic of China; 3Department of Colorectal Surgery, First Affiliated Hospital of Guangxi Medical University, Nanning, Guangxi Zhuang Autonomous Region, People’s Republic of China; 4Department of Urology and Nephrology, The First Affiliated Hospital of Guangxi, Medical University, Nanning, Guangxi Zhuang Autonomous Region, People’s Republic of China; 5Guangxi Colleges and Universities Key Laboratory of Biological Molecular Medicine Research, Guangxi Medical University, Nanning, Guangxi Zhuang Autonomous Region, People’s Republic of China
*These authors contributed equally to this work
Introduction: Colorectal cancer (CRC) is the fourth most common cause of cancer-related mortality worldwide. The tumor, node, metastasis (TNM) stage remains the standard for CRC prognostication. Identification of meaningful microRNA (miRNA) and gene modules or representative biomarkers related to the pathological stage of colon cancer helps to predict prognosis and reveal the mechanisms behind cancer progression.
Materials and methods: We applied a systems biology approach by combining differential expression analysis and weighted gene co-expression network analysis (WGCNA) to detect the pathological stage-related miRNA and gene modules and construct a miRNA–gene network. The Cancer Genome Atlas (TCGA) colon adenocarcinoma (CAC) RNA-sequencing data and miRNA-sequencing data were subjected to WGCNA analysis, and the GSE29623, GSE35602 and GSE39396 were utilized to validate and characterize the results of WGCNA.
Results: Two gene modules (Gmagenta and Ggreen) and one miRNA module were associated with the pathological stage. Six hub genes (COL1A2, THBS2, BGN, COL1A1, TAGLN and DACT3) were related to prognosis and validated to be associated with the pathological stage. Five hub miRNAs were identified to be related to prognosis (hsa-miR-125b-5p, hsa-miR-145-5p, hsa-let-7c-5p, hsa-miR-218-5p and hsa-miR-125b-2-3p). A total of 18 hub genes and seven hub miRNAs were predominantly expressed in tumor stroma. Proteoglycans in cancer, focal adhesion, extracellular matrix (ECM)–receptor interaction and so on were common pathways of the three modules. Hsa-let-7c-5p was located at the core of miRNA–gene network.
Conclusion: These findings help to advance the understanding of tumor stroma in the progression of CAC and provide prognostic biomarkers as well as therapeutic targets.
Keywords: colon adenocarcinoma, weighted gene co-expression network analysis, differentially expressed genes, differentially expressed miRNA, tumor stroma
Introduction
Colorectal cancer (CRC) ranks the third most frequently diagnosed cancer and the fourth leading cause of cancer-related deaths in the world. It is estimated that more than 2.2 million new cases and 1.1 million deaths will occur by 2030.1 Colon adenocarcinoma (CAC) is the main histological subtype of CRC and accounts for more than 90% colon cancer.2 Typically, CAC develops through a multistage process, including the transformation of normal mucosa to adenoma and then to carcinoma.3 With the progression of CAC, invasion of tumor into the intestinal wall, involvement of regional lymph nodes and distant metastasis may be present. The tumor, node, metastasis (TNM) staging system provides a method to assess the status of cancer and predict prognosis, which is widely used in clinical practice.4 Patients with CAC are grouped into different stage groups according to the TNM status, and patients in the same stage group have a similar prognosis. In most of the cases, patients with a higher pathological stage tend to have a worse prognosis. Thus, it is of great value to identify biomarkers associated with the TNM stage to reveal the molecular mechanisms related to the development of CAC and represent potential prognostic biomarkers as well as therapeutic targets for CAC.
MicroRNAs (miRNAs) are a class of small, noncoding regulatory RNAs. By binding to the target mRNAs, miRNAs repress the expression of target mRNAs. More importantly, one miRNA may target hundreds of mRNAs; thus, miRNAs–mRNAs constitute networks to participate in many cellular pathways, such as proliferation, apoptosis and differentiation.5 A significant number of studies search for deregulated miRNA–mRNA networks in cancers.6–8 For instance, Jacobsen et al8 inferred recurrent cancer-associated miRNA–target in diverse cancer types according to negative relationships of expression, sequence-based predictions and miRNA perturbation experiments. However, the utilization of some important clinical parameters such as the TNM stage and survival is limited, which may weaken the ability to discover molecular mechanisms and biomarkers associated with cancer progress and prognosis. In addition, although the miRNA–target relationships have been deeply studied, the relationships among genes or miRNAs are not well considered, since no genes or miRNAs act alone.
With the recent advancements in bioinformatics, new and effective methods have been invented to achieve a more comprehensive identification of new biomarkers. Based on the theory that genes with closely functional linkages or involved in similar pathways may have similar expression profiles,9,10 the weighted gene co-expression network analysis (WGCNA) approach provides a systems biology strategy to explore the system-level functionality of a transcriptome.11 WGCNA constructs a gene network considering the correlations among genes across samples. Genes with highly co-expressed relationships are grouped into the same module; thus, the genes in the same module may have similar functions or possibly share common biological regulatory roles.12 The most central genes within a module are identified as hub genes, suggesting their important roles in the module. More importantly, WGCNA analyzes the relationships between modules and sample traits, which provides an effective way to explore the mechanisms behind certain traits.11 WGCNA has been widely applied to identify gene modules associated with clinical parameters in many cancers.13,14 As for colon cancer, WGCNA has been successfully applied to detect gene modules associated with recurrence of colon cancer.15,16 Liu et al15 detected a gene module associated with the recurrence-free survival. In addition, Zhai et al16 also detected a gene module associated with recurrence of colon cancer by using microarray dataset. However, there is no study applying WGCNA to systematically identify gene co-expression networks and miRNA co-expression networks associated with the pathological stage in CAC. To fulfill this gap, we conducted a differential expression analysis followed by WGCNA to detect the miRNA and gene modules associated with the TNM stage in CAC and predicted the targeted relationships between genes and miRNAs to depict a miRNA–gene network in the progress of CAC.
Materials and methods
Data collection and preprocessing
The level three RNA-sequencing data (RNA-Seq-HTSeq) and level three miRNA isoform expression quantification data (miRNA-Seq-BCGSC miRNA Profiling) of CAC patients were downloaded from The Cancer Genome Atlas (TCGA; http://cancergenome.nih.gov/) on October 5, 2017. The sequencing data were generated by the Illumina HiSeq platform. For miRNA isoform data, the expression of a mature miRNA was obtained by adding all the isoform expression of it. The genes or miRNAs estimated with counts in less than 20% of cases were removed. The outlier samples were detected by cluster diagram and then removed. The fragments per kilobase of exon per million fragments mapped (FPKM) and read per million (RPM) were used to represent the expression of genes and miRNAs, respectively. Clinical information of CAC patients was downloaded and extracted at the same time. Microarray-based mRNA and miRNA expression data were obtained from the Gene Expression Omnibus (GEO; http://www.ncbi.nlm.nih.gov/geo/) based on the following inclusion criteria: 1) the expression data were generated from CRC samples; 2) the clinicopathological information, especially the American Joint Committee on Cancer TNM stage, was included and 3) the sample size was >40. The microarray dataset GSE29623, which contained both mRNA and miRNA expression data, was used to estimate module preservation.17 The datasets GSE28364 (miRNA expression data) and GSE39582 (gene expression data) served as an independent cohort to validate module–clinical trait relationships.18,19 The normalized expression matrix files and platform annotations were downloaded. If multiple probes were applied to detect one miRNA or mRNA, the average value of the probes was used. All the miRNAs in the present study were renamed according to miRBase database v21 (www.mirbase.org).20 Data processing was performed using the R programming language (v3.1.0) and complied with the human subject protection and data access policies of GEO and TCGA.
Identification of differentially expressed genes (DEGs) and miRNAs
The R package, edgeR, was used to detect the DEGs and differentially expressed miRNAs (DEMs) between cancer and normal samples.21 The thresholds for both DEGs and DEMs were set at the values of |log2(fold change [FC])| >1 and false discovery rate (FDR) <0.05.
Weighted gene co-expression network construction and module detection
The gene co-expression networks and miRNA co-expression networks were constructed by the WGCNA package based on DEGs and DEMs.22 The processes for constructing gene co-expression networks and miRNA co-expression networks were similar except for some parameters. So, we took the construction of weighted gene co-expression networks as an example. First, a matrix of similarity was constructed by calculating the correlations of all pairs of genes. Second, an appropriate soft-thresholding power β was selected by using the integrated function (pickSoftThreshold) in the WGCNA package. With this soft-thresholding power, the co-expression similarity was raised to achieve scale-free topology. Third, the adjacency was transformed into a topological overlap matrix (TOM) by using TOM similarity. Then, the corresponding dissimilarity (dissTOM) was also calculated. Fourth, co-expression gene modules were identified by using dynamic tree cut with the following major parameters: maxBlockSize of 20000, minModuleSize of 30 and deepSplit of 2. As for the miRNA network, the minModuleSize was set at 15 due to the small number of DEMs. In order to distinguish miRNA modules from gene modules, we named miRNA modules as “M+color” and gene modules as “G+color” in the full text. The module eigengene (ME), which was the first principal component (PC) of each module’s gene expression matrix, was obtained by the WGCNA to represent the expression profiles of module genes.23 Some highly similar modules with the height of ME in the clustering lower than 0.25 were merged together. A clustering dendrogram was used to display the results of dynamic tree cut and merge.
Module preservation analysis
To test the stability of modules, we conducted the module preservation analysis. The theories for preservation analysis are, briefly, to test whether a reference network can be constructed in another test network.24 The datasets GSE29621 and GSE29622 were used to test the preservation of co-expressed gene modules and miRNA modules, respectively. An integrated function of WGCNA (module preservation) was used to calculate the preservation (nPermutations=100) and the Z summary score (Z score). A Z score of lower than 2 indicates that the modules have no preservation, that of 2–10 indicates low to moderate preservation and that of >10 indicates strong preservation. It must be noted that in both gene and miRNA modules, the gray module contains genes or miRNAs that do not belong to any of the modules and the gold module is generated by module preservation function for statistical aims. Thus, the two modules were not shown in results of preservation analysis.
Relating modules to clinical parameters and identifying hub genes
One of the advantages of WGCNA is that the correlation between modules and clinical parameters can be analyzed. Given that the ME can summarize the gene expression profiles, we calculated the correlation between MEs and external clinical parameters. This process was referred as the module–trait relationship (MTR) analysis.11 To validate the MTRs of gene modules, we utilized the microarray dataset GSE39582, which contained the gene expression data from 566 cases of colon cancers. We first categorized genes into the corresponding module referring to the modules constructed. Then, the ME of each module was calculated and related to clinical parameters. The MTRs of miRNA modules were validated by using GSE28364 in the same way. Furthermore, a q-value was introduced to control the false-positive rate and a q-value of ≤5% was considered to be statistically significant.25 Hub genes were identified by calculating the gene significance (GS) and module membership (MM). The GS of a gene was referred to as (the absolute value of) the correlation between the gene and a certain interested clinical parameter, and the MM of a gene was referred to as the correlation between the ME and the gene expression profile. Genes with a high MM and GS were defined as hub genes in a module. This method was also applicable to identify hub miRNAs.
Pathway enrichment analysis of genes and miRNAs
Kyoto Encyclopedia of Genes and Genomes (KEGG) pathway enrichment analysis for genes was conducted based on the Database for Annotation, Visualization and Integrated Discovery (DAVID; https://david.ncifcrf.gov/).26 The miRNA pathway analysis was conducted using mirPath v.3 (http://snf-515788.vm.okeanos.grnet.gr/), which was combined with miRNA target predication based on DIANA-microT-CDS algorithm and information of experimentally validated miRNA interactions.27 A P-value of ≤5% was considered to be statistically significant.
Characterization and validation of hub genes and survival analysis
The dataset GSE29621 served as an independent cohort to validate the association between hub genes and the pathological stage. The microarray dataset GSE35602, which contained miRNA and gene expression profiles from epithelium and stroma of CRC tissues dissected by a laser microdissection technology, was used to evaluate the expression levels of hub genes and hub miRNAs in the epithelium and stroma.28 Another microarray dataset, GSE39396, was used to assess the gene expression levels in four cell populations from CRC samples (Epcam+: epithelial [Ep] cancer cells; CD45+: leukocytes; CD31+: endothelial cells; FAP+: cancer-associated fibroblasts [CAFs]).29 The one-way analysis of variance (ANOVA) test was used to compare the mean values of multiple groups with equal variances, and the Welch’s test was used when the variances were unequal. Moreover, we applied two web servers Gene Expression Profiling Interactive Analysis (http://gepia.cancer-pku.cn) and OncoLnc (http://www.oncolnc.org) to evaluate the prognostic value of hub genes and hub miRNA, respectively.30,31
Construction of the miRNA–gene interaction network
The miRNA–gene interaction network was constructed based on the miRNAs and genes involved in the same pathway. Two web servers, microT-CDS (v5.0) and TargetScan, were applied to predicate the interaction between miRNAs and genes.32 Only the interactions with a score of microT-CDS >0.6 and a context++ score percentile of TargetScan >70 were used to construct the interaction network. Furthermore, we also used the STRING to analyze the interaction between proteins in the network.33 Finally, the network graph was visualized and analyzed using Cytoscape v3.4.0.34 The core region in the network, which possessed a dense connection, was detected by Molecular Complex Detection (MCODE), a Cytoscape plugin.35
Results
Data preprocessing
A workflow of this study is shown in Figure 1. The level three RNA-sequencing data of CAC contained 477 CAC samples and 41 normal colon samples. After removing outlier samples and samples without clinical information, 450 CAC samples and 41 normal colon samples remained for WGCNA analysis. As for miRNA-sequencing data, 455 CAC samples and eight normal colon samples were downloaded. After outlier samples and samples without clinical information were eliminated, 442 CAC samples and eight normal colon samples were subjected to WGCNA analysis. As for the GEO dataset GSE29623, the subdatasets GSE29621 (mRNA data) and GSE29622 (miRNA data) were derived from the same 65 CAC patients. All the 65 samples remained after the same data processing methods were performed. The original clinical information of CAC patients in TCGA and GSE29623 is listed in Tables S1 and S2, respectively.
 | Figure 1 Flowchart of the study. |
DEGs and miRNAs
The RNA-sequencing data and miRNA-sequencing data from TCGA were subjected to differential expression analysis. Based on the threshold of |log2(FC)| >1 and FDR <0.05, 6486 DEGs and 544 DEMs were identified. Among the 6486 DEGs, 3678 DEGs were significantly upregulated in cancer samples, while 2808 DEGs were significantly downregulated in cancer samples. Furthermore, among the 544 DEMs, 194 DEMs were significantly downregulated in cancer samples and 350 DEMs were significantly upregulated in cancer samples. The volcano plots of mRNAs and miRNAs are displayed in Figure S1. Table S3 lists the top 20 DEGs and DEMs ranked by FDR.
Identification of co-expression networks and module preservation analysis
The 6486 DEGs and 450 CAC samples were used to construct co-expressed gene networks. When the soft thresholding was set at five, the scale-free topology fit index reached 0.90 (Figure S2). In all, 21 co-expressed gene modules were identified by the dynamic tree cut method, and each of the modules was marked by a color. The Gcyan and Gred, as well as the Gpink and Gpurple, were respectively merged together due to the similarity between them (the height of ME in the clustering was <0.25). Finally, 19 co-expressed gene modules were detected. The Glightyellow and Groyalblue were the smallest modules with 38 genes. The Ggrey, which contained genes not attributed to any modules, was the largest module with 1432 genes. For miRNA co-expression network, 544 DEMs and 442 CAC samples were subjected to WGCNA analysis. When the soft thresholding was set at five, the scale-free topology fit index reached 0.90 (Figure S3). Eight co-expression miRNA modules were detected, and no module was highly similar that needed to be merged. The Mturquoise contained the most miRNA with a number of 136, while the Mblack contained the least miRNA with a number of 36. The clustering dendrograms of genes and miRNAs are shown in Figure 2. All the modules and their contents as well as the GS and MM of each gene and each miRNA are listed in the Supplement material Table S4.
 | Figure 2 Clustering dendrograms. |
To test the stability of gene modules, we used the dataset GSE29621 as an independent validation cohort. Six gene modules (Gblue, Gbrown, Gblack, Gmagenta, Ggreen and Gturquoise) were found to be strongly conservative with a Z summary score (Z score) >10. The Gblue was the most stable module with a Z score of 26 and a median rank statistic of 12. However, the preservation of the remaining modules was not strong enough since the Z scores were <10. The preservation of miRNA modules was tested by using the dataset GSE29622. However, none of the module was found to have strong preservation. The Mblack was the most stable module with a Z score of 3.4 and a median rank statistic of 3, which reflected that the Mblack had low to moderate stability. The reason for this phenomenon might be that the size of miRNA module was generally small (the maximum size was 136), which reduced the stability of modules (Figure S4).
Module–clinical trait relationships and validation
Identifying genes associated with a certain clinical trait is of great value to explore the molecular mechanisms behind the trait. In the present study, the clinical parameters of CAC patients, including age at diagnosis, pathological stage, pathological T (pT) category, pathological N (pN) category, M category, lymphatic invasion, venous invasion, perineural invasion, person neoplasm cancer status, vital status and microsatellite instability were extracted for analysis. In addition, some potential prognostic biomarkers of CRC, such as IGFBP2, PTGS2 and MIP3, were involved in the MTR analysis.36 Since six gene modules with strong preservation were identified in the module preservation analysis, we mainly focused on the module–trait relationships of them. As shown in Figure 3, we found that all the six modules were associated with multiple clinical traits. The Gmagenta and Ggreen were both significantly associated with the pathological stage (r=0.097, q=0.049 for Gmagenta; r=0.11, q=0.025 for Ggreen), pT category (r=0.17, q=1.6×10⁻³ for Gmagenta; r=0.10, q=0.038 for Ggreen), pN category (r=0.11, q=0.026 for Gmagenta; r=0.14, q=5.9×10⁻³ for Ggreen), lymphatic invasion (r=0.11, q=0.025 for Gmagenta; r=0.11, q=0.026 for Ggreen), venous invasion (r=0.11, q=0.034 for Gmagenta; r=0.12, q=0.024 for Ggreen), perineural invasion (r=0.16, q=1.8×10⁻³ for Gmagenta; r=0.13, q=0.011 for Ggreen), person neoplasm cancer status (r=−0.15, q=5.2×10⁻³ for Gmagenta; r=−0.17, q=1.5×10⁻³ for Ggreen) and microsatellite instability (microsatellite stability was coded as 1 and microsatellite instability was coded as 2; r=−0.10, q=0.043 for Gmagenta; r=−0.15, q=5.4×10⁻³ for Ggreen). Besides, the Gmagenta module was significantly associated with the expression of IGFBP2 (r=−0.14, q=8.1×10⁻³), PTGS2 (r=0.29, q=8.6×10⁻⁹) and IMP3 (r=−0.24, q=1.6×10⁻⁶). Microsatellite stability, low expression of IGFBP2 and high expression of PTGS2 were known factors associated with advanced stage and poor prognosis of CAC,37,38 which laterally indicated that the Gmagenta was related to tumor progression. Increased expression of IMP3 was previously reported to be related with a higher clinical stage,39 however, in the TCGA data, we found that the IMP3 levels were negatively related with stage. To further validate the module–clinical trait relationships, we constructed all the gene modules in GSE39582 referring to the existing modules and performed the MTR analysis. As shown in Figure S5, the Gmagenta and Ggreen were significantly associated with the TNM stage (r=0.13, q=0.016 for Gmagenta; r=0.15, q=8.1×10⁻³ for Ggreen). Thus, the Gmagenta and Ggreen modules were selected as key modules for the following study.
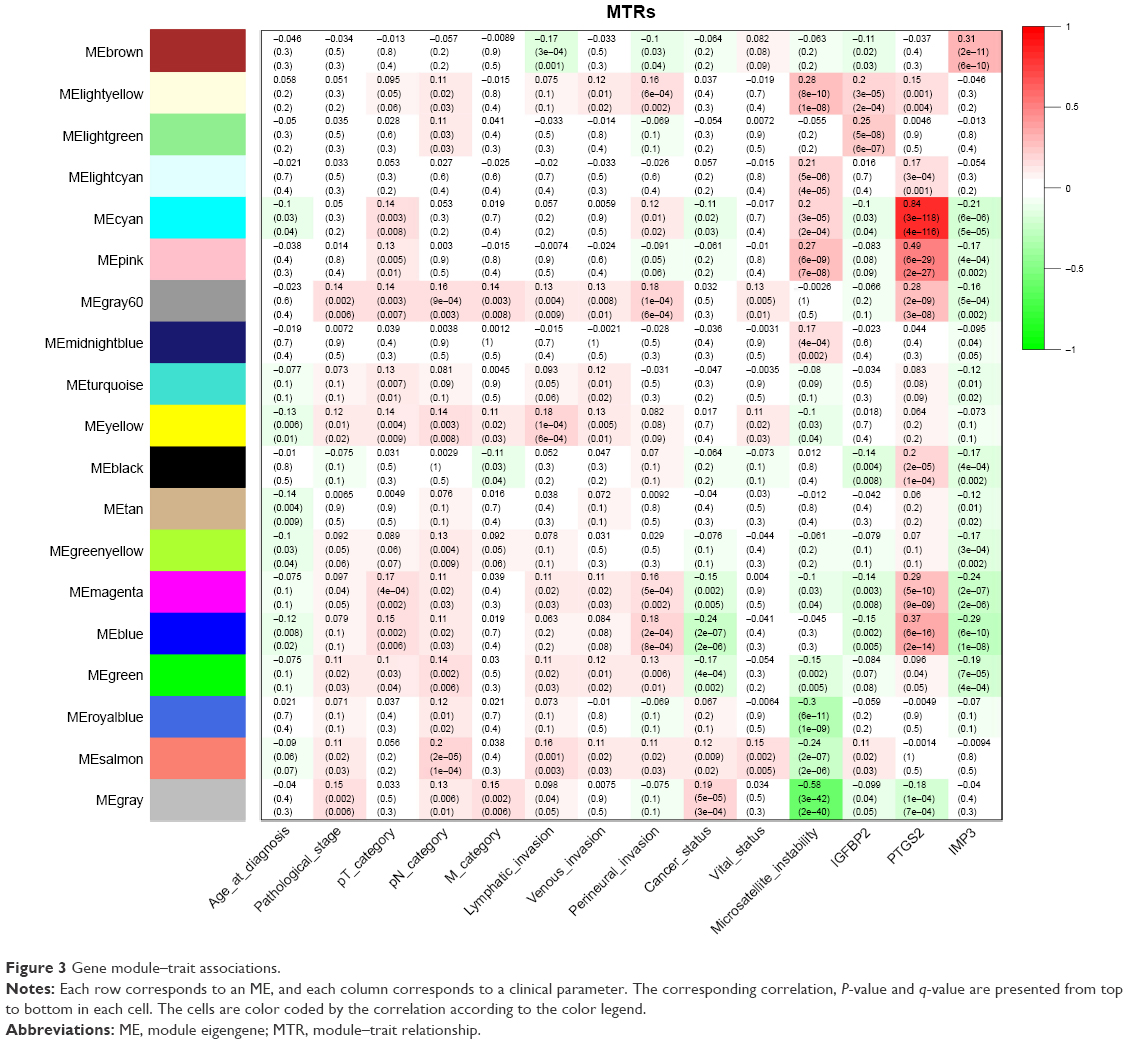 | Figure 3 Gene module–trait associations. |
As for the correlation between miRNA modules and clinical traits, the Mblack, which possessed the strongest preservation among the miRNA modules, was significantly associated with the pathological stage (r=0.19, q=3.0×10⁻⁴), pT category (r=0.11, q=0.033), pN category (r=0.14, q=8.1×10⁻³), M category (r=0.18, q=3.2×10⁻⁴), lymphatic invasion (r=0.17, q=8.8×10⁻⁴), venous invasion (r=0.14, q=7.5×10⁻³), perineural invasion (r=0.13, q=0.013), microsatellite instability (r=−0.26, q=1.6×10⁻⁷), IGFBP2 (r=−0.16, q=2.0×10⁻³) and IMP3 (r=−0.25, q=8.2×10⁻⁷; Figure 4). The dataset GSE28364 was utilized to validate module–clinical trait relationships. We found that the Mblack was positively correlated with the pathological stage, but did not reach the significant level (r=0.016, q=0.89; Figure S6). Table S5 lists the genes in the magenta and green modules and the miRNAs in the black module.
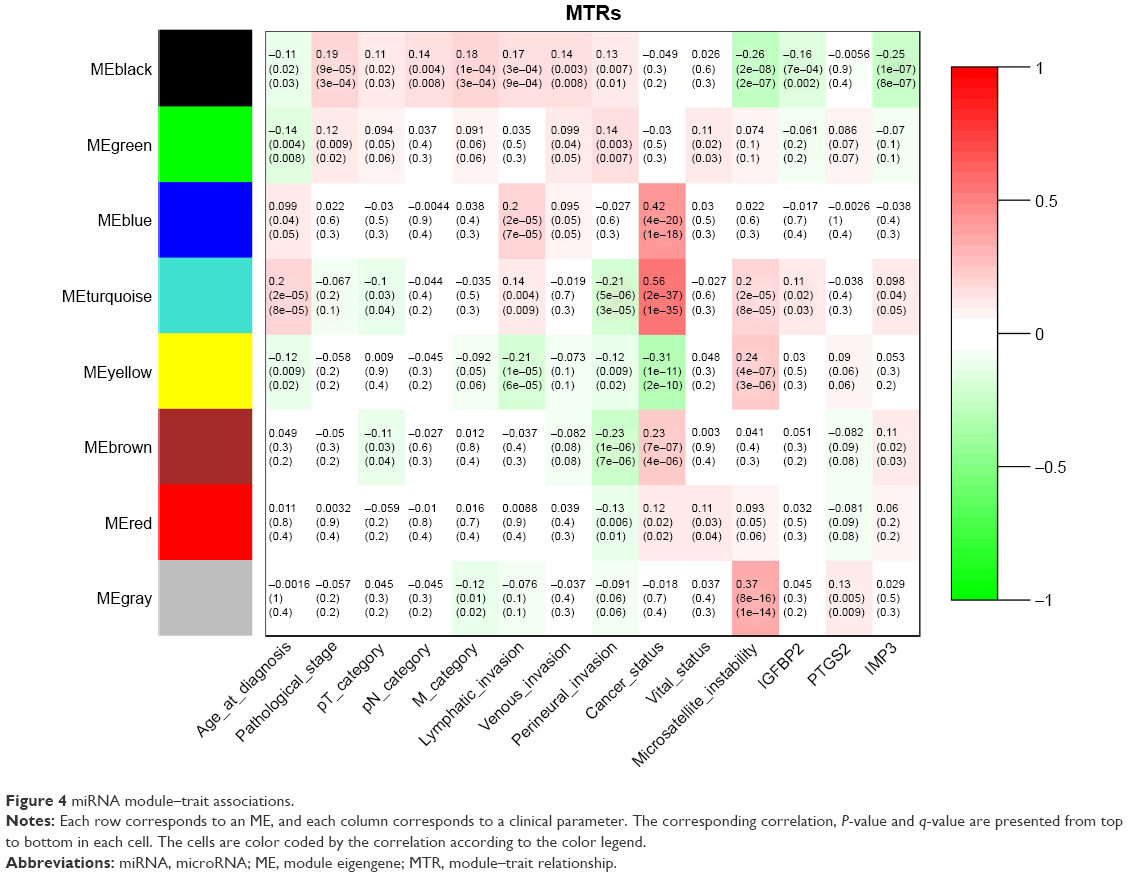 | Figure 4 miRNA module–trait associations. |
Pathway enrichment analysis of genes and miRNAs
To explore the biological functions of the Gmagenta and Ggreen, we performed pathway analysis to the genes in the Gmagenta and Ggreen, respectively. For the Gmagenta, the top three significantly enriched pathways were extracellular matrix (ECM)–receptor interaction (P=1.41×10⁻¹¹), focal adhesion (P=3.46×10⁻⁸) and protein digestion and absorption (P=9.04×10⁻⁸). For the Ggreen, the top three significantly enriched pathways were vascular smooth muscle contraction (P=1.02×10⁻⁷), calcium signaling pathway (P=1.09×10⁻⁵) and dilated cardiomyopathy (P=1.22×10⁻⁵). The miRNAs in the Mblack were also subjected to pathway analysis, and the top three significantly enriched pathways were proteoglycans in cancer (P=2.37×10⁻¹⁰), axon guidance (P=6.84×10⁻⁷) and mucin type O-glycan biosynthesis (P=1.27×10⁻⁶). More importantly, seven pathways, including proteoglycans in cancer, focal adhesion, ECM–receptor interaction, PI3K–Akt signaling pathway, adrenergic signaling in cardiomyocytes, arrhythmogenic right ventricular cardiomyopathy (ARVC) and platelet activation, were common pathways of miRNAs and genes. Table 1 lists the top three significant pathways of Gmagenta, Ggreen and Mblack as well as the common pathways shared by genes and miRNAs. Tables S6 and S7 list all the significant pathways of genes and miRNAs.
 | Table 1 Pathway enrichment analysis of genes and miRNAsa |
Identification of hub genes and miRNAs
Hub genes or miRNAs in a module have relative high MM, which may be functionally significant. Since the pathological stage was a key parameter to predict prognosis and the three modules (Gmagenta, Ggreen and Mblack) were associated with the pathological stage, we calculated the GS based on the correlation between gene or miRNA and the pathological stage. The top ten genes or miRNAs with the highest MM were identified as hub genes or miRNAs. The hub genes and hub miRNAs as well as the corresponding MM and GS are listed in Table 2. In the Gmagenta, the SPARC was the most central gene with an MM of 0.95 and a GS of 0.12. In the Ggreen, the TNS1 had the highest MM value (MM=0.96). As for the Mblack, the hsa-miR-125b-5p was the top hub miRNA with the highest MM of 0.90 and a GS of 0.11.
 | Table 2 Hub genes and hub miRNAs |
Validation of hub genes
The association between hub genes and the pathological stage was validated by using the dataset GSE29621. Three hub genes in the Ggreen module were successfully validated (TAGLN: P=0.048, DACT3: P=0.011 and GNAO1: P=0.049). Furthermore, seven of the ten hub genes in the Gmagenta were also found to be significantly differentially expressed across different stages, which indicated that they were consistently associated with the pathological stage even in an independent dataset (SPARC: P=0.015, COL1A2: P=0.034, COL5A2: P=0.014, COL1A1: P=0.047, COL5A1: P=0.039, BGN: P=0.008 and THBS2: P=0.016) (Figure 5). Considering the Mblack was not successfully validated, we only analyzed the association between hub miRNAs’ expression and stage based on TCGA data. As shown in Figure S7, the hsa-miR-199a-5p, hsa-miR-218-5p, hsa-miR-133a-3p and hsa-miR-1-3p were significantly related with the pathological stage (P=0.026, P=0.017, P=0.045 and P=0.011, respectively). The hsa-miR-125b-5p, hsa-miR-100-5p, hsa-miR-199a-5p, hsa-miR-218-5p and hsa-miR-125b-2-3p were significantly associated with pT classification (P=0.018, P=0.037, P=0.013, P=0.001 and P=0.039, respectively).
 | Figure 5 Pathological stage-associated hub genes validated by GSE29621. |
Correlation between hub miRNA expression and serum carcinoembryonic antigen (CEA) and CA19-9 levels
The CEA is a widely recognized prognostic biomarker in CRC. Increased serum CEA levels are correlated with an advanced stage. In addition, there are numerous reports on the correlation between serum cancer antigen 19-9 (CA19-9) levels and the stage of CRC. We analyzed the correlation between hub miRNA expression and serum CEA and CA19-9 levels using GSE28364. We found that all the hub miRNAs were positively related with CEA and CA19-9 levels, but did not reach the significant level (all r>0, all P>0.05; Figure S8). It should be pointed out that we found that the CEA and CA19-9 levels were not significantly correlated with the TNM stage in the GSE28364 dataset (CEA: r=0.292, P=0.84; CA19-9: r=0.32, P=0.056). We also observed that nine of the ten hub miRNAs showed a significant correlation (all P<0.05), which validated the co-expression relationships of hub miRNAs.
Hub genes and hub miRNAs are predominantly expressed in tumor stroma
We observed that four collagen coding genes (COL1A2, COL1A1, COL5A2 and COL5A1), which are known to be expressed in stroma, were in the list of hub genes. In addition, the proteoglycans in the cancer pathway was the most significant pathway of miRNAs, and proteoglycans are a major component of stroma. We wondered whether these two gene modules and one miRNA module reflected the expression pattern of cancer cells or stromal (Str) cells since the TCGA data were derived from macrodissected cancer samples, which contained both cancer cells and Str cells. To address this issue, we used the microarray dataset, GSE35602, which contained miRNA and gene expression profiles of epithelium and stroma of CRC tissues dissected by a laser microdissection technology. We compared the expression levels of hub genes and hub miRNAs in cancer epithelium and stroma. As demonstrated in Figure 6, we found that 18 of the 20 hub genes, except DACT3 and GNAO1, were predominantly expressed in tumor stroma (all P-values <0.001). Furthermore, seven of the ten hub miRNAs, except hsa-let-7c-5p, hsa-miR-133a-3p and hsa-miR-125b-2-3p, were significantly upregulated in tumor stroma (P<0.05). To further validate the results, we queried The Human Protein Atlas (http://www.proteinatlas.org/) to evaluate the gene expression on the protein level. Since it is widely recognized that collagen genes are mainly expressed in stroma, we selected the SPARC and BGN in the Gmagenta as well as the TNS1 and MYLK in the Ggreen to assess their expression. The representative images of immunohistochemical staining are presented in Figure S9. The staining of the four genes was stronger in cancer stroma compared with cancer cells, which was consistent with the results of the RNA level. More importantly, the staining of SPARC and BGN in the normal stroma was weaker than that in the tumor stroma, which indicated that stroma was implicated in tumorigenesis and progression of CAC. These findings suggested that the expression levels of these hub genes and hub miRNAs mainly depended on tumor stroma. The tumor stroma includes a large quantity of cells, such as CAF, glial, Ep, vascular and immune cells. Next, we employed a microarray dataset, GSE39396, to explore the cell-type specificity of the hub genes. The GSE39396 contained the transcriptome data of four cell populations (Epcam+: Ep cancer cells, CD45+: leukocytes, CD31+: endothelial cells and FAP+: CAFs) isolated by fluorescence-activated cell sorting (FACS) from six CRC samples. As shown in Figure S10, most of the hub genes were predominantly expressed in CAFs, although some genes showed a moderate level of expression in the endothelial cells. This finding indicated that the CAFs were a key contributor to the expression levels of hub genes.
 | Figure 6 The expression levels of hub genes (A) and hub miRNAs (B) in Ep and Str areas from CRC tissues (GSE35602). |
Survival analysis on hub genes and hub miRNAs
The tumor stroma provides a favorable microenvironment for cancer proliferation and infiltration.40 The interaction between stroma and cancer cells may influence the malignant behaviors of cancer and, ultimately, lead to a poor prognosis. Since the hub genes and hub miRNAs were selected from the modules related to patients’ pathological stages, it was of great significance to evaluate the potentiality of them to serve as prognostic biomarkers. Among the ten hub genes of Gmagenta, five genes were found to be significantly associated with patient prognosis (COL1A2: P=0.017, COL1A1: P=0.036, BGN: P=0.0058, THBS2: P=0.017 and SULF1: P=0.011), of which upregulation indicated a poor prognosis. In addition, six of the ten hub genes in the Ggreen were significantly associated with prognosis (TNS1: P=0.03; HSPB8: P=0.022; TAGLN: P=0.014; DACT3: P=0.044; TMEM200B: P=0.035; HAND2: P=0.033), and a high expression level indicated a poor prognosis. Five of the ten hub miRNAs were also identified to be related to patient prognosis (hsa-miR-125b-5p: P=0.014, hsa-miR-145-5p: P=0.045, hsa-let-7c-5p: P=0.034, hsa-miR-218-5p: P=0.047 and hsa-miR-125b-2-3p: P=0.034; Figure S11). The prognosis-related hub genes and miRNAs have the potentiality to be prognostic biomarkers of CAC in the future.
Analysis of the miRNA–gene interaction network
In the present study, we noticed seven pathways were shared by genes and miRNAs, including proteoglycans in cancer, focal adhesion, ECM–receptor interaction, PI3K–Akt signaling pathway, adrenergic signaling in cardiomyocytes, ARVC and platelet activation. Given that miRNAs–genes comprise networks to participate in many cellular pathways, we constructed a miRNA–gene interaction network based on the miRNAs and genes involved in the same pathway to achieve a better understanding of the regulatory relationships. In total, there were 51 nodes (26 miRNAs and 25 genes) and 144 pairs of interaction relationships in the network (Figure 7). The miRNA hsa-let-7c-5p was the top hub node in the network with a degree of 19, which suggested its central role in the network. A highly connected core region containing nine nodes (hsa-let-7c-5p, COL11A1, COL4A1, COL5A2, COL5A1, COL1A1, COL1A2, COL5A3 and THBS2) and 46 edges with a score of 8.5 was detected by MCODE.
 | Figure 7 miRNA–gene interaction network. |
Discussion
In the present study, we applied a systems biology approach, WGCNA, to identify CAC pathological stage-associated gene and miRNA modules for the first time. We found that three modules, including two gene modules (Gmagenta and Ggreen) and one miRNA module (Mblack), were significantly related to the pathological stage, which indicated the implication of these modules in the progress of CAC. A total of 20 hub genes and ten hub miRNAs were identified. The stability and module–clinical trait relationships of the two gene modules were successfully validated. Most of the hub genes and hub miRNAs were significantly upregulated in the tumor stroma. Survival analysis indicated that 11 hub genes and five hub miRNAs were related with the prognosis of CAC patients, suggesting their prognostic values. In addition, the miRNA–gene interaction network analysis revealed a highly connected miRNA–gene interaction region. The findings could contribute to a better understanding of the implication of tumor stroma in the progress of CAC and provide prognostic biomarkers for clinical decisions.
A tumor is composed of tumor cells and tumor stroma. The stroma consists of Str cells, such as CAF, glial, Ep, vascular and immune cells, as well as ECM components, such as collagens, fibronectins, proteoglycans and glycosaminoglycans.41 It is a widely held view that in the process of tumor progression, tumor cells coevolve with the surrounding tumor stroma. There are substantial interactions between tumor cells and tumor stroma, which contribute to cellular proliferation, migration, invasion and drug resistance.42 In the present study, we identified three modules associated with the pathological stage of colon cancer. Interestingly, most of the hub genes and hub miRNAs were remarkably overexpressed in tumor stroma, especially in the CAFs of tumor stroma, which indicated that 1) the tumor stroma played an important role in the CAC progression and 2) the gene expression pattern in the Str cells tended to be similar, which could benefit the targeted therapy.
The Gmagenta contained 206 genes and ten hub genes (SPARC, COL1A2, COL1A1, COL5A2, COL5A1, BGN, THBS2, SULF1, WISP1 and THY1). We found that seven (SPARC, COL1A2, COL1A1, COL5A2, COL5A1, BGN and THBS2) out of the ten hub genes were related to ECM.43–46 For example, the COL1A2, COL1A1, COL5A2 and COL5A1 are collagen-coding genes, and the SPARC is capable of binding fibrillar collagens I, III and V and basement membrane collagen IV.46 Pathway analysis indicated that many cancer-related pathways were enriched in the Gmagenta, including ECM–receptor interaction, focal adhesion, protein digestion and absorption, PI3K–Akt signaling pathway and proteoglycans in cancer. Considering that the ECM-related genes accounted for the majority of hub genes and ECM–receptor interaction pathway was the most significant pathway in the module, we speculated that the biological function of the Gmagenta could closely relate to ECM. ECM forms the most abundant components in tumor microenvironment, affecting the biological behaviors of tumor cells.47 As the most basic components of the ECM, collagen is closely related with the function of ECM.47 The implication of collagen in tumorigenesis and progression of CRC have been widely reported. The COL11A1 and COL5A2 are not expressed in normal colon tissues but expressed in the stroma of CRC tissues.48 The COL1A2 is also overexpressed in CRC stroma.49 The functions of type I collagen in CRC have been intensively studied by cell culture experiments. CRC cells grown on the type I collagen medium show an epithelial–mesenchymal-like transition (EMT-like) morphology. Type I collagen inhibits cell differentiation, while promotes the expression of stem cell markers of CRC cells.50 Collagen type I induces a transient transcriptional downregulation of Cdx2, which is associated with a loss of differentiation.51 In addition, CRC cells grown on type I collagen show enhanced growth, survival, chemoresistance and invasion.52,53 In the present study, we also found that COL1A2 and COL5A2 were upregulated in the tumor stroma, which was in line with the previous studies. More importantly, we identified that genes shared a similar expression pattern with type I collagen genes, which provided new insight into the implication of ECM in the progress of CAC.
With regard to the Ggreen, pathway analysis indicated that the top five relevant pathways included vascular smooth muscle contraction, calcium signaling pathway, dilated cardiomyopathy, cGMP–PKG signaling pathway and adrenergic signaling in cardiomyocytes. These five pathways are physiologically related with the movement of myofilament. However, it is hard to find a direct correlation between these pathways and the progression of CAC. By exploring the cell-type specificity of the hub genes in Ggreen, we observed that most of the genes were expressed in CAFs. CAFs are a primary subpopulation of cells in the tumor stroma. It is widely recognized that CAFs promote tumor growth, metastasis, angiogenesis and inflammation. Furthermore, CAF-specific proteins have the potential to be prognostic markers and therapeutic targets.54 The myofibroblast is a principal member of CAFs. The electron microscope indicates that there are peripheral myofilaments in the myofibroblast. The contraction of myofilaments causes the tumor stroma to become stiffer, which, as a result, enhances cell growth, survival and promotes migration.55 In consideration of the five pathways related with myofilament movement, we speculated that this module could be related to the functions of myofibroblast. For example, CAFs in the gastric carcinomas enhance the expression of TAGLN to promote cell migration and invasion.56 In addition, the TNS1 plays an important role in the myofibroblast differentiation and ECM formation.57 The functions of these hub genes in the CAC remain largely unknown and molecular biology experiments are required in the future.
As for the Mblack, we found that many cancer-related pathways, such as proteoglycans in cancer, Hippo signaling pathway, ErbB signaling pathway and CRC were enriched in the module, which indicated the complex regulatory mechanisms of the miRNA module in the progression of CAC. Interestingly, we found seven overlaps between gene pathways and miRNA pathways. The proteoglycans in cancer, focal adhesion, ECM–receptor interaction, PI3K–Akt signaling pathway, adrenergic signaling in cardiomyocytes, ARVC and platelet activation were overlapped pathways. Since the three modules (Gmagenta, Ggreen and Mblack) were related to the pathological stage of CAC patients, we speculated that the genes and miRNAs involved in the same pathway could have regulatory relationships, which may promote the deterioration of CAC. Thus, we constructed a miRNA–gene interaction network aiming to find out the core regulatory relationships. A highly connected core region containing nine nodes (hsa-let-7c-5p, COL11A1, COL4A1, COL5A2, COL5A1, COL1A1, COL1A2, COL5A3 and THBS2) was found. Among the core region, hsa-let-7c-5p was regarded as the central regulator since it targeted the other eight genes. Interestingly, seven of the eight (COL11A1, COL4A1, COL5A2, COL5A1, COL1A1, COL1A2 and COL5A3) genes are collagen-coding genes, and the remaining one (THBS2) modulates collagen fibrillogenesis and plays a crucial role in the ECM assembly.44,58 These findings indicate that hsa-let-7c-5p may regulate ECM-related genes in the progression of CAC. Hsa-let-7c-5p belongs to the conservative let-7 family, which is one of the well-studied miRNA that involves in many cancer types.59–61 The expression of let-7c is negatively correlated with COL1A2 expression in chronic hepatitis tissues,62 which indicates that let-7c may target COL1A2. However, there was no significant difference in the hsa-let-7c-5p levels between tumor cells and tumor stroma. The high conservation of let-7 family may partly explain this phenomenon.63 The increased hsa-let-7c-5p level was related with a poor survival, which suggested its potential prognostic value.
Some limitations in our study should be mentioned. First, the datasets used to identify co-expressed modules were derived from macrodissected cancer samples, which included tumor cells and tumor stroma. Since great heterogeneity exists in cancer cells, utilizing comprehensive gene expression profiles from both tumor and Str cells may result in failing to identify tumor cell-specific gene modules. Second, the preservation of the Mblack was not strong enough and the module–clinical trait relationship of Mblack was not very well validated. Readers should be careful when utilizing the information from Mblack. Third, the miRNA–gene relationships in CAC were only based on target predication. Further molecular biology experiments are required to prove the interaction.
Conclusion
By applying WGCNA and other methods, the present study identifies two gene modules and one miRNA module associated with the pathological stage and provides some potential prognostic biomarkers of CAC. These findings provide insights about the mechanisms underlying CAC progression, which is of great significance to the treatment of CAC.
Acknowledgments
This work was supported by Guangxi Natural Science Fund for Innovation Research Team (2013GXNSFFA019002, 2016GXNSFGA38006), Guangxi Collaborative Innovation Center for Genomic and Personalized medicine (201319) and Student’s Platform for Innovation and Entrepreneurship Training Program (201710598063). We thank TCGA and the GEO for providing all data in this research.
Author contributions
Conceived and designed the experiments: Q-YW, Z-NM, X-GZ and X-LH. Performed the data statistics and analysis: X-GZ, X-LH, S-YL, S-MT, S-KW and T-TH. Contributed materials/analysis tools: S-YL, S-MT, S-KW and T-TH. Contributed to the writing of the manuscript: X-GZ, X-LH, S-YL, S-MT, S-KW, T-TH, Q-YW and Z-NM. Revised the manuscript: Q-YW and Z-NM. All authors contributed toward data analysis, drafting and revising the paper and agree to be accountable for all aspects of the work.
Disclosure
The authors report no conflicts of interest in this work.
References
Arnold M, Sierra MS, Laversanne M, Soerjomataram I, Jemal A, Bray F. Global patterns and trends in colorectal cancer incidence and mortality. Gut. 2017;66(4):683–691. | ||
Fleming M, Ravula S, Tatishchev SF, Wang HL. Colorectal carcinoma: Pathologic aspects. J Gastrointest Oncol. 2012;3(3):153–173. | ||
Yang Y, Bai Y, He Y, et al. PTEN loss promotes intratumoral androgen synthesis and tumor microenvironment remodeling via aberrant activation of RUNX2 in castration-resistant prostate cancer. Clin Cancer Res. 2018;24(4):834–846. | ||
Zhang Y, Ma J, Zhang S, et al. A prognostic analysis of 895 cases of stage III colon cancer in different colon subsites. Int J Colorectal Dis. 2015;30(9):1173–1183. | ||
Tutar L, Tutar E, Ozgur A, Tutar Y. Therapeutic targeting of microRNAs in cancer: future perspectives. Drug Dev Res. 2015;76(7):382–388. | ||
Wang JY, Wang CL, Wang XM, Liu FJ. Comprehensive analysis of microRNA/mRNA signature in colon adenocarcinoma. Eur Rev Med Pharmacol Sci. 2017;21(9):2114–2129. | ||
Wu F, Yuan G, Chen J, Wang C. Network analysis based on TCGA reveals hub genes in colon cancer. Contemp Oncol (Pozn). 2017;21(2):136–144. | ||
Jacobsen A, Silber J, Harinath G, Huse JT, Schultz N, Sander C. Analysis of microRNA-target interactions across diverse cancer types. Nat Struct Mol Biol. 2013;20(11):1325–1332. | ||
Carlson MR, Zhang B, Fang Z, Mischel PS, Horvath S, Nelson SF. Gene connectivity, function, and sequence conservation: predictions from modular yeast co-expression networks. BMC Genomics. 2006;7:40. | ||
Carter SL, Brechbuhler CM, Griffin M, Bond AT. Gene co-expression network topology provides a framework for molecular characterization of cellular state. Bioinformatics. 2004;20(14):2242–2250. | ||
Langfelder P, Horvath S. WGCNA: an R package for weighted correlation network analysis. BMC Bioinformatics. 2008;9:559. | ||
Oldham MC, Konopka G, Iwamoto K, et al. Functional organization of the transcriptome in human brain. Nat Neurosci. 2008;11(11):1271–1282. | ||
He Z, Sun M, Ke Y, et al. Identifying biomarkers of papillary renal cell carcinoma associated with pathological stage by weighted gene co-expression network analysis. Oncotarget. 2017;8(17):27904–27914. | ||
Sun Q, Zhao H, Zhang C, et al. Gene co-expression network reveals shared modules predictive of stage and grade in serous ovarian cancers. Oncotarget. 2017;8(26):42983–42996. | ||
Liu R, Zhang W, Liu ZQ, Zhou HH. Associating transcriptional modules with colon cancer survival through weighted gene co-expression network analysis. BMC Genomics. 2017;18(1):361. | ||
Zhai X, Xue Q, Liu Q, Guo Y, Chen Z. Colon cancer recurrence associated genes revealed by WGCNA coexpression network analysis. Mol Med Rep. 2017;16(5):6499–6505. | ||
Chen DT, Hernandez JM, Shibata D, et al. Complementary strand microRNAs mediate acquisition of metastatic potential in colonic adenocarcinoma. J Gastrointest Surg. 2012;16(5):905–912. discussion 912–913. | ||
Reid JF, Sokolova V, Zoni E, et al. miRNA profiling in colorectal cancer highlights miR-1 involvement in MET-dependent proliferation. Mol Cancer Res. 2012;10(4):504–515. | ||
Marisa L, de Reynies A, Duval A, et al. Gene expression classification of colon cancer into molecular subtypes: characterization, validation, and prognostic value. PLoS Med. 2013;10(5):e1001453. | ||
Kozomara A, Griffiths-Jones S. miRBase: annotating high confidence microRNAs using deep sequencing data. Nucl Acids Res. 2014;42(Database issue):D68–D73. | ||
Robinson MD, McCarthy DJ, Smyth GK. edgeR: a Bioconductor package for differential expression analysis of digital gene expression data. Bioinformatics. 2010;26(1):139–140. | ||
Zhang B, Horvath S. A general framework for weighted gene co-expression network analysis. Stat Appl Genet Mol Biol. 2005;4:Article17. | ||
Langfelder P, Horvath S. Eigengene networks for studying the relationships between co-expression modules. BMC Syst Biol. 2007;1:54. | ||
Langfelder P, Luo R, Oldham MC, Horvath S. Is my network module preserved and reproducible? PLoS Comput Biol. 2011;7(1):e1001057. | ||
Storey JD. The positive false discovery rate: A Bayesian interpretation and the q-value. Ann Stat. 2003;31(6):2013–2035. | ||
Huang da W, Sherman BT, Lempicki RA. Systematic and integrative analysis of large gene lists using DAVID bioinformatics resources. Nat Protoc. 2009;4(1):44–57. | ||
Vlachos IS, Zagganas K, Paraskevopoulou MD, et al. DIANA-miRPath v3.0: deciphering microRNA function with experimental support. Nucl Acids Res. 2015;43(W1):W460–W466. | ||
Nishida N, Nagahara M, Sato T, et al. Microarray analysis of colorectal cancer stromal tissue reveals upregulation of two oncogenic miRNA clusters. Clin Cancer Res. 2012;18(11):3054–3070. | ||
Calon A, Espinet E, Palomo-Ponce S, et al. Dependency of colorectal cancer on a TGF-beta-driven program in stromal cells for metastasis initiation. Cancer Cell. 2012;22(5):571–584. | ||
Tang Z, Li C, Kang B, Gao G, Li C, Zhang Z. GEPIA: a web server for cancer and normal gene expression profiling and interactive analyses. Nucl Acids Res. 2017;45(W1):W98–W102. | ||
Anaya J. OncoLnc: linking TCGA survival data to mRNAs, miRNAs, and lncRNAs. PeerJ Comput Sci. 2016;2:e67. | ||
Agarwal V, Bell GW, Nam JW, Bartel DP. Predicting effective microRNA target sites in mammalian mRNAs. Elife. 2015:4. | ||
Szklarczyk D, Morris JH, Cook H, et al. The STRING database in 2017: quality-controlled protein-protein association networks, made broadly accessible. Nucleic Acids Res. 2017;45(D1):D362–D368. | ||
Shannon P, Markiel A, Ozier O, et al. Cytoscape: a software environment for integrated models of biomolecular interaction networks. Genome Res. 2003;13(11):2498–2504. | ||
Bader GD, Hogue CW. An automated method for finding molecular complexes in large protein interaction networks. BMC Bioinformatics. 2003;4:2. | ||
Peluso G, Incollingo P, Calogero A, et al. Current tissue molecular markers in colorectal cancer: a literature review. Biomed Res Int. 2017;2017:2605628. | ||
Sztefko K, Hodorowicz-Zaniewska D, Popiela T, Richter P. IGF-I, IGF-II, IGFBP2, IGFBP3 and acid-labile subunit (ALS) in colorectal cancer patients before surgery and during one year follow up in relation to age. Adv Med Sci. 2009;54(1):51–58. | ||
Das V, Kalita J, Pal M. Predictive and prognostic biomarkers in colorectal cancer: A systematic review of recent advances and challenges. Biomed Pharmacother. 2017;87:8–19. | ||
Li D, Yan D, Tang H, et al. IMP3 is a novel prognostic marker that correlates with colon cancer progression and pathogenesis. Ann Surg Oncol. 2009;16(12):3499–3506. | ||
Tlsty TD, Coussens LM. Tumor stroma and regulation of cancer development. Annu Rev Pathol. 2006;1:119–150. | ||
Bussard KM, Mutkus L, Stumpf K, Gomez-Manzano C, Marini FC. Tumor-associated stromal cells as key contributors to the tumor microenvironment. Breast Cancer Res. 2016;18(1):84. | ||
Hanahan D, Coussens LM. Accessories to the crime: functions of cells recruited to the tumor microenvironment. Cancer Cell. 2012;21(3):309–322. | ||
Bi Y, Ehirchiou D, Kilts TM, et al. Identification of tendon stem/progenitor cells and the role of the extracellular matrix in their niche. Nat Med. 2007;13(10):1219–1227. | ||
Bornstein P, Kyriakides TR, Yang Z, Armstrong LC, Birk DE. Thrombospondin 2 modulates collagen fibrillogenesis and angiogenesis. J Investig Dermatol Symp Proc. 2000;5(1):61–66. | ||
Kolacna L, Bakesova J, Varga F, et al. Biochemical and biophysical aspects of collagen nanostructure in the extracellular matrix. Physiol Res. 2007;56(suppl 1):S51–S60. | ||
Arnold SA, Rivera LB, Miller AF, et al. Lack of host SPARC enhances vascular function and tumor spread in an orthotopic murine model of pancreatic carcinoma. Dis Model Mech. 2010;3(1–2):57–72. | ||
Fang M, Yuan J, Peng C, Li Y. Collagen as a double-edged sword in tumor progression. Tumour Biol. 2014;35(4):2871–2882. | ||
Fischer H, Stenling R, Rubio C, Lindblom A. Colorectal carcinogenesis is associated with stromal expression of COL11A1 and COL5A2. Carcinogenesis. 2001;22(6):875–878. | ||
Smith MJ, Culhane AC, Donovan M, et al. Analysis of differential gene expression in colorectal cancer and stroma using fluorescence-activated cell sorting purification. Br J Cancer. 2009;100(9):1452–1464. | ||
Kirkland SC. Type I collagen inhibits differentiation and promotes a stem cell-like phenotype in human colorectal carcinoma cells. Br J Cancer. 2009;101(2):320–326. | ||
Brabletz T, Spaderna S, Kolb J, et al. Down-regulation of the homeodomain factor Cdx2 in colorectal cancer by collagen type I: an active role for the tumor environment in malignant tumor progression. Cancer Res. 2004;64(19):6973–6977. | ||
Conti JA, Kendall TJ, Bateman A, et al. The desmoplastic reaction surrounding hepatic colorectal adenocarcinoma metastases aids tumor growth and survival via alphav integrin ligation. Clin Cancer Res. 2008;14(20):6405–6413. | ||
Vellinga TT, den Uil S, Rinkes IH, et al. Collagen-rich stroma in aggressive colon tumors induces mesenchymal gene expression and tumor cell invasion. Oncogene. 2016;35(40):5263–5271. | ||
Madar S, Goldstein I, Rotter V. ‘Cancer associated fibroblasts’ – more than meets the eye. Trends Mol Med. 2013;19(8):447–453. | ||
Levental KR, Yu H, Kass L, et al. Matrix crosslinking forces tumor progression by enhancing integrin signaling. Cell. 2009;139(5):891–906. | ||
Yu B, Chen X, Li J, et al. Stromal fibroblasts in the microenvironment of gastric carcinomas promote tumor metastasis via upregulating TAGLN expression. BMC Cell Biol. 2013;14:17. | ||
Bernau K, Torr EE, Evans MD, Aoki JK, Ngam CR, Sandbo N. Tensin 1 is essential for myofibroblast differentiation and extracellular matrix formation. Am J Respir Cell Mol Biol. 2017;56(4):465–476. | ||
Calabro NE, Kristofik NJ, Kyriakides TR. Thrombospondin-2 and extracellular matrix assembly. Biochim Biophys Acta. 2014;1840(8):2396–2402. | ||
Johnson SM, Grosshans H, Shingara J, et al. RAS is regulated by the let-7 microRNA family. Cell. 2005;120(5):635–647. | ||
Shimizu S, Takehara T, Hikita H, et al. The let-7 family of microRNAs inhibits Bcl-xL expression and potentiates sorafenib-induced apoptosis in human hepatocellular carcinoma. J Hepatol. 2010;52(5):698–704. | ||
Motoyama K, Inoue H, Nakamura Y, Uetake H, Sugihara K, Mori M. Clinical significance of high mobility group A2 in human gastric cancer and its relationship to let-7 microRNA family. Clin Cancer Res. 2008;14(8):2334–2340. | ||
Shi W, Zhang Z, Yang B, et al. Overexpression of microRNA let-7 correlates with disease progression and poor prognosis in hepatocellular carcinoma. Medicine. 2017;96(32):e7764. | ||
Roush S, Slack FJ. The let-7 family of microRNAs. Trends Cell Biol. 2008;18(10):505–516. |
 © 2018 The Author(s). This work is published and licensed by Dove Medical Press Limited. The
full terms of this license are available at https://www.dovepress.com/terms
and incorporate the Creative Commons Attribution
- Non Commercial (unported, 3.0) License.
By accessing the work you hereby accept the Terms. Non-commercial uses of the work are permitted
without any further permission from Dove Medical Press Limited, provided the work is properly
attributed. For permission for commercial use of this work, please see paragraphs 4.2 and 5 of our Terms.
© 2018 The Author(s). This work is published and licensed by Dove Medical Press Limited. The
full terms of this license are available at https://www.dovepress.com/terms
and incorporate the Creative Commons Attribution
- Non Commercial (unported, 3.0) License.
By accessing the work you hereby accept the Terms. Non-commercial uses of the work are permitted
without any further permission from Dove Medical Press Limited, provided the work is properly
attributed. For permission for commercial use of this work, please see paragraphs 4.2 and 5 of our Terms.