Back to Journals » OncoTargets and Therapy » Volume 13
Identifying an Eight-Gene Signature to Optimize Overall Survival Prediction of Esophageal Adenocarcinoma Using Bioinformatics Analysis of ceRNA Network
Authors Wang Y ![]() , Liang N, Xue Z, Xue X
, Liang N, Xue Z, Xue X
Received 20 October 2020
Accepted for publication 29 November 2020
Published 22 December 2020 Volume 2020:13 Pages 13041—13054
DOI https://doi.org/10.2147/OTT.S287084
Checked for plagiarism Yes
Review by Single anonymous peer review
Peer reviewer comments 3
Editor who approved publication: Prof. Dr. Takuya Aoki
Yuanyong Wang,1,* Naixin Liang,2,* Zhiqiang Xue,1 Xinying Xue3,4
1Department of Thoracic Surgery, Chinese PLA General Hospital, Beijing, People’s Republic of China; 2Department of Thoracic Surgery, Peking Union Medical College Hospital, Chinese Academy of Medical Sciences, Beijing, People’s Republic of China; 3Department of Respiratory Disease, Beijing Shijitan Hospital, Capital Medical University, Beijing, People’s Republic of China; 4Department of Respiratory Disease, School of Clinical Medicine, Weifang Medical University, Weifang, Shandong, People’s Republic of China
*These authors contributed equally to this work
Correspondence: Xinying Xue
Department of Respiratory Disease, Beijing Shijitan Hospital, Capital Medical University, Beijing, People’s Republic of China
Email [email protected]
Zhiqiang Xue
Department of Thoracic Surgery, Chinese PLA General Hospital, Beijing, People’s Republic of China
Email [email protected]
Background and Aims: Esophageal adenocarcinoma (EAC) patients usually have a poor prognosis without early diagnosis. In this study, we aimed to identify a novel signature to improve the prediction of overall survival (OS) in EAC.
Methods: Eighty-one and 68 samples from The Cancer Genome Atlas (TCGA) and GSE19417 dataset were included for discovery and survival validation, respectively. In the TCGA cohort, a total of 1,811 DEmRNAs, 1,096 DElncRNAs, and 31 DEmiRNAs were identified between EAC and normal esophagus tissues. A mRNA–miRNA–lncRNA ceRNA network of EAC was established, which consisted of 94 DEmRNAs, 13 DEmiRNAs, and 46 DElncRNAs.
Results: In this study, we identified eight genes (UBE2B, LAMP2, B3GNT2, TAF9B, EFNA1, PHF8, PIGA, and NEURL1) which were related to survival in EAC. The independent external microarray data from the Gene Expression Omnibus (GEO) was used to validate these candidate genes. The prognostic ability of the signature was also validated in EAC patients in our hospital. Patients assigned to the high-risk group had a poor overall survival rate compared with the low-risk.
Conclusion: The current study provides novel insights into the mRNA-related ceRNA network in EAC and the eight mRNA biomarkers may be independent prognostic signatures in predicting the survival of EAC patients.
Keywords: esophageal adenocarcinoma, signature, competing endogenous RNA, overall survival, TCGA
Introduction
Esophageal adenocarcinoma (EAC) is the eighth commonest cancer in the world and the sixth leading cause of cancer-related deaths.1 In the clinic, 80% of EAC occurs in North America and parts of Europe, and its 5-year survival rate is less than 20% due to approximately 95% of EAC patients being initially characterized as dysphagia. It usually occurs when the tumor becomes large and the esophagus is blocked before treatment and the EAC develops to the advanced stage.2 Currently, the diagnosis and prognosis of EAC are based on the clinical stage of the disease, histological type, tumor location, dietary habits, and genetic factors.3 However, clinical symptoms and pathological stages are of little value in the early stages of EAC, and their clinical outcomes are highly uncertain because of their heterogeneity. In addition, the molecular mechanism of EAC has not been revealed. Hence, it is important to identify potential biomarkers or therapeutic targets for EAC.
With the increasing maturity of high-throughput technology, gene expression profiling is widely used to identify novel biomarker models. RNA-sequencing (RNA-seq), which is an efficient high-throughput sequencing tool to measure transcripts, can identify new transcripts and discover differentially expressed RNAs (DERNAs) between tumor and normal samples, as well as The Cancer Genome Atlas (TCGA), which is an open, large-scale cancer database that provides mass molecular expression and clinical follow-up information for a variety of cancer samples, its discovery and identification of biomarkers have been applied in cancers,4–6 including EAC.7 Several lncRNAs have been reported to be involved in EAC initiation and progression.8,9 Although the lncRNAs in EAC have been reported in published studies, the results are not very satisfactory due to the limitations of tissue samples. What’s more, studies with smaller sample sizes cannot statistically determine whether lncRNA was involved in survival or other clinical factors. The competing endogenous RNA (ceRNA) is a hypothesis by Salmena et al10 that proposed non-coding RNA can interact with messenger RNA (mRNA) as a novel regulatory mechanism.10 MRNAs contain miRNA response elements (MREs), which are the key components of ceRNA and play a crucial role in various pathological functions of tumors.11 The dysregulation of indispensable mRNAs in ceRNA networks also disrupts miRNA-mediated lncRNA/mRNA ceRNA interactions, thereby promoting cancer tumorigenesis and progression.12,13 However, the information of ceRNAs on EAC is rarely reported.
In this study, the transcriptome expression data of 151 EAC samples and 18 adjacent non-tumor esophagus tissues were obtained from TCGA and Gene Expression Omnibus (GEO) database. This new approach for predicting cancer-specific genes and ceRNA networks can expound mRNA-mediated ceRNA regulation in EAC tumorigenesis and prognosis, and identify new mRNAs as potential diagnostic biomarkers or therapeutic targets.
Materials and Methods
Patients and Tissue Specimens
We collected paired tumor and adjacent normal tissues from 143 patients with EAC (between 2008 and 2011), from the Department of Thoracic Surgery, Chinese PLA General Hospital. The cases were included in the study only if follow-up was obtained and clinical data were available. Patients after esophagectomy and only those who died of EAC were included in the tumor-related deaths. Patients with severe post-operative complications, other tumors or death from other causes were excluded. This study was approved by the Ethical Committee of Chinese PLA General Hospital, and written informed consent was obtained from all surgical patients to use resected samples and clinical data for research. The study was conducted in accordance with the Declaration of Helsinki (as revised in 2013).
EAC Patient Gene Expression Data
Level 3 (open-access) EAC gene expression and the corresponding clinical information can be downloaded from the TCGA database (https://portal.gdc.cancer.gov/, version 21, release time: December 10, 2019). Original data included 81 individuals with EAC in this study. Patients were selected according to the following criteria. First, clinical information does not match the expression information. Second, diagnosis was denied as esophageal adenocarcinoma. Third, lack of complete clinical data. Finally, 81 samples were enrolled in this study. Ethical approval and informed consent are not required due to the data being extracted from the TCGA.
Data Processing and Differential Expression Analysis
The original EAC RNA sequencing (mRNA, miRNA, and lncRNA) reads were processed and normalized through the Fragments Per Kilobase per Million (FPKM). DESeq2 package in R (version 3.6.1) was used to identify the differentially expressed mRNAs (DEmRNAs), miRNAs (DEmiRNAs) and lncRNAs (DElncRNAs),14 and the differential genes screening criteria were false discovery rate (FDR) <0.05 and the ratio of the FRKM value between the tumor and normal groups fold change>2 (|logFC>2|). The heat map and the volcano plots were visualized through the ggplot2 packages and pheatmap package in R.15,16
Building the ceRNA Network
The mRNA-miRNA-lncRNA competitive endogenous RNA network was built based on miRNA sponge hypothesis that the activity of mRNAs are inhibited by miRNA sponge or directly interacted with and regulated by lncRNAs.17 Based on the above theory, we constructed the mRNA-miRNA-lncRNA ceRNA network from the following steps: 1) screening for EAC differentially expressed RNAs, the retention principle is P<0.05, |logFC>2|; 2) the online tools Starbase (http://starbase.sysu.edu.cn/),18 and MiRDB (http://www.mirdb.org/)19 were used to predict the potential target mRNAs of miRNAs, as well used to predict the miRNA-lncRNA interactions; 3) the mRNAs and lncRNAs which were negatively regulated by miRNAs were selected to construct the ceRNA network. GDCRNATools - An R package for evaluating and constructing ceRNA score.20 The visual ceRNA network was built by Cytoscape (version 3.6.1).
Gene Ontology (GO) Enrichment Analyses and Kyoto Encyclopedia of Genes and Genomes (KEGG) Pathway
GO is a recognized bioinformatics tool for the analysis of biological processes of target genes and annotated genes.21 The illative functional roles of DElncRNAs correspond to that of their targeted mRNAs. To explore the function of DEmRNAs, biological analysis was performed using DAVID online database (https://david.ncifcrf.gov/).22 Go terms with P<0.05 were considered statistically significant. Also, in order to describe the biological processes and functions of the DEmRNAs, KOBAS was used (http://kobas.cbi.pku.edu.cn/kobas3/?t=1), a web tool that can make functional gene set enrichment.23 By putting the gene list to the Enrichment module, the KEGG database could generate enriched gene sets, P-value and passway name. The ggplot2 package was used to draw a bar chart for the visible results in R.15
Constructing a Protein-Protein Interaction (PPI) Network
STRING (http://string-db.org/), an online database could predict the PPI network that was based on gene symbols. An adequate understanding of the functional interactions between proteins can form a better insight of underlying mechanisms of cancer generation or development. In this research, the PPI network of DEmRNAs was constructed using the STRING database, with the combination score of >0.4, the difference was statistically significant. Then we visualized the molecular interaction network through Cytoscape.
Construction of Risk Prediction Model of EAC
The overall survival (OS) of EAC patients was associated with DEmRNAs, DEmiRNAs and DElncRNAs in the ceRNA network that was determined through Log rank test and Kaplan-Meier. P-value is controlled within 0.05. In order to create a more confident model, in our model (number of simulations = 5,000), we applied lasso regression to reduce independent variables and reduce potential overfitting. Multivariate Cox survival analysis was used to determine the independent prognostic factors in this model (stepwise regression method, P < 0.05). The formula is as follows: Risk score = expression of mRNA1 * β1mRNA1 + expression of mRNA2 * β2mRNA2 + ··· expression of mRNAn * βnmRNAn (where “β” is the regression coefficient obtained from the multivariate Cox regression model).24 The EAC patients are divided into high-risk and low-risk groups with a median risk score as a threshold. The receiver operating characteristic (ROC) curves access the specific mRNAs risk prediction rate between the two groups using the “survival ROC” package in R. To evaluate the effects of other clinical variables of EAC patients on OS risk scores through the univariate and multivariate analyses.
Cell Culture and Transient Transfection
Human EAC cell line BIC-1 was obtained from Shanghai Advanced Research Institute, Chinese Academy of Sciences. The cells were cultured in DMEM supplemented with 10% fetal bovine serum, and mycoplasma was tested every 3 months. For transient transfection, the cells were seeded in 6-well plates and transfected with siRNA using Lipofectamine 3000 (Invitrogen, Thermo Fisher Scientific, Waltham, MA, USA) according to the manufacturer’s instructions.
Transwell Assay
BIC-1 cells were treated as described above and seeded onto matrigel-coated transwell chambers for 24 hours. Transwell assay was performed according to the method previously described.25 Cells that had passed through the membrane were counted.
Independent Prognostic Factors
In order to determine prognosis-related independent factors, univariate cox regression analysis was performed on age, sex, TNM stage and tumor histological grade. The factors of P < 0.05 were also included in the multivariate Cox regression analysis. This factor is regarded as an independent prognostic factor, if P < 0.05 in a multiple regression analysis.
Construction and Verification of Nomogram Model for Predicting the Survival Rate of EAC Patients
A nomogram model was built that included depiction of independent prognostic factors. In order to verify the predictive ability of the line diagram, the consistency index (C-index) composed of independent prognostic factors and Nomogram model (fitted by T, N, M-stage and risk group and Coxph model) was calculated. Significant P-values were calculated using the resampling technique. The fitting degree of independent prognostic factors and compound factors to Coxph model was compared, and the calibration curve was derived from the component with the lowest P-value. The model with the best prediction ability was the model with a calibration curve as close as possible to 45°.
Statistical Analysis
SPSS software (Version 23.0) and GraphPad Prism software (Version 7.0) were used to analyse data, and a P-value <0.05 was considered significant. Chi-square tests were performed to evaluate differences in categorical variables. All continuous data are presented as the mean ± standard deviation (SD).
Results
Identification of DEmRNAs, DEmiRNAs, and DElncRNAs
In the present study, we obtained the DEmRNAs, DEmiRNAs, and DElncRNAs from TCGA dataset in EC and adjacent-normal esophagus tissues and the thresholds were set at |logFC|>2 and P<0.05. In total, we obtained 1,811 DEmRNAs which included 1,096 up-regulated and 715 down-regulated, 31 DEmiRNAs which included 13 up-regulated and 18 downregulated and 1,084 DElncRNAs which included 772 up-regulated and 312 down-regulated to identify between EAC and adjacent-normal groups. The volcano plots and heatmap plots showed the variation of the differential RNAs expression (Figure 1A and B).
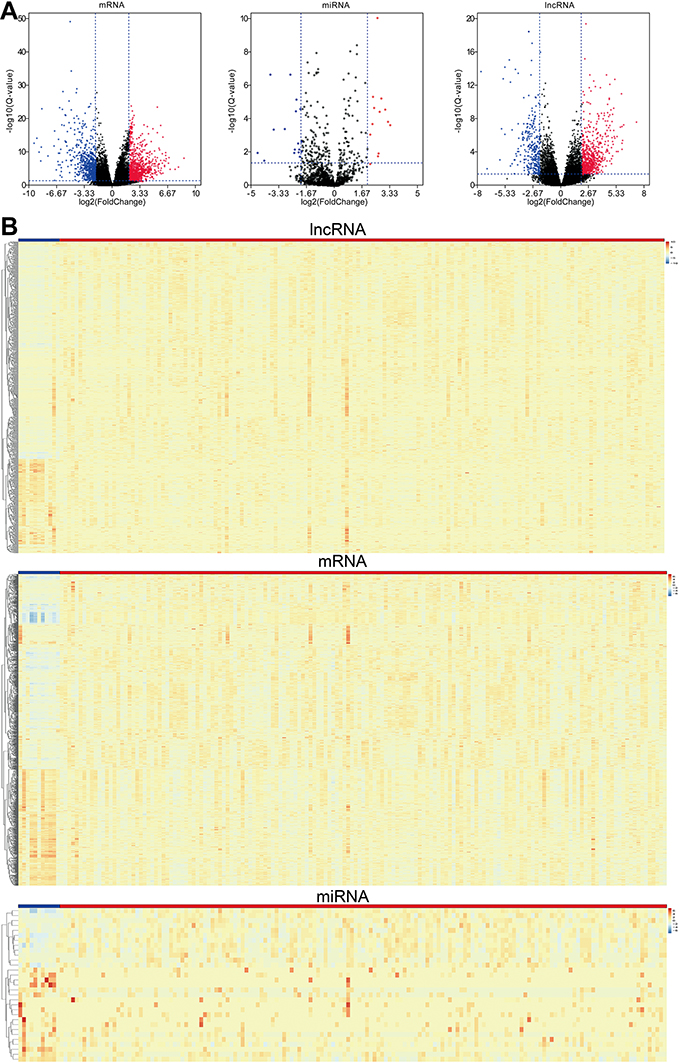 |
Figure 1 (A) Volcano plots show differential expression of RNAs (mRNAs, miRNAs and lncRNAs) in esophageal adenocarcinoma (EAC), which were drawn using the ggplot2 package. Red represents up-regulated, and blue represents down-regulated. (B) Heatmaps demonstrate differential expression of lncRNAs, mRNAs, and miRNAs between EAC and adjacent normal tissues, which were plotted using the pheatmap package; Blue represents normal tissues, while red stands for EAC tissues. The expression values are shown in line with the color scale. |
Prediction of miRNA Target Gene Analysis and ceRNA Network Construction
We extracted as above differentially expressed RNAs to construct mRNA-miRNA-lncRNA ceRNA network. The relationships among 1096 DElncRNAs and 31 DEmiRNAs were first figure out. Since lncRNAs could bind to miRNAs via MREs, the online tool miRDB was then used to detect potential MREs and then 13 EAC-specific miRNAs and 46 putative target lncRNAs were identified. The Starbase program was then used to predict the mRNA targets of miRNAs from the 31 DEmiRNAs and 1,811 DEmRNAs.
The mRNA-miRNA-lncRNA ceRNA network was constructed and visualized by Cytoscape that based on the above data. In a few words, 13 miRNAs (7 up-, and 6 down-regulated, Supplementary Table 1), 46 lncRNAs (28 up-, and 18 down-regulated, Supplementary Table 2), and 94 mRNAs (43 up-, and 51 down-regulated, Supplementary Table 3) were involved in the proposed ceRNA network (Supplementary Figure 1). The ceRNA networks can be divided into two groups that under-expressed (Supplementary Figure 1A) and over-expressed (Supplementary Figure 1B) networks based on the expression levels of DEmRNAs, DElncRNAs, and DEmiRNAs.
Functional Enrichment Analysis
We analyzed the mRNAs of the ceRNA network and identified the GO terms for lncRNA regulation to improve understanding of the role of DEmRNAs in EC. Based on the sequence homology, DEmRNAs were divided into three functional groups (Supplementary Figure 2A). In the biological process groups, the most enriched terms were signal release and extracellular structure organization. In the cellular components groups, extracellular matrix and collagen-containing extracellular matrix were the most enriched terms. In molecular function groups, channel activity and passive transmembrane transporter activity were the most enriched terms. We also listed KEGG pathways in Supplementary Figure 2B. The results disclose that most of the annotated genes are enriched in metabolic pathways, pathways in cancer and esophageal cancer.
PPI Analysis and Cluster Identification
A PPI network was constructed based on STRING in Cytoscape (Figure 2). UBE2B, LAMP2, B3GNT2, TAF9B, EFNA1, PHF8, PIGA, ACACB, NEURL1 and PRKACB were the top ten DEmRNAs with highest degree (Table 1).
 |
Table 1 List of Ten Hub Genes Identified in the PPI Network |
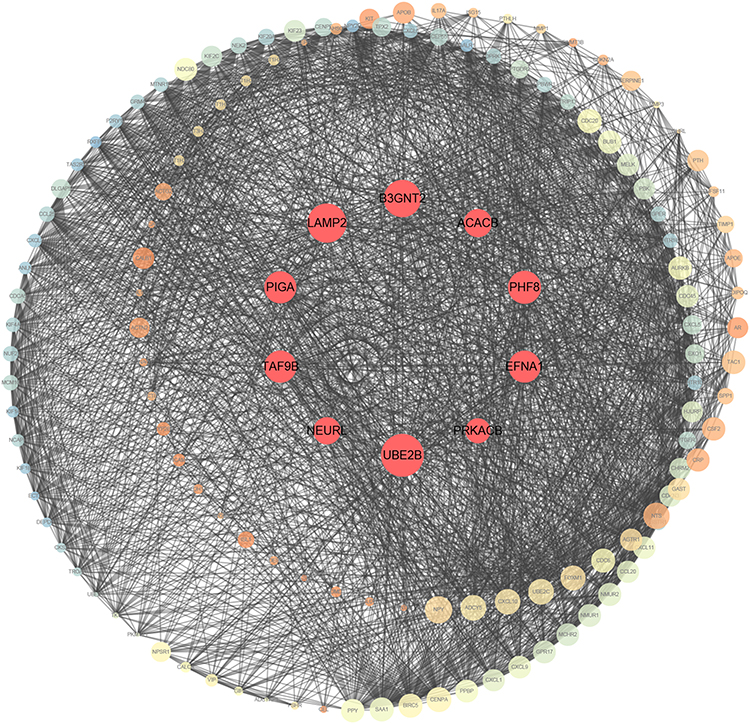 |
Figure 2 Protein–protein interaction of differentially expressed genes. A larger node means a higher degree. The red nodes represent the hub genes. |
Survival Analysis
The Kaplan–Meier plotter was applied to evaluate the prognostic value of the ten hub genes from PPI. The OS of EAC patients was obtained based on the differential expression of the hub gene. The results showed that high expression of UBE2B, LAMP2, B3GNT2, TAF9B, EFNA1, PHF8, PIGA, NEURL1 were involved in worse OSs for EAC patients (P<0.05) (Figure 3A–H). Hence, we analyzed OSs in the TCGA to assess the prognostic value of the above genes in EAC patient survival.
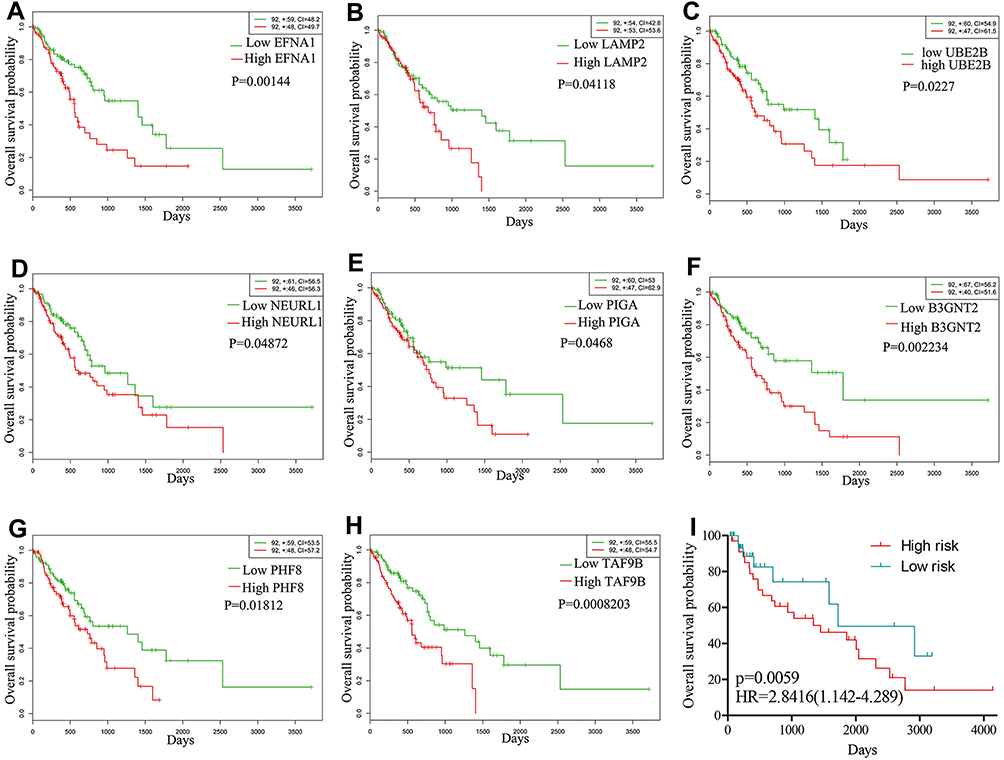 |
Figure 3 Kaplan–Meier curves of the eight prognostic proteins in the TCGA-ESCA cohort. Notes: Overall survival stratified by EFNA1 (A), LAMP2 (B), UBE2B (C), NEURL1 (D), PIGA (E), B3GNT2 (F), PHF8 (G), TAF9B (H) and validated in GSE19417 (I). |
Validation of the Eight Genes Signature for Survival Prediction
In order to confirm our findings in the risk score, we verified the characteristics of the eight-gene in the complete test set (TCGA) and test set (GSE19417). By using the same formula, 68 of 76 patients with survival time were divided into a high risk group (n = 34) and a low risk group (n = 34). Consistent with our previous findings, Figure 3I shows the Kaplan-Meier curve of both groups which further indicate that the survival time of low-risk patients is significantly longer than that of high-risk patients (P = 0.0059).
Validation of the DEGs in Clinical Tissue Samples
To confirm the reliability of the eight identified DEGs (UBE2B, LAMP2, B3GNT2, TAF9B, EFNA1, PHF8, PIGA, and NEURL1), we detected the protein expression of the above genes in clinical 143 EAC tissues and paired normal esophageal tissues using qPCR. The results showed that all eight genes and proteins are significantly overexpressed in tumor tissues when compared with those in normal tissues (Figure 4A). We also noticed that the expression of UBE2B, LAMP2, EFNA1, and NEURL1 were significantly higher in patients of stage II than stage I (Figure 4B). We concluded that these four genes may increase with EAC progression during early stage.
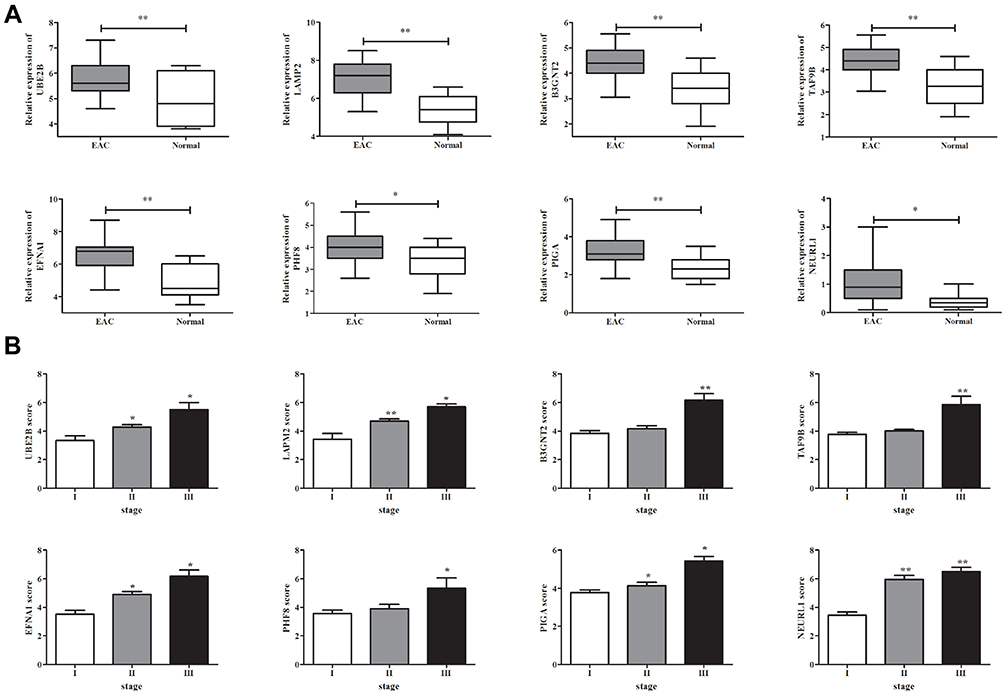 |
Figure 4 Differentially expressed genes/proteins in human EAC tissue and normal esophageal tissue. (A) The differential expression of UBE2B, LAMP2, B3GNT2, TAF9B, EFNA1, PHF8, PIGA, and NEURL1 in clinical human EAC tissue and normal tissue was detected by qPCR. (B) The expression of indicated genes in EAC tissue from patients at different stages. *P<0.05, **P<0.01. |
Knock Down of the Eight DEGs Inhibited Invasiveness of EAC Cells
The potential role of some identified proteins in EAC biology is unclear. Transwell assay was performed to study the effects of eight proteins on the invasiveness of EAC cells. The siRNA of eight genes were transfected into human esophageal adenocarcinoma cell line BIC-1. The results showed that knock down of the genes can markedly inhibit invasive ability of EAC cells (Figure 5) (Supplementary Figure 3). This suggested that these genes could enhance the invasive ability of EAC cells.
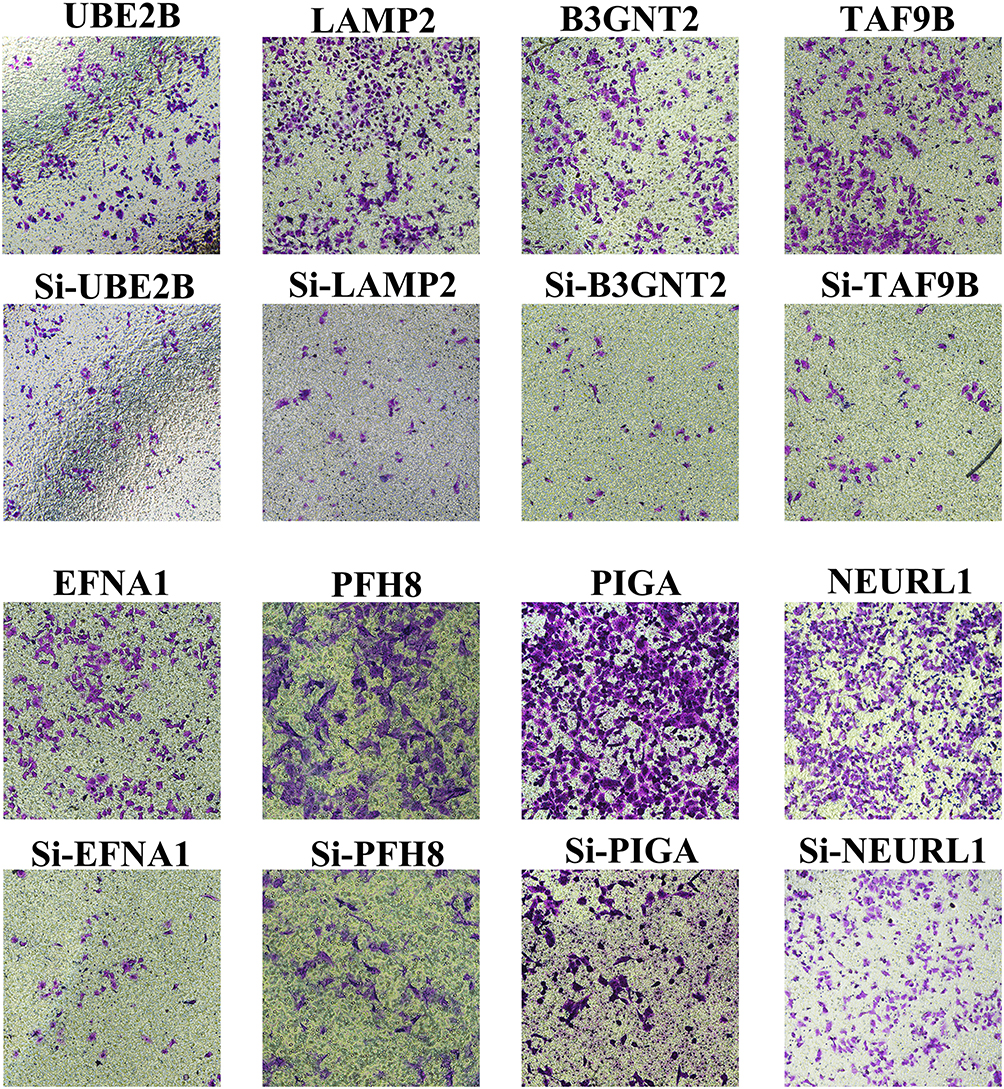 |
Figure 5 Targeted genes/proteins contribute to invasiveness of EAC cells in vitro. Transwell assay in specific siRNA transfected control or BIC-1 cells. |
Establishment and Validation of the Eight Gene Signature
A total of 81 samples of EAC were divided into high-risk (n=40) and low-risk groups (n=41), respectively, according to their expression pattern. Also, the eight-gene expression along with the risk score in the distribution of overall survival status was visualized in Figure 6A. The 1-year, 3-year and 5-year ROC curves showed good prediction ability (Figure 6B). Kaplan-Meier survival curve was visualized to estimate the survival probability in the above two groups (Figure 6C). Notably, the OS analysis showed that the high-risk group of patients had lower survival rates (HR=2.72; 95% CI=1.86–3.98; P<0.0001) than the low-risk group. In order to exclude any mRNA, that may not be an independent factor in the risk predictor, we performed a lasso regression (Figure 6D and E) to determine the candidate potential predictor. Therefore, the results of our analysis strongly suggest that genes regulated by the eight-gene signature are effective predictors of poor prognosis in EAC patients. In order to explore whether this eight-gene signature continued its predictive roles within EAC, the prognostic indexes and cut-off points of the TCGA cohort were used as independent validation in patients of our hospital to assess the impact of the prognostic risk scoring model on patient survival prediction (Table 2).
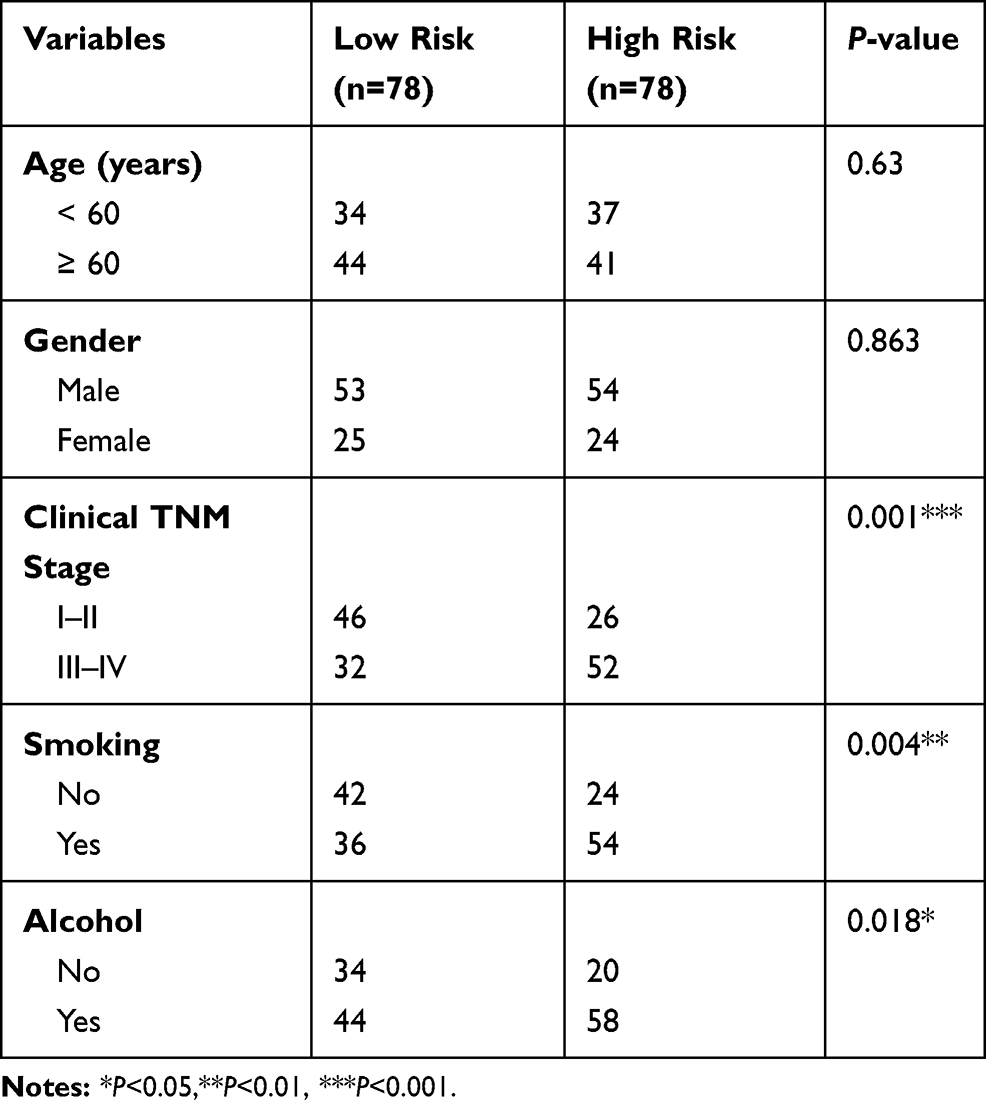 |
Table 2 The Correlation of EC Clinic Pathological Variables with Gene Expression Level in Patients |
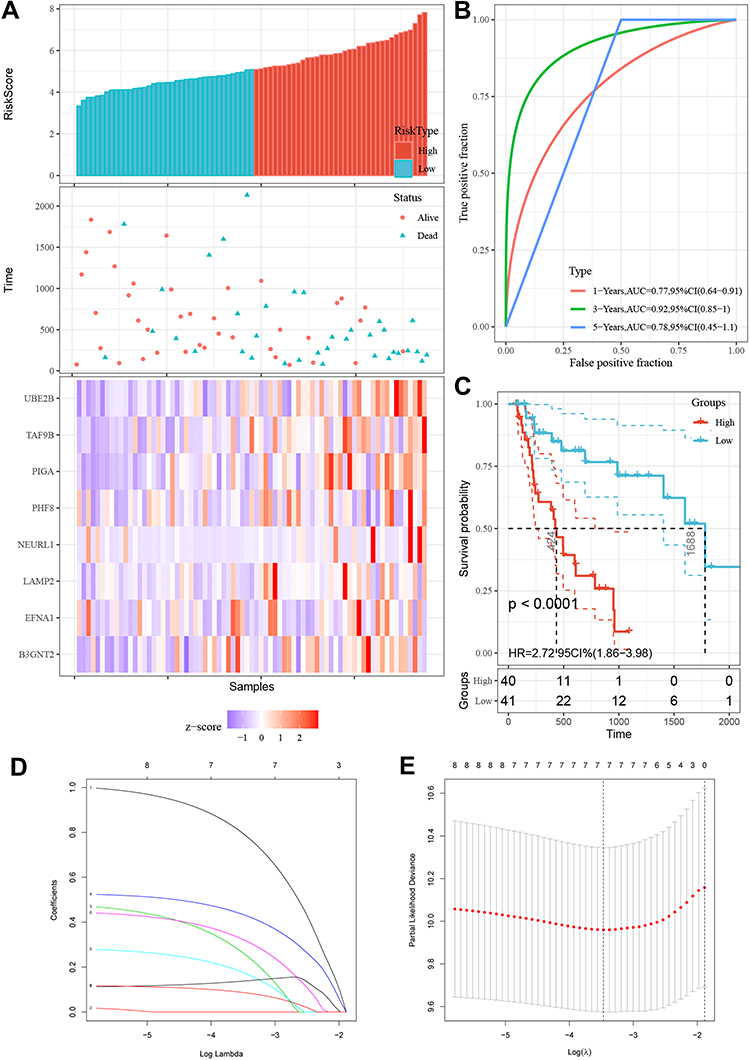 |
Figure 6 Eight genes in EAC patients of the TCGA cohort with prognostic gene signature. (A) The expression differences of the eight-gene signature were shown in Risk score plot, scatter plots and heatmaps. Green represents low-risk and red high risk groups of TCGA-EAC patients. (B) The ROC of 1/3/5 years was displayed in TCGA-EAC patients. (C) Eight-gene expression along with risk score in distribution of overall survival status. (D and E) Lasso regression for mRNAs in univariate Cox regression. |
Independent Prognostic Factors
Independent prognostic factors were determined using multivariate Cox regression analysis. Analysis using both univariate and multivariate Cox regression analyses revealed only the risk group and TNM-stage groups had P-values of < 0.05 (Table 3), highlighting the utility of both these groups as independent prognostic factors.
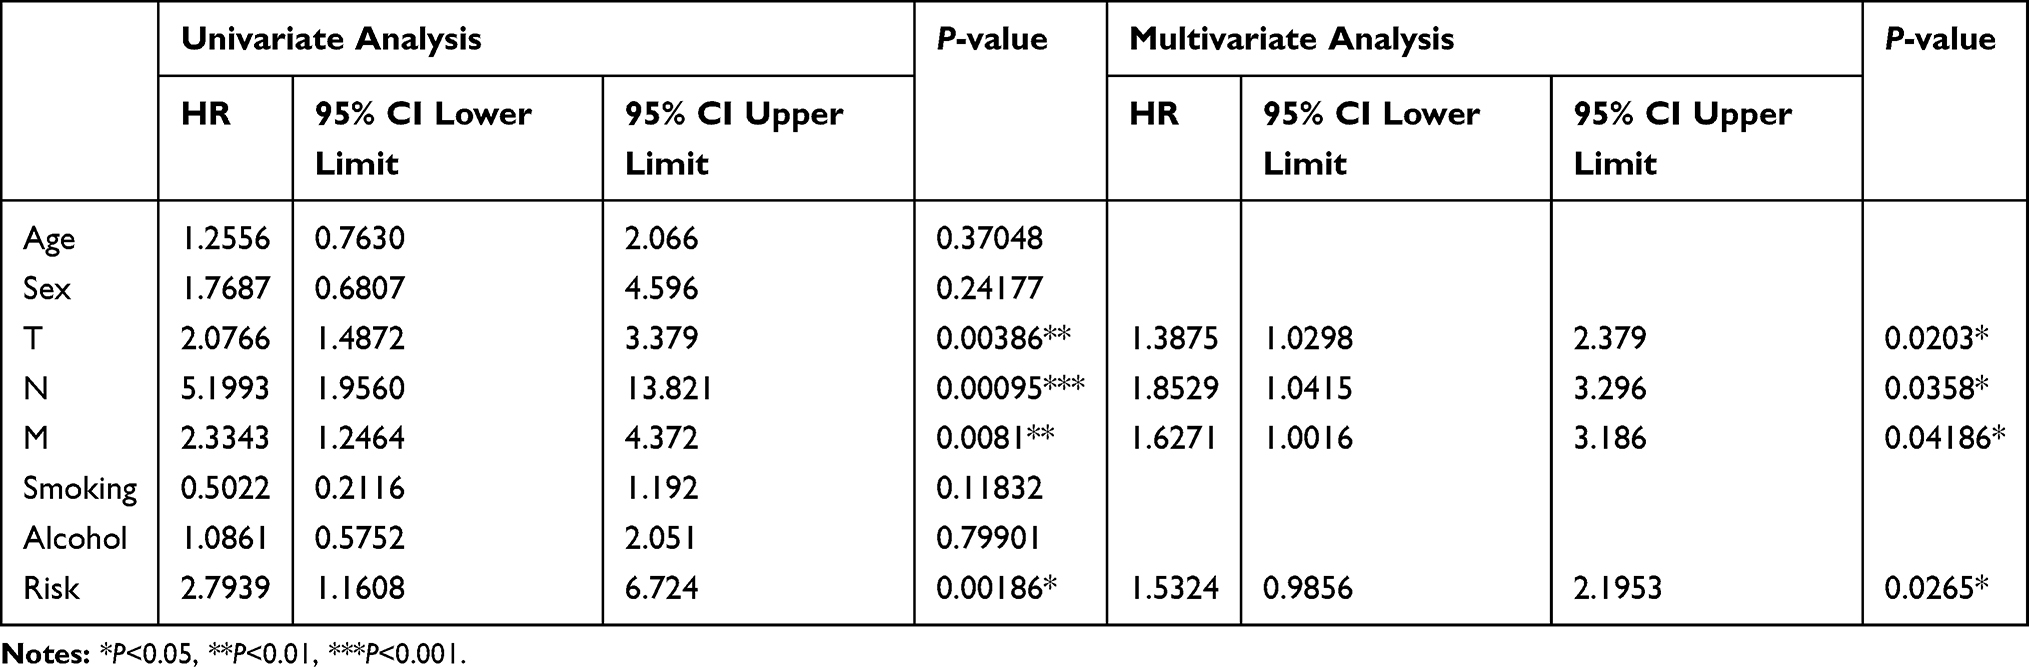 |
Table 3 Univariate Cox Regression Analysis and Multivariate Cox Regression Analysis for Clinical Factors |
Construction and Verification of Nomogram Model for Survival Rate Prediction of Patients with EAC
Annual survival rates at 3 and 5 years were predicted upon construction of a nomogram based on the derived independent prognostic factors. Figure 7A shows a linetype model comprising of pathologic_TNM and risk groups. According to the nomogram, the 3- and 5-year annual survival rate of patients was accurately predicted based on the TNM-stage of the patients and the risk group. The C-index of the TNM-Stage, risk group and nomogram model (TNM-Stage + risk group) were contrasted, with the C-index of risk group and nomogram model (> 0.7) being higher than that of the TNM-Stage. Line diagram models were found to have the lowest P-value. The line chart model curve calibration shows that there is a good consistency between the predicted annual overall and actual survival rate in 3 and 5 years, which indicates that the line chart model has good predictive ability (Figure 7B and C).
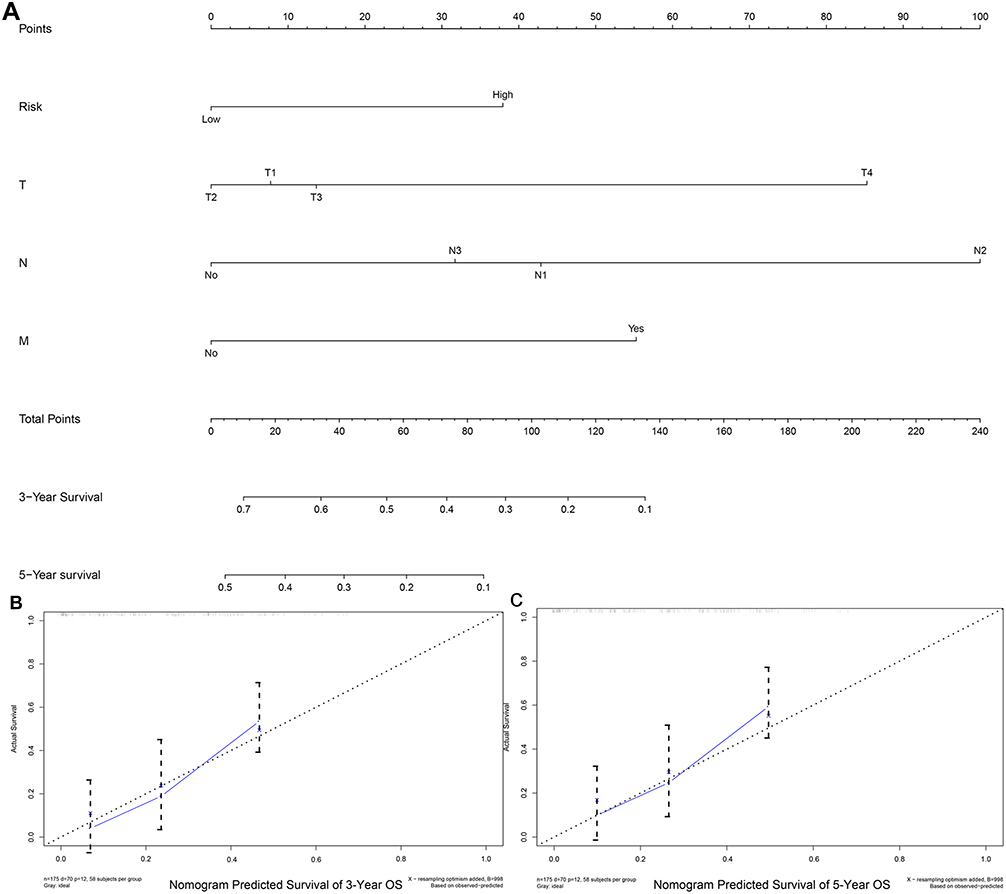 |
Figure 7 Construction and verification of nomogram for OS of EAC patients. (A) Nomogram model, including TNM-stage and risk group predicted by 3/5 years OS. There are four components in this nomogram model: the T, N, M-stage and the risk group. Depending on the points and lines depicted, different parameters corresponded to different points. (B and C) The 3/5 year OS probability of certain patients can be derived based on the two-component total score of the above patients. |
Discussion
We conducted an integrated study through the database of open-access to develop an eight-gene signature for the prognostic prediction of patients with EAC using powerful likelihood-based survival signature. A prognostic risk scoring system was further established and validated by Cox regression analysis. Our results may have significant implications in the understanding of therapeutic targets for EAC and provide potential novel biomarkers for prognosis.
Recently, studies on gene signature of prognosis predictions in human cancers have been reported.26,27 They have developed different genomes using different methods. Using 370 hepatocellular carcinoma (HCC) samples from the TCGA database, for example, based on lncRNA expression profiling constructed a 5-lncRNA signature was identified to be significantly associated with patient HCC.24 Five lncRNAs correlated with the patient HCC with univariate Cox regression analysis. Next, significant differences were identified in the survival rate between samples in the high-risk and low-risk groups. The prognostic value of the five lncRNAs was independent of clinicopathological factors by multivariate Cox regression analysis. Wang et al26 demonstrated that a five-gene signature could as an independent prognostic factor in ovarian cancer patients with OS.26 In this study, the computational methods and the methodology gave great inspiration to us. The focus of attention is on the enrichment of five genes in the epithelial-mesenchymal transition (EMT) and Wnt/β-catenin signaling, which had been confirmed to be related to cancer. A likelihood-based strong survival model is designed to select genes associated with survival and utilize cross-validation techniques that are essential for predictive modeling of data with large variability. Studies based on this method have also been reported for use in other human cancers. In non-small cell lung cancer, an eight-gene signature (DLGAP5, CCNB1, AURKA, CDC6, KIF11, RAD51AP1, OIP5, and NCAPG) was constructed that can predict the OS of patients.28 Wang et al29 verified a potential six-gene expression signature (LRRC8D, TNFRSF18, CTSW, PCSK4, IHH, and CDKN2A) for endometrial cancer.29 Besides utilizing gene signatures, lncRNA and miRNA signature models have also been applied in several studies. In adolescent acute myeloid leukemia, a four-microRNA signature was selected with high feasibility. This four-miRNA signature can divide patients with significant prognostic differences and become a potential prognostic predictor for pediatric and adolescent AML patients.30 In gastrointestinal oncology, a study using the TCGA database and this method to establish a prognostic 19-gene model can serve as a prognostic marker for colorectal cancer.31 What’s more, using the above method a seven-lncRNA signature was developed that can predict early lung adenocarcinoma patient survival based on the TCGA database.32
We identified and validated eight prognosis-related genes (UBE2B, LAMP2, B3GNT2, TAF9B, EFNA1, PHF8, PIGA, and NEURL1) of EAC in this study. Ephrin A1 (EFNA1, also known as B61, EFL1 and TNFAIP4), was a potential early detection and progression evaluation of hepatocellular carcinoma.33 It was discovered that over-expression of plant homeodomain finger protein 8 (PHD8, also known as KDM7B, JHDM1F, MRXSSD, and ZNF422), is associated with several forms of cancer.34 Interestingly, LAMP2 (lysosomal-associated membrane protein 2, also known as LAMPB, CD107b, LAMP-2, LGP-96, or LGP110), a member of a family of membrane glycoproteins, was also shown to be one of eight prognosis-related genes by Cox regression analysis in EAC, plays a crucial role in in tumor cell metastasis.35,36 It was associated with tumor differentiation and TNM staging and was identified as a novel tumor oncogene. In addition, higher expression of LAMP2 exhibited poor prognosis in patients through Kaplan-Meier survival curves.35 The roles of LAMP2 in EMT were demonstrated.37 The above three genes were not only involved in the pathogenesis of cancer, but also found in our study to be significant DEmRNAs, suggesting that these genes may play an important role in the development and progression of EAC.
Based on the above results, we carried out GO enrichment analysis of these eight genes. We found that they were significantly enriched in signal release, extracellular structure organization. Moreover, they were enriched in regulation of chromosome segregation and digestive system development. Therefore, we reasoned that the mechanism of this eight-gene signature in EAC prognosis may be due to the regulation of structure organization and the biological activities of cells such as hormone transport.
In multivariate analysis, the prognostic value must be independent of other standard factors. Giving the sensitivity and convincingness of gene signatures, the reproducibility and effectiveness of correlations are necessary in a separate group of patients.38 These may adapt to common problems about recent gene signature research. In this study, some deficiencies and limitations have been identified, this eight-gene signature, for example, should be further validated in a number of clinical samples and other experimental methods such as Western Blot.
In summary, we conducted an integrated study to identify an eight-gene signature which may serve as a novel and reliable biomarker for the prognostic prediction of patients with EAC from the TCGA database. The Cox survival analysis verified the prognostic reliability of the eight-gene signature. Patients in the high-risk group had significantly lower OS than the low-risk group based on this eight-gene signature. However, further functional investigations and studies are necessary to explore the underlying mechanisms of these DEmRNAs in signature.
Data Sharing Statement
The data that support the findings of this study are openly available in TCGA at https://cancergenome.nih.gov/, and GEO at https://www.ncbi.nlm.nih.gov/geo/, reference number: GSE19417.
Ethical Approval and Consent to Participate
This research was approved by the Ethics Committee of Chinese PLA General Hospital, and written informed consent was obtained from all patients or their guardians.
Consent for Publication
We have obtained consents to publish this paper from all the participants of this study.
Acknowledgments
We would like to thank The Department of Thoracic Surgery, Chinese PLA General Hospital for academic support.
Author Contributions
All authors made a significant contribution to the work reported, whether that was in the conception, study design, execution, acquisition of data, analysis and interpretation, or in all these areas; took part in drafting, revising or critically reviewing the article; gave final approval of the version to be published; have agreed on the journal to which the article has been submitted; and agree to be accountable for all aspects of the work.
Funding
This study was funded by the National Natural Science Fund Youth Project (81700007), the Research and innovation fund of the Ministry of Education (2018A03026), Beijing Natural Science Foundation (2019A10), and the “Qingmiao” plan of Beijing Municipal Hospital Administration (2018QM4).
Disclosure
The authors report no conflicts of interest in this work.
References
1. Gottlieb-Vedi E, Mackenzie H, van Workum F, et al. Surgeon volume and surgeon age in relation to proficiency gain curves for prognosis following surgery for esophageal cancer. Ann Surg Oncol. 2018.
2. Liu Q, Zeng H, Xia R, et al. Health-related quality of life of esophageal cancer patients in daily life after treatment: a multicenter cross-sectional study in China. Cancer Med. 2018.
3. Xie K, Liu S, Liu J. Nomogram predicts survival benefit for non- metastatic esophageal cancer patients who underwent preoperative radiotherapy. Cancer Manag Res. 2018;10:3657–3668.
4. Shi C, Zhang Z. Screening of potentially crucial genes and regulatory factors involved in epithelial ovarian cancer using microarray analysis. Oncol Lett. 2017;14:725–732.
5. Peng C, Yang Q, Wei B, et al. Investigation of crucial genes and microRNAs in conventional osteosarcoma using gene expression profiling analysis. Mol Med Rep. 2017;16:7617–7624.
6. Shen L, Liu M, Liu W, et al. Bioinformatics analysis of RNA sequencing data reveals multiple key genes in uterine corpus endometrial carcinoma. Oncol Lett. 2018;15:205–212.
7. Sharma P, Saraya A, Sharma R. Serum-based six-miRNA signature as a potential marker for EC diagnosis: comparison with TCGA miRNAseq dataset and identification of miRNA-mRNA target pairs by integrated analysis of TCGA miRNAseq and RNAseq datasets. Asia Pac J Clin Oncol. 2018.
8. Chen M, Xia Z, Chen C, et al. LncRNA MALAT1 promotes epithelial-to-mesenchymal transition of esophageal cancer through Ezh2-Notch1 signaling pathway. Anticancer Drugs. 2018;29:767–773.
9. Ma W, Zhang CQ, Li HL, et al. LncRNA FER1L4 suppressed cancer cell growth and invasion in esophageal squamous cell carcinoma. Eur Rev Med Pharmacol Sci. 2018;22:2638–2645.
10. Salmena L, Poliseno L, Tay Y, et al. A ceRNA hypothesis: the Rosetta Stone of a hidden RNA language? Cell. 2011;146:353–358.
11. Song X, Cao G, Jing L, et al. Analysing the relationship between lncRNA and protein-coding gene and the role of lncRNA as ceRNA in pulmonary fibrosis. J Cell Mol Med. 2014;18:991–1003.
12. Li RQ, Ren Y, Liu W, et al. MicroRNA-mediated silence of onco-lncRNA MALAT1 in different ESCC cells via ligand-functionalized hydroxyl-rich nanovectors. Nanoscale. 2017;9:2521–2530.
13. Yang N, Chen J, Zhang H, et al. LncRNA OIP5-AS1 loss-induced microRNA-410 accumulation regulates cell proliferation and apoptosis by targeting KLF10 via activating PTEN/PI3K/AKT pathway in multiple myeloma. Cell Death Dis. 2017;8:e2975.
14. Love MI, Huber W, Anders S. Moderated estimation of fold change and dispersion for RNA-seq data with DESeq2. Genome Biol. 2014;15:550.
15. Ito K, Murphy D. Application of ggplot2 to Pharmacometric Graphics. CPT Pharmacometrics Syst Pharmacol. 2013;2:e79.
16. Rajaram S, Oono Y. NeatMap–non-clustering heat map alternatives in R. BMC Bioinform. 2010;11:45.
17. Wang X, Bao K, Wu P, et al. Integrative Analysis of lncRNAs, miRNAs, and mRNA-associated ceRNA network in an atopic dermatitis recurrence model. Int J Mol Sci. 2018;19.
18. Li JH, Liu S, Zhou H, et al. starBase v2.0: decoding miRNA-ceRNA, miRNA-ncRNA and protein-RNA interaction networks from large-scale CLIP-Seq data. Nucleic Acids Res. 2014;42:D92–97.
19. Wong N, Wang X. miRDB: an online resource for microRNA target prediction and functional annotations. Nucleic Acids Res. 2015;43:D146–152.
20. Li R, Qu H, Wang S, et al. GDCRNATools: an R/Bioconductor package for integrative analysis of lncRNA, miRNA and mRNA data in GDC. Bioinformatics. 2018;34:2515–2517.
21. Ashburner M, Ball CA, Blake JA, et al. Gene ontology: tool for the unification of biology. The Gene Ontology Consortium Nat Genet. 2000;25:25–29.
22. da Huang W, Sherman BT, Lempicki RA. Systematic and integrative analysis of large gene lists using DAVID bioinformatics resources. Nat Protoc. 2009;4:44–57.
23. Xie C, Mao X, Huang J, et al. KOBAS 2.0: a web server for annotation and identification of enriched pathways and diseases. Nucleic Acids Res. 2011;39:W316–322.
24. Zhao QJ, Zhang J, Xu L, Liu FF. Identification of a five-long non-coding RNA signature to improve the prognosis prediction for patients with hepatocellular carcinoma. World J Gastroenterol. 2018;24:3426–3439.
25. Zhang J, Xu S, Xu J, et al. miR7675p inhibits glioma proliferation and metastasis by targeting SUZ12. Oncol Rep. 2019.
26. Wang R, Ye XH, Zhao XL, et al. Development of a five-gene signature as a novel prognostic marker in ovarian cancer. Neoplasma. 2018.
27. Xie X, Wang J, Shi D, et al. Identification of a 4-mRNA metastasis-related prognostic signature for patients with breast cancer. J Cell Mol Med. 2018.
28. Li S, Xuan Y, Gao B, et al. Identification of an eight-gene prognostic signature for lung adenocarcinoma. Cancer Manag Res. 2018;10:3383–3392.
29. Wang Y, Ren F, Chen P, et al. Identification of a six-gene signature with prognostic value for patients with endometrial carcinoma. Cancer Med. 2018;7:5632–5642.
30. Zhu R, Lin W, Zhao W, et al. A 4-microRNA signature for survival prognosis in pediatric and adolescent acute myeloid leukemia. J Cell Biochem. 2018.
31. Abdul Aziz NA, Mokhtar NM, Harun R, et al. A 19-Gene expression signature as a predictor of survival in colorectal cancer. BMC Med Genomics. 2016;9:58.
32. Chen M, Liu B, Xiao J, et al. A novel seven-long non-coding RNA signature predicts survival in early stage lung adenocarcinoma. Oncotarget. 2017;8:14876–14886.
33. Cui XD, Lee MJ, Yu GR, et al. EFNA1 ligand and its receptor EphA2: potential biomarkers for hepatocellular carcinoma. Int J Cancer. 2010;126:940–949.
34. Zhou W, Gong L, Wu Q, et al. PHF8 upregulation contributes to autophagic degradation of E-cadherin, epithelial-mesenchymal transition and metastasis in hepatocellular carcinoma. J Exp Clin Cancer Res. 2018;37:215.
35. Li L, Wang W, Zhang R, et al. High expression of LAMP2 predicts poor prognosis in patients with esophageal squamous cell carcinoma. Cancer Biomark. 2017;19:305–311.
36. Huang CF, Deng WW, Zhang L, et al. Expression of LC3, LAMP2, KEAP1 and NRF2 in salivary adenoid cystic carcinoma. Pathol Oncol Res. 2016;22:109–114.
37. Zheng H, Yang Y, Ye C, et al. Lamp2 inhibits epithelial-mesenchymal transition by suppressing Snail expression in HCC. Oncotarget. 2018;9:30240–30252.
38. Chibon F. Cancer gene expression signatures - the rise and fall? Eur J Cancer. 2013;49:2000–2009.
 © 2020 The Author(s). This work is published and licensed by Dove Medical Press Limited. The
full terms of this license are available at https://www.dovepress.com/terms
and incorporate the Creative Commons Attribution
- Non Commercial (unported, 3.0) License.
By accessing the work you hereby accept the Terms. Non-commercial uses of the work are permitted
without any further permission from Dove Medical Press Limited, provided the work is properly
attributed. For permission for commercial use of this work, please see paragraphs 4.2 and 5 of our Terms.
© 2020 The Author(s). This work is published and licensed by Dove Medical Press Limited. The
full terms of this license are available at https://www.dovepress.com/terms
and incorporate the Creative Commons Attribution
- Non Commercial (unported, 3.0) License.
By accessing the work you hereby accept the Terms. Non-commercial uses of the work are permitted
without any further permission from Dove Medical Press Limited, provided the work is properly
attributed. For permission for commercial use of this work, please see paragraphs 4.2 and 5 of our Terms.