Back to Journals » OncoTargets and Therapy » Volume 13
Identifying a Potential Key Gene, TIMP1, Associated with Liver Metastases of Uveal Melanoma by Weight Gene Co-Expression Network Analysis
Authors Wang P, Yang X, Zhou N, Wang J ![]() , Li Y, Liu Y, Xu X
, Li Y, Liu Y, Xu X ![]() , Wei W
, Wei W
Received 4 September 2020
Accepted for publication 6 November 2020
Published 19 November 2020 Volume 2020:13 Pages 11923—11934
DOI https://doi.org/10.2147/OTT.S280435
Checked for plagiarism Yes
Review by Single anonymous peer review
Peer reviewer comments 2
Editor who approved publication: Prof. Dr. Takuya Aoki
Ping Wang, Xuan Yang, Nan Zhou, Jinyuan Wang, Yang Li, Yueming Liu, Xiaolin Xu, Wenbin Wei
Beijing Tongren Eye Center, Beijing Key Laboratory of Intraocular Tumor Diagnosis and Treatment, Beijing Ophthalmology & Visual Sciences Key Lab, Medical Artificial Intelligence Research and Verification Key Laboratory of the Ministry of Industry and Information Technology, Beijing Tongren Hospital, Capital Medical University, Beijing 100730, People’s Republic of China
Correspondence: Wenbin Wei
Beijing Tongren Eye Center, Beijing Key Laboratory of Intraocular Tumor Diagnosis and Treatment, Beijing Ophthalmology & Visual Sciences Key Lab, Medical Artificial Intelligence Research and Verification Key Laboratory of the Ministry of Industry and Information Technology, Beijing Tongren Hospital, Capital Medical University, Beijing 100730, People’s Republic of China
Email [email protected]
Purpose: Uveal melanoma (UM) is a primary intraocular tumor in adults, with a high percentage of metastases to the liver. Identifying potential key genes may provide information for early detection and prognosis of UM metastasis.
Patients and Methods: Differentially expressed genes (DEGs) were identified using the GSE22138 dataset. Weighted gene co-expression network analysis was used to construct co-expression modules. Functional enrichment analysis was performed for DEGs and genes of key modules. Hub genes were screened by co-expression network and protein–protein interaction network (PPI), and validated by survival analysis in The Cancer Genome Atlas database. Gene set enrichment analysis (GSEA) was used to explore the potential metastasis mechanism of UM. Transient transfection was used to investigate the effect of TIMP1 on the proliferation, migration, and invasion of UM cells.
Results: In total, 552 DEGs were identified between primary and metastatic UM and mainly enriched in extracellular matrix, cellular senescence and focal adhesion pathway. A weighted gene co‑expression network was built to identify key gene modules associated with UM metastasis (n=36). The turquoise module is positively correlated with metastasis and genes in this module were mainly enriched in peptidyl-tyrosine autophosphorylation and regulation of organ growth. The hub gene TIMP1 was screened out by co-expression network and PPI analysis. High expression of TIMP1 was related to p53 pathway by GSEA and short overall survival time. Experimental results indicated that overexpression of TIMP1 inhibited the proliferation and migration, while it had no significant effect on invasion of UM cells.
Conclusion: Our study indicates that TIMP1 might be associated with metastasis in UM, which might have important significance for identifying patients with high risk of metastasis and predicting the prognosis of UM.
Keywords: weighted gene co-expression network analysis, WGCNA, uveal melanoma, liver metastases, GO analysis, pathway analysis
Introduction
Uveal melanoma (UM) is the most common primary intraocular malignancy in adults and can be fatal due to metastasis.1 Up to 50% of UM patients develop distant metastasis through hematogenous spread, and the most common site of metastasis is the liver, with survival time less than 6 months after the diagnosis of metastasis.2 Many effective local therapies have been developed for primary tumors, such as transpupillary thermotherapy, radiation therapy, and enucleation, while the poor prognosis for patients with metastasis has not improved.3,4 Several clinicopathologic features are associated with an increased risk of metastasis, including increased patient age, increased tumor thickness and diameter, epithelioid cell type, and 3-chromosome monomer.5–8 Several studies have identified a gene expression-based classification of primary UM that accurately predicts metastatic death.9,10 Studies focused on tumor microenvironment have indicated that increased growth factors in the liver were associated with metastatic progression of UM, such as hepatocyte growth factor (HGF),11,12 insulin-like growth factor 1,13,14 and stromal cell-derived factor 1 (SDF-1).15 In addition, C-X-C chemokine receptor type 4 (CXCR4) is associated with the organ-specific homing of UM to the liver and is involved in the process of metastasis.15,16 Currently, as metastatic UM patients are not responsive to existing radiotherapy and chemotherapy, it is important to understand the potential mechanism of liver metastasis to improve patient prognosis.
With the development of microarray and high‐throughput sequencing technology, bioinformatics has been used in recent studies to analyze genetic changes in tumors.17,18 However, most studies compare differences in gene expression levels between different samples to identify potential biomarkers, ignoring the relationship between genes and clinical traits.19,20 Weighted gene co-expression network analysis (WGCNA) is a bioinformatics analysis method, which allows cluster co-expressed genes with similar expression profiles in different samples and investigates the relationship between gene sets and clinical features.21 By developing the co-expression network, genes with similar expression profiles are classified into the same module. Recently, WGCNA has been widely applied to identify the important genes involved in disease processes, such as pancreatic cancer,21 clear cell renal cell carcinoma,22 endometrial carcinoma,23 and systemic sclerosis-related pulmonary hypertension.24
In this study, the WGCNA algorithm was used to analyze the microarray data downloaded from public datasets about UM metastasis to explore the metastasis-related genes. The genes may help to predict the malignant potential and prognosis of UM.
Materials and Methods
Dataset Collection and Study Design
The data of GSE22138 were obtained from Gene Expression Omnibus (GEO, https://www.ncbi.nlm.nih.gov/geo)25 containing 35 metastatic UM tissues and 28 primary uveal melanoma samples.26 The platform of GSE22138 was GPL570 [HG-U133_Plus_2] Affymetrix Human Genome U133 Plus 2.0 Array. In this study, the data of 63 tissues were analyzed; the data analysis process was presented (Figure 1A).
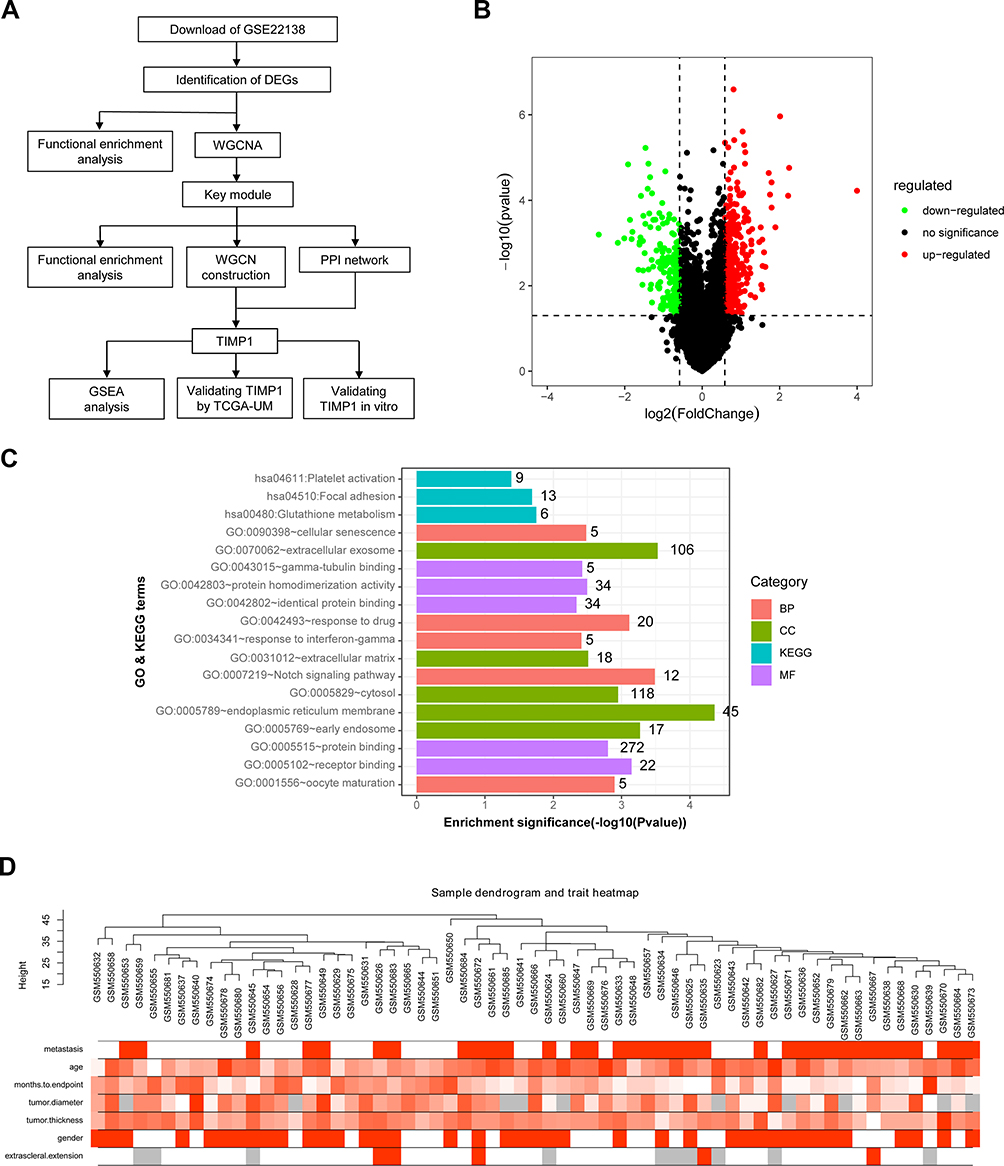 |
Figure 1 Description of the study, DEGs and clustering dendrogram of tumor samples. (A) Flow Diagram of this study. (B) Volcano plot of DEGs in GSE22138 (35 metastatic UM and 28 UM). The red dot refers to up-regulated genes, the green dot refers to down-regulated genes, and the black dot refers to unchanged genes. DEGs: differentially expressed genes. (C) GO and KEGG enrichment analysis of DEGs. (D) Sample dendrogram of 63 UM samples and their clinical characteristics. The clustering is based on DEGs data in metastatic UM samples compared to UM tissues. The color intensity was proportional to metastasis, age, months to endpoint, tumor diameter, tumor thickness, gender and extra-scleral extension. |
Data Preprocessing and DEGs Identification
The “Affy” R package was applied to preprocess the raw expression data.27 First, the raw data were background corrected and standardized by Robust Multiarray Average (RMA) analysis. Then, median polish probe sets annotated by the Affymetrix annotation files were summarized. The “Limma” R package was applied to screen the DEGs between uveal melanoma tissues with metastasis and without metastasis.28 The selection standard for identifying DEGs was |log2(fold change) |>0.585 and P value < 0.05.
GO and KEGG Pathway Enrichment Analysis of DEGs
For further insight into the underlying mechanism of the DEGs of UM, the DEGs were uploaded to the Database for Annotation, Visualization, and Integrated Discovery (DAVID).29,30 Gene ontology (GO) and Kyoto Encyclopedia of Genes and Genomes (KEGG) pathway enrichment analyses were performed using the DAVID database. P value < 0.05 was used to determine statistical significance.
Construction of Weighted Gene Co-Expression Network
The “WGCNA” package in R was used to construct a co-expression network for the 552 DEGs from 63 UM samples and the corresponding clinical data.31 First, a weighted adjacency matrix was constructed using Pearson’s correlations between gene pairs. Next, a soft threshold parameter β was chosen based on standard scale-free networks, and adjacencies of differential genes were analyzed applying a power function.32,33 Finally, a topological overlap matrix (TOM) was built based on the adjacency.
An average linkage hierarchical clustering was performed according to a TOM dissimilarity measure. The genes dendrogram was built with the parameters of a minimum size of 30. The module dendrogram and merged modules were constructed with a cut-line of 0.25.
Identification of Interesting Modules of UM
The module–trait relationship analysis was applied to calculate the correlation between module eigengenes (MEs) and clinical features. The ME was the main component of a module and reflected all the characteristics of module genes. By calculating the correlation between MEs and clinical features, the interesting modules were determined. The assessed clinical phenotypes included metastasis, age, months to endpoint, tumor diameter, tumor thickness, gender, and extra-scleral extension. The interesting module mostly correlated with the clinical phenotypes of metastasis was selected to analyze subsequently.
Hub Module Functional Analysis
Using the ClueGO (version 2.3.5) plugin in Cytoscape (version 3.6.1),34,35 which can visualize the biological terms for large clusters of genes, GO enrichment analysis of the genes in hub module was performed. ClueGO analysis was performed a threshold of P value < 0.05.
Module Visualize and Identification of Hub Genes
A gene with high interconnection with nodes in the interesting module was considered to be functionally significant. The network visualization of the interesting module was performed by Cytoscape software. Meanwhile, the Molecular Complex Detection (MCODE) plug was used to select the core network with degree cutoff = 2, node score cutoff = 0.2, k‐core = 2, and maximum depth = 100.36
Identification of Candidate Hub Genes in Key Modules
Hub genes with a high interconnective degree in a module were considered to play an important role in the network. Genes from hub module were mapped in the Search Tool for the Retrieval of Interacting Genes (STRING) database to construct protein–protein interaction (PPI) analysis.37 Further, cytoscape software was applied to establish a PPI network.35 A confidence score >0.40 was chosen as the cut-off criterion. The common hub genes chosen from co-expression network and PPI network were selected for further analysis.
Gene Set Enrichment Analysis (GSEA)
Based on the expression level of the hub gene, 63 UM samples of GSE22138 were divided into two groups. To explore the potential function of TIMP1 in the progression of UM, gene set enrichment analysis (GSEA) was conducted with the cut-off criteria of P value < 0.05.38
Kaplan–Meier Survival Analysis of TIMP1
To assess the association between the expression of TIMP1 and clinical outcomes of UM, the Gene Expression Profiling Interactive Analysis database (GEPIA, http://gepia.cancer-pku.cn/), an online database based on The Cancer Genome Atlas (TCGA), was used to analyze overall survival. UM patients were divided into low-expression and high-expression groups according to the expression level of TIMP1. The hazard ratio (HR) with 95% confidence intervals and log-rank P value were calculated.
Quantitative Real-Time Polymerase Chain Reaction (qRT-PCR)
RNA was extracted from cells with TRIzol reagent (Invitrogen, USA). The complementary DNA was synthesized by utilizing Easy Quick RT Master Mix (Cwbiotech, Beijing, China). RT-PCR was performed by applying the ABI7500 Real-time PCR System (Applied Biosystem, CA, USA) and AceQ® qPCR SYBR Green Master Mix (Vazyme, Nanjing, China). The relative expression of the target gene was calculated based on the formula 2−ΔCt with GAPDH setting as the internal control. Primer sequences of TIMP1 were 5′-CTGTTGTTGCTGTGGCTGAT −3′(Forward); 5′-AACTTGGCCCTGATGACG −3′(Reverse). Primer sequences of internal control GAPDH were 5′- TCATTGACCTCAACTACATGG −3′(Forward); 5′-TCGCTCCTGGAAGATGGTG −3′ (Reverse).
Cell Culture and Plasmid Transient Transfection
The human normal retinal pigment epithelium cell line ARPE19 and UM cell lines C918 and OCM-1 were purchased from Procell (PROCELL Life Science & Technology Co., Ltd., Wuhan, China). ARPE19 cells were cultured in F-12 supplemented with 10% fetal bovine serum (FBS; Gibco, Carlsbad, CA, USA). The UM cell lines were cultured in Roswell Park Memorial Institute 1640 (RPMI-1640; Gibco, Carlsbad, CA, USA) medium with 10% FBS. Cell lines were maintained at 37°C in a humidified 5% CO2 atmosphere. The full-length TIMP1 sequence was inserted into the pcDNA3.1 plasmid (Gentec, Shanghai, China) to build the pcDNA3.1-TIMP1 overexpression plasmid. For transfection, Lipo8000TM transfection reagent (Beyotime, Shanghai, China) was used following manufacturer’s instructions. The control group included cells transfected with empty pcDNA3.1 plasmid. Cells were transfected with 2 μg of the plasmid for 24 hours before conducting further experiments.
Cell Proliferation Assay
Cell proliferation was analyzed by applying the Cell Counting Kit-8 kit (Dojindo, Kumamoto, Japan). Cells (2×10³/well) were seeded into 96-well plates with 0.2 mL cell suspension. Cells of each well were cultivated with 0.01 mL CCK-8 solution for 2 hours before cell harvest. Cell proliferation was assessed at four time points (24, 48, 72, and 96 hours) by analyzing the absorbance at 450 nm by a microplate reader (Bio-Rad, USA).
Scratch Healing Assay
Cells were seeded into 6-well plates and cultured to form a cell monolayer with 85–95% confluence. A straight scratch wound was made at the center of each well using a 200-μL pipette tip. Wells were washed with PBS 3 times to get rid of the unattached cells and cultured in the medium without serum. A microscope was used to observe the wound healing and take photos at three time points (0, 24, and 48 hours). Scratch areas were measured by Image-J software.
Invasion Assay
A transwell chamber with a 24-well plate was applied to perform the invasion assay, and the inner membranes were covered with 25 μL of Matrigel (Becton Dickinson Bioscience) diluted by a medium. Then, 4 × 10⁴ transfected cells in 200-μL medium without serum were added to the upper, while RPMI-1640 medium with 10% FBS was added to the lower surface for 24 hours of incubation. Cells on the lower surface were fixed with methanol for 10 minutes and then stained with 0.1% crystal violet. The Matrigel and cells on the upper surface were wiped away with cotton swabs. Cells that invaded the lower surface were observed and photographed by a microscope.
Statistical Analysis
Data were expressed as mean ± standard deviation (SD). SPSS 20.0 software was used for a student T test to analyze the data between groups. A P value <0.05 was used to demonstrate a significant difference.
Results
Identifying DEGs
The RNA sequencing data of GSE22138, including 35 metastatic uveal melanoma samples and 28 uveal melanoma tissues, were analyzed. The “Limma” package of R software was used to identify DEGs, based on the threshold of |log2(fold change) |>0.585 and a P value < 0.05. A total of 552 genes were screened as DEGs, with 358 upregulated and 194 downregulated (Figure 1B).
GO and KEGG Pathway Enrichment Analysis of DEGs
To determine the function of DEGs of UM, GO and KEGG pathway enrichment analyses were conducted by DAVID database. The DEGs were enriched in biological processes (such as Notch signaling pathway, response to drug, oocyte maturation, cellular senescence, and response to interferon-gamma), cellular components (such as endoplasmic reticulum membrane, extracellular exosome, early endosome, cytosol and extracellular matrix), and molecular functions (such as receptor binding, protein binding, protein homodimerization activity, gamma-tubulin binding and identical protein binding). The KEGG pathway analysis indicated that the DEGs were mainly enriched in three pathways including glutathione metabolism, focal adhesion, and platelet activation (Figure 1C).
Construction of Weighted Gene Co-Expression Network
A co-expression network was built applying dataset GSE22138 including 63 UM samples and the corresponding clinical data. The “WGCNA” package in R was used to construct co-expression network for the 552 DEGs (Figure 1D). In this study, the power of β=8 (scale‐free R2=0.8520) was chosen to ensure a free scale network (Figure 2A). The DEGs were put into modules according to similar expression patterns by average linkage clustering, and five modules were identified completely (Figure 2B).
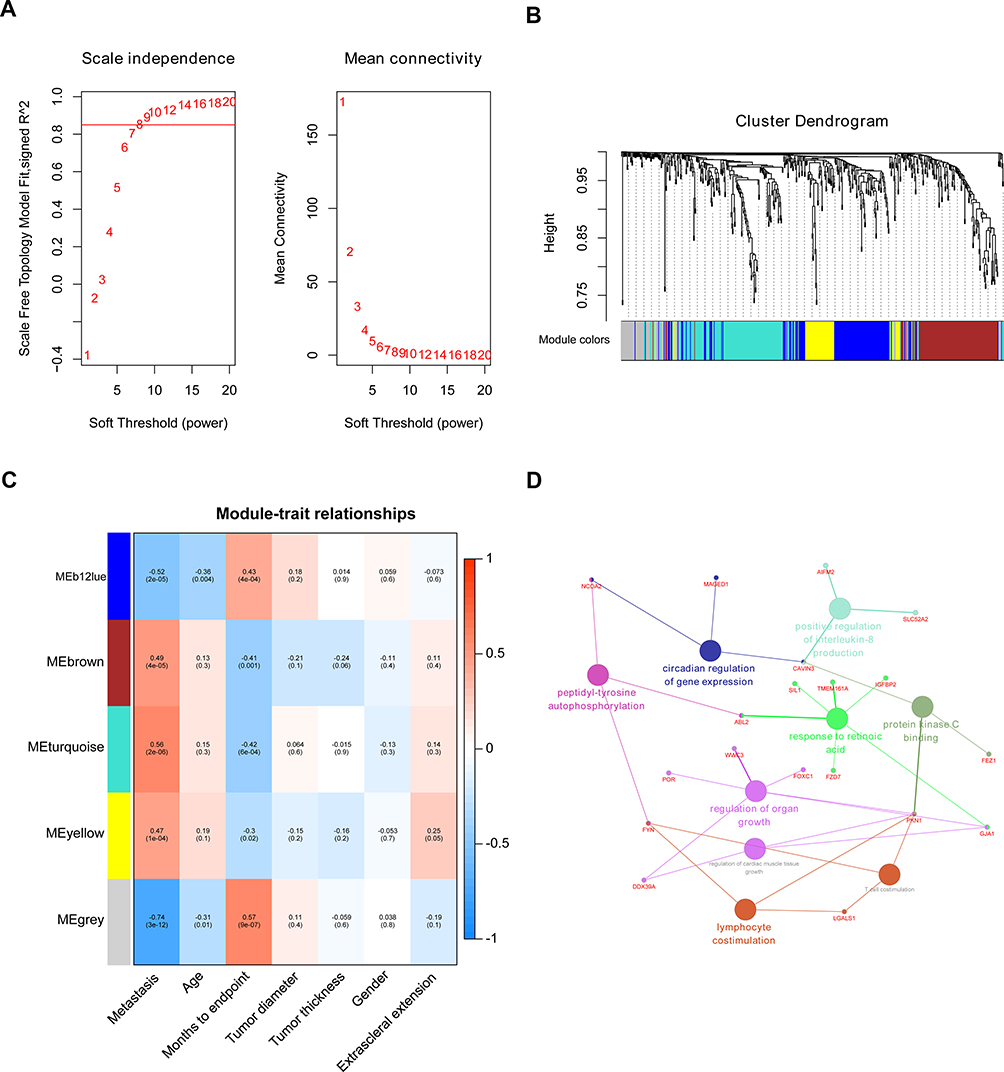 |
Figure 2 Identification of soft-thresholding power in WGCNA and modules associated with the clinical traits of UM. (A) Determination of soft-thresholding parameter in the weighted gene co-expression network analysis (WGCNA). Analysis of the scale-free fit index for various soft-thresholding powers (β) and the mean connectivity for various soft-thresholding powers. (B) Dendrogram of all DEGs clustered based on a dissimilarity measure (1-TOM). (C) Heatmap of the correlation between module eigengene and clinical traits of UM. Each cell contains the corresponding correlation and P value. (D) GO functional enrichment analysis of the genes in hub module by using ClueGO. Small nodes labeled red represent genes, big nodes represent genes GO terms. Different colors of big nodes represent the functional annotation of ontologies. |
Identification of Interesting Modules of UM
The module significantly correlated with metastasis is of great value in predicting the progression of UM. The turquoise module showed the highest correlation with metastasis (r = 0.56, P = 2e-06, Figure 2C), which was selected for further analysis.
Hub Module Functional Analysis
The GO functional enrichment analysis of the genes in hub module was performed by “ClueGO.” The results suggested that the genes in hub module are enriched in peptidyl-tyrosine autophosphorylation, circadian regulation of gene expression, positive regulation of interleukin-8 production, protein kinase C binding, response to retinoic acid, regulation of organ growth, lymphocyte costimulation, regulation of cardiac muscle tissue growth, and T cell costimulation (Figure 2D).
Module Visualize and Identification of Hub Genes
Module genes with high interconnection with nodes were considered to be functionally significant. The module was visualized by using the Cytoscape software (Figure 3A). And the core network was selected by applying plug-in MCODE (Figure 3B).
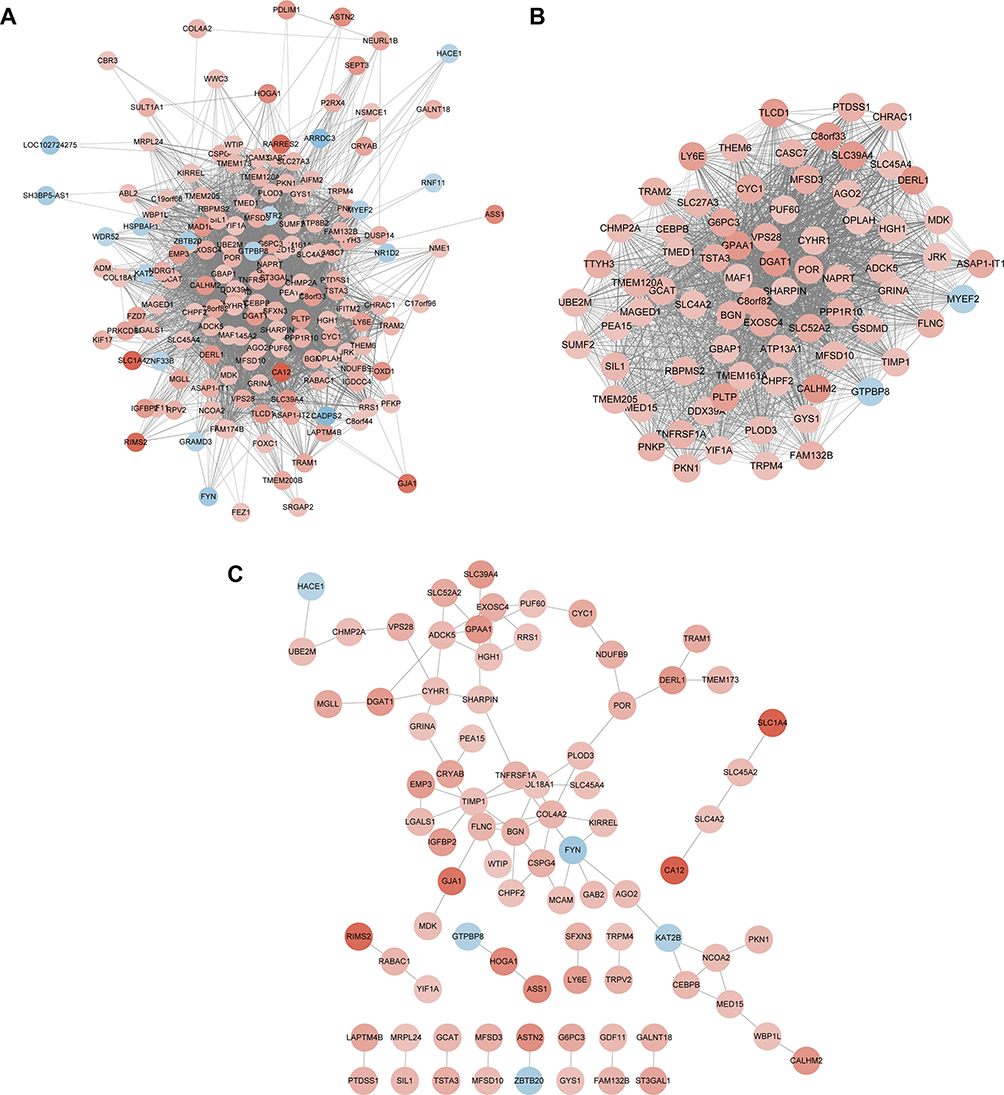 |
Figure 3 Identification of hub genes via WGCNA and PPI network. (A) The network visualization of the turquoise module by Cytoscape software. (B) The most significant module of the network by MCODE. Nodes represent genes, and node color intensity is proportional to connectivity of the gene (positive correlation in red and negative correlation in blue). (C) PPI network of genes in the turquoise module analyzed by STRING database. Nodes represent genes, and node color intensity is proportional to connectivity of the gene by degree (positive correlation in red and negative correlation in blue). |
Identification of Hub Gene in Key Module
A PPI network of genes from hub module was built using STRING database (Figure 3C). The top three hub genes were identified based on the degree of connectivity, which met the standard of both co-expression network and PPI network. They were TIMP1 (tissue inhibitor of metalloproteinase1), GPAA1 (glycosylphosphatidylinositol anchor attachment 1), and biglycan (BGN).
TIMP1 has been shown to play an important role in the progression of many types of human cancers. However, the biological function of TIMP1 in UM remains unclear. Next, the role of TIMP1 in UM cell lines was further studied.
Gene Set Enrichment Analysis
Four gene sets were enriched, including “P53 pathway,” “Myogenesis,” “Coagulation,” and “Estrogen response early” (Figure 4).
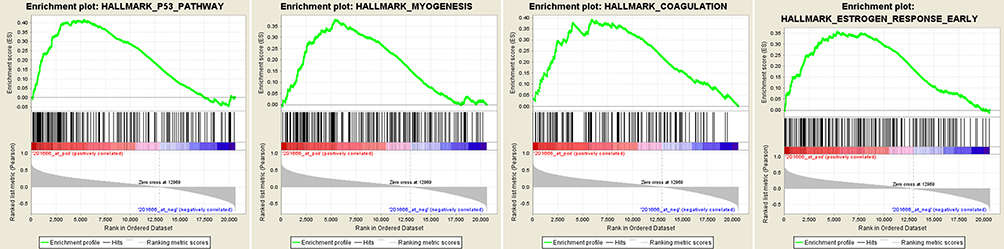 |
Figure 4 Gene set enrichment analysis (GSEA). “P53 pathway,” “Myogenesis,” “Coagulation,” and “Estrogen response early” were enriched in UM samples with highly expressed TIMP1. |
Identification of TIMP1 as a Potential Biomarker for the Worse Prognosis of UM Patients
The overall survival (OS) of UM patients with high TIMP1 expression was significantly shortened (Figure 5A). The qRT-PCR analysis indicated that the expression of TIMP1 in UM cells was significantly increased compared with ARPE19 cells (Figure 5B). To investigate the biological function of TIMP1 in UM, we established a model of TIMP1 sufficiency in UM cell lines. Overexpression of TIMP1 after transfection with plasmid was confirmed by qRT-PCR analysis in C918 and OCM-1 cells (Figure 5C). CCK-8 assay results showed that overexpression of TIMP1 significantly inhibited the proliferation of UM cells compared with the controls (Figure 5D). Scratch healing assay results revealed that overexpression of TIMP1 inhibited the migration of UM cells (Figure 5E and F). Transwell assay results indicated that there was no significant difference in the invasion of UM cells between overexpression of TIMP1 group and the empty vector group (Figure 5G and H).
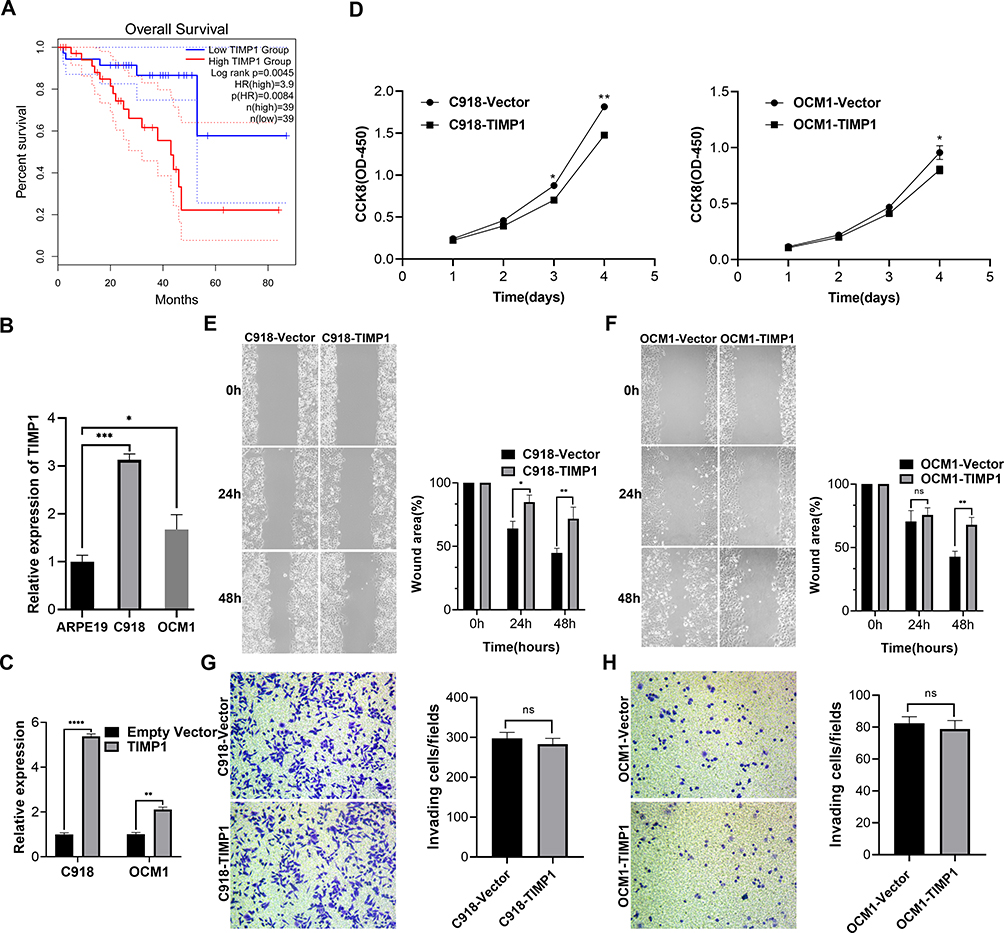 |
Figure 5 Identification of TIMP1 as a potential biomarker for the worse prognosis of patients with UM. (A) Kaplan–Meier survival curve of overall survival time for TIMP1 based on TCGA data in the GEPIA database. (B) TIMP1 expression in different UM cell lines was measured by qRT-PCR analysis. TIMP1 was up-regulated in UM cells compared with ARPE19 cells. (C) Overexpression of TIMP1 in C918 and OCM-1 cells was confirmed by qRT-PCR analysis. (D) Overexpression of TIMP1 inhibited the proliferation of UM cells assessed by CCK-8 assay. (E and F) Overexpressed TIMP1 inhibited the migration of UM cells assessed by scratch healing assay. The wound area was measured by ImageJ software. (G and H) Transwell assays revealed that overexpressed TIMP1 had no effect on UM cell invasion. Data were shown as mean ± SD. *p < 0.05; **p < 0.01; ***p < 0.001; ****p < 0.0001; ns indicates p>0.05. |
Discussion
In this study, TIMP1 is up-regulated in the metastasis progression of UM and can be a potential prognosis biomarker based on the comprehensive bioinformatics analysis. A total of 552 genes were screened as DEGs. Then, GO and KEGG pathway enrichment analyses were performed for further insight into the underlying mechanism of the DEGs. The turquoise module showed the highest correlation with metastasis of UM by applying WGCNA. Finally, the common hub gene, TIMP1, was selected from co-expression network and PPI network for further verification.
Tissue inhibitor of metalloproteinase 1 (TIMP1) is a dual-domain protein composed of a larger amino-terminal domain and a smaller carboxy terminal domain, named for the function of mediating extracellular matrix transformation by inhibiting matrix metalloproteinases (MMPs).39,40 The two main functions of TIMP1 are to regulate wound healing and participate in tumor progression.41,42
Previous studies have shown that MMPs play a central role in the process of tumor invasion and metastasis,43 and TIMP1, as an effective natural MMP inhibitor, can inhibit tumor process.42 Prior studies have shown that the high expression of TIMP1 is associated with poor prognosis of several cancer types, such as breast,44 lung,45 endometrial,46 and pancreatic cancer.47
Previous experimental studies demonstrate that overexpression of TIMP1 inhibits the tumorigenesis and migration of various types of tumors. In transgenic mouse hepatoma models, overexpression of TIMP1 inhibited T-antigen-induced hepatocyte proliferation.48 When the B16-F10 melanoma cell line is subcutaneously implanted into mice, overexpression of TIMP1 inhibits the tumor growth.49 It has been reported that overexpression of TIMP1 can increase intercellular contact and inhibit the migration of human hepatoma cells.50 Similarly, by analyzing the sequencing data of clinical specimens, our results also showed that high expression of TIMP1 is associated with poor prognosis of UM. In addition, consistent with previous experimental studies, our results showed that overexpression of TIMP1 inhibited tumorigenesis and migration of UM.
There are several possible explanations for the conflicting results observed between clinical and experimental studies. First, the degradation of extracellular matrix (ECM) is an important step in the acquisition of tumor invasion and metastasis ability.51 MMPs are involved in this important process.52 The dynamic balance between activated MMPs and free TIMP levels affects the degradation degree of ECM and thus influence tumor progression.45 Previous studies have shown that elevated MMP9 levels are associated with a higher risk of UM metastasis.53 Therefore, the increased expression of TIMPs may reflect the body’s response to tumor invasion and metastasis, in order to maintain the dynamic balance between MMP and TIMP, so as to maintain the ECM integrity.54 Second, experiments manipulating of TIMP-1 in tumor cell lines have a limited ability to explain the entire pathological process of the body. Recent studies have shown that TIMP1 has been identified as a pro-metastasis factor that creates a pre-metastasis microenvironment in the liver.55,56 Hepatic stellate cells were activated by TIMP1 via CD63 signaling and attracted neutrophils that promote metastasis,57 which greatly increases the liver’s susceptibility to circulating tumor cells.56 These findings may explain the association between increased TIMP1 levels and poor prognosis in patients with tumors.
To further explore the possible mechanism of TIMP1 in UM metastasis, we conducted GSEA analysis and found that the high expression of TIMP1 was mainly related to the p53 signaling pathway. Previous studies have shown that the p53 signaling pathway plays an important role in promoting the occurrence, apoptosis, and progression of many types of tumors.58,59 These findings suggested that TIMP1 might affect UM metastasis by regulating the p53 signaling pathway.
Conclusion
In conclusion, by constructing a co-expression network, our results showed that TIMP1 might be associated with metastasis in UM, which might have important significance for identifying patients with high risk of metastasis and predicting the prognosis of UM.
Acknowledgments
This research was supported by The Capital Health Research and Development of Special (2020-1-2052); Science & Technology Project of Beijing Municipal Science & Technology Commission (Z181100001818003); the Beijing Municipal Administration of Hospitals’ Ascent Plan (DFL20150201).
Disclosure
The authors report no conflicts of interest in this work.
References
1. Shields JA, Shields CL, De Potter P, Singh AD. Diagnosis and treatment of uveal melanoma. Semin Oncol. 1996;23(6):763–767.
2. Diener-West M, Reynolds SM, Agugliaro DJ, et al. Development of metastatic disease after enrollment in the COMS trials for treatment of choroidal melanoma: collaborative Ocular Melanoma Study Group Report No. 26. Arch Ophthalmol. 2005;123(12):1639–1643. doi:10.1001/archopht.123.12.1639
3. Carvajal RD, Schwartz GK, Tezel T, Marr B, Francis JH, Nathan PD. Metastatic disease from uveal melanoma: treatment options and future prospects. Br J Ophthalmol. 2017;101(1):38–44. doi:10.1136/bjophthalmol-2016-309034
4. Nichols EE, Richmond A, Daniels AB. Tumor characteristics, genetics, management, and the risk of metastasis in uveal melanoma. Semin Ophthalmol. 2016;31(4):304–309. doi:10.3109/08820538.2016.1154175
5. Augsburger JJ, Gamel JW. Clinical prognostic factors in patients with posterior uveal malignant melanoma. Cancer. 1990;66(7):1596–1600. doi:10.1002/1097-0142(19901001)66:7<1596::aid-cncr2820660726>3.0.co;2-6
6. Shields CL, Furuta M, Thangappan A, et al. Metastasis of uveal melanoma millimeter-by-millimeter in 8033 consecutive eyes. Arch Ophthalmol. 2009;127(8):989–998. doi:10.1001/archophthalmol.2009.208
7. Ewens KG, Kanetsky PA, Richards-Yutz J, et al. Chromosome 3 status combined with BAP1 and EIF1AX mutation profiles are associated with metastasis in uveal melanoma. Invest Ophthalmol Vis Sci. 2014;55(8):5160–5167. doi:10.1167/iovs.14-14550
8. Field MG, Harbour JW. Recent developments in prognostic and predictive testing in uveal melanoma. Curr Opin Ophthalmol. 2014;25(3):234–239. doi:10.1097/ICU.0000000000000051
9. Onken MD, Worley LA, Ehlers JP, Harbour JW. Gene expression profiling in uveal melanoma reveals two molecular classes and predicts metastatic death. Cancer Res. 2004;64(20):7205–7209. doi:10.1158/0008-5472.CAN-04-1750
10. Onken MD, Ehlers JP, Worley LA, Makita J, Yokota Y, Harbour JW. Functional gene expression analysis uncovers phenotypic switch in aggressive uveal melanomas. Cancer Res. 2006;66(9):4602–4609. doi:10.1158/0008-5472.CAN-05-4196
11. Woodward JK, Elshaw SR, Murray AK, et al. Stimulation and inhibition of uveal melanoma invasion by HGF, GRO, IL-1alpha and TGF-beta. Invest Ophthalmol Vis Sci. 2002;43(10):3144–3152.
12. Peruzzi B, Bottaro DP. Targeting the c-Met signaling pathway in cancer. Clin Cancer Res. 2006;12(12):3657–3660. doi:10.1158/1078-0432.CCR-06-0818
13. All-Ericsson C, Girnita L, Seregard S, Bartolazzi A, Jager MJ, Larsson O. Insulin-like growth factor-1 receptor in uveal melanoma: a predictor for metastatic disease and a potential therapeutic target. Invest Ophthalmol Vis Sci. 2002;43(1):1–8.
14. Economou MA, All-Ericsson C, Bykov V, et al. Receptors for the liver synthesized growth factors IGF-1 and HGF/SF in uveal melanoma: intercorrelation and prognostic implications. Acta Ophthalmol. 2008;86 Thesis 4:20–25. doi:10.1111/j.1755-3768.2008.01182.x
15. Li H, Yang W, Chen PW, Alizadeh H, Niederkorn JY. Inhibition of chemokine receptor expression on uveal melanomas by CXCR4 siRNA and its effect on uveal melanoma liver metastases. Invest Ophthalmol Vis Sci. 2009;50(12):5522–5528. doi:10.1167/iovs.09-3804
16. Franco R, Botti G, Mascolo M, et al. CXCR4-CXCL12 and VEGF correlate to uveal melanoma progression. Front Biosci (Elite Ed). 2010;2:13–21. doi:10.2741/e60
17. Hu Y, He C, Liu JP, et al. Analysis of key genes and signaling pathways involved in Helicobacter pylori-associated gastric cancer based on The Cancer Genome Atlas database and RNA sequencing data. Helicobacter. 2018;23(5):e12530. doi:10.1111/hel.12530
18. Wang J, Dean DC, Hornicek FJ, Shi H, Duan Z. RNA sequencing (RNA-Seq) and its application in ovarian cancer. Gynecol Oncol. 2019;152(1):194–201. doi:10.1016/j.ygyno.2018.10.002
19. Cree IA. Cell cycle and melanoma–two different tumours from the same cell type. J Pathol. 2000;191(2):112–114. doi:10.1002/(SICI)1096-9896(200006)191:2<112::AID-PATH592>3.0.CO;2-N
20. Mallikarjuna K, Pushparaj V, Biswas J, Krishnakumar S. Expression of epidermal growth factor receptor, ezrin, hepatocyte growth factor, and c-Met in uveal melanoma: an immunohistochemical study. Curr Eye Res. 2007;32(3):281–290. doi:10.1080/02713680601161220
21. Giulietti M, Righetti A, Principato G, Piva F. LncRNA co-expression network analysis reveals novel biomarkers for pancreatic cancer. Carcinogenesis. 2018;39(8):1016–1025. doi:10.1093/carcin/bgy069
22. Ni L, Yuan C, Zhang C, et al. Co-expression network analysis identified LTF in association with metastasis risk and prognosis in clear cell renal cell carcinoma. Onco Targets Ther. 2020;13:6975–6986. doi:10.2147/OTT.S251000
23. Liu J, Wu Z, Sun R, et al. Using mRNAsi to identify prognostic-related genes in endometrial carcinoma based on WGCNA [published online ahead of print, 2020 Aug 10]. Life Sci. 2020;258:118231. doi:10.1016/j.lfs.2020.118231
24. Zheng JN, Li Y, Yan YM, et al. Identification and validation of key genes associated with systemic sclerosis-related pulmonary hypertension. Front Genet. 2020;11:816. doi:10.3389/fgene.2020.00816
25. Barrett T, Troup DB, Wilhite SE, et al. NCBI GEO: archive for functional genomics data sets–10 years on. Nucleic Acids Res. 2011;39(Databaseissue):D1005–D1010. doi:10.1093/nar/gkq1184
26. Laurent C, Valet F, Planque N, et al. High PTP4A3 phosphatase expression correlates with metastatic risk in uveal melanoma patients. Cancer Res. 2011;71(3):666–674. doi:10.1158/0008-5472.CAN-10-0605
27. Gautier L, Cope L, Bolstad BM, Irizarry RA. Affy–analysis of Affymetrix GeneChip data at the probe level. Bioinformatics. 2004;20(3):307–315. doi:10.1093/bioinformatics/btg405
28. Ritchie ME, Phipson B, Wu D, et al. limma powers differential expression analyses for RNA-sequencing and microarray studies. Nucleic Acids Res. 2015;43(7):e47. doi:10.1093/nar/gkv007
29. Dennis G
30. Sherman BT, da Huang W, Tan Q, et al. DAVID Knowledgebase: a gene-centered database integrating heterogeneous gene annotation resources to facilitate high-throughput gene functional analysis. BMC Bioinform. 2007;8:426. doi:10.1186/1471-2105-8-426
31. Langfelder P, Horvath S. WGCNA: an R package for weighted correlation network analysis. BMC Bioinform. 2008;9:559. doi:10.1186/1471-2105-9-559
32. Clarke C, Madden SF, Doolan P, et al. Correlating transcriptional networks to breast cancer survival: a large-scale coexpression analysis. Carcinogenesis. 2013;34(10):2300–2308. doi:10.1093/carcin/bgt208
33. Botía JA, Vandrovcova J, Forabosco P, et al. An additional k-means clustering step improves the biological features of WGCNA gene co-expression networks. BMC Syst Biol. 2017;11(1):47. doi:10.1186/s12918-017-0420-6
34. Bindea G, Mlecnik B, Hackl H, et al. ClueGO: a Cytoscape plug-in to decipher functionally grouped gene ontology and pathway annotation networks. Bioinformatics. 2009;25(8):1091–1093. doi:10.1093/bioinformatics/btp101
35. Shannon P, Markiel A, Ozier O, et al. Cytoscape: a software environment for integrated models of biomolecular interaction networks. Genome Res. 2003;13(11):2498–2504. doi:10.1101/gr.1239303
36. Bader GD, Hogue CW. An automated method for finding molecular complexes in large protein interaction networks. BMC Bioinform. 2003;4:2. doi:10.1186/1471-2105-4-2
37. Szklarczyk D, Franceschini A, Wyder S, et al. STRING v10: protein-protein interaction networks, integrated over the tree of life. Nucleic Acids Res. 2015;43(Database issue):D447–D452. doi:10.1093/nar/gku1003
38. Subramanian A, Tamayo P, Mootha VK, et al. Gene set enrichment analysis: a knowledge-based approach for interpreting genome-wide expression profiles. Proc Natl Acad Sci U S A. 2005;102(43):15545–15550. doi:10.1073/pnas.0506580102
39. Gomis-Rüth FX, Maskos K, Betz M, et al. Mechanism of inhibition of the human matrix metalloproteinase stromelysin-1 by TIMP-1. Nature. 1997;389(6646):77–81. doi:10.1038/37995
40. Murphy G. Tissue inhibitors of metalloproteinases. Genome Biol. 2011;12(11):233. doi:10.1186/gb-2011-12-11-233
41. Caley MP, Martins VL, O’Toole EA. Metalloproteinases and wound healing. Adv Wound Care (New Rochelle). 2015;4(4):225–234. doi:10.1089/wound.2014.0581
42. Cruz-Munoz W, Khokha R. The role of tissue inhibitors of metalloproteinases in tumorigenesis and metastasis. Crit Rev Clin Lab Sci. 2008;45(3):291–338. doi:10.1080/10408360801973244
43. Egeblad M, Werb Z. New functions for the matrix metalloproteinases in cancer progression. Nat Rev Cancer. 2002;2(3):161–174. doi:10.1038/nrc745
44. Schrohl AS, Holten-Andersen MN, Peters HA, et al. Tumor tissue levels of tissue inhibitor of metalloproteinase-1 as a prognostic marker in primary breast cancer. Clin Cancer Res. 2004;10(7):2289–2298. doi:10.1158/1078-0432.ccr-03-0360
45. Gouyer V, Conti M, Devos P, et al. Tissue inhibitor of metalloproteinase 1 is an independent predictor of prognosis in patients with nonsmall cell lung carcinoma who undergo resection with curative intent. Cancer. 2005;103(8):1676–1684. doi:10.1002/cncr.20965
46. Honkavuori M, Talvensaari-Mattila A, Puistola U, Turpeenniemi-Hujanen T, Santala M. High serum TIMP-1 is associated with adverse prognosis in endometrial carcinoma. Anticancer Res. 2008;28(5A):2715–2719.
47. Roy R, Zurakowski D, Wischhusen J, et al. Urinary TIMP-1 and MMP-2 levels detect the presence of pancreatic malignancies. Br J Cancer. 2014;111(9):1772–1779. doi:10.1038/bjc.2014.462
48. Martin DC, Rüther U, Sanchez-Sweatman OH, Orr FW, Khokha R. Inhibition of SV40 T antigen-induced hepatocellular carcinoma in TIMP-1 transgenic mice. Oncogene. 1996;13(3):569–576.
49. Khokha R. Suppression of the tumorigenic and metastatic abilities of murine B16-F10 melanoma cells in vivo by the overexpression of the tissue inhibitor of the metalloproteinases-1. J Natl Cancer Inst. 1994;86(4):299–304. doi:10.1093/jnci/86.4.299
50. Roeb E, Winograd R, Breuer B, Nguyen H, Matern S. Increased TIMP-1 activity results in increased expression of gelatinases and altered cell motility. J Cell Biochem. 1999;75(2):346–355. doi:10.1002/(SICI)1097-4644(19991101)75:2<346::AID-JCB16>3.0.CO;2-5
51. Liotta LA, Kohn EC. The microenvironment of the tumour-host interface. Nature. 2001;411(6835):375–379. doi:10.1038/35077241
52. Deryugina EI, Quigley JP. Matrix metalloproteinases and tumor metastasis. Cancer Metastasis Rev. 2006;25(1):9–34. doi:10.1007/s10555-006-7886-9
53. El-Shabrawi Y, Ardjomand N, Radner H, Ardjomand N. MMP-9 is predominantly expressed in epithelioid and not spindle cell uveal melanoma. J Pathol. 2001;194(2):201–206. doi:10.1002/1096-9896(200106)194:2<201::AID-PATH840>3.0.CO;2-O
54. Airola K, Karonen T, Vaalamo M, et al. Expression of collagenases-1 and −3 and their inhibitors TIMP-1 and −3 correlates with the level of invasion in malignant melanomas. Br J Cancer. 1999;80(5–6):733–743. doi:10.1038/sj.bjc.6690417
55. Kopitz C, Gerg M, Bandapalli OR, et al. Tissue inhibitor of metalloproteinases-1 promotes liver metastasis by induction of hepatocyte growth factor signaling. Cancer Res. 2007;67(18):8615–8623. doi:10.1158/0008-5472.CAN-07-0232
56. Seubert B, Grünwald B, Kobuch J, et al. Tissue inhibitor of metalloproteinases (TIMP)-1 creates a premetastatic niche in the liver through SDF-1/CXCR4-dependent neutrophil recruitment in mice. Hepatology. 2015;61(1):238–248. doi:10.1002/hep.27378
57. Grünwald B, Harant V, Schaten S, et al. Pancreatic premalignant lesions secrete tissue inhibitor of metalloproteinases-1, which activates hepatic stellate cells via CD63 signaling to create a premetastatic niche in the liver. Gastroenterology. 2016;151(5):1011–1024.e7. doi:10.1053/j.gastro.2016.07.043
58. Xiao S, Zhou Y, Yi W, et al. Fra-1 is downregulated in cervical cancer tissues and promotes cervical cancer cell apoptosis by p53 signaling pathway in vitro. Int J Oncol. 2015;46(4):1677–1684. doi:10.3892/ijo.2015.2873
59. Tsai LH, Chen PM, Cheng YW, et al. LKB1 loss by alteration of the NKX2-1/p53 pathway promotes tumor malignancy and predicts poor survival and relapse in lung adenocarcinomas. Oncogene. 2014;33(29):3851–3860. doi:10.1038/onc.2013.353
 © 2020 The Author(s). This work is published and licensed by Dove Medical Press Limited. The
full terms of this license are available at https://www.dovepress.com/terms
and incorporate the Creative Commons Attribution
- Non Commercial (unported, 3.0) License.
By accessing the work you hereby accept the Terms. Non-commercial uses of the work are permitted
without any further permission from Dove Medical Press Limited, provided the work is properly
attributed. For permission for commercial use of this work, please see paragraphs 4.2 and 5 of our Terms.
© 2020 The Author(s). This work is published and licensed by Dove Medical Press Limited. The
full terms of this license are available at https://www.dovepress.com/terms
and incorporate the Creative Commons Attribution
- Non Commercial (unported, 3.0) License.
By accessing the work you hereby accept the Terms. Non-commercial uses of the work are permitted
without any further permission from Dove Medical Press Limited, provided the work is properly
attributed. For permission for commercial use of this work, please see paragraphs 4.2 and 5 of our Terms.