Back to Journals » Pharmacogenomics and Personalized Medicine » Volume 14
Identification of Underlying Hub Genes Associated with Hypertrophic Cardiomyopathy by Integrated Bioinformatics Analysis
Authors Ma Z, Wang X, Lv Q, Gong Y, Xia M, Zhuang L, Lu X, Yang Y, Zhang W, Fu G, Ye Y, Lai D
Received 18 April 2021
Accepted for publication 3 June 2021
Published 12 July 2021 Volume 2021:14 Pages 823—837
DOI https://doi.org/10.2147/PGPM.S314880
Checked for plagiarism Yes
Review by Single anonymous peer review
Peer reviewer comments 2
Editor who approved publication: Dr Martin H Bluth
Zetao Ma,1,2,* Xizhi Wang,1,* Qingbo Lv,1 Yingchao Gong,1 Minghong Xia,1 Lenan Zhuang,1 Xue Lu,1 Ying Yang,1 Wenbin Zhang,1 Guosheng Fu,1 Yang Ye,1 Dongwu Lai1
1Key Laboratory of Cardiovascular Intervention and Regenerative Medicine of Zhejiang Province, Department of Cardiology, Sir Run Run Shaw Hospital, Zhejiang University School of Medicine, Hangzhou, Zhejiang Province, 310016, People’s Republic of China; 2Department of Cardiology, Zhongshan People’s Hospital, Zhongshan, Guangdong Province, 528403, People’s Republic of China
*These authors contributed equally to this work
Correspondence: Dongwu Lai; Yang Ye
Key Laboratory of Cardiovascular Intervention and Regenerative Medicine of Zhejiang Province, Department of Cardiology, Sir Run Run Shaw Hospital, Zhejiang University School of Medicine, 3 East Qingchun Road, Hangzhou, Zhejiang Province, 310016, People’s Republic of China
Tel +86-571-86006241
Fax +86-571-86006246
Email [email protected]; [email protected]
Background: Considered as one of the major reasons of sudden cardiac death, hypertrophic cardiomyopathy (HCM) is a common inherited cardiovascular disease. However, effective treatment for HCM is still lacking. Identification of hub gene may be a powerful tool for discovering potential therapeutic targets and candidate biomarkers.
Methods: We analysed three gene expression datasets for HCM from the Gene Expression Omnibus. Two of them were merged by “sva” package. The merged dataset was used for analysis while the other dataset was used for validation. Following this, a weighted gene coexpression network analysis (WGCNA) was performed, and the key module most related to HCM was identified. Based on the intramodular connectivity, we identified the potential hub genes. Then, a receiver operating characteristic curve analysis was performed to verify the diagnostic values of hub genes. Finally, we validated changes of hub genes, for genetic transcription and protein expression levels, in datasets of HCM patients and myocardium of transverse aortic constriction (TAC) mice.
Results: In the merged dataset, a total of 455 differentially expressed genes (DEGs) were identified from normal and hypertrophic myocardium. In WGCNA, the blue module was identified as the key module and the genes in this module showed a high positive correlation with HCM. Functional enrichment analysis of DEGs and key module revealed that the extracellular matrix, fibrosis, and neurohormone pathways played important roles in HCM. FRZB, COL14A1, CRISPLD1, LUM, and sFRP4 were identified as hub genes in the key module. These genes showed a good predictive value for HCM and were significantly up-regulated in HCM patients and TAC mice. We also found protein expression of LUM and sFRP4 increased in myocardium of TAC mice.
Conclusion: This study revealed that five hub genes are involved in the occurrence and development of HCM, and they are potentially to be used as therapeutic targets and biomarkers for HCM.
Keywords: hypertrophic cardiomyopathy, HCM, weighted gene coexpression network analysis, WGCNA, hub gene, biomarkers, bioinformatics analysis
Introduction
As a common inherited cardiovascular disease, hypertrophic cardiomyopathy (HCM) is still an unsolved clinical problem. Previous studies have reported that HCM is caused by more than 1,440 mutations in 11 or more genes encoding cardiac sarcomeric proteins.1–3 Sarcomere mutations in the two most common genes, β-myosin heavy chain (MYH7) and myosin-binding protein C3, have been found in approximately 70% of the genotyped patients.4 However, genetic defects that cause HCM have only be identified in less than 50% of the clinically diagnosed probands.3 Thus, the complex pathogenesis of HCM has not been elucidated yet. HCM is a heterogeneous heart disease, and its prevalence is at least 1 in 500 people (0.2%) in the general population.3,5 Its symptoms include exercise intolerance, angina, dyspnea, syncope, heart failure, atrial fibrillation, embolic stroke, and sudden death.6 The current treatment strategies for HCM mainly include improving the symptoms and preventing sudden death, and no specific treatment exists.7,8 Discovery of hub genes in the occurrence and development of HCM may facilitate the discovery of specific therapeutic targets and candidate biomarkers.
Presently, systems biology has been applied to the study of multiple diseases.9–11 Among them, the weighted gene coexpression network analysis (WGCNA) identifies candidate biomarkers and therapeutic targets by finding gene clusters having a high correlation with the phenotype.12–15 In this study, we used multiple independent gene expression datasets from the Gene Expression Omnibus (GEO) database to discover potential therapeutic targets and candidate biomarkers for HCM. First, we merged two independent datasets and performed differential expression analysis. Subsequently, we utilized WGCNA to search the gene coexpression modules highly related to HCM, and we performed gene annotation to identify their functions. Finally, we identified five hub genes, namely FRZB, COL14A1, CRISPLD1, LUM, and sFRP4, in the key module, and we validated the expression changes and diagnostic values of hub genes by using another dataset and animal model.
Materials and Methods
Data Collection
The RNA expression profiles of GSE133054, GSE141910, and GSE36961 were downloaded from the GEO database (http://www.ncbi.nlm.nih.gov/geo/). The expression profiling of GSE133054, which includes 8 normal cardiac tissues and 8 HCM cardiac tissues, was performed using high throughput sequencing. The expression profiling of GSE141910, which contains cardiac tissues from health donors and patients with cardiomyopathies, was performed using high throughput sequencing. And we downloaded the expression data of 28 normal and 28 HCM cardiac tissues. The expression profiling of GSE36961, which includes 39 normal cardiac tissues and 106 HCM cardiac tissues, was performed using array.
Preprocessing of Data and Screening of Differentially Expressed Genes (DEGs)
In this study, we used R version 3.6.1 for analysis. The GSE133054 dataset is the expression matrix of raw gene counts, and the voom function in “limma” package was used to normalize the dataset.16 The downloaded GSE141910 dataset was also normalized using the voom function in limma. The GSE36961 dataset was normalized by Fastlo normalization and log2 transformation.17
We merged the GSE133054 and GSE141910 datasets and used the “sva” package to correct the batch effect.18 Two-dimensional principal component analysis (PCA) cluster plots were used to show the sample distribution before and after correction. The merged dataset was used for further analysis. DEGs were screened using the “limma” package,16 the cutoff criteria were set as adjusted P < 0.05 and |log2-fold change (log2 FC)| ≥ 1. The volcano map and heatmap were used to demonstrate the differential expression of DEGs.
Enrichment Analyses of the Gene Ontology (GO) and Kyoto Encyclopedia of Genes and Genomes (KEGG) pathways
The “clusterProfiler” package was used to perform functional enrichment analysis.19 Adjusted P < 0.05 was considered statistically significant, and the enrichment terms were sorted according to gene counts.
Coexpression Network Construction
The top 25% (3670 genes) of the variance in the merged dataset were selected for co-expression network analysis. The “WGCNA” package version 1.68 in R software was used to construct the co-expression network.20,21 Adjacency coefficient (aij) was calculated as follows:
aij = Sβij, Sij = |cor(xi,xj)|
Where xi and xj are vectors of expression value for genes i and j; cor represents Pearson’s correlation coefficient of the two vectors; and aij is adjacency coefficient, which is acquired via exponential transform of Sij.
The WGCNA method takes topological properties into consideration in order to identify modules from a gene co-expression network. Therefore, this method not only considers the relationship between two connected nodes, but also takes associated genes into account. Weighting coefficient (Wij) is calculated from aij as follows:
Wij = (lij + aij)/ (min{ki, kj} + 1 - aij), lij = ∑uaiu auj, kj = ∑uaiu
Where u represents common genes linked gene i and gene j together; aiu, the connection coefficient of gene i and gene u; and auj, the connection coefficient of gene u and gene j. Wij considers overlapping between neighbor genes of genes i and j. Modules were identified via hierarchical clustering of weighting coefficient matrix W.
Sample clustering to detect outliers in the samples. An appropriate soft threshold was selected to ensure scale-free topology (R2>0.9). The topological overlap matrix (TOM) was constructed to measure the network connectivity of the genes. Genes with similar patterns were clustered into the same modules (minimum size =30) using average linkage hierarchical clustering. The relationships between phenotypes and modules were calculated to identify highly related modules. Finally, the highly correlated modules were analysed to explore their potential roles. In addition, the gene expression profiles of the highly correlated modules were visualised using the R software.
Identification of Hub Genes
The intramodular connectivity (IC) represents the connection strength between genes in the module, and the genes with higher IC are more important in the module. Therefore, we identified the genes with high IC as hub genes. Cytoscape version 3.7.2 was used for visualization.22
Validation of the Hub Genes in Datasets and Analysis of the Receiver Operating Characteristic (ROC) Curve
The expression data of hub genes extracted from the merged dataset and verification dataset GSE36961 were utilized to validate the differential expression of hub genes in HCM. The “glmnet” package was used to construct a logistic regression model for hub genes.23 Additionally, the merged dataset was used as a training set to construct the model while GSE36961 was used for external validation. Subsequently, we used the “pROC” package to perform ROC curve analysis.24
Transverse Aortic Constriction (TAC)
A pressure-overloaded cardiac hypertrophy model was constructed using TAC. Briefly, 8–10-week-old C57BL/6 mice were anesthetised with 0.3% intraperitoneal pentobarbital. A minimally invasive incision was performed at the junction of sternum and the upper edge of left second rib with the help of a stereo microscope. After separating the adjacent tissue around the aortic arch, a 6/0 silk suture was threaded under the aortic arch, and it was tied over a 27-gauge needle. When the needle was removed, the model was successfully made. The sham group underwent the same procedure without the banding of aortic arch. The animal procedures were performed under a project license (NO.: SRRSH20201215) granted by institutional ethics committee of Sir Run Run Shaw Hospital, in compliance with institutional guidelines for the care and use of animals.
Histology
After 4 weeks of TAC, the hearts were harvested and fixed in 4% paraformaldehyde. Subsequently, the hearts were cut into 4 mm slices after dehydration and paraffin embedding. The Masson’s trichrome staining was conducted for observing the collagen deposition in the heart.
Total RNA Isolation and Quantitative Real-Time Polymerase Chain Reaction (qRT-PCR)
Total RNA from the sham and TAC-operated hearts was extracted using ultrapure RNA kit (CWBio, Beijing, China). The obtained mRNA was reverse transcribed to cDNA using the PrimeScriptTM RT Master Mix (Dalian, China). Following this, each 384-well plate was mixed with 10 ng cDNA, 5 µL qPCR SYBR Mix (Yeason, China), 3 µL ddH2O, and 1 µL primer. The primer sequences were provided in Supplementary Table 5.
Western Blot
Proteins were lysed from myocardium of sham and TAC mice. The lysate was resolved on 8–12% sodium dodecyl sulfate/polyacrylamide gel electrophoresis (SDS/PAGE), transferred to nitrocellulose membrane, and immunoblotted with the indicated antibodies as following, anti-FRZB (Bioss, bs-16185R), anti-Lumican (Ablonal, A11593), anti-Collagen XIV alpha 1 (Affinity, AF0573), Anti-SFRP4 (Proteintech, 15328-1-ap), Anti-CRISP10 (Bioss, bs-14060R), anti-RCAN (Sigma D6694).
Statistical Analysis
Most bioinformatic analyses were performed using R with default statistical settings and cutoff values specified in the individual method sections. Measurement data were expressed as mean ± standard deviation (Mean ± SD) and analyzed by unpaired Student’s t-test. P < 0.05 was considered statistically significant.
Results
Preprocessing of Data and Identification of DEGs
First, the GSE133054 and GSE141910 expression matrices were merged. The merged dataset included 36 normal cardiac samples and 36 HCM cardiac samples. Following this, the inter-batch difference was removed using the “sva” package. The sample distribution before and after eliminating the batch effect was shown in the two-dimensional PCA cluster diagram (Figure 1A, B). The results indicate an elimination of batch difference. GSE36961 was used as the validation dataset.
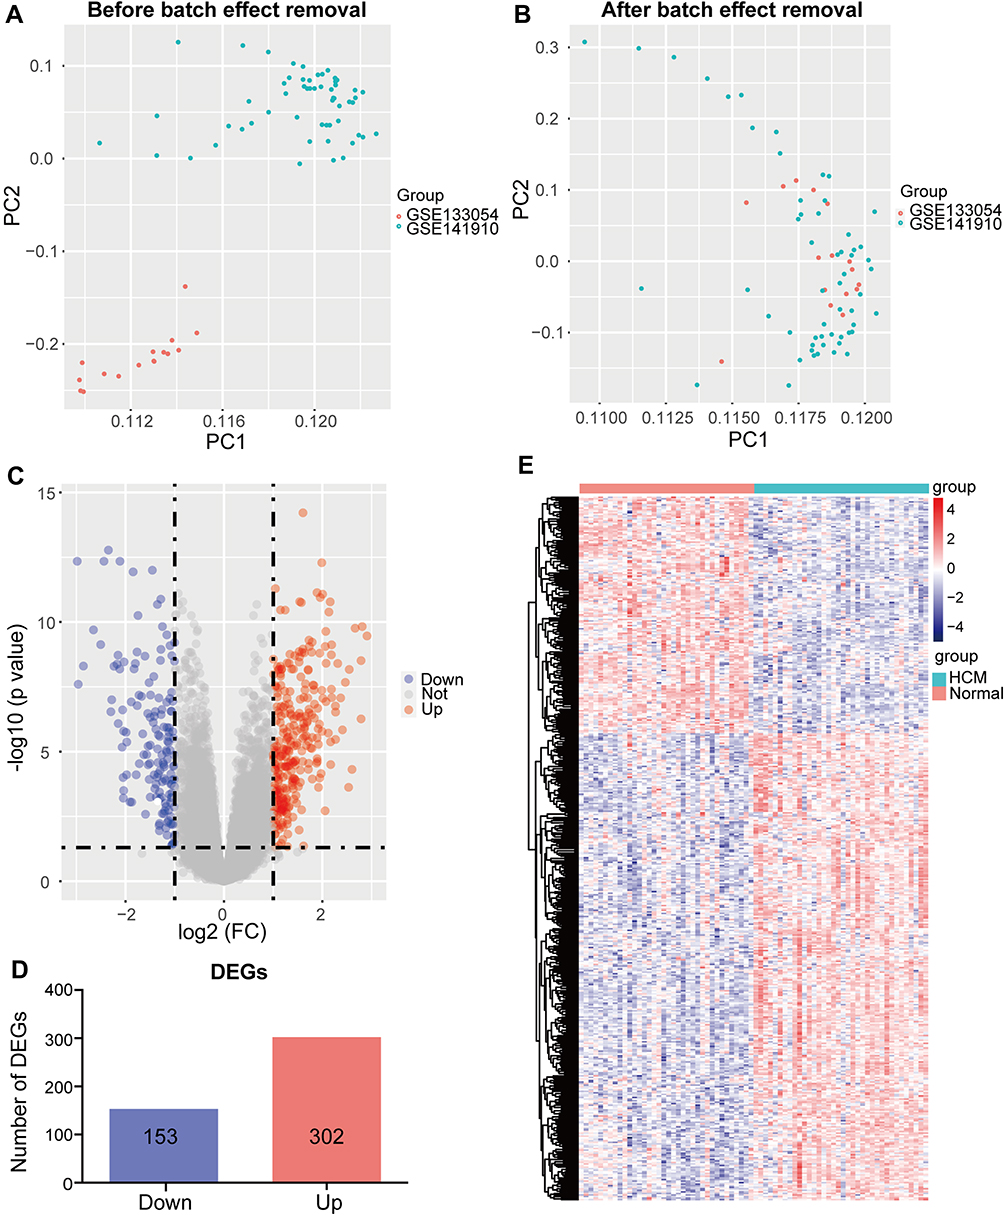 |
Figure 1 Merging of datasets and differential expression analysis. (A, B) Two-dimensional principal component analysis cluster plot before and after merging GSE133054 and GSE141910. (C) Volcano plot of 455 DEGs. (D) The number of DEGs filtered using limma according to the cutoff criteria [adjusted P value < 0.05, |log2 FC| ≥ 1]. (E) Heatmap of all DEGs. Abbreviations: Normal, normal myocardial tissue; HCM, hypertrophic cardiomyopathy myocardial tissue; DEGs, differentially expressed genes; FC, fold change. |
In the differential expression analysis, we identified 455 DEGs, including 302 upregulated genes and 153 downregulated genes [adjusted P value < 0.05, |log2 FC| ≥ 1, Figure 1C, D]. Hierarchical clustering analysis showed that the expression levels of DEGs were significantly different (Figure 1E).
Functional Enrichment Analysis of DEGs
The functional categories of GO terms include biological process (BP), cellular component (CC), and molecular function (MF). The most enriched BP terms were associated with extracellular structural organization, extracellular matrix organization, regulation of neurotransmitter levels, regulation of blood circulation, and heart contraction. The most enriched CC terms were mainly associated with extracellular matrix, collagen-containing extracellular matrix, and endoplasmic reticulum lumen. As for MF, DEGs were mainly associated with receptor regulator activity, cation transmembrane transporter activity, and extracellular matrix structural constituent (Figure 2A). Detailed information is listed in Supplementary Table 1.
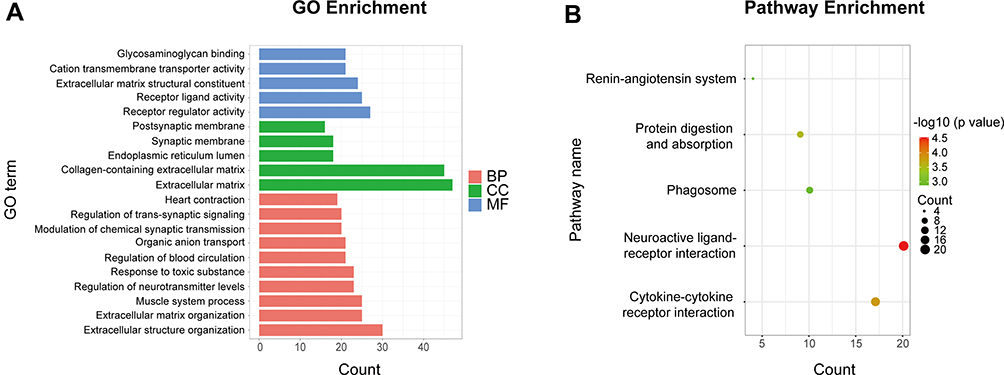 |
Figure 2 Enrichment analyses of DEGs. (A) GO enrichment analysis of DEGs. (B) KEGG pathway enrichment analysis of DEGs. Abbreviations: DEGs, differentially expressed genes; GO, Gene Ontology; KEGG, Kyoto Encyclopedia of Genes and Genomes; BP, biological process; CC, cellular component; MF, molecular function. |
In KEGG pathway enrichment analysis, the DEGs were mainly enriched in neuroactive ligand-receptor interaction, cytokine-cytokine receptor interaction, phagosome, protein digestion and absorption, and renin-angiotensin system (Figure 2B). Detailed information is listed in Supplementary Table 2.
Construction of Weighted Coexpression Network and Identification of Key Modules
The 72 samples were clustered using the “hclust” function in the “WGCNA” package to detect outliers (cutHeight = 110, Figure 3A). Therefore, the expression profiles of N14, N18, N29, H18, H22, H33, H35, and H36 were excluded from the following analyses. Soft-threshold β = 7 was used to construct a gene coexpression network. (Figure 3B and C).
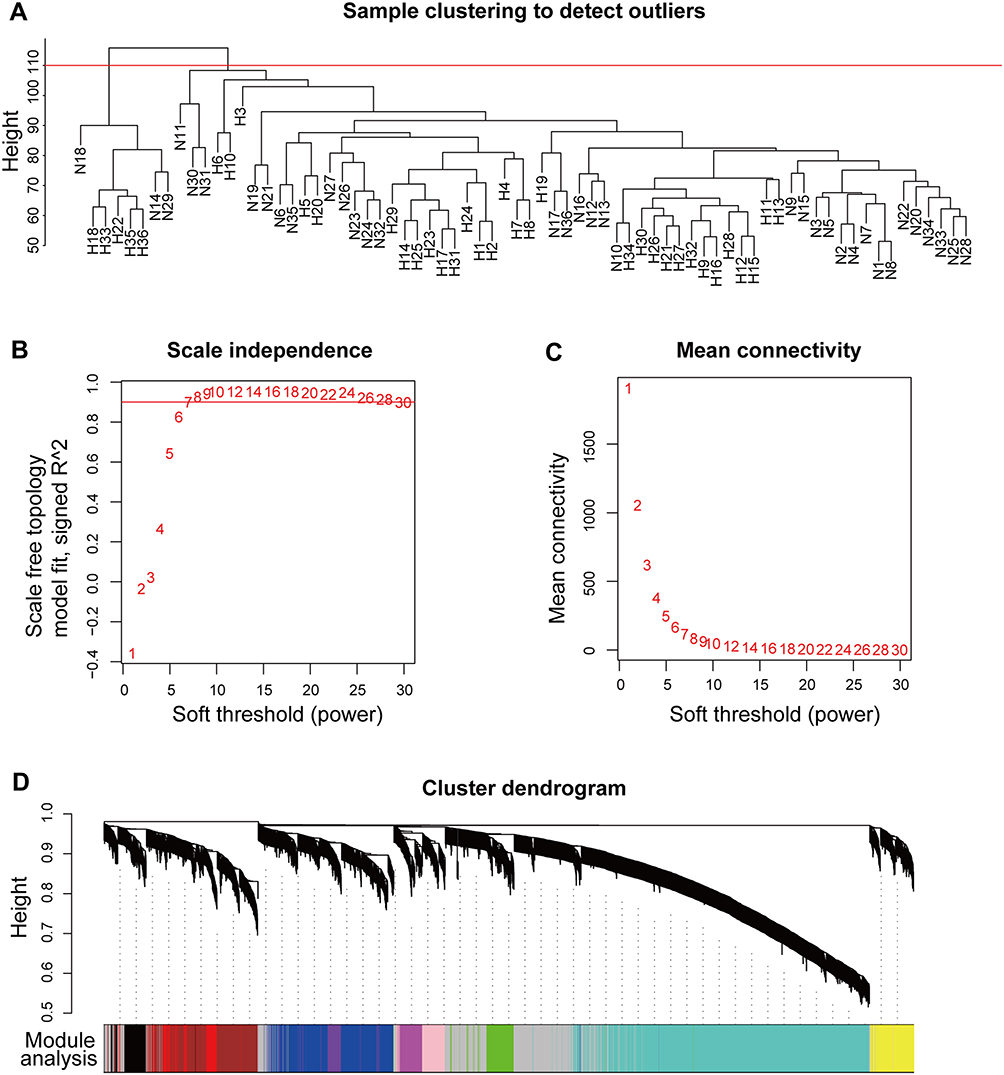 |
Figure 3 Construction of a coexpression network. (A) Sample clustering to detect outliers; N14, N18, N29, H18, H22, H33, H35, and H36 were excluded. (B) Analysis of the scale-free fit index for various soft-threshold powers; the red line was set at 0.90. (C) Analysis of mean connectivity for various soft-threshold powers. (D) Cluster dendrogram of genes in the coexpression network. Abbreviations: N, normal myocardial tissue; H, hypertrophic cardiomyopathy myocardial tissue. |
Next, we used a one-step method to construct the coexpression network. Genes with similar expression patterns were clustered into the same module. In this study, we identified a total of 11 gene modules (Figure 3D). Subsequently, the correlation between Module eigengenes (ME) and HCM was calculated, and the blue (r = 0.78; P = 3×10⁻¹⁴) and magenta (r = −0.83; P = 4×10⁻¹⁷) modules were identified as significant modules having the highest correlations with HCM (Figure 4A). To further evaluate the correlation between HCM and the modules, the module membership and gene significance were calculated. The blue module (cor = 0.74; P = 1.8×10−82) showed a high positive correlation with HCM (Figure 4B), whereas the magenta module (cor = −0.74; P = 1.3×10⁻¹⁹) showed a high negative correlation with HCM (Figure 4C). Meanwhile, the genes in the blue module were significantly upregulated (Figure 4D), while the genes in the magenta module were significantly downregulated in HCM (Figure 4E).
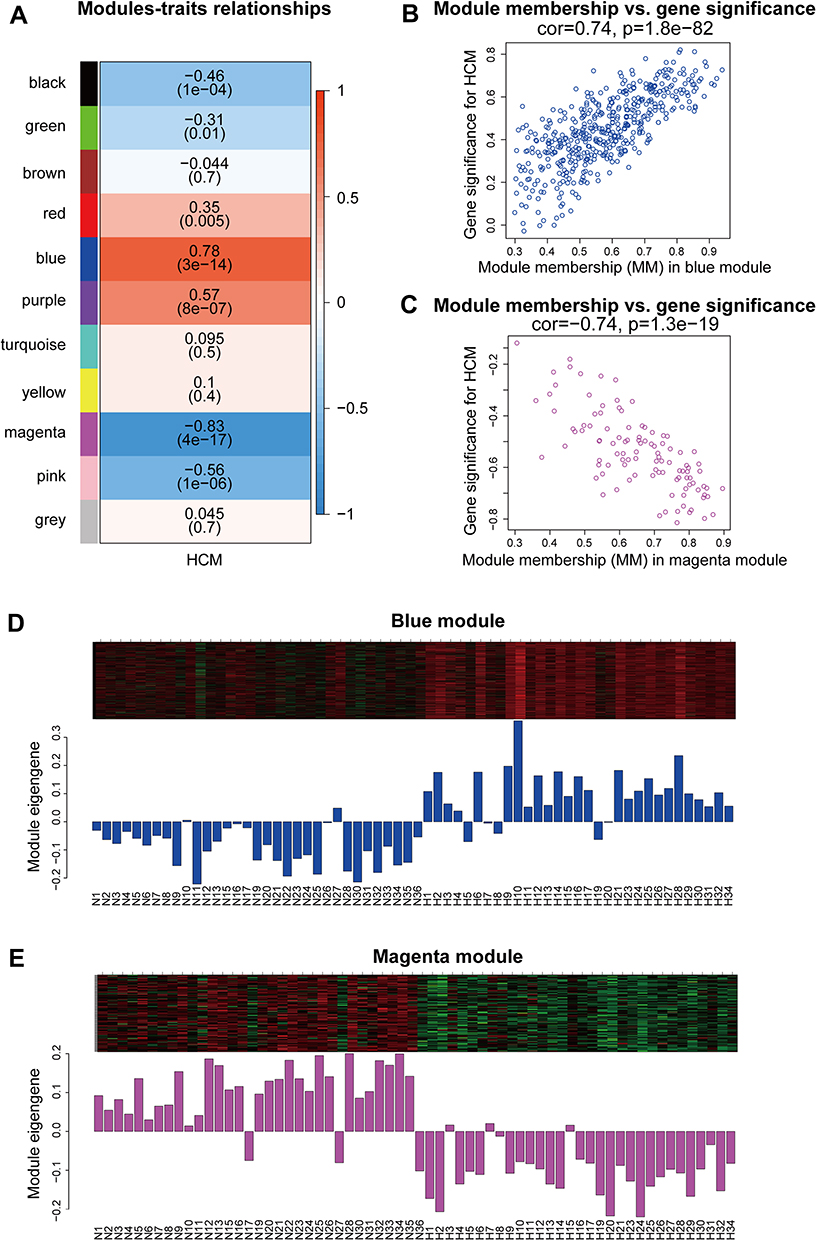 |
Figure 4 Identification of key modules. (A) Module-trait relationships in the constructed network. (B and C) MM versus GS plot of the key modules. (D and E) Gene expression profiles of the key modules. Abbreviations: MM, module membership; GS, gene significance; N, normal myocardial tissue; H, hypertrophic cardiomyopathy myocardial tissue. |
Functional Enrichment Analysis of Key Modules
Analysis of BP in the blue module revealed that the genes were enriched in extracellular matrix organization, transmembrane receptor protein serine/threonine kinase signaling pathway, cellular response to transforming growth factor beta (TGF-β) stimulus, TGF-β receptor signaling pathway, collagen fibril organization, and keratan sulfate catabolic process. As for CC and MF, genes in the blue module were mainly enriched in extracellular matrix (CC), endoplasmic reticulum lumen (CC), extracellular matrix structural constituent (MF), and receptor regulator activity (MF) (Figure 5A). The enriched pathways of the blue module were mainly associated with protein digestion and absorption and the thyroid hormone signaling pathway (Figure 5B). Detailed information is listed in Supplementary Tables 3 and 4. Since the genes of the magenta module were not enriched into any GO terms and KEGG pathway, we did not analyse the module further.
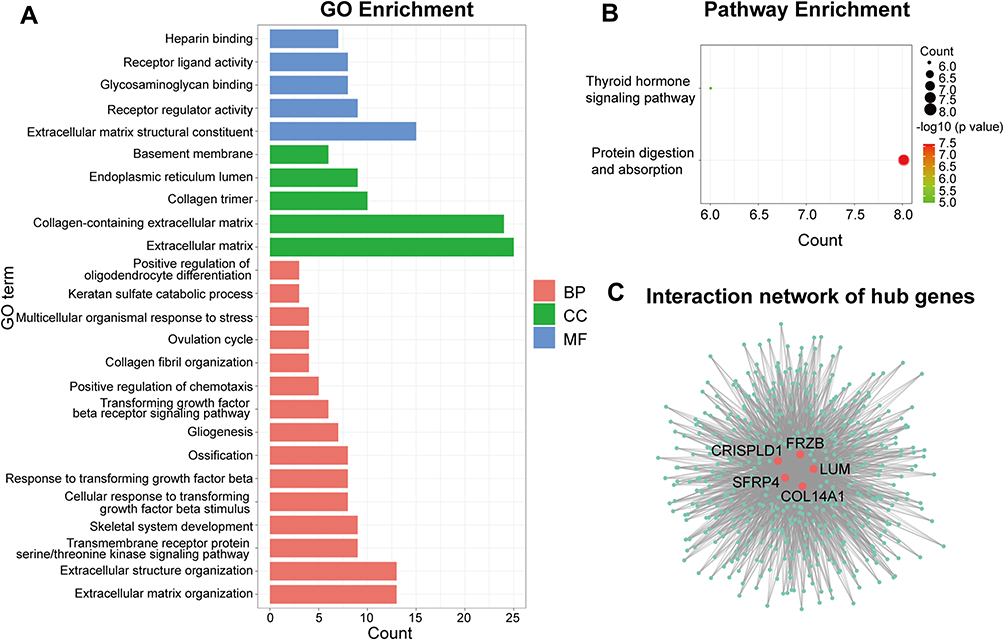 |
Figure 5 Functional enrichment analysis of the blue modules and identification of hub genes. (A) GO enrichment analysis of the blue module. (B) KEGG pathway enrichment analysis of the blue module. (C) Interaction network of the hub genes in the blue module; red nodes represent the hub genes; green nodes represent other related genes in the module. Abbreviations: GO, Gene Ontology; KEGG, Kyoto Encyclopedia of Genes and Genomes; BP, biological process; CC, cellular component; MF, molecular function. |
Identification of Hub Genes
In the blue module, frizzled related protein (FRZB, IC = 27.6), collagen type XIV alpha 1 chain (COL14A1, IC = 24.7), cysteine rich secretory protein LCCL domain containing 1 (CRISPLD1, IC = 23.3), lumican (LUM, IC = 22.8), and secreted frizzled related protein 4 (sFRP4, IC = 21.8) were identified as the hub genes (Figure 5C). Simultaneously, the hub genes we identified based on high IC also have high GS and high MM, and the results are as follows: FRZB (MM cor=0.9378, GS 0.7264), COL14A1 (MM cor=0.8891, GS 0.7429), CRISPLD1 (MM cor=0.9209, GS 0.6862), LUM (MM cor=0.9049, GS 0.6621), and sFRP4 (MM cor=0.8462, GS 0.6997). These hub genes may play key roles in HCM.
ROC Curve Analysis of Hub Genes
In order to verify the diagnostic values of hub genes, we performed ROC curve analysis. In the merged dataset, FRZB (AUC = 0.949), COL14A1 (AUC = 0.953), CRISPLD1 (AUC = 0.917), LUM (AUC = 0.902), sFRP4 (AUC = 0.923), and the logistic regression model of hub genes (AUC = 0.971) showed an excellent predictive power (Figure 6A). Through the verification of GSE36961 datasets, we further proved that FRZB (AUC = 0.954), COL14A1 (AUC = 0.718), CRISPLD1 (AUC = 0.758), LUM (AUC = 0.888), sFRP4 (AUC=0.923), and the logistic regression model of hub genes (AUC = 0.889) had an excellent predictive power (Figure 6B).
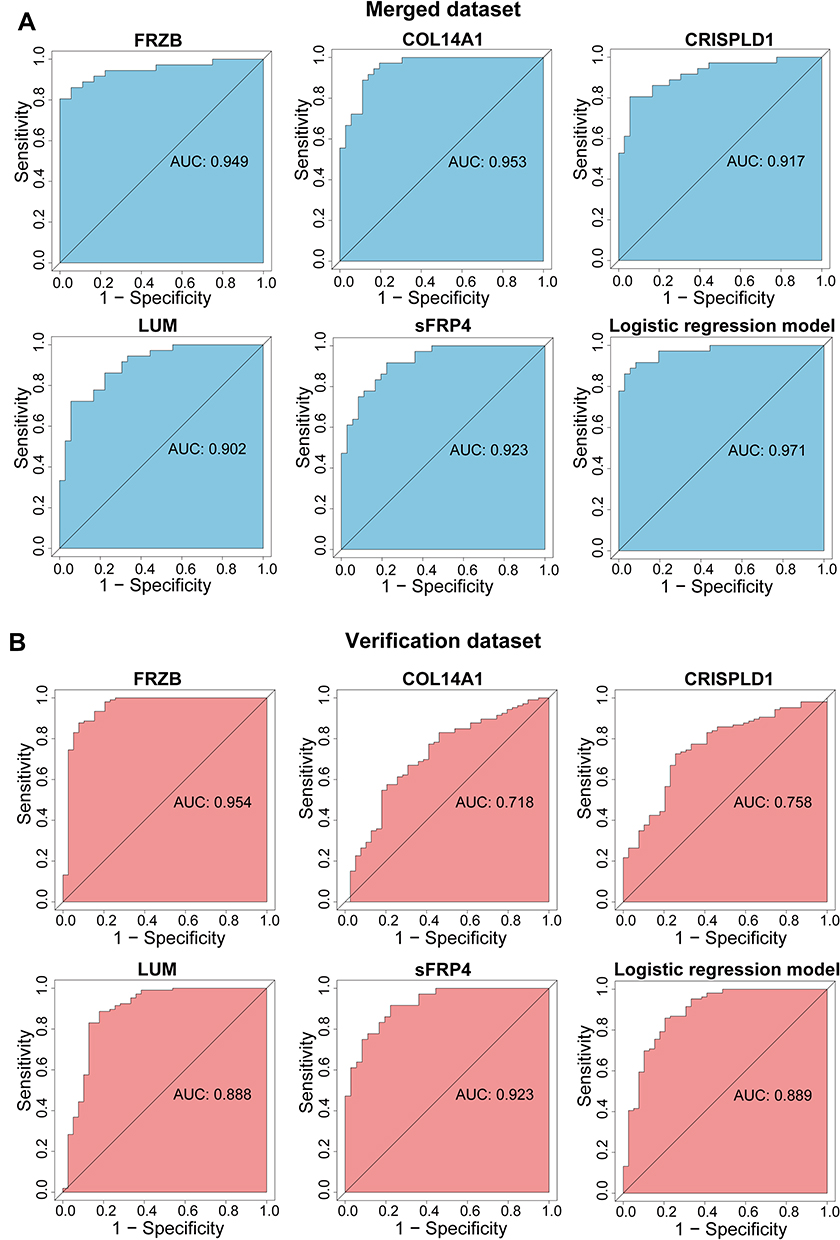 |
Figure 6 Analysis of the disease-predicting abilities of hub genes. (A) ROC curve analysis of hub genes in the merged dataset. (B) ROC curve analysis of hub genes in the verification dataset GSE36961. Abbreviations: AUC, area under the curve; ROC, receiver operating characteristic. |
Validation of Hub Gene Expression
In the merged dataset, FRZB, COL14A1, CRISPLD1, LUM, and sFRP4 were significantly upregulated in HCM samples (Figure 7A). Additionally, in the verification dataset GSE36961, the expression levels of FRZB, COL14A1, CRISPLD1, LUM, and sFRP4 were significantly upregulated in HCM samples (Figure 7B).
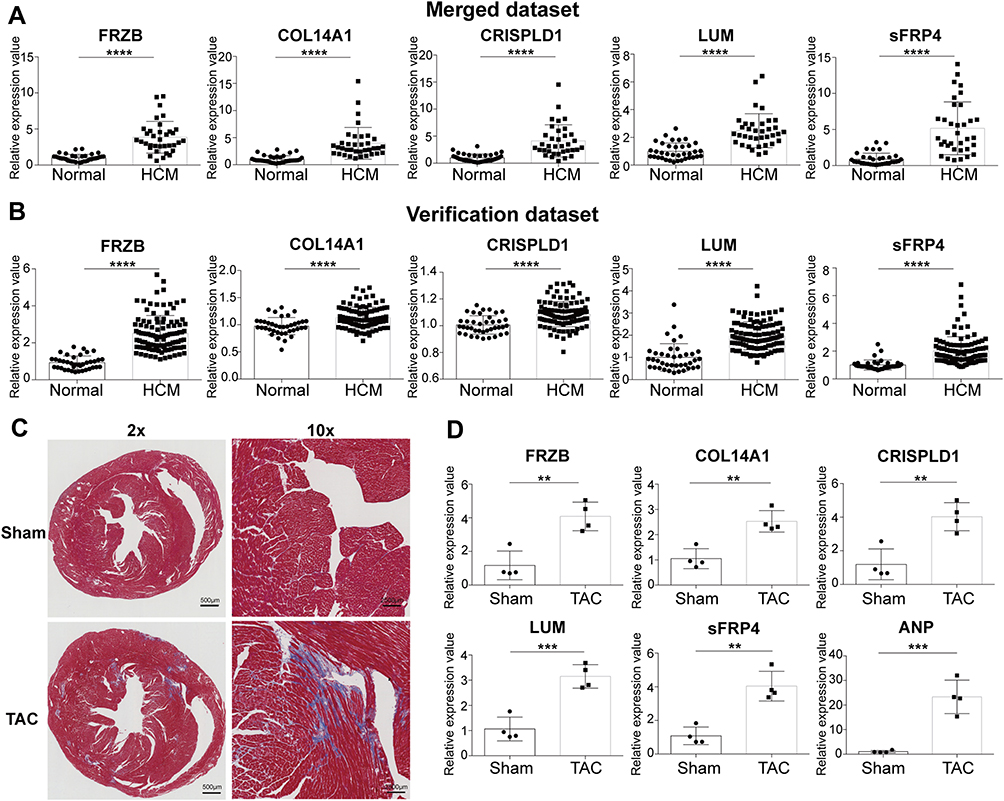 |
Figure 7 Validation of the expression of hub genes. (A) Expression of hub genes in the merged dataset. (B) Expression of hub genes in the verification dataset GSE36961. (C) Masson’s trichrome staining of mouse hearts. (D) Expression of hub genes in TAC mice. Error bars indicate mean ± standard deviation. **P < 0.01; ***P < 0.001; ****P < 0.0001. Abbreviations: Normal, normal myocardial tissue; HCM, hypertrophic cardiomyopathy myocardial tissue; TAC, transverse aortic constriction. |
Myocardial fibrosis was observed in TAC mice (Figure 7C), and qRT-PCR was performed on the sham and TAC myocardial samples. The results showed that ANP, FRZB, COL14A1, CRISPLD1, LUM, and sFRP4 were significantly upregulated in hypertrophic myocardium (Figure 7D).
Furthermore, we also found that protein levels of LUM and sFRP4 increased in myocardium of TAC mice, which is consistent with changes of genetic transcription (Figure 8). However, myocardial protein expression assay showed no difference of FRZB, Col14A1, and CRISPLD1 between sham and TAC mice.
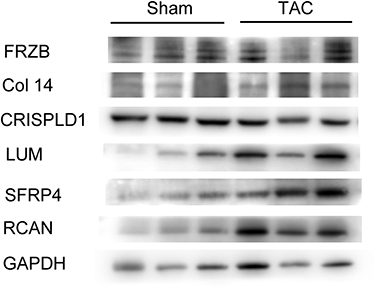 |
Figure 8 Western blotting tests representing protein levels of hub genes (FRZB, COL14A1, CRISPLD1, LUM, sFRP4) and remodeling gene RCAN in myocardium of sham and TAC mice. Abbreviations: FRZB, frizzled related protein; COL14A1, collagen type XIV alpha 1 chain; CRISPLD1, cysteine rich secretory protein LCCL domain containing 1; LUM, lumican; sFRP4, secreted frizzled related protein 4; RCAN, calcipressin regulatory protein. |
Discussion
Currently, bioinformatics has become an important tool to explore the potential pathogenesis of various diseases.25,26 In this study, we combined multiple independent datasets for analysis and verification, and we identified the module and hub genes associated with HCM by using WGCNA. To the best of our knowledge, this is the first study to integrate combined analysis and WGCNA to explore the pathogenesis and potential hub genes of HCM.
In the differential expression analysis, we identified a total of 455 DEGs, including typical molecular markers of pathological cardiac hypertrophy, such as ANP and BNP.27 Enrichment analysis of DEGs revealed that the regulation of extracellular matrix organization, neurotransmitter levels, and renin-angiotensin system play an important role in HCM. Additionally, we performed WGCNA, and we identified the blue module having the highest correlation with HCM. Enrichment analysis of the blue module revealed that the extracellular matrix organization, collagen fibril organization, TGF-β receptor signaling pathway, transmembrane receptor protein serine/threonine kinase signaling pathway, and keratan sulfate catabolic process were highly related to HCM. Previous studies have shown that the occurrence and development of hypertrophic cardiomyopathy is significantly related to the changes in extracellular matrix and myocardial fibrosis, and the cardiac muscle-specific TGF-β signal plays an important role in fibrosis remodeling.28–30 Additionally, neurohormonal pathways, such as the renin-angiotensin-aldosterone system, are involved in the pathogenesis of cardiac fibrosis.31,32 Our enrichment results are consistent with previous conclusions, which further emphasizes the important roles of extracellular matrix, fibrosis, and neurohormonal pathways in the pathogenesis of HCM.
Based on the ICs, we identified five hub genes, namely FRZB, COL14A1, CRISPLD1, LUM, and sFRP4, in the blue module. In order to explore their potential functions, we analysed the expression levels of these genes. In the merged dataset, the expression of hub genes was significantly upregulated in HCM patients. Furthermore, in the validation dataset GSE36961, the gene expression increased in HCM. qRT-PCR results revealed that the hub genes were significantly upregulated in TAC mice. These results indicate that hub genes are highly expressed in both human and mice hypertrophic myocardium. These genes may play an important role in the occurrence and development of HCM. FRZB belongs to the secreted glycoproteins family, and it modulates Wnt signaling activity.33 Previously, it has been reported that FRZB can inhibit Wnt-mediated cell proliferation in cardiac cushions and regulate mesenchymal cell proliferation.34 Additionally, congenital heart defect is associated with FRZB.35 However, the role of FRZB in HCM needs to be further verified. COL14A1 is a fibril-associated collagen that regulates fibrillogenesis.36 It has been reported that COL14A1 affects arterial remodeling, and it may be involved in the regulation of essential hypertension, acute aortic dissection, coronary heart disease, and idiopathic pulmonary hypertension.37–39 Importantly, COL14A1 plays a vital role in collagen fibril organization and ventricular morphogenesis.40 Therefore, COL14A1 may play a regulatory role in fibrosis and vascular remodeling in HCM. CRISPLD1 is likely a protease that can target the extracellular matrix, and it may play an important role in cellular adhesion.41,42 Remarkably, during the development of heart failure in patients with aortic stenosis, the expression of CRISPLD1 increases progressively, and it may play a functional role by regulating Ca2+ cycling.43 LUM, a glycoprotein belonging to the family of small leucine-rich repeat proteoglycans, is highly expressed in connective tissues.44–46 It has been reported that the LUM levels in tissues may have a significant effect on the differentiation of monocytes into fibrocytes; thus, modulating LUM signaling may be useful to treat fibrosis.47 During proteomic analysis of the myocardium in HCM, LUM increases,48 which is consistent with our results. Additionally, LUM controls cardiomyocyte growth by regulating the pericellular extracellular matrix, and it may coordinate multiple factors of collagen assembly in the murine heart.49 A moderate lack of LUM attenuates cardiac fibrosis and improves diastolic dysfunction following pressure overload in mice.50 Meanwhile, mechanical and proinflammatory stimulations can induce fibroblasts to produce a large amount of LUM and participate in cardiac remodeling in the process of heart failure.51 These studies suggest that LUM may be an important profibrotic molecule in the heart that can serve as a potential therapeutic target. sFRP4, a member of the sFRP family, functions as a soluble modulator in Wnt signaling.52–55 Apart from binding with Wnt ligands, sFRP4 interacts with extracellular matrix receptors such as integrin receptors.56 Additionally, sFRP4 participates in multiple biological processes such as apoptosis, angiogenesis, and proliferation.57–59 Previously, it has been reported that sFRP4 inhibits the expression of cardiac genes and cardiac differentiation via the activated focal adhesion kinase pathway.60 Particularly, sFRP4 has been proposed in many cardiovascular diseases, such as dilated cardiomyopathy, atherosclerosis, myocardial ischemia, reperfusion injury, coronary artery disease, and heart failure.61–65 MYH7 is one of the sFRP4-targeted genes,61 which is closely related to HCM, as mentioned before. Therefore, sFRP4 may play a role in the development of HCM, and it may be a novel candidate for HCM.
We also explored the diagnostic values of hub genes. The five hub genes showed a good predictive value in the merged and validation dataset, indicating the characteristic expressions of these genes, suggesting their potential usage as biomarkers. Although we combined multiple independent datasets for analysis, part of the information in the network may have been obscured due to the limitation of sample size. Generally speaking, hub genes may play an important role in the development of HCM. In our study, we found that the hub genes were significantly associated with HCM. However, further experimental validation is needed to verify whether these genes are the primary drivers of HCM. The protein levels of FRZB, Col14A1, and CRISPLD1 showed no difference in myocardium between sham and TAC mice. This results may partially related to species difference and the limited sample size of TAC mice. Additionally, we only focus on the genes in the module with the highest correlation, which may cause some hub genes in other related modules to be neglected. This is another limitation inherent to our study.
Conclusion
Our results revealed that FRZB, COL14A1, CRISPLD1, LUM, and sFRP4 are highly expressed in HCM, and these genes can be potentially used as biomarkers and even therapeutic targets for HCM. Additionally, the biological process obtained through an enrichment analysis of DEGs and key modules may provide a new direction of HCM research.
Abbreviations
BP, biological process; CC, cellular component; COL14A1, collagen type XIV alpha 1 chain; CRISPLD1, cysteine rich secretory protein LCCL domain containing 1; DEGs, differentially expressed genes; FRZB, frizzled related protein; GEO, Gene Expression Omnibus; HCM, hypertrophic cardiomyopathy; IC, intramodular connectivity; LUM, lumican; MEs, module eigengenes; MF, molecular function; MYH7, β-myosin heavy chain; PCA, principal component analysis; qRT-PCR, quantitative real-time polymerase chain reaction; RCAN, calcipressin regulatory protein; sFRP4, secreted frizzled related protein 4; TAC, transverse aortic constriction; TGF-β, transforming growth factor beta; WGCNA, weighted gene coexpression network analysis.
Data Sharing Statement
The datasets analyzed during the current study are available in the GEO database (http://www.ncbi.nlm.nih.gov/geo/).
Ethics Approval
Experiments were performed under a project license (NO.: SRRSH20201215) granted by institutional ethics committee of Sir Run Run Shaw Hospital, in compliance with institutional guidelines for the care and use of animals.
Funding
This work was supported by the National Natural Science Foundation of China (No. 81974025, NO.81941003); Natural Science Foundation of Zhejiang Province (No. LY19H020007); Medical and Health Science Program of Zhejiang Province (No. 2020RC016, No. 2019RC183).
Disclosure
The authors declare that they have no conflict of interest.
References
1. Maron BJ. Hypertrophic cardiomyopathy: a systematic review. JAMA. 2002;287(10):1308–1320. doi:10.1001/jama.287.10.1308
2. Hensley N, Dietrich J, Nyhan D, Mitter N, Yee MS, Brady M. Hypertrophic cardiomyopathy: a review. Anesth Analg. 2015;120(3):554–569.
3. Maron BJ, Maron MS. Hypertrophic cardiomyopathy. Lancet (London, England). 2013;381(9862):242–255.
4. Maron BJ, Maron MS, Semsarian C. Genetics of hypertrophic cardiomyopathy after 20 years: clinical perspectives. J Am Coll Cardiol. 2012;60(8):705–715.
5. MacIntyre C, Lakdawala NK. Management of atrial fibrillation in hypertrophic cardiomyopathy. Circulation. 2016;133(19):1901–1905.
6. Maron BJ. Clinical course and management of hypertrophic cardiomyopathy. N Engl J Med. 2018;379(20):1977.
7. Daubert C, Gadler F, Mabo P, Linde C. Pacing for hypertrophic obstructive cardiomyopathy: an update and future directions. Europace. 2018;20(6):908–920.
8. Cao Y, Zhang PY. Review of recent advances in the management of hypertrophic cardiomyopathy. Eur Rev Med Pharmacol Sci. 2017;21(22):5207–5210.
9. Zhang X, Feng H, Li D, Liu S, Amizuka N, Li M. Identification of differentially expressed genes induced by aberrant methylation in oral squamous cell carcinomas using integrated bioinformatic analysis. Int J Mol Sci. 2018;19:6.
10. Wang T, Zheng X, Li R, et al. Integrated bioinformatic analysis reveals YWHAB as a novel diagnostic biomarker for idiopathic pulmonary arterial hypertension. J Cell Physiol. 2019;234(5):6449–6462. doi:10.1002/jcp.27381
11. Shen Z, Lu J, Wei J, et al. Investigation of the underlying hub genes and mechanisms of reperfusion injury in patients undergoing coronary artery bypass graft surgery by integrated bioinformatic analyses. Ann Transl Med. 2019;7(22):664. doi:10.21037/atm.2019.10.43
12. Ma Z, Shen Z, Gong Y, et al. Weighted gene co-expression network analysis identified underlying hub genes and mechanisms in the occurrence and development of viral myocarditis. Ann Transl Med. 2020;8(21):1348. doi:10.21037/atm-20-3337
13. Zhu M, Jia L, Li F, Jia J. Identification of KIAA0513 and other hub genes associated with Alzheimer disease using weighted gene coexpression network analysis. Front Genet. 2020;11:981. doi:10.3389/fgene.2020.00981
14. Doering TA, Crawford A, Angelosanto JM, Paley MA, Ziegler CG, Wherry EJ. Network analysis reveals centrally connected genes and pathways involved in CD8+ T cell exhaustion versus memory. Immunity. 2012;37(6):1130–1144.
15. Ding M, Li F, Wang B, Chi G, Liu H. A comprehensive analysis of WGCNA and serum metabolomics manifests the lung cancer-associated disordered glucose metabolism. J Cell Biochem. 2019;120(6):10855–10863.
16. Ritchie ME, Phipson B, Wu D, et al. limma powers differential expression analyses for RNA-sequencing and microarray studies. Nucleic Acids Res. 2015;43(7):e47.
17. Ballman KV, Grill DE, Oberg AL, Therneau TM. Faster cyclic loess: normalizing RNA arrays via linear models. Bioinformatics (Oxford, England). 2004;20(16):2778–2786.
18. Parker HS, Leek JT, Favorov AV, et al. Preserving biological heterogeneity with a permuted surrogate variable analysis for genomics batch correction. Bioinformatics (Oxford, England). 2014;30(19):2757–2763.
19. Yu G, Wang LG, Han Y, He QY. clusterProfiler: an R package for comparing biological themes among gene clusters. Omics. 2012;16(5):284–287.
20. Langfelder P, Horvath S. WGCNA: an R package for weighted correlation network analysis. BMC Bioinform. 2008;9:559.
21. Zhang B, Horvath S. A general framework for weighted gene co-expression network analysis. Statistical applications in genetics and molecular biology. 2005;4:Article17.
22. Shannon P, Markiel A, Ozier O, et al. Cytoscape: a software environment for integrated models of biomolecular interaction networks. Genome Res. 2003;13(11):2498–2504.
23. Friedman J, Hastie T, Tibshirani R. Regularization paths for generalized linear models via coordinate descent. J Stat Softw. 2010;33(1):1–22.
24. Robin X, Turck N, Hainard A, et al. pROC: an open-source package for R and S+ to analyze and compare ROC curves. BMC Bioinform. 2011;12:77.
25. Fortier MH, Caron E, Hardy MP, et al. The MHC class I peptide repertoire is molded by the transcriptome. J Exp Med. 2008;205(3):595–610.
26. Esfandiarei M, McManus BM. Molecular biology and pathogenesis of viral myocarditis. Annu Rev Pathol. 2008;3:127–155.
27. Bernardo BC, Weeks KL, Pretorius L, McMullen JR. Molecular distinction between physiological and pathological cardiac hypertrophy: experimental findings and therapeutic strategies. Pharmacol Ther. 2010;128(1):191–227.
28. Kong P, Christia P, Frangogiannis NG. The pathogenesis of cardiac fibrosis. Cell Mol Life Sci. 2014;71(4):549–574.
29. Koitabashi N, Danner T, Zaiman AL, et al. Pivotal role of cardiomyocyte TGF-β signaling in the murine pathological response to sustained pressure overload. J Clin Invest. 2011;121(6):2301–2312.
30. Ashrafian H, McKenna WJ, Watkins H. Disease pathways and novel therapeutic targets in hypertrophic cardiomyopathy. Circ Res. 2011;109(1):86–96.
31. Sadoshima J, Izumo S. Molecular characterization of angiotensin II–induced hypertrophy of cardiac myocytes and hyperplasia of cardiac fibroblasts. Critical Role of the AT1 Receptor Subtype. Circ Res. 1993;73(3):413–423.
32. Schorb W, Booz GW, Dostal DE, Conrad KM, Chang KC, Baker KM. Angiotensin II is mitogenic in neonatal rat cardiac fibroblasts. Circ Res. 1993;72(6):1245–1254.
33. Hu E, Zhu Y, Fredrickson T, et al. Tissue restricted expression of two human Frzbs in preadipocytes and pancreas. Biochem Biophys Res Commun. 1998;247(2):287–293.
34. Person AD, Garriock RJ, Krieg PA, Runyan RB, Klewer SE. Frzb modulates Wnt-9a-mediated beta-catenin signaling during avian atrioventricular cardiac cushion development. Dev Biol. 2005;278(1):35–48.
35. Ackerman C, Locke AE, Feingold E, et al. An excess of deleterious variants in VEGF-A pathway genes in Down-syndrome-associated atrioventricular septal defects. Am J Hum Genet. 2012;91(4):646–659.
36. Wälchli C, Koch M, Chiquet M, Odermatt BF, Trueb B. Tissue-specific expression of the fibril-associated collagens XII and XIV. J Cell Sci. 1994;107(Pt 2):669–681.
37. Weis-Müller BT, Modlich O, Drobinskaya I, et al. Gene expression in acute Stanford type A dissection: a comparative microarray study. J Transl Med. 2006;4:29.
38. Guay SP, Brisson D, Mathieu P, Bossé Y, Gaudet D, Bouchard L. A study in familial hypercholesterolemia suggests reduced methylomic plasticity in men with coronary artery disease. Epigenomics. 2015;7(1):17–34.
39. Hoffmann J, Marsh LM, Pieper M, et al. Compartment-specific expression of collagens and their processing enzymes in intrapulmonary arteries of IPAH patients. Am J Physiol Lung Cell Mol Physiol. 2015;308(10):L1002–13.
40. Tao G, Levay AK, Peacock JD, et al. Collagen XIV is important for growth and structural integrity of the myocardium. J Mol Cell Cardiol. 2012;53(5):626–638.
41. Gibbs GM, Roelants K, O’Bryan MK. The CAP superfamily: cysteine-rich secretory proteins, antigen 5, and pathogenesis-related 1 proteins–roles in reproduction, cancer, and immune defense. Endocr Rev. 2008;29(7):865–897.
42. Holmfeldt P, Ganuza M, Marathe H, et al. Functional screen identifies regulators of murine hematopoietic stem cell repopulation. J Exp Med. 2016;213(3):433–449.
43. Khadjeh S, Hindmarsh V, Weber F, et al. CRISPLD1: a novel conserved target in the transition to human heart failure. Basic Res Cardiol. 2020;115(3):27.
44. Kafienah W, Cheung FL, Sims T, et al. Lumican inhibits collagen deposition in tissue engineered cartilage. Matrix Biol. 2008;27(6):526–534.
45. Chakravarti S, Magnuson T, Lass JH, Jepsen KJ, LaMantia C, Carroll H. Lumican regulates collagen fibril assembly: skin fragility and corneal opacity in the absence of lumican. J Cell Biol. 1998;141(5):1277–1286.
46. Yeh JT, Yeh LK, Jung SM, et al. Impaired skin wound healing in lumican-null mice. Br J Dermatol. 2010;163(6):1174–1180.
47. Pilling D, Vakil V, Cox N, Gomer RH. TNF-α-stimulated fibroblasts secrete lumican to promote fibrocyte differentiation. Proc Natl Acad Sci U S A. 2015;112(38):11929–11934.
48. Coats CJ, Heywood WE, Virasami A, et al. Proteomic analysis of the myocardium in hypertrophic obstructive cardiomyopathy. Circ Genomic Precision Med. 2018;11(12):e001974.
49. Dupuis LE, Berger MG, Feldman S, et al. Lumican deficiency results in cardiomyocyte hypertrophy with altered collagen assembly. J Mol Cell Cardiol. 2015;84:70–80.
50. Mohammadzadeh N, Melleby AO, Palmero S, et al. Moderate loss of the extracellular matrix proteoglycan lumican attenuates cardiac fibrosis in mice subjected to pressure overload. Cardiology. 2020;145(3):187–198.
51. Engebretsen KV, Lunde IG, Strand ME, et al. Lumican is increased in experimental and clinical heart failure, and its production by cardiac fibroblasts is induced by mechanical and proinflammatory stimuli. FEBS J. 2013;280(10):2382–2398.
52. Dann CE, Hsieh JC, Rattner A, Sharma D, Nathans J, Leahy DJ. Insights into Wnt binding and signalling from the structures of two Frizzled cysteine-rich domains. Nature. 2001;412(6842):86–90.
53. O’Leary NA, Wright MW, Brister JR, et al. Reference sequence (RefSeq) database at NCBI: current status, taxonomic expansion, and functional annotation. Nucleic Acids Res. 2016;44(D1):D733–45.
54. Li X, Yue X, Pastor WA, et al. Tet proteins influence the balance between neuroectodermal and mesodermal fate choice by inhibiting Wnt signaling. Proc Natl Acad Sci U S A. 2016;113(51):E8267–e76.
55. Jones SE, Jomary C. Secreted Frizzled-related proteins: searching for relationships and patterns. BioEssays. 2002;24(9):811–820.
56. Tian Y, Wang W, Lu Q, et al. Cross-talk of SFRP4, integrin α1β1, and Notch1 inhibits cardiac differentiation of P19CL6 cells. Cell Signal. 2016;28(11):1806–1815.
57. Schumann H, Holtz J, Zerkowski HR, Hatzfeld M. Expression of secreted frizzled related proteins 3 and 4 in human ventricular myocardium correlates with apoptosis related gene expression. Cardiovasc Res. 2000;45(3):720–728.
58. Longman D, Arfuso F, Viola HM, Hool LC, Dharmarajan AM. The role of the cysteine-rich domain and netrin-like domain of secreted frizzled-related protein 4 in angiogenesis inhibition in vitro. Oncol Res. 2012;20(1):1–6.
59. Horvath LG, Henshall SM, Kench JG, et al. Membranous expression of secreted frizzled-related protein 4 predicts for good prognosis in localized prostate cancer and inhibits PC3 cellular proliferation in vitro. Clin Cancer Res. 2004;10(2):615–625.
60. Bhuvanalakshmi G, Arfuso F, Kumar AP, Dharmarajan A, Warrier S. Epigenetic reprogramming converts human Wharton’s jelly mesenchymal stem cells into functional cardiomyocytes by differential regulation of Wnt mediators. Stem Cell Res Ther. 2017;8(1):185.
61. Alimadadi A, Aryal S, Manandhar I, Joe B, Cheng X. Identification of Upstream Transcriptional Regulators of Ischemic Cardiomyopathy Using Cardiac RNA-Seq Meta-Analysis. Int J Mol Sci. 2020;21:10.
62. Martin S, Lin H, Ejimadu C, Lee T. Tissue-nonspecific alkaline phosphatase as a target of sFRP2 in cardiac fibroblasts. Am J Physiol Cell Physiol. 2015;309(3):C139–47.
63. Ji Q, Zhang J, Du Y, et al. Human epicardial adipose tissue-derived and circulating secreted frizzled-related protein 4 (SFRP4) levels are increased in patients with coronary artery disease. Cardiovasc Diabetol. 2017;16(1):133.
64. Zeng W, Cao Y, Jiang W, Kang G, Huang J, Xie S. Knockdown of Sfrp4 attenuates apoptosis to protect against myocardial ischemia/reperfusion injury. J Pharmacol Sci. 2019;140(1):14–19.
65. Jin X, Guo B, Yan J, et al. Angiotensin II increases secreted frizzled-related protein 5 (sFRP5) expression through AT1 receptor/Rho/ROCK1/JNK signaling in cardiomyocytes. Mol Cell Biochem. 2015;408(1–2):215–222.
 © 2021 The Author(s). This work is published and licensed by Dove Medical Press Limited. The
full terms of this license are available at https://www.dovepress.com/terms
and incorporate the Creative Commons Attribution
- Non Commercial (unported, 3.0) License.
By accessing the work you hereby accept the Terms. Non-commercial uses of the work are permitted
without any further permission from Dove Medical Press Limited, provided the work is properly
attributed. For permission for commercial use of this work, please see paragraphs 4.2 and 5 of our Terms.
© 2021 The Author(s). This work is published and licensed by Dove Medical Press Limited. The
full terms of this license are available at https://www.dovepress.com/terms
and incorporate the Creative Commons Attribution
- Non Commercial (unported, 3.0) License.
By accessing the work you hereby accept the Terms. Non-commercial uses of the work are permitted
without any further permission from Dove Medical Press Limited, provided the work is properly
attributed. For permission for commercial use of this work, please see paragraphs 4.2 and 5 of our Terms.