Back to Journals » International Journal of Chronic Obstructive Pulmonary Disease » Volume 12
Identification of thyroxine-binding globulin as a candidate plasma marker of chronic obstructive pulmonary disease
Authors Diao W, Shen N, Du Y, Sun X, Liu B, Xu M, He B
Received 23 March 2017
Accepted for publication 26 April 2017
Published 25 May 2017 Volume 2017:12 Pages 1549—1564
DOI https://doi.org/10.2147/COPD.S137806
Checked for plagiarism Yes
Review by Single anonymous peer review
Peer reviewer comments 2
Editor who approved publication: Prof. Dr. Richard Russell
Wenqi Diao,1 Ning Shen,1 Yipeng Du,1 Xiaoyan Sun,1 Beibei Liu,1 Ming Xu,2,3 Bei He1
1Department of Respiratory Medicine, 2Department of Cardiology, Institute of Vascular Medicine, Peking University Third Hospital, 3Key Laboratory of Molecular Cardiovascular Sciences, Ministry of Education, Beijing, People’s Republic of China
Abstract: Biomarkers for the management of chronic obstructive pulmonary disease (COPD) are limited. The aim of this study was to explore new plasma biomarkers in patients with COPD. Thyroxine-binding globulin (THBG) was initially identified by proteomics in a discovery panel and subsequently verified by enzyme-linked immunosorbent assay in another verification panel with a 1-year follow-up. THBG levels were elevated in patients with COPD (9.2±2.3 µg/mL) compared to those of the controls (6.6±2.0 µg/mL). Receiver operating characteristic curves suggested that THBG was able to slightly differentiate between patients with COPD and controls (area under the curve [AUC]: 0.814) and performed better if combined with fibrinogen (AUC: 0.858). THBG was more capable of distinguishing Global Initiative for Obstructive Lung Disease stages I–III and IV (AUC: 0.851) compared with fibrinogen (AUC 0.582). THBG levels were negatively associated with predicted percentage forced expiratory volume in 1 s and positively related to predicted percentage residual volume, RV/percentage total lung capacity, and percentage low-attenuation area. COPD patients with higher baseline THBG levels had a greater risk of acute exacerbation (AE) than those with lower THBG levels (P=0.014, by Kaplan–Meier curve; hazard ratio: 4.229, by Cox proportional hazards model). In summary, THBG is a potential plasma biomarker of COPD and can assist in the management of stable stage and AEs in COPD patients.
Keywords: thyroxine-binding globulin, biomarker, chronic obstructive pulmonary disease, proteomics
Introduction
Chronic obstructive pulmonary disease (COPD) is a complicated disease characterized by the progressive decline of lung function with or without emphysema, leading to considerable morbidity and mortality worldwide.1 Biomarkers, such as proteins, microRNAs, and metabolites, play an important role in the diagnosis and management of various complex diseases.2–5 However, biomarkers for the diagnosis and management of COPD are very limited.6,7 Moreover, these markers, such as fibrinogen and C-reactive protein (CRP), appeared to reflect systemic inflammation in patients with COPD.8–12 Most researchers in the respiratory field would prefer to identify a biomarker involved in the pathological mechanism of COPD. Thus, researchers are trying to identify new biomarkers to replace or complement these traditional markers.
Recently, proteomics has been widely applied in the identification of biomarkers in various diseases due to the high-throughput and unbiased characteristics of the technique.13–17 Likewise, the technique has also been used in biomarker studies of COPD.18–20 Several markers identified by proteomic studies have provided new insights into the pathogenesis and management of COPD.18,19,21,22 Samples of these proteomic studies were obtained from sputum,21 exhaled breath condensate (EBC),23 or bronchoalveolar lavage fluid (BALF).24 However, sputum is not a suitable sample for proteomic studies because highly charged mucins can easily cause the separation of sputum proteins in the proteomics process.25 The application of EBC in proteomics is also limited due to salivary contamination and poor protein abundance.26 BALF is an ideal material for the identification of specific biomarkers related to the pathogenesis of COPD, but protein dilution and high risk restrict its clinical application.27 Plasma is an appropriate sample because it is easily obtained and contains abundant human proteins.
To our knowledge, plasma biomarker studies using proteomics in stable COPD patients are scarce.18 Hence, this study sought to identify new plasma biomarkers in COPD via the isobaric tags for relative and absolute quantification (iTRAQ)-labeling proteomic technique. To verify these candidate biomarkers identified by proteomics, their plasma concentrations were measured in another larger cohort with a 1-year follow-up by enzyme-linked immunosorbent assay (ELISA). Furthermore, we also explored the relationship between biomarkers and clinical characteristics of COPD.
Methods
Study design
A discovery panel of 8 male subjects (n=4, smokers without COPD; n=4, smokers with COPD) was recruited to identify the biomarker candidates in November 2014. Another verification panel of 86 male subjects (n=33, smokers without COPD; n=53, smokers with COPD) was used to verify and explore the clinical value of biomarkers. The subjects were enrolled and followed up from December 2014 to February 2016. All recruited subjects were from the Peking University Third Hospital, China. The study protocol was approved by the Medical Science Research Ethics Committee of Peking University Third Hospital (2014160), and all studies were carried out in strict accordance with the protocol. Written informed consent was obtained from each subject. The flow diagram is presented in Figure 1.
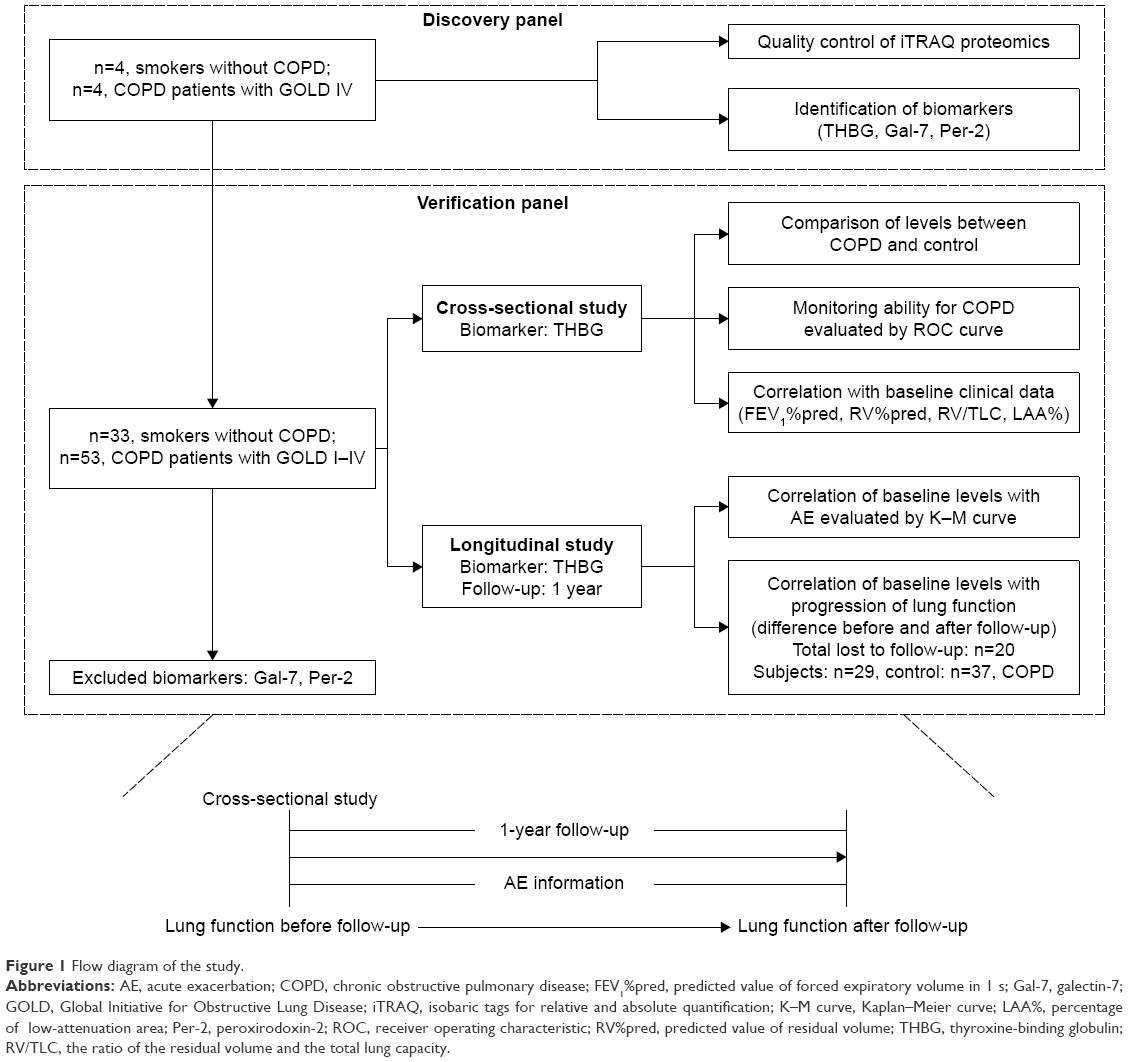 | Figure 1 Flow diagram of the study. |
The inclusion criteria of COPD patients were as follows: 1) males aged 50–70 years; 2) diagnosed with a stable stage of COPD, according to the Global Initiative for Obstructive Lung Disease (GOLD) guidelines1; and 3) a smoking history of at least 10 pack-years and a smoking cessation duration of >5 years. The exclusion criteria of selected patients were as follows: 1) diagnosed with unstable cardiovascular diseases, significant hepatic dysfunction, or mental or renal incompetence; 2) diagnosed with asthma, diffuse panbronchiolitis, cystic fibrosis, active pulmonary tuberculosis, or pneumonia within 2 months; or 3) prescribed immunosuppressive medications, such as those for acquired immunodeficiency syndrome (AIDS). The COPD patients were divided into 4 subgroups according to the baseline lung function: GOLD I (predicted percentage forced expiratory volume in 1 s [FEV1%pred] ≥80%), GOLD II (50%≤FEV1%pred <80%), GOLD III (30%≤ FEV1%pred <50%), and GOLD IV (FEV1%pred <80%).1 In addition, male smokers without COPD were included as a control group.
Age, gender, body mass index (BMI), smoking history, smoking cessation duration, complications, and 1-year acute exacerbation (AE) information were collected. Lung function was measured with a ventilator (SensorMedics, Yorba Linda, CA, USA).
The diagnosis of AE was based on GOLD guidelines.1 No subjects were hospitalized due to AEs in the study. The severity of emphysema was assessed according to the extent of low-attenuation area (LAA) measured by thorax computed tomography (CT). LAA%, defined as the percentage of the area of <−950 Hounsfield units (HU), was calculated with AW version 4.5 software (GE Healthcare, Fairfield, CT, USA).28
Sample collection
Plasma samples from subjects were centrifuged for 30 min at room temperature. Supernatants of these blood samples were aliquoted into sterile Eppendorf tubes and subsequently stored at −80°C.
ITRAQ-labeling proteomic analysis
The highly abundant plasma proteins were discarded with ProteoMinerTM kits (Bio-Rad Laboratories, Hercules, CA, USA). The extracted proteins from plasma were digested via Trypsin Gold (Promega, Madison, WI, USA) for 16 h at 37°C. The plasma samples of subjects were labeled with the 8-plex iTRAQ reagent (Applied Biosystems, Carlsbad, CA, USA). These samples were pooled after being incubated for 2 h at room temperature. The peptides were separated by strong cation exchange (SCX) chromatography through an LC-20AB HPLC pump system (Shimadzu, Kyoto, Japan) and then processed by liquid chromatography coupled with tandem mass spectrometry (LC–MS/MS) with a Q Exactive™ mass spectrometer (Thermo Fisher Scientific, San Jose, CA, USA). Proteins were identified against the UniProt_human database via a mascot search engine version 2.3.02 (Matrix Science, London, UK).
Immunoassay verification
Thyroxine-binding globulin (THBG) (R&D Systems, Minneapolis, MN, USA), peroxiredoxin-2 (R&D Systems), and galectin-7 (Invitrogen, Grand Island, NY, USA) were detected using ELISA kits according to the manufacturers’ protocols. Plasma fibrinogen concentration was measured by the Clauss method.8 Total triiodothyronine (TT3), total thyroxine (TT4), free T3 (fT3), free T4 (fT4), and thyroid-stimulating hormone (TSH) were determined with an automated chemiluminescence immunoassay (Roche Elecsys, Basel, Switzerland).29
Statistical analysis
Categorical variables were assessed with the chi-square test. Differences in continuous variables between controls and patients with COPD were compared using Student’s t-tests. Discrepancies in continuous variables among controls and patients at GOLD stages I–IV were evaluated by analysis of variance (ANOVA) with a post hoc test (least significant difference [LSD] method). Analyses of covariance and multivariate linear regression, correcting for confounders, were used to identify differences in THBG between groups.
The association of THBG with continuous variables was determined by the Pearson coefficient, and the association with ranked variables was analyzed by Spearman’s coefficient. Partial correlation analyses and multivariate linear regression, correcting for confounders, were used to detect the relationship between THBG and variables.
Receiver operating characteristic (ROC) curves were used to detect the partitive ability of THBG for different subgroups of COPD, including the corresponding area under the curve (AUC), the cutoff value, sensitivity, and specificity.
The COPD patients were divided into low-level and high-level groups based on the median concentration of baseline THBG. A Kaplan–Meier curve was used to compare the occurrence time of AEs between low- and high-level THBG groups. A Cox proportional regression model, correcting for other risk factors, was used to detect the hazard ratio (HR) of THBG levels for AEs.
Statistical analyses were conducted through GraphPad Prism 5.0 (GraphPad, San Diego, CA, USA), MedCalc® 15.1 (MedCalc, Ostend, Belgium), and SPSS 19 (SPSS, Chicago, IL, USA).
Results
Identification of THBG by proteomics in the discovery panel
The discovery panel, which included 8 male smokers with or without COPD, was used to identify biomarker candidates. Details are presented in Table S1.
The quality of the iTRAQ-labeling proteomics is assessed in Figure S1. Thirteen proteins were upregulated and 28 were downregulated in COPD patients compared to those in controls. The expression profile is listed in Table S2. Because of the limited availability of kits, only THBG, galectin-7, and peroxiredoxin-2 were verified by ELISA. Figure S2 shows that the relative intensities of the 3 proteins quantified by iTRAQ were similar to their relative concentrations measured by ELISA.
THBG was initially identified based on the representative MS/MS spectrum (–GWVDLFVPK–) with 7 typical b-ions and 5 y-ions, as shown in the upper panel of Figure 2. Levels of THBG in COPD patients were higher than in smokers without COPD, as presented in the lower panel of Figure 2.
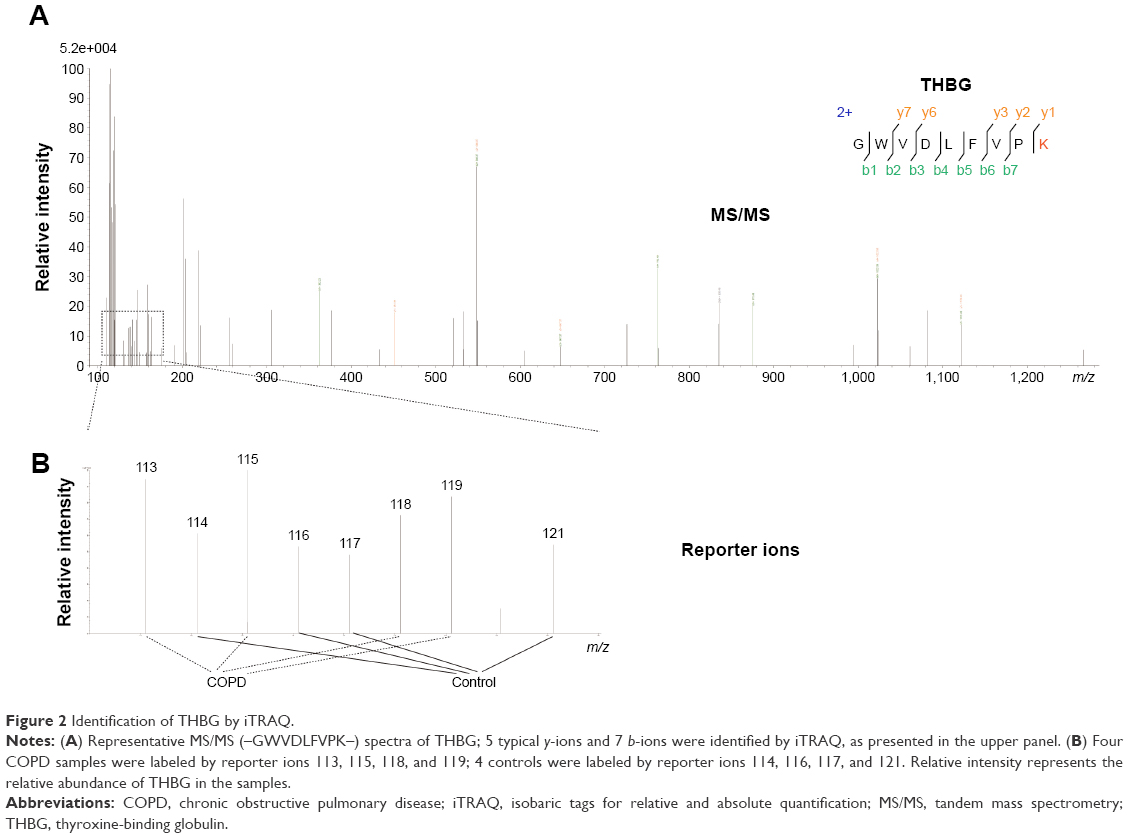 | Figure 2 Identification of THBG by iTRAQ. |
Validation of candidates by ELISA in the verification panel
The verification panel, which included 86 male smokers with or without COPD, was used to verify these candidates via ELISA. Detailed information about the subjects is shown in Table 1.
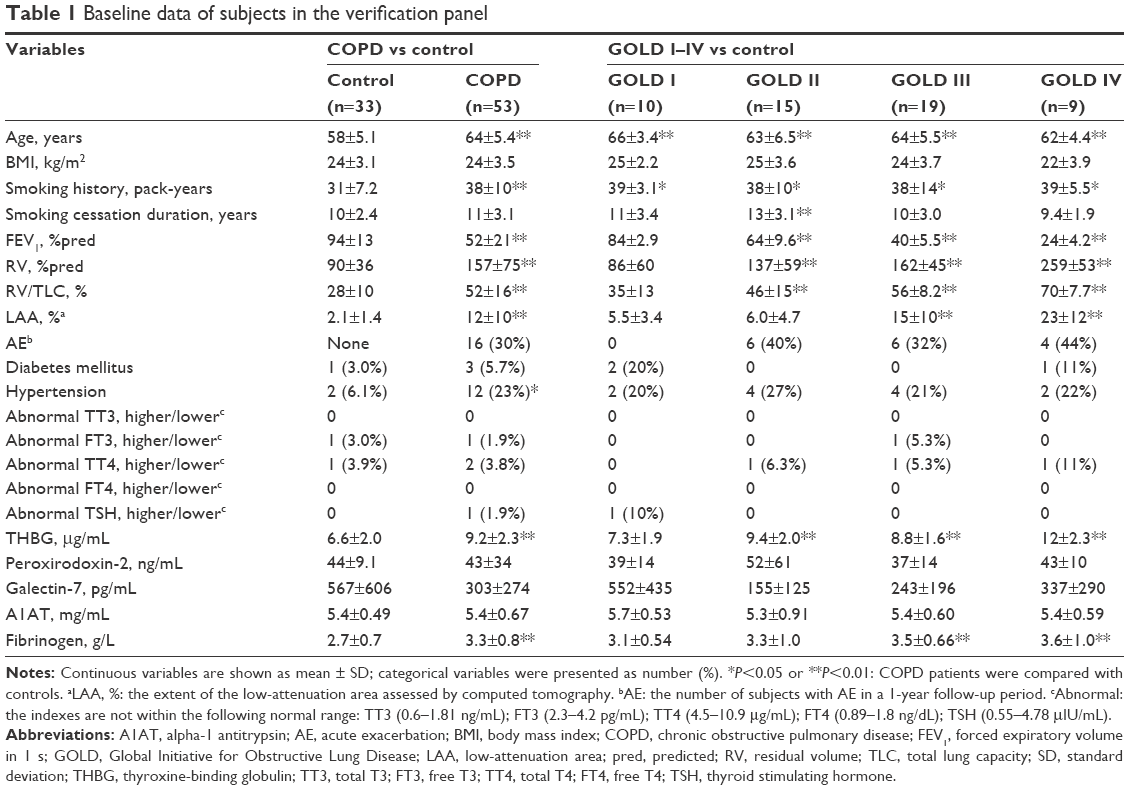 | Table 1 Baseline data of subjects in the verification panel |
Age, smoking history, hypertension, and smoking cessation duration were significantly different between COPD patients and controls, as well as between subgroups of COPD patients and controls, and they needed to be corrected by multivariate linear regression model and covariance analyses as potential confounders. Galectin-7 and peroxiredoxin-2 were not significantly different between groups, as shown in Figure S3.
Levels of THBG were higher in COPD patients (9.2±2.3 μg/mL) than in controls (6.6±2.0 μg/mL). ANOVA with a post hoc test indicated that THBG levels in GOLD stages II (9.4±2.0 μg/mL), III (8.8±1.6 μg/mL), and IV (12±2.3 μg/mL) patients were elevated, but no shift was observed in GOLD I patients (7.3±1.9 μg/mL), compared with controls (6.6±2.0 μg/mL). Fibrinogen, a relatively acknowledged marker, was selected as a reference. Fibrinogen levels were significantly different among the different groups. However, a post hoc test indicated that fibrinogen levels in GOLD III and IV patients were only slightly elevated compared with those in controls. The corresponding bar chart is presented in Figure 3. Covariance analysis and a multivariate linear regression model, correcting for age, smoking history, hypertension, and smoking cessation duration, demonstrated that the group (COPD vs control; or GOLD I–IV vs control) was still an independent factor that influenced THBG levels, as shown in Table S3.
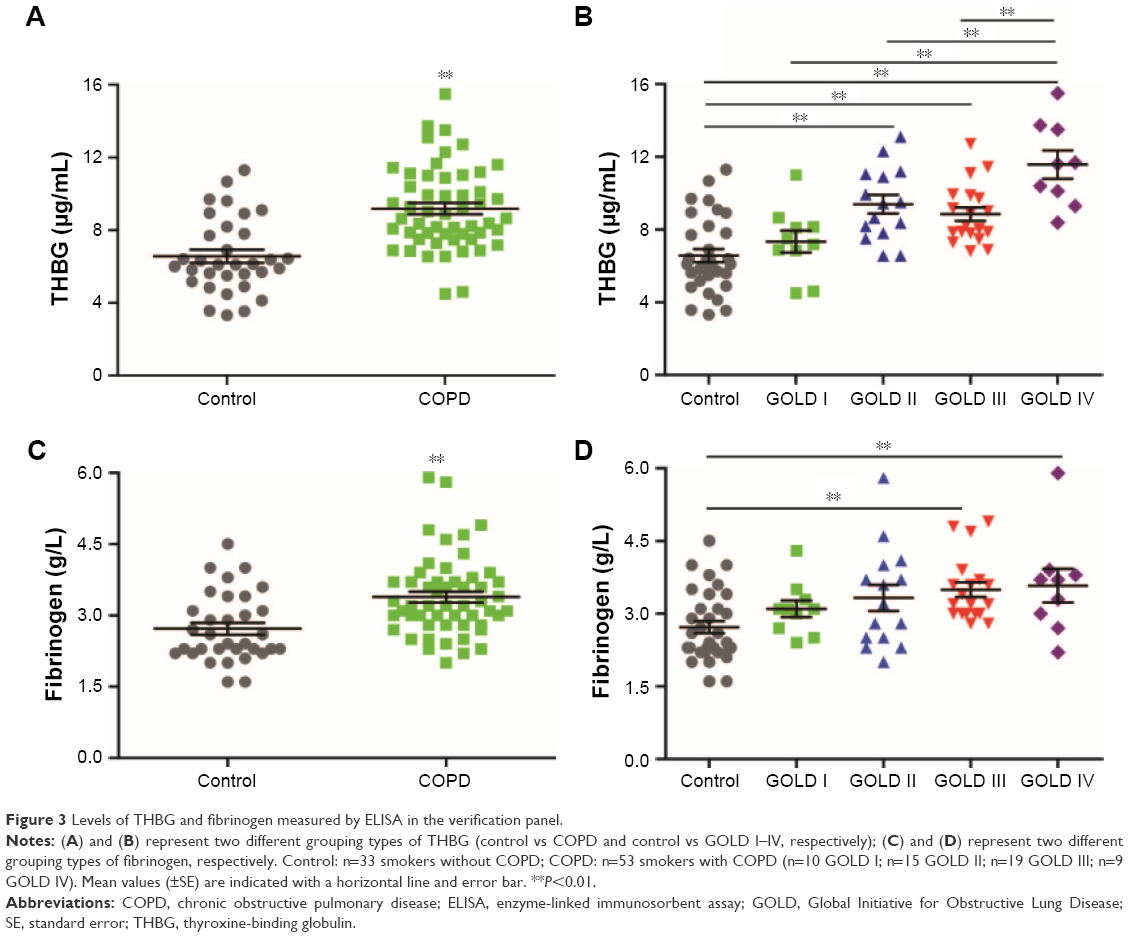 | Figure 3 Levels of THBG and fibrinogen measured by ELISA in the verification panel. |
Alpha-1 antitrypsin (A1AT), also called serpin family A member 1 (SERPINA1), plays a key role in the pathogenesis of emphysema. THBG, also called serpin family A member 7 (SERPINA7), belongs to serpin family A. Thus, the levels of A1AT were detected as a reference. However, the levels of A1AT were not significantly different among different groups. More details are shown in Figure S4.
Monitoring values of THBG for the progression of COPD
To explore whether THBG could assist in the management of COPD, ROC curves for THBG, fibrinogen, and their combination were generated and are presented in Figure 4. Figure 4A indicates that both THBG (AUC: 0.814; 95% confidence interval [CI]: 0.716–0.890) and fibrinogen (AUC: 0.739; 95% CI: 0.633–0.828) were slightly able to differentiate between COPD patients and controls. Figure 4B indicates that THBG (AUC: 0.786; 95% CI: 0.652–0.887) could distinguish between GOLD I and GOLD II–IV patients, whereas fibrinogen (AUC: 0.623; 95% CI: 0.480–0.753) could not. Figure 4C indicates that THBG (AUC: 0.639; 95% CI: 0.495–0.766) and fibrinogen (AUC: 0.616; 95% CI: 0.472–0.746) could not distinguish between GOLD I, II and GOLD III, IV patients. Figure 4D indicates that THBG (AUC: 0.851; 95% CI: 0.726–0.934) was better able to distinguish between GOLD I–III and GOLD IV patients than could fibrinogen (AUC: 0.582; 95% CI: 0.439–0.716). The combination of THBG and fibrinogen outperformed the separate factors in Figure 4A–C. Cutoff values with the corresponding sensitivity and specificity are described in Table S4.
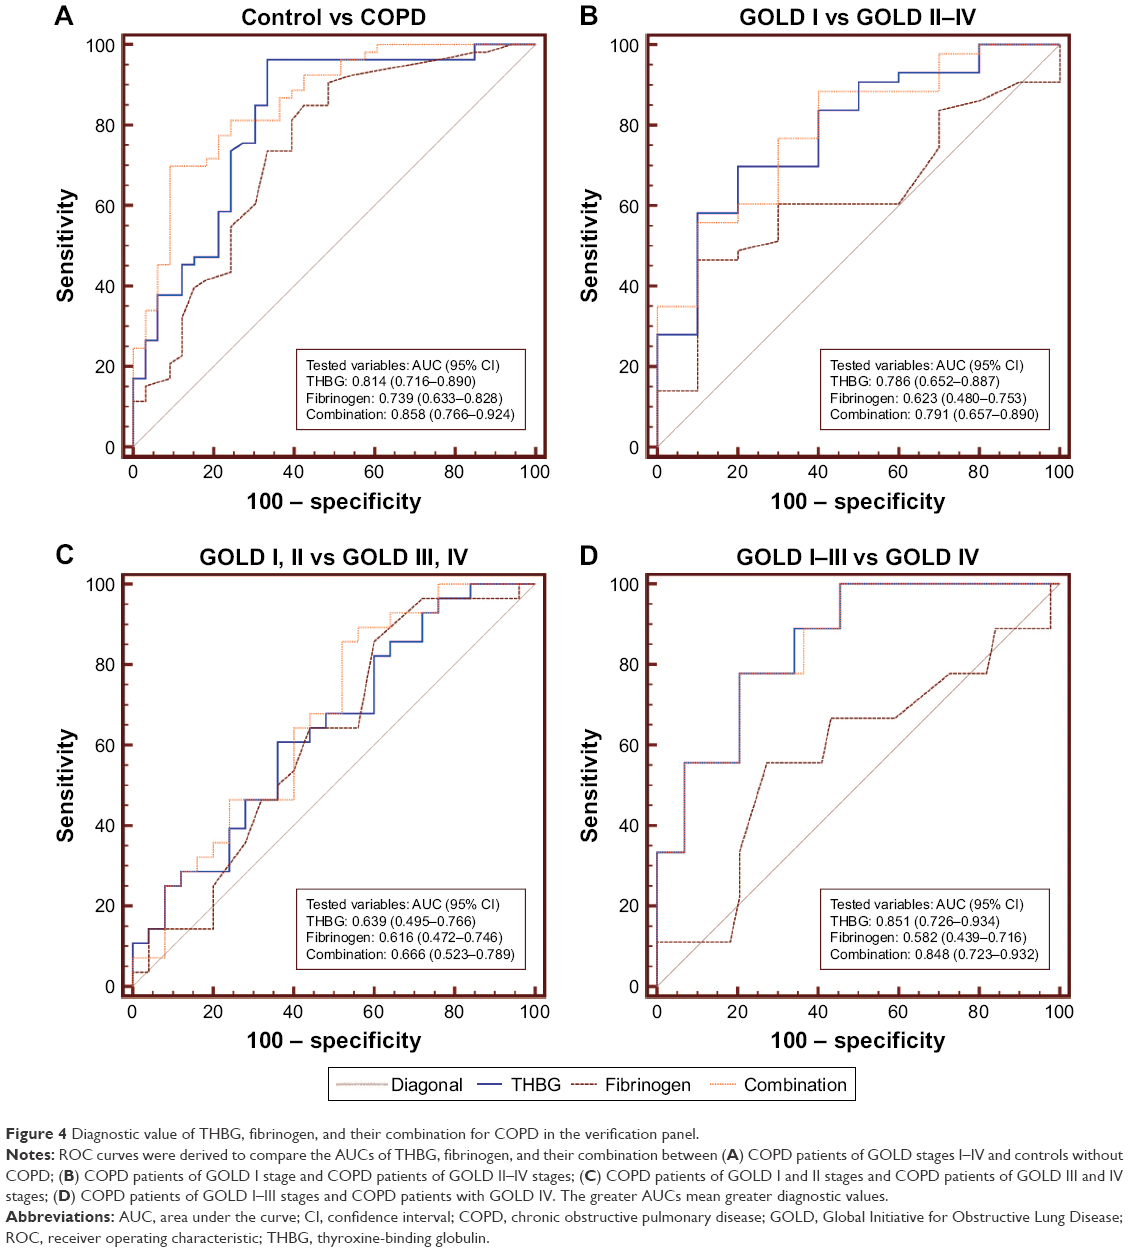 | Figure 4 Diagnostic value of THBG, fibrinogen, and their combination for COPD in the verification panel. |
Correlation of THBG with lung function
THBG was negatively associated with FEV1%pred (r=−0.559, P=0.000) and positively associated with RV/TLC (r=0.464, P=0.000), RV%pred (r=0.381, P=0.000), and LAA% (r=0.446, P=0.000), as shown in Figure 5A–D, respectively. Due to the association of age with THBG (r=0.246, P=0.022), age was recognized as a confounder. More details are listed in Table S5.
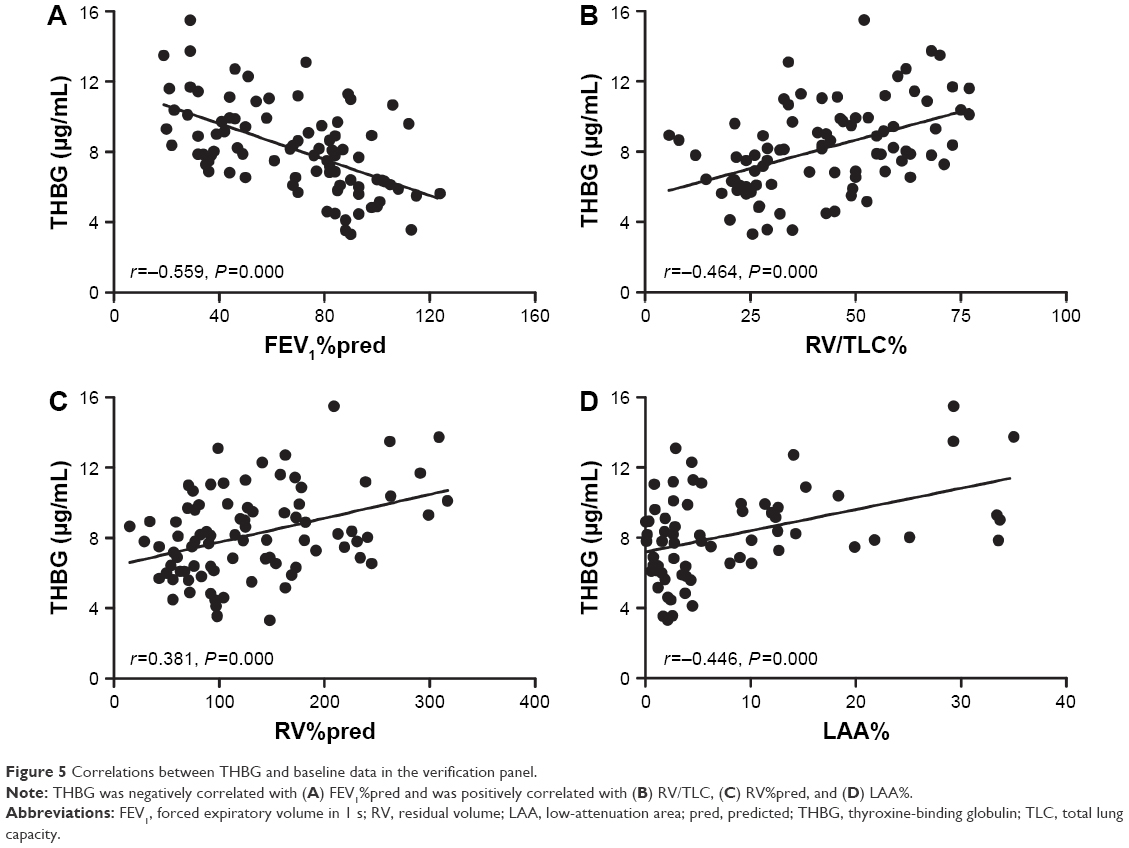 | Figure 5 Correlations between THBG and baseline data in the verification panel. |
The partial correlation and multivariate linear regression model, corrected for age, indicated that THBG was still associated with FEV1%pred, RV/TLC%, RV%pred, and LAA%, as shown in Table S6.
Relationship between baseline THBG levels and AE
In the 1-year follow-up program, AE information was collected from COPD patients. The COPD patients were divided into high- and low-level groups based on the median level of THBG (8.66 μg/mL). The Kaplan–Meier curve with log-rank test (P=0.014) showed that the occurrence time of AEs in the high-level group was shorter than that in the low-level group, as presented in Figure 6.
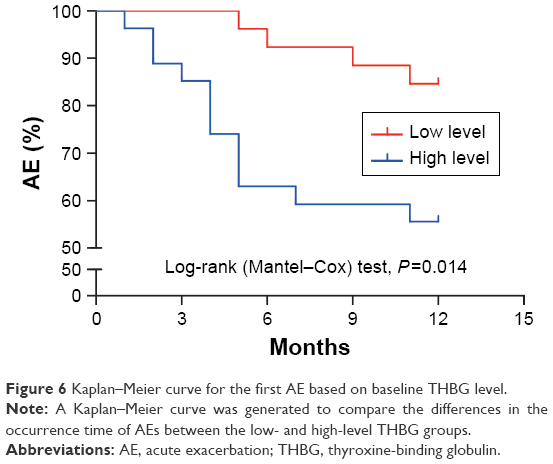 | Figure 6 Kaplan–Meier curve for the first AE based on baseline THBG level. |
Potential risk factors related to AE (ie, THBG level, FEV1%pred, age, smoking history, smoking cessation duration, hypertension, and diabetes mellitus) were analyzed using the Cox proportional hazards model. The results revealed that THBG level was an independent risk factor (HR: 4.229, P=0.032), as shown in Table S7. This finding indicated that AE risk in the high-level THBG group increased 3.229-fold compared with that in the low-level group.
Baseline THBG levels did not predict the alterations of FEV1%pred, RV/TLC%, or RV%pred within a 1-year follow-up, as shown in Figure S5.
Discussion
THBG was identified by iTRAQ-labeling proteomics, and its plasma levels in COPD were elevated compared with those in controls and were associated with the severity of lung function. THBG was able to distinguish patients with worse lung function and performed better if combined with fibrinogen. Higher baseline THBG levels predicted a greater risk of AE.
In total, 41 differentially expressed proteins were identified by proteomics in the discovery panel, some of which have been reported previously, such as platelet factor 4 and lipopolysaccharide-binding protein.30,31 These results suggested that iTRAQ-labeling proteomics has the potential to identify the markers of COPD. Global repeatability and quantification of the proteomic technique exhibited excellent performance, indicating that its identification and quantification abilities were reliable. The data verified by ELISA further demonstrated the reliability of proteomics.
Eventually, THBG, a hepatic-origin plasma protein, was identified and verified in the verification panel. The biological function of THBG is to carry thyroid hormones,32 and it binds >70% of T3 and T4 in circulation.33 Recently, researchers have emphasized a disorder of the endocrine system in patients with COPD.34,35 Several studies have found that subclinical hypothyroidism (with elevated TSH but without elevated T3 and T4) is related to frequent AEs and reduced lung function in COPD patients.34,35 In the study, no differences in thyroid function, including TSH, were observed between COPD patients and controls. However, THBG was elevated in COPD patients and was associated with AEs and the severity of lung function. Thus, the assumption is that increased THBG is also a feedback for “subclinical hypothyroidism” in COPD patients and even reflects an earlier alteration in these people. Unfortunately, THBG was not detected as a test item in these past studies.34,35 To further explore the relationship between COPD and thyroid function, it is recommended that THBG be measured in future studies. In addition to the well-known physiological function, structural features of THBG also draw our attention. A1AT (SERPINA1) is a key protease inhibitor involved in the progression of COPD with emphysema.36 In terms of genomics, THBG (SERPINA7) is also a serine protease inhibitor and may play an important role in the progression of COPD or emphysema.37
The value of monitoring THBG was evaluated using ROC curves. The study found that THBG levels in COPD patients were elevated compared with those in controls, and ROCs also suggested that THBG could differentiate COPD patients from controls, indicating that THBG is a potential marker for COPD. Although the independent diagnostic value of THBG and fibrinogen for COPD was not strong enough, their combination showed a larger clinical value. Thus, the combined application of multiple markers would be helpful for the management of COPD. Notably, THBG had a greater ability to identify patients with more severe lung function than fibrinogen, which offers a new strategy to monitor the progression of COPD patients.
The biological value of THBG was assessed by correlation analyses. The study revealed that THBG was associated with FEV1%pred, indicating that it is likely to be involved in the limitation of the airway; THBG was also related to RV%pred, RV/TLC, and LAA%, indicating that it possibly participates in the pathological process of emphysema. Moreover, the saturability of THBG is barely >25% due to the low abundance of T3 and T4 in the bloodstream.38 Therefore, high levels of free THBG offer a basis for its involvement in other biological processes. In this study, A1AT (SERPINA1) was not altered, which was in accordance with previous studies among Chinese patients,39 but THBG (SERPINA7) was elevated in COPD patients. Therefore, it was considered worthwhile to further explore the potential clinical and biological value of THBG in patients with COPD.
The predictive capacity of baseline THBG for AEs was analyzed in a 1-year follow-up program. The Kaplan–Meier curve indicated that AEs occurred more often in patients with higher THBG levels than in those with lower THBG levels over a period of 1 year. The Cox proportional hazards model, corrected for FEV1%pred, age, smoking history, smoking cessation duration, hypertension, and diabetes mellitus, demonstrated that the baseline THBG level was still an independent factor that could predict the occurrence of AEs. Moreover, it also revealed that COPD patients with higher baseline THBG levels had greater risks of AEs than those with lower THBG levels. In addition, the relationship between baseline THBG and the progression of lung function was also explored. However, baseline THBG did not predict the minor alterations in lung function because of the shorter follow-up period in the study.
There are several merits in this study. 1) Another larger panel was selected to verify THBG levels rather than only the discovery panel. 2) The verification panel was followed up for a year, which allowed us to explore the relationship between THBG and AE. 3) A multivariate regression model, corrected for unmatched variables or risk factors, ensured the reliability of the conclusions.
There are several limitations in the study. 1) Only 8 participants were enrolled in the discovery panel because iTRAQ-labeling proteomics included only 8 different isotopic tags. 2) Only 3 candidate proteins identified by proteomics were verified by ELISA in the verification panel due to the limited availability of kits. 3) The population in this study was relatively low, which may have caused potential bias. Thus, the validity of THBG still needs to be verified in larger clinical trials in the future. 4) This pilot study found an association between THBG and lung function but did not reveal their causal relationship. In the future, the potential mechanism of THBG action in COPD will be our main study direction. 5) The relationship of THBG with treatment was not investigated in this study, which will be explored in future studies. 6) Nonsmokers without COPD were not included in this study, limiting our understanding of the relationships among THBG, smoking, and COPD. Nonsmokers should be included in future studies. 7) The lung function of subjects did not clearly change in the 1-year follow-up period, restricting further analyses of the progression of disease.
Conclusion
THBG is a potential plasma biomarker for COPD, which could assist us in the management of stable stages and AEs in COPD patients. It offers new insights into the pathogenesis of COPD.
Acknowledgments
The authors thank all contributors to the study. In addition, they thank BGI (Shenzhen, China), for performing the proteomic analyses. This work was supported by the National Natural Science Foundation of China (grant numbers 81270097 and 81470235) and Beijing Medical University (grant number 20110176). The funders had no role in study design, data collection and analysis, the decision to publish, or the preparation of the manuscript.
Author contributions
All authors declare their individual contributions to the article. Bei He completed the global design of the study and revised the article; Wenqi Diao conducted statistical analyses and interpretation and wrote the manuscript; Ning Shen and Yipeng Du enrolled subjects and obtained plasma samples; Xiaoyan Sun performed lung function tests for all subjects; Beibei Liu collected the clinical information of subjects; Ming Xu assisted in the revision of the manuscript. All authors contributed to the data analysis, drafting, and critical revision of the paper; approved the final version of the manuscript; and agreed to be accountable for all aspects of the work.
Disclosure
The authors report no conflicts of interest in this work.
References
Vestbo J, Hurd SS, Agusti AG, et al. Global strategy for the diagnosis, management, and prevention of chronic obstructive pulmonary disease: GOLD executive summary. Am J Respir Crit Care Med. 2013;187(4):347–365. | ||
Vafaee F. Using multi-objective optimization to identify dynamical network biomarkers as early-warning signals of complex diseases. Sci Rep. 2016;6:22023. | ||
Lee KY, Chuang HC, Chen TT, et al. Proteoglycan 4 is a diagnostic biomarker for COPD. Int J Chron Obstruct Pulmon Dis. 2015;10:1999–2007. | ||
Narute P, Seam N, Tropea M, et al. Temporal changes in microRNA expression in blood leukocytes from patients with the acute respiratory distress syndrome. Shock. Epub 2016 Nov 21. | ||
Klupczynska A, Derezinski P, Garrett TJ, et al. Study of early stage non-small-cell lung cancer using Orbitrap-based global serum metabolomics. J Cancer Res Clin Oncol. 2017;143(4):649–659. | ||
Vestbo J, Rennard S. Chronic obstructive pulmonary disease biomarkers for disease activity needed – urgently. Am J Respir Crit Care Med. 2010;182(7):863–864. | ||
Koutsokera A, Kostikas K, Nicod LP, Fitting JW. Pulmonary biomarkers in COPD exacerbations: a systematic review. Respir Res. 2013;14:111. | ||
Thyagarajan B, Jacobs DR, Apostol GG, Smith LJ, Lewis CE, Williams OD. Plasma fibrinogen and lung function: the CARDIA Study. Int J Epidemiol. 2006;35(4):1001–1008. | ||
Carter RI, Ungurs MJ, Pillai A, Mumford RA, Stockley RA. The relationship of the fibrinogen cleavage biomarker Aα-Val360 with disease severity and activity in α1-antitrypsin deficiency. Chest. 2015;148(2):382–388. | ||
Janssen DJ, Mullerova H, Agusti A, et al; Eclipse Investigators. Persistent systemic inflammation and symptoms of depression among patients with COPD in the ECLIPSE cohort. Respir Med. 2014;108(11):1647–1654. | ||
Agusti A, Edwards LD, Rennard SI, et al; Evaluation of COPD Longitudinally to Identify Predictive Surrogate Endpoints (ECLIPSE) Investigators. Persistent systemic inflammation is associated with poor clinical outcomes in COPD: a novel phenotype. PLoS One. 2012;7(5):e37483. | ||
Lock-Johansson S, Vestbo J, Sorensen GL. Surfactant protein D, club cell protein 16, pulmonary and activation-regulated chemokine, C-reactive protein, and fibrinogen biomarker variation in chronic obstructive lung disease. Respir Res. 2014;15:147. | ||
Fang JY, Wang PW, Huang CH, Chen MH, Wu YR, Pan TL. Skin aging caused by intrinsic or extrinsic processes characterized with functional proteomics. Proteomics. 2016;16(20):2718–2731. | ||
Poersch A, Grassi ML, Carvalho VP, et al. A proteomic signature of ovarian cancer tumor fluid identified by high throughput and verified by targeted proteomics. J Proteomics. 2016;145:226–236. | ||
Zhang Y, Chen X, Hu Y, et al. Preliminary characterizations of a serum biomarker for sarcoidosis by comparative proteomic approach with tandem-mass spectrometry in ethnic Han Chinese patients. Respir Res. 2013;14:18. | ||
O’Neil SE, Sitkauskiene B, Babusyte A, et al. Network analysis of quantitative proteomics on asthmatic bronchi: effects of inhaled glucocorticoid treatment. Respir Res. 2011;12:124. | ||
Ishikawa N, Ohlmeier S, Salmenkivi K, et al. Hemoglobin alpha and beta are ubiquitous in the human lung, decline in idiopathic pulmonary fibrosis but not in COPD. Respir Res. 2010;11:123. | ||
Diao WQ, Shen N, Du YP, et al. Fetuin-B (FETUB): a plasma biomarker candidate related to the severity of lung function in COPD. Sci Rep. 2016;6:30045. | ||
Lee EJ, In KH, Kim JH, et al. Proteomic analysis in lung tissue of smokers and COPD patients. Chest. 2009;135(2):344–352. | ||
Auffray C, Adcock IM, Chung KF, Djukanovic R, Pison C, Sterk PJ. An integrative systems biology approach to understanding pulmonary diseases. Chest. 2010;137(6):1410–1416. | ||
Gray RD, MacGregor G, Noble D, et al. Sputum proteomics in inflammatory and suppurative respiratory diseases. Am J Respir Crit Care Med. 2008;178(5):444–452. | ||
Bozinovski S, Hutchinson A, Thompson M, et al. Serum amyloid-a is a biomarker of acute exacerbations of chronic obstructive pulmonary disease. Am J Respir Crit Care Med. 2008;177(3):269–278. | ||
Chhabra SK, Gupta M. Exhaled breath condensate analysis in chronic obstructive pulmonary disease. Indian J Chest Dis Allied Sci. 2012;54(1):27–37. | ||
Tu C, Mammen MJ, Li J, et al. Large-scale, ion-current-based proteomics investigation of bronchoalveolar lavage fluid in chronic obstructive pulmonary disease patients. J Proteome Res. 2014;13(2):627–639. | ||
Terracciano R, Pelaia G, Preiano M, Savino R. Asthma and COPD proteomics: current approaches and future directions. Proteomics Clin Appl. 2015;9(1–2):203–220. | ||
Wiktorowicz JE, Jamaluddin M. Proteomic analysis of the asthmatic airway. Adv Exp Med Biol. 2014;795:221–232. | ||
Govender P, Dunn MJ, Donnelly SC. Proteomics and the lung: analysis of bronchoalveolar lavage fluid. Proteomics Clin Appl. 2009;3(9):1044–1051. | ||
Madani A, Van Muylem A, de Maertelaer V, Zanen J, Gevenois PA. Pulmonary emphysema: size distribution of emphysematous spaces on multidetector CT images – comparison with macroscopic and microscopic morphometry. Radiology. 2008;248(3):1036–1041. | ||
Hubl W, Meissner D, Demant T, et al. Evaluation of the LIAISON thyroid chemiluminescence immunoassays. Clin Lab. 2000;46(3–4):181–189. | ||
Wedzicha JA, Syndercombe-Court D, Tan KC. Increased platelet aggregate formation in patients with chronic airflow obstruction and hypoxaemia. Thorax. 1991;46(7):504–507. | ||
Groenewegen KH, Postma DS, Hop WC, et al. Increased systemic inflammation is a risk factor for COPD exacerbations. Chest. 2008;133(2):350–357. | ||
Gerhard DS, Wagner L, Feingold EA, et al; MGC Project Team. The status, quality, and expansion of the NIH full-length cDNA project: the Mammalian Gene Collection (MGC). Genome Res. 2004;14(10B):2121–2127. | ||
Refetoff S. Abnormal thyroid hormone transport. In: De Groot LJ, Beck-Peccoz P, Chrousos G, et al, editors. Endotext [Internet]. South Dartmouth, MA: MDText.com, Inc.; 2000. Available from: https://www.ncbi.nlm.nih.gov/books/NBK285563/ | ||
SarincUlasli S, Bozbas SS, Ozen ZE, Ozyurek BA, Ulubay G. Effect of thyroid function on COPD exacerbation frequency: a preliminary study. Multidiscip Respir Med. 2013;8(1):64. | ||
Terzano C, Romani S, Paone G, Conti V, Oriolo F. COPD and thyroid dysfunctions. Lung. 2014;192(1):103–109. | ||
Morse JO. Alpha1-antitrypsin deficiency (first of two parts). N Engl J Med. 1978;299(19):1045–1048. | ||
Hayashi Y, Mori Y, Janssen OE, et al. Human thyroxine-binding globulin gene: complete sequence and transcriptional regulation. Mol Endocrinol. 1993;7(8):1049–1060. | ||
Wada N, Chiba H, Shimizu C, Kijima H, Kubo M, Koike T. A novel missense mutation in codon 218 of the albumin gene in a distinct phenotype of familial dysalbuminemic hyperthyroxinemia in a Japanese kindred. J Clin Endocrinol Metab. 1997;82(10):3246–3250. | ||
Kwok JS, Lawton JW, Yew WW, Chau CH, Lee J, Wong PC. Protease inhibitor phenotypes and serum alpha-1-antitrypsin levels in patients with COPD: a study from Hong Kong. Respirology. 2004;9(2):265–270. |
Supplementary materials
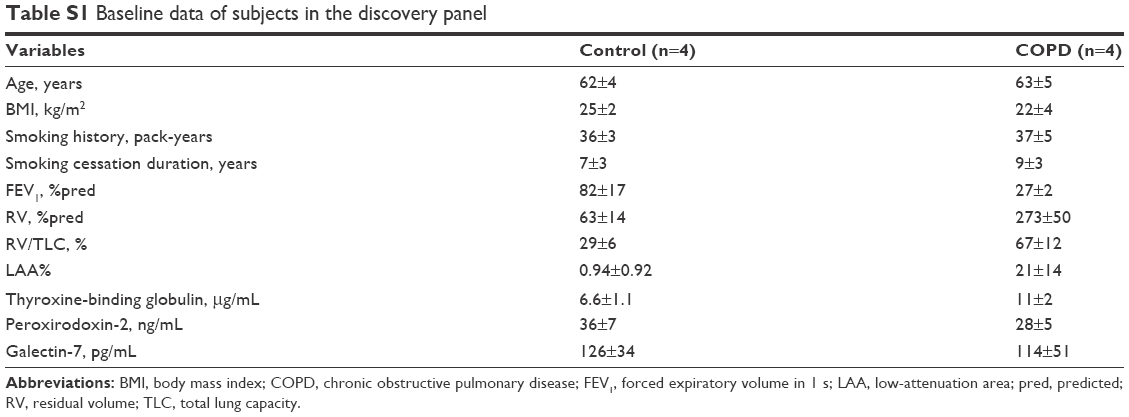 | Table S1 Baseline data of subjects in the discovery panel |
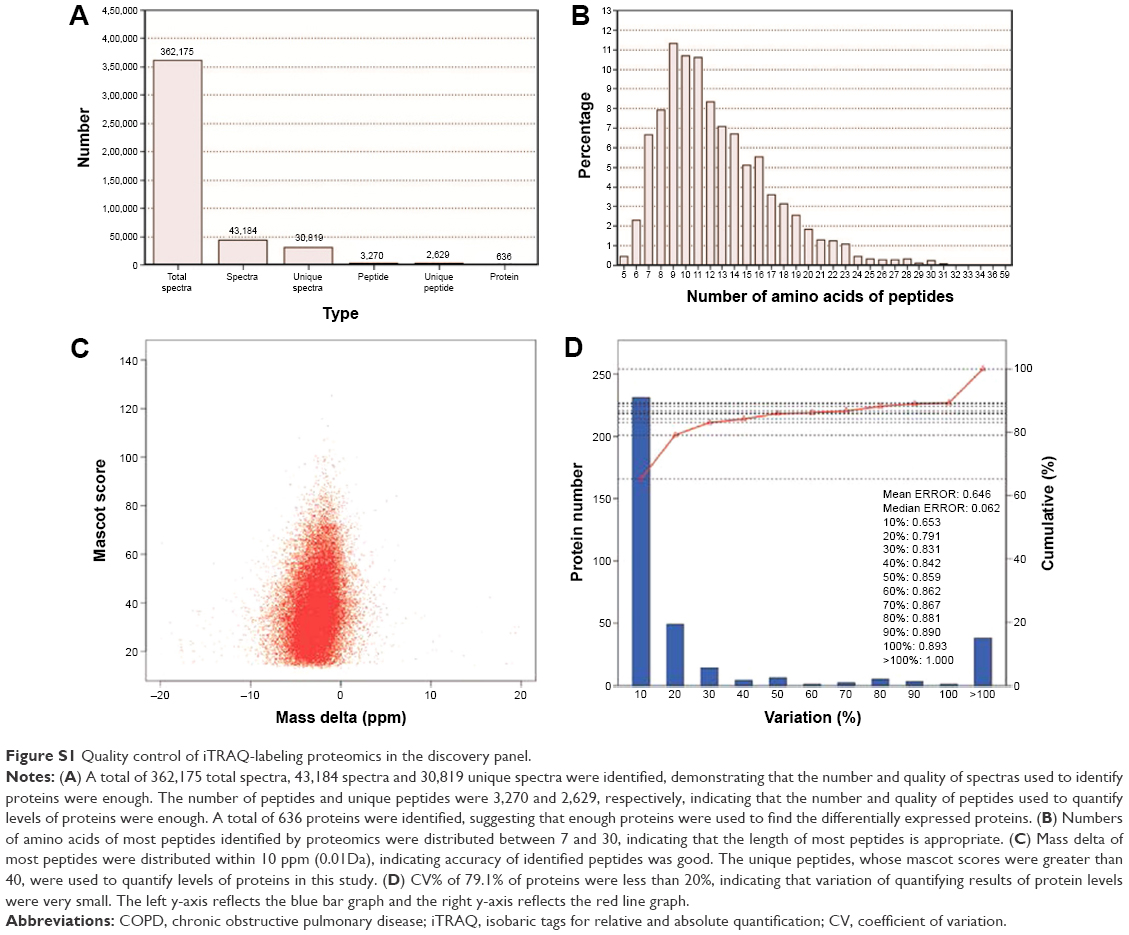 | Figure S1 Quality control of iTRAQ-labeling proteomics in the discovery panel. |
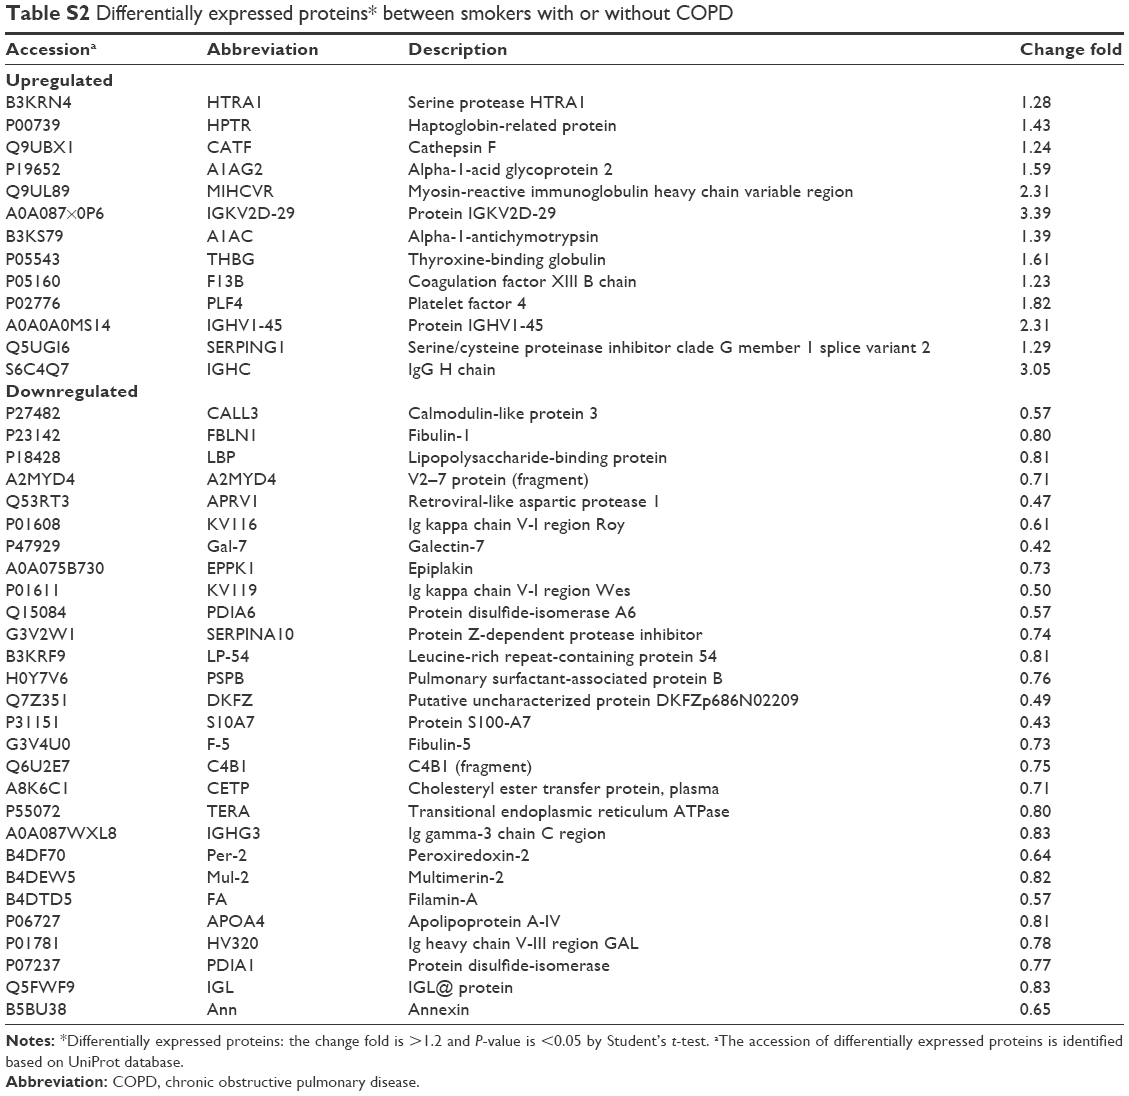 | Table S2 Differentially expressed proteins* between smokers with or without COPD |
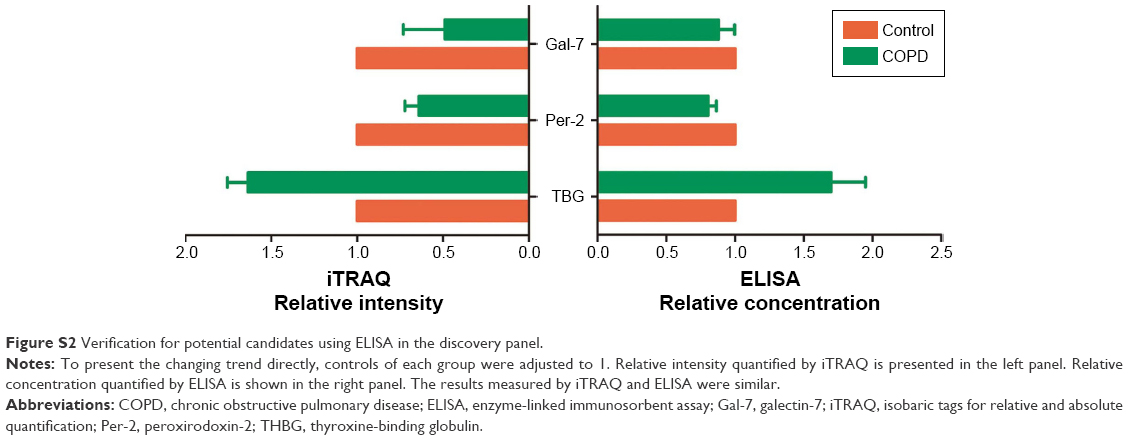 | Figure S2 Verification for potential candidates using ELISA in the discovery panel. |
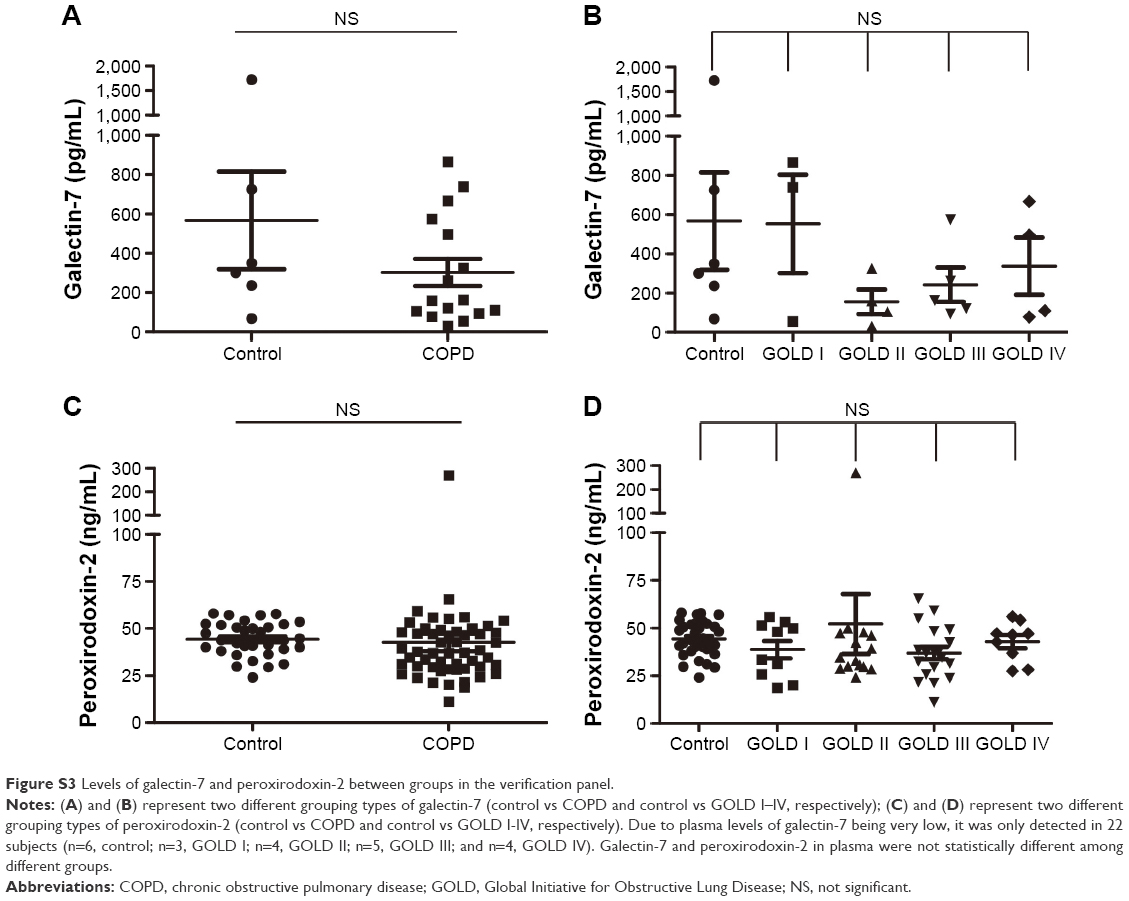 | Figure S3 Levels of galectin-7 and peroxirodoxin-2 between groups in the verification panel. |
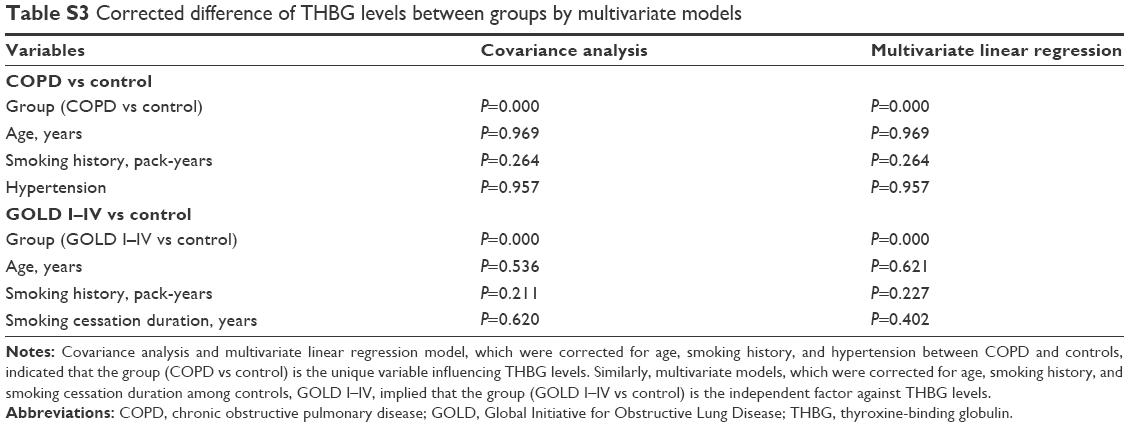 | Table S3 Corrected difference of THBG levels between groups by multivariate models |
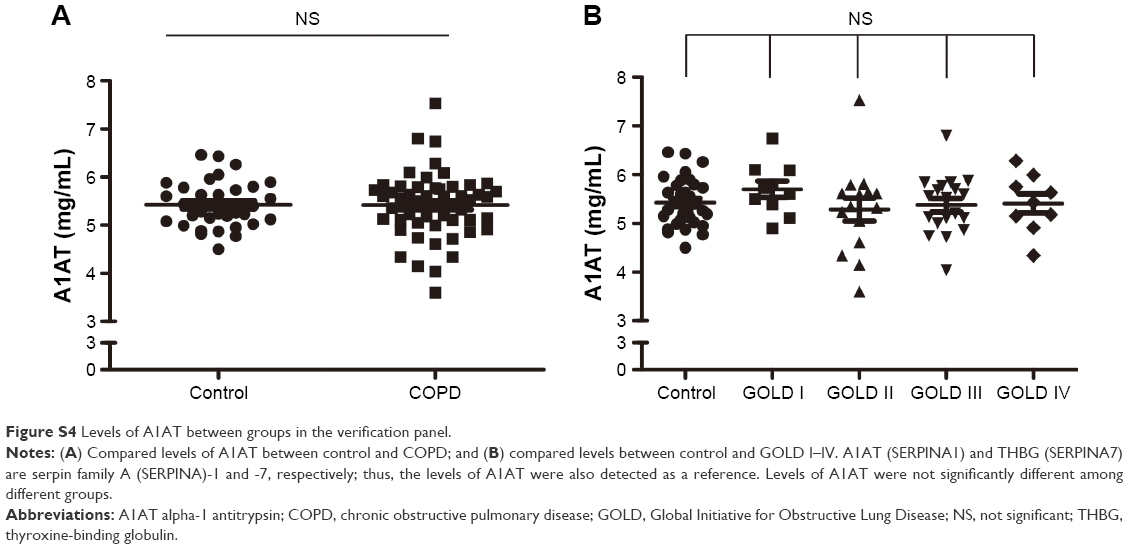 | Figure S4 Levels of A1AT between groups in the verification panel. |
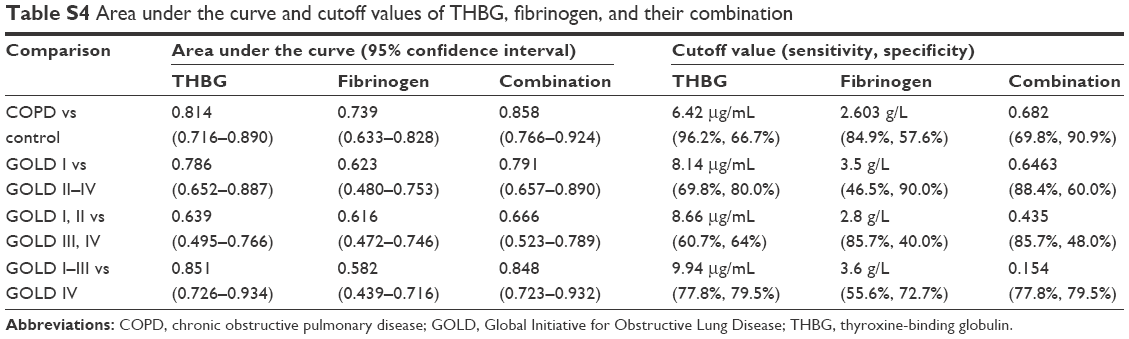 | Table S4 Area under the curve and cutoff values of THBG, fibrinogen, and their combination |
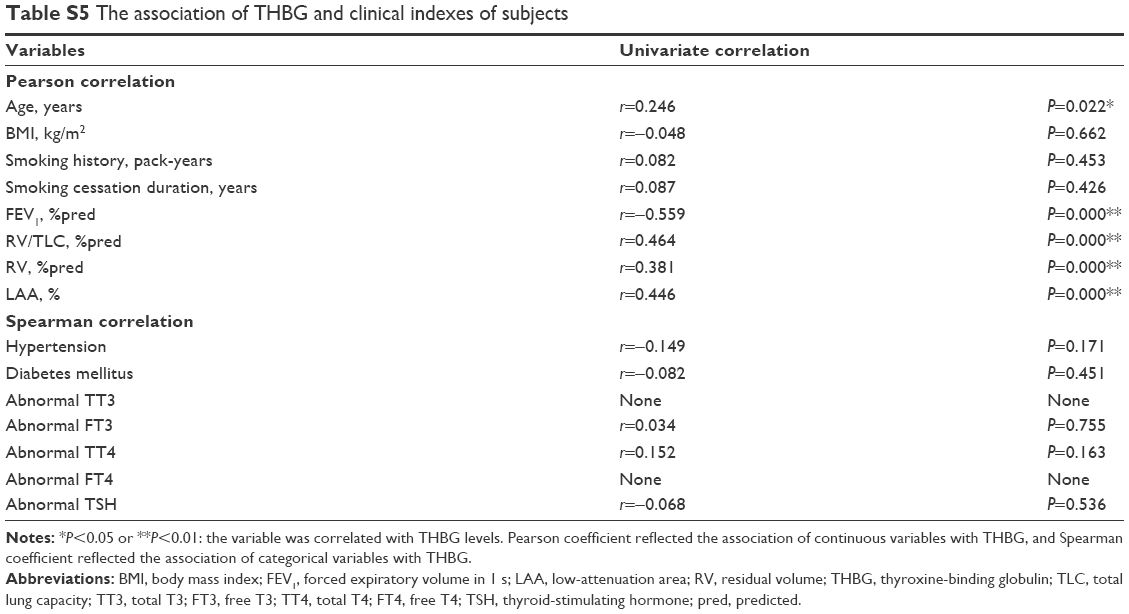 | Table S5 The association of THBG and clinical indexes of subjects |
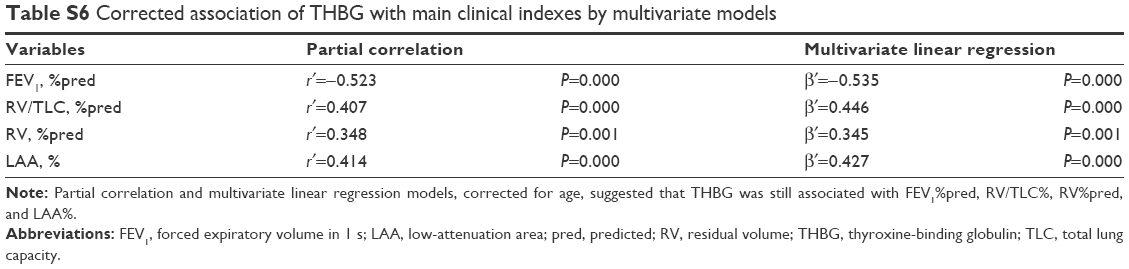 | Table S6 Corrected association of THBG with main clinical indexes by multivariate models |
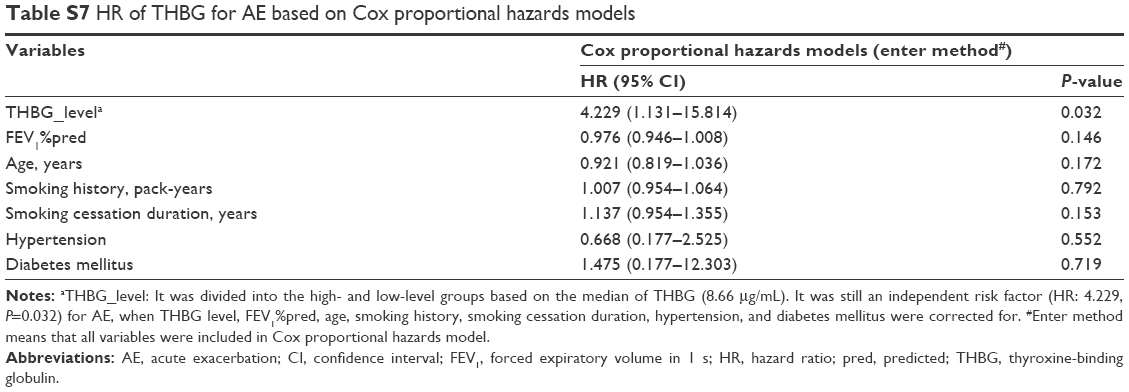 | Table S7 HR of THBG for AE based on Cox proportional hazards models |
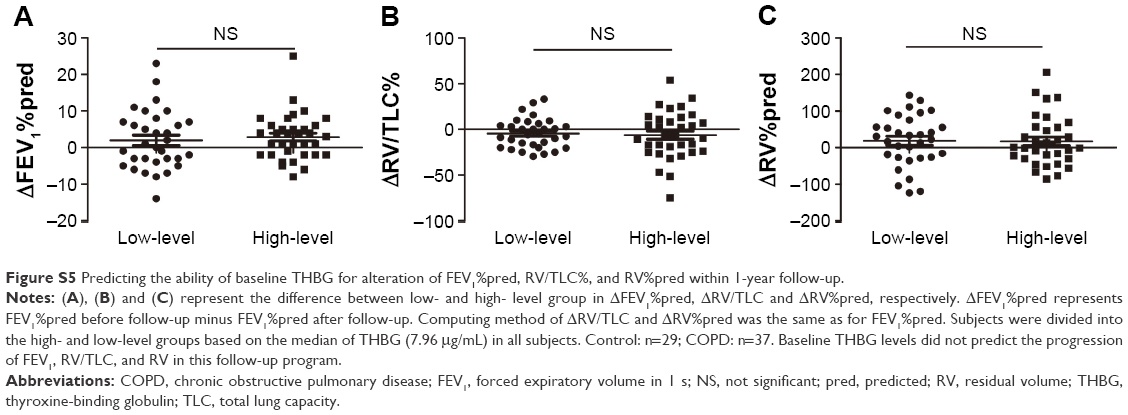 | Figure S5 Predicting the ability of baseline THBG for alteration of FEV1%pred, RV/TLC%, and RV%pred within 1-year follow-up. |
 © 2017 The Author(s). This work is published and licensed by Dove Medical Press Limited. The
full terms of this license are available at https://www.dovepress.com/terms
and incorporate the Creative Commons Attribution
- Non Commercial (unported, 3.0) License.
By accessing the work you hereby accept the Terms. Non-commercial uses of the work are permitted
without any further permission from Dove Medical Press Limited, provided the work is properly
attributed. For permission for commercial use of this work, please see paragraphs 4.2 and 5 of our Terms.
© 2017 The Author(s). This work is published and licensed by Dove Medical Press Limited. The
full terms of this license are available at https://www.dovepress.com/terms
and incorporate the Creative Commons Attribution
- Non Commercial (unported, 3.0) License.
By accessing the work you hereby accept the Terms. Non-commercial uses of the work are permitted
without any further permission from Dove Medical Press Limited, provided the work is properly
attributed. For permission for commercial use of this work, please see paragraphs 4.2 and 5 of our Terms.