Back to Journals » Cancer Management and Research » Volume 13
Identification of Three Potential Prognostic Genes in Platinum-Resistant Ovarian Cancer via Integrated Bioinformatics Analysis
Authors Zhang X, Wei X, Bai G, Huang X ![]() , Hu S, Mao H, Liu P
, Hu S, Mao H, Liu P ![]()
Received 29 August 2021
Accepted for publication 3 November 2021
Published 16 November 2021 Volume 2021:13 Pages 8629—8646
DOI https://doi.org/10.2147/CMAR.S336672
Checked for plagiarism Yes
Review by Single anonymous peer review
Peer reviewer comments 2
Editor who approved publication: Dr Sanjeev K. Srivastava
Xue Zhang,1– 3 Xuan Wei,1– 3 Gaigai Bai,1– 3 Xueyao Huang,1– 3 Shunxue Hu,4 Hongluan Mao,1– 3 Peishu Liu1– 3
1Department of Obstetrics and Gynecology, Qilu Hospital of Shandong University, Jinan, Shandong, People’s Republic of China; 2Key Laboratory of Gynecology Oncology of Shandong Province, Qilu Hospital of Shandong University, Jinan, Shandong, People’s Republic of China; 3Shandong Engineering Laboratory for Urogynecology, Qilu Hospital of Shandong University, Jinan, Shandong, People’s Republic of China; 4Department of Pathology, Qilu Hospital of Shandong University, Jinan, Shandong, People’s Republic of China
Correspondence: Hongluan Mao; Peishu Liu
Department of Obstetrics and Gynecology, Qilu Hospital of Shandong University, 107 Wenhua Xi Road, Jinan, Shandong, People’s Republic of China
Email [email protected]; [email protected]
Purpose: Ovarian cancer is the most lethal gynecologic malignancy. Resistance to platinum-based chemotherapy affects the overall survival of patients. This study used an integrated bioinformatics to find the poorly understood molecular mechanisms underlying platinum resistance in ovarian cancer.
Methods: Based on the RNA-seq data of tissues in The Cancer Genome Atlas (TCGA) and RNA-seq data of cells from the Cancer Cell Encyclopedia (CCLE), we integrated differentially expressed genes (DEGs) in ovarian cancer tissue and cells. After screening for DEGs related to platinum resistance, we conducted survival analysis and built protein interaction networks to identify genes that may affect prognosis and interact with each other. Least absolute shrinkage and selection operator (Lasso) regression analysis was used to construct a predictive model. Immunohistochemistry and Western blot were used to validate the results. Finally, gene set enrichment analysis (GSEA) was performed on the expression of genes individually.
Results: We found that ATPase Na+/K+ transporting subunit alpha 2 (ATP1A2), calsequestrin 2 (CASQ2) and ryanodine receptor 2 (RYR2) interacted with each other and could predict resistance to platinum-based therapy, correlating negatively with prognosis. Moreover, we constructed a predictive model based on nine genes, including ATP1A2 and CASQ2. Immunohistochemistry and Western blot validated the upregulation of these genes in ovarian cancer tissue samples and cell lines. The immunohistochemistry results also confirmed the prognostic value of ATP1A2, CASQ2 and RYR2. GSEA predicted that ATP1A2, CASQ2 and RYR2 may act on the KRAS and mTORC1 pathways and participate in metabolic reprogramming and regulation of calcium homeostasis in platinum-resistant cells.
Conclusion: ATP1A2, CASQ2 and RYR2 were highly expressed in platinum-resistant ovarian cancer. ATP1A2 and CASQ2 were related to the prognosis of platinum-resistant ovarian cancer patients. These genes might act on KARS and mTORC1 pathways and participate in metabolic reprogramming and regulation of calcium homeostasis in platinum-resistant cells.
Keywords: ovarian cancer, platinum resistance, prognosis, metabolic reprogramming, calcium homeostasis
Introduction
Ovarian cancer is one of the three most common gynecologic malignancies worldwide. In the United States, there are approximately 22,000 new cases of ovarian cancer and 14,000 ovarian cancer-related deaths each year.1 Although the overall incidence and mortality of ovarian cancer is declining, it is still the most lethal gynecologic malignancy.1 One reason is that most patients are diagnosed when the disease is already at an advanced stage. The standard treatment for ovarian cancer usually involves a combination of surgery and platinum-based chemotherapy. Despite treatment availability, the recurrence rate of ovarian cancer is very high and, for approximately 75% of patients with the disease at advanced stages, the recurrence is incurable.2 The recurrence of ovarian cancer is closely related to reduced sensitivity to platinum-base antineoplastic drugs, which can be detected earlier by measuring circulating levels of CA125.3 In the past thirty years, some mechanisms of platinum resistance have been discovered. They include reduction of intracellular accumulation of platinum-based drugs through decreased uptake and enhanced efflux, enhanced drug inactivation by upregulation of metallothionein and glutathione-dependent pathways, enhanced DNA repairing ability, and modulation of apoptotic pathways.4–6 Studies have shown that cisplatin not only exerts anti-tumor effects by damaging DNA but also disrupts cell viability by causing a shift from glycolysis to oxidative phosphorylation in tumor cells.7 Therefore, metabolic reprogramming of tumor cells may be another mechanism of platinum resistance. Moreover, the characteristics of the tumor microenvironment may also result in platinum resistance in ovarian cancer. For example, hypoxic microenvironments promote the proliferation of cancer stem cells, which are associated with platinum resistance.4,8 Nevertheless, many other aspects of platinum resistance, such as representative prognostic genes in platinum-resistant ovarian cancer, remain unclear.
In this study, we used RNA-seq data of tissues and cell lines from TCGA and the CCLE databases, as well as drug resistance information from the Genomics of Drug Sensitivity in Cancer (GDSC), to compare the differential expression of genes between platinum-resistant and platinum-sensitive samples. Kaplan-Meier survival analysis, univariate Cox regression, multivariate Cox regression, protein-protein interaction network and Lasso regression analysis were used to identify genes related to platinum resistance and the prognosis of ovarian cancer patients. These analyses led to three genes of interest, ATP1A2, CASQ2 and RYR2. The role of these three genes was further investigated using immunohistochemistry (serous ovarian cancer tissue samples) and Western blot (ovarian cancer cell lines). Lastly, single-gene-related GSEA was used to explore common signaling pathways among these ATP1A2, CASQ2 and RYR2. The workflow chart is shown in Figure 1.
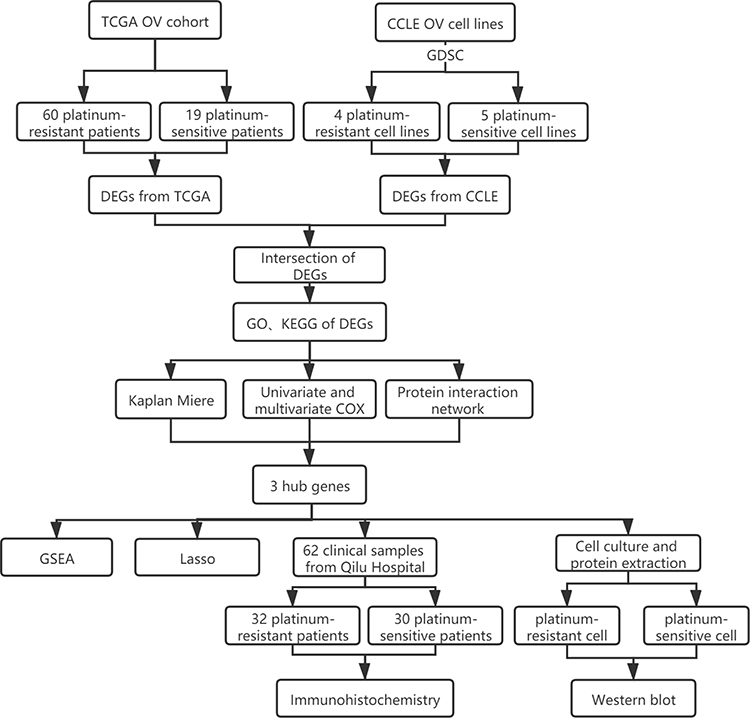 |
Figure 1 The workflow chart and experimental approach used in this study. |
Materials and Methods
Data Collection
RNA-seq data and clinical data of 379 patients diagnosed with serous ovarian cancer were downloaded from the TCGA website (https://portal.gdc.cancer.gov/). Based on clinical information, 153 patients that had been treated with platinum-based chemotherapy and had follow-up information were selected. To classify patients as platinum-resistant or platinum-sensitive, we used the threshold of 6 months of progression-free interval (PFI), as previously suggested.9 Patients with PFI > 6 months were defined as platinum-sensitive and those with PFI ≤ 6 months as platinum-resistant.9
Based on the IC50 values of cisplatin against ovarian cancer cell lines, available in the GDSC database (https://www.cancerrxgene.org/), we selected 4 platinum-resistant and 5 platinum-sensitive cell lines. The RNA-seq expression profile of those cell lines were obtained from the CCLE (https://portals.broadinstitute.org/ccle).
Paraffin sections of 62 samples diagnosed as serous ovarian cancer by pathologists in 2014–2018 were obtained from the Qilu Hospital of Shandong University. Follow-up data for these patients were obtained by interviewing them on the telephone. Sample and data collection were approved by the Ethics Committee of Qilu Hospital of Shandong University.
Identification of Differentially Expressed Genes
After normalization, the R package “DESeq2” was used to find DEGs. P values below 0.05 were considered to indicate statistical significance. DEGs from TCGA RNA-seq and DEGs from the CCLE RNA-seq were intersected to get the integrated DEGs.
Gene Ontology (GO) and Kyoto Encyclopedia of Genes and Genomes (KEGG) Pathway Enrichment Analysis
Enrichr (http://amp.pharm.mssm.edu/Enrichr/), a comprehensive gene set enrichment analysis tool, was used to conduct GO functional annotation and KEGG biological pathway enrichment using the integrated DEGs.
Survival Analysis
The clinical information of the TCGA cohort was downloaded and patients with overall survival < 30 days were screened out. Kaplan-Meier survival analysis was conducted to identify genes that might potentially be related to the prognosis. Univariate and multivariate cox proportional hazards regressions were also used to further evaluate the contribution of specific genes to the prognosis. To do so, we used the R package “survival”, where HR > 1 indicated a high-risk gene and HR < 1 indicated a low-risk gene. P values below 0.05 were considered to indicate statistical significance.
Protein Interaction Network and Identification of Hub Genes
The Search Tool for the Retrieval of Interacting Genes (STRING) database (https://string-db.org/) was used to explore protein interactions and create protein networks. The interactors score to generate the protein-protein interaction (PPI) network was set to medium (≥ 0.04). CytoHubba, a plugin for Cytoscape (Version 3.7.2), was used to identify hub genes using the MCC algorithm. The combined results of PPIs and survival analysis led to three DEGs (ATP1A2, CASQ2 and RYR2) related to prognosis.
Prognostic Predictive Model Construction Using Lasso
To further clarify the impact of these three hub genes and closely related genes on the prognosis of patients, the following scheme was adopted. First, Pearson correlation analysis was used to screen for genes with significant correlations (P < 0.05). Then, univariate Cox regression analysis was used to gauge the association between significantly correlated genes and prognosis. Finally, the Lasso regression implemented by the R package “glmnet” was used to reduce the dimensionality. After these steps, a set of eight genes related to ATP1A2 was identified, where CASQ2 was found to be an ATP1A2-related prognostic gene. Wilcoxon test and receiver operating characteristic curve (ROC) curve were utilized to evaluate the predictive effect of the model.
Immunohistochemistry
Sections (4 µm) of paraffin-embedded tissue samples were deparaffinized and hydrated. Antigen retrieval was achieved by incubating the sample in sodium citrate. Then, incubation of sections with hydrogen peroxide neutralized the effects of endogenous catalase. Goat serum was used to block non-specific antigens. Primary antibody (ATP1A2, 1:600, AB9094-I, Sigma-Aldrich, Germany; CASQ2, 1:200, ab3516, Abcam, UK; RYR2, 1:50, MA3-916, Thermo Scientific, USA) was then incubated at 4°C overnight. After incubation with horseradish peroxidase-conjugated secondary antibody, sections were incubated with 3,3ʹ-diaminobenzidine (DAB) following the manufacturer’s instructions. Finally, the sample was counterstained with hematoxylin, dehydrated and fixed. Stained slides were evaluated and scored by three experienced gynecologic pathologists. Strong positive staining was defined as brown precipitate, medium positive staining as yellow-brown precipitate and weak positive staining as yellow precipitate. Then, a numerical value (0–3) was assigned for each staining intensity as follows, no staining = 0, weak staining = 1, medium staining = 2 and strong staining = 3. The samples were also scored according to the percentage of stained cells: no staining = 0; ≤10% stained tumor cells = 1; 11–50% stained tumor cells = 2; 51–80% stained tumor cells = 3; and ≥81% stained tumor cells = 4. The total staining score was the sum of the staining intensity grade and staining percentage grade, with a range of 0 to 7. Based on the clinical data, a ROC curve was used to evaluate whether the IHC score can distinguish platinum sensitivity and platinum resistance and whether it can predict the prognosis of patients.
Cell Culture
The Cell Bank of the Chinese Academy of Sciences (Shanghai, China) supplied the human epithelial ovarian cancer cell lines OVCAR8 and SKOV3. RPMI-1640 medium containing 10% fetal bovine serum was used to culture OVCAR8 cells. McCoy’s 5A medium containing 10% fetal bovine serum was used to culture SKOV3 cells. Both media were supplemented with 100 U/mL penicillin and 100 μg/mL streptomycin. Cells were incubated at 37°C in humid atmosphere containing 5% CO2.
Drug Resistance Assay
To assess resistance to cisplatin and calculate IC50 values, cell viability experiments were conducted using the MTT assay. Cells were seeded into 96-well plates and incubated with different concentrations of cisplatin for 48 h or 72 h. After the incubation time, 10 µL of 5 mg/mL MTT (Sigma–Aldrich, CA, USA) were added to each well. The plates were incubated for 4 hours. The supernatant was removed and DMSO was added to each well to dissolve crystalline formazan particles. The absorbance at 490 nm was measured in microplate reader (Tecan Group Ltd, Männedorf, Switzerland).
Western Blot
Cell lysates were obtained by incubating cells in RIPA Lysis Buffer (Beyotin, Beijing, China) containing protease inhibitors for 30 min followed by ultrasonication and centrifugation. The supernatant containing proteins was collected. The concentration of proteins in the supernatant was determined using the BCA protein assay (Beyotime, Beijing, China). Proteins were separated in 10 or 12% SDS-PAGE and transferred to polyvinylidene fluoride membranes (Merck Millipore, USA). After blocking in 5% skim milk, membranes were incubated with primary antibodies (ATP1A2, 1:1000, 16,836-1-AP, proteintech; CASQ2, 1:1000, ab3516, Abcam, UK; RYR2, 1:1000, MA3-916, Thermo Scientific, USA) overnight at 4°C and incubated with HRP-conjugated secondary antibodies at room temperature for 1 h. The bands were detected using HRP Substrate Reagent (Thermo Fisher Scientific Inc., MA, USA) and Image Quant LAS 4000 (GE Healthcare Life Science). Protein levels of GAPDH were used as the endogenous control.
Gene Set Enrichment Analysis
To explore the potential functions and pathways of these three genes, the coefficient and P value of the correlation between logFC of a target gene and that of the other genes were individually calculated. Based on a list of genes generated by the correlation analysis, GSEA was performed using the R package “clusterProfiler”.10 The function of a target gene was reversed by the gene most related to its expression.
Statistical Analysis
All experiments were repeated at least three times. R software (version 3.6.3) and GraphPad Prism 8 were used for the statistical analyses. R packages “DESeq2”, “survival”, “survminer”, “glmnet”, “ROCR” and “clusterProfiler” were used for relative analyses, whereas “ggplot2” and “ggpubr” were used to visualize the results. Chi-squared test and Fisher exact test were used to analyze baseline information from TCGA and CCLE samples. Mann–Whitney test was used to compare the IHC score between two groups. t-test was used to analyze Western blot results.
Results
Analysis of RNA-seq Data Identified 139 DEGs in TCGA and CCLE Databases
From TCGA cohort, 79 patients were included in our analysis and there was no statistical difference in age, stage, grade and chemotherapy drugs between platinum-sensitive and platinum-resistant groups (Table 1). From TCGA RNA-seq data, 2075 DEGs were identified, including 1307 upregulated genes and 768 downregulated genes in platinum-resistant patients (Figure 2A). Using the IC50 of cisplatin against different ovarian cancer cells in the GDSC database, we selected four platinum-resistant ovarian cancer cell lines (SKOV3, FUOV1, OVKATE, EFO21) and five platinum-sensitive ovarian cancer cell lines (OVTOKO, OVCAR8, OC314, TOV21G, TOV112D). The difference in IC50 values between resistant cell lines and sensitive cell lines was statistically significant (Table 2). From the CCLE RNA-seq data of these cell lines, 2280 DEGs were identified in platinum-resistant cell lines, including 1276 upregulated genes and 1004 downregulated genes (Figure 2B). Finally, we intersected DEGs of TCGA and the CCLE and found 97 upregulated genes and 42 downregulated genes in platinum-resistant samples (Figure 2C).
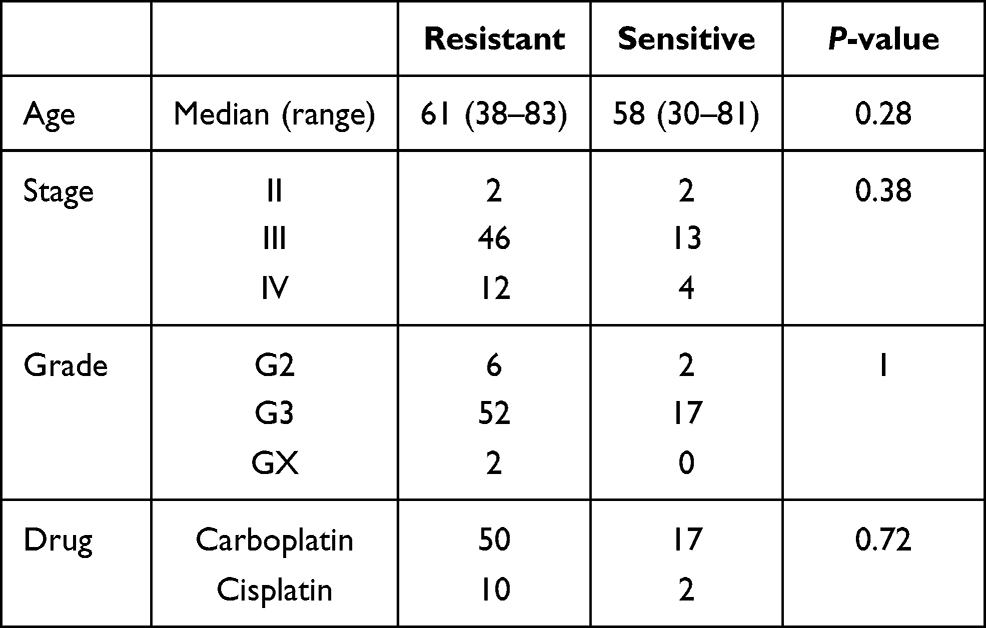 |
Table 1 Clinical Information of TCGA Samples |
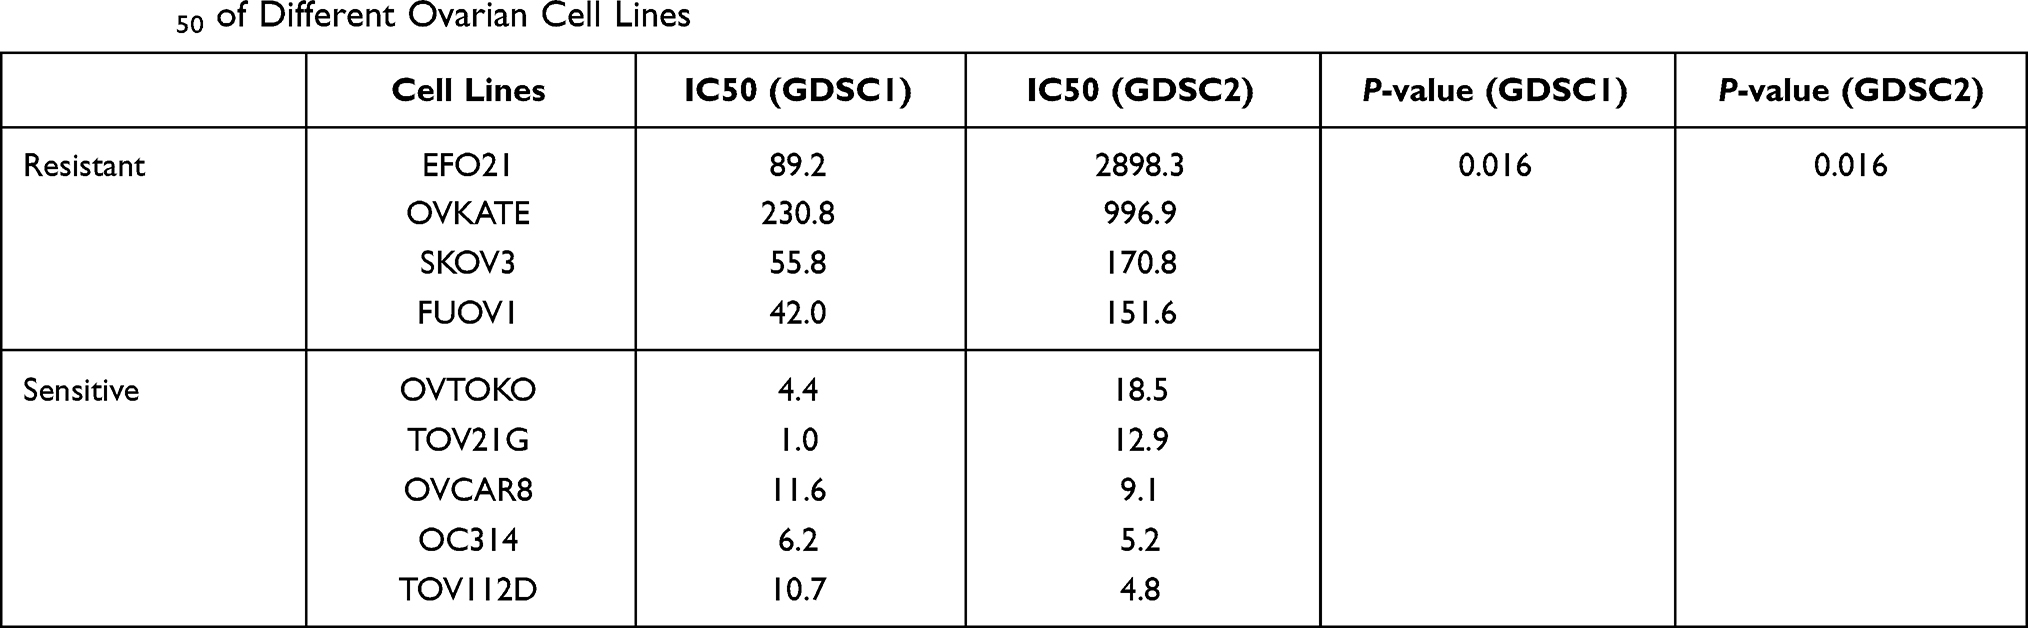 |
Table 2 IC50 of Different Ovarian Cell Lines |
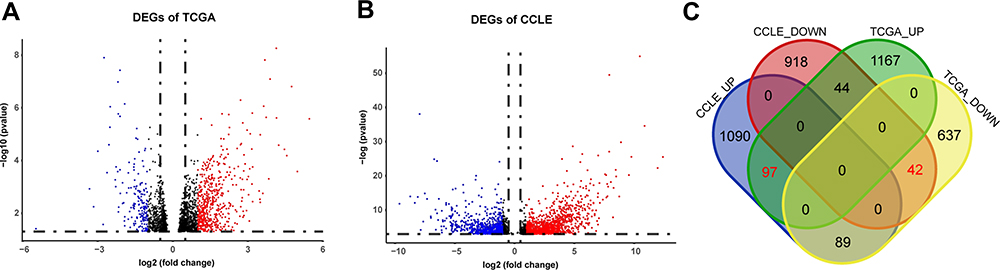 |
Figure 2 Identification of DEGs from TCGA and the CCLE databases. (A) Volcano plot of 2075 DEGs identified in data from TCGA. Red dots represent significantly upregulated genes (logFC > 1). Blue dots represent significantly downregulated genes (logFC < −1). (B) Volcano plot of 2280 DEGs identified in data from the CCLE. Red dots represent significantly upregulated genes (logFC > 1). Blue dots represent significantly downregulated genes (logFC < −1). (C) Venn diagram of DEGs identified in TCGA and the CCLE databases. |
GO and KEGG Enrichment Analyses Indicated the Involvement of Genes Related to Calcium Homeostasis and Stem Cell Pluripotency Regulation
To understand the biological roles of these 139 DEGs, we used Enrichr to conduct GO annotation and KEGG pathway enrichment analyses. Figure 3 shows the top 10 terms for GO and KEGG analyses. The following biological processes were markedly enriched: “regulation of release of sequestered calcium ion into cytosol by sarcoplasmic reticulum” (GO:0010880), “regulation of sequestering of calcium ion” (GO:0051282), “regulation of cardiac muscle contraction” (GO:0055117), “cellular response to organic substance” (GO:0071310) and “regulation of calcium ion transmembrane transport” (GO:1903169) (Figure 3A). In terms of specific cellular location, GO cellular component indicated that these DEGs are mainly associated with “junctional sarcoplasmic reticulum membrane” (GO:0014701), “sarcoplasmic reticulum” (GO:0016529), “integral component of plasma membrane” (GO:0005887), “sarcoplasm” (GO:0016528) and “calcium channel complex” (GO:0034704) (Figure 3B). The significant enriched GO molecular function terms included “carbohydrate kinase activity” (GO:0019200), “ribonuclease activity” (GO:0004540), “potassium channel activity” (GO:0005267) and “potassium ion leak channel activity” (GO:0022841) (Figure 3C). Moreover, the top four markedly enriched pathways were ‘signal pathways regulating pluripotency of stem cells’, “fructose and mannose metabolism”, “pancreatic secretion” and “ABC transporters” (Figure 3D).
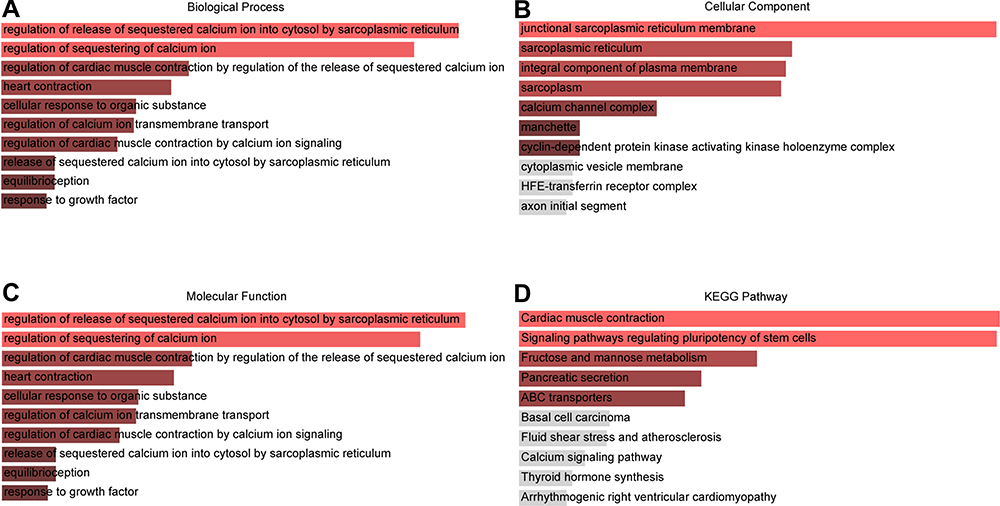 |
Figure 3 The top 10 enriched GO annotation and KEGG pathway analysis of DEGs. (A) GO biological process, (B) GO cellular component, (C) GO molecular function terms (D) KEGG pathways. |
Survival Analysis Showed That ATP1A2 and CASQ2 Were Potentially Prognostic Related Genes
The survival analysis included data from 77 TCGA patients with overall survival > 30 days whose survival and chemotherapy information was available. Kaplan-Meier survival analysis showed that 35 DEGs were significantly related to prognosis (P < 0.05) (Table 3). Univariate cox proportional hazards regression indicated 7 genes, LRRC17, WDR44, ABCA8, CDH23, CASQ2, ATP1A2 and NOS2, with significant contributions (P < 0.05) (Table 4). Among them, WDR44 was associated with reduction in the hazard (HR < 1), whereas the other six genes were associated with increase in the hazard (HR > 1). In contrast, only LRRC17 was found to have a significant contribution (P < 0.05) in multivariate cox regression (Table 4). Kaplan-Meier plots of genes with significant contributions in both Kaplan-Meier survival analysis and univariate cox regression analysis are shown in Figure 4.
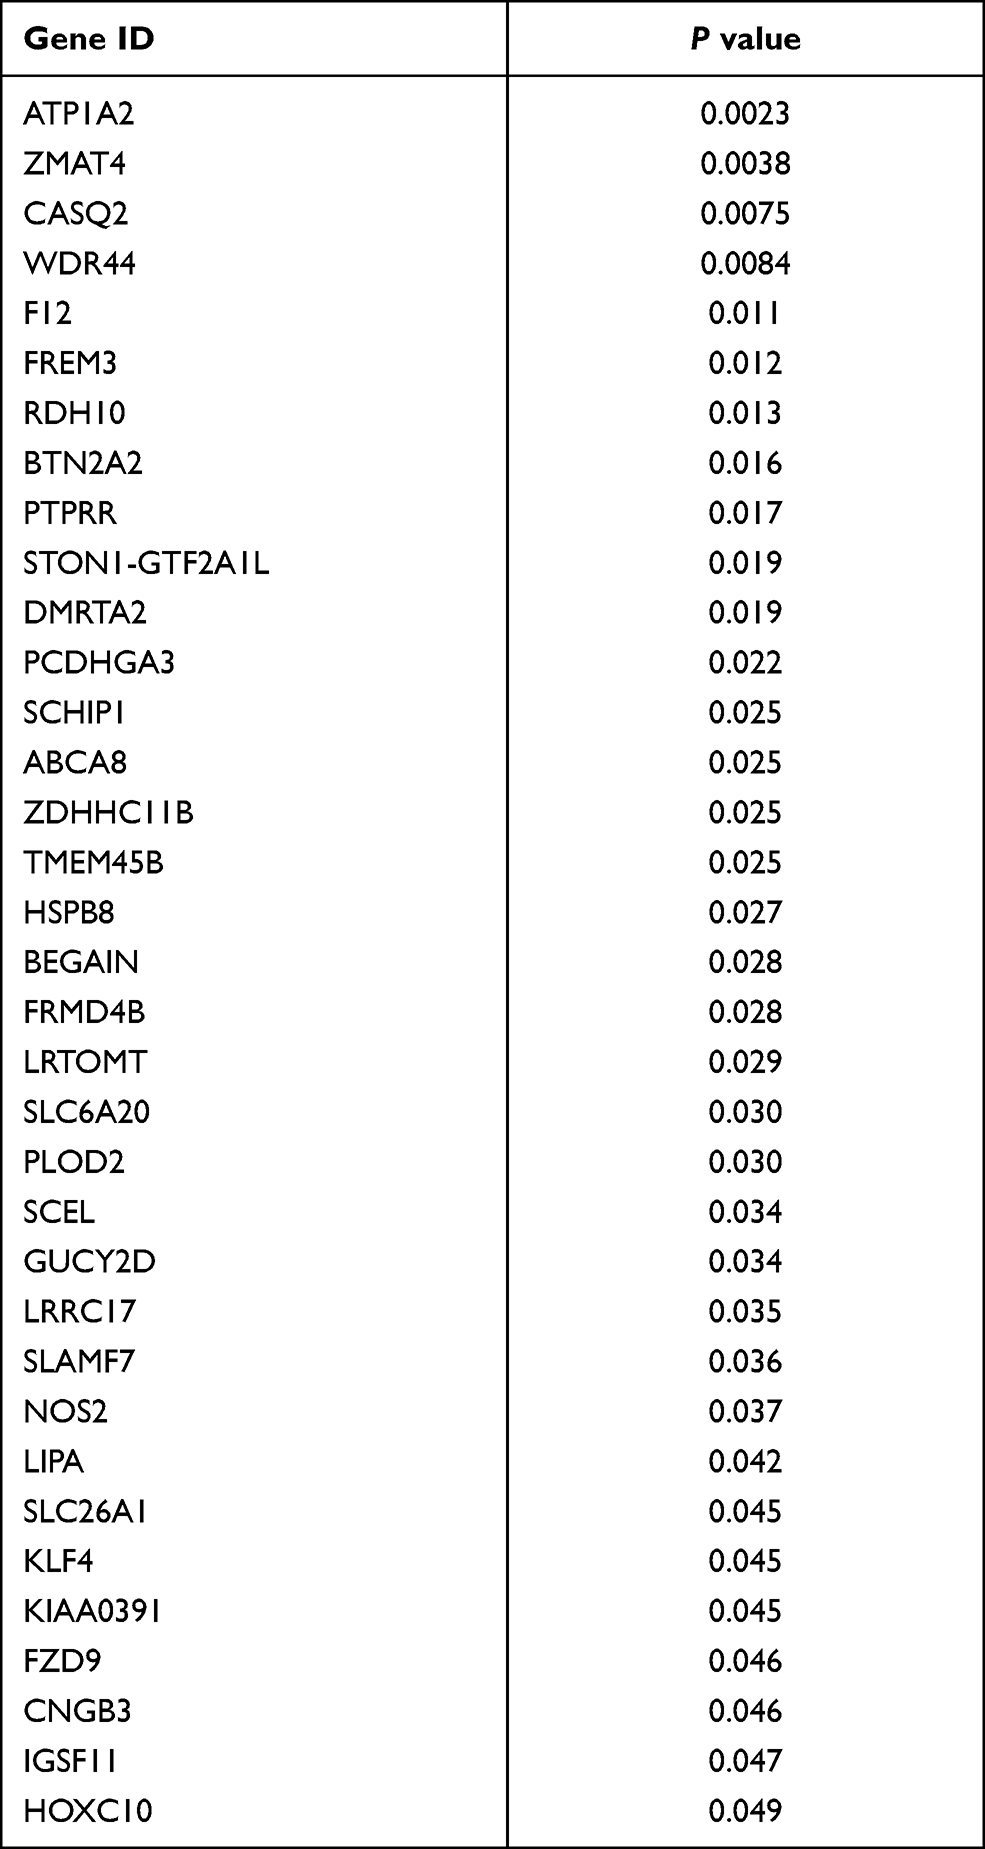 |
Table 3 Kaplan Meier Survival Analysis of DEGs in TCGA Ovarian Patients |
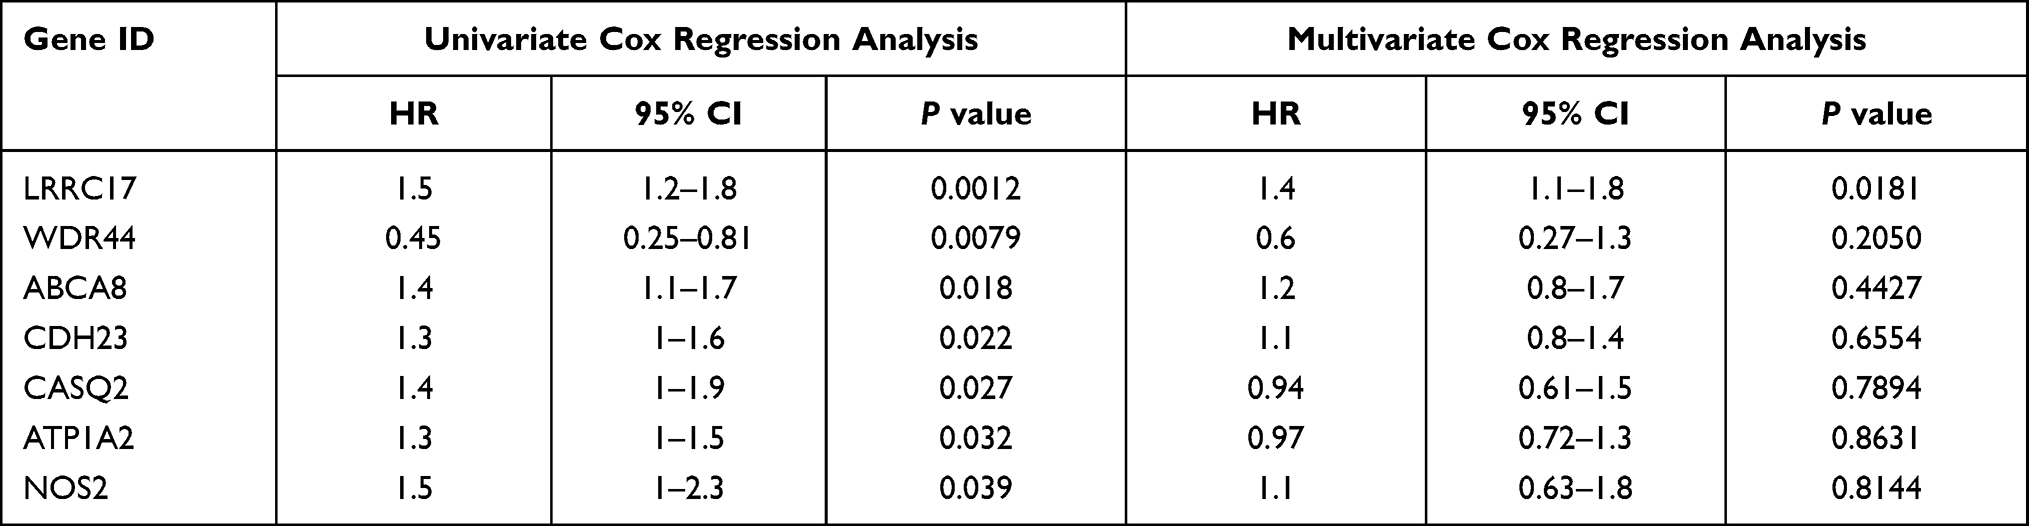 |
Table 4 Univariate and Multivariate Cox Proportional Hazards Regression of DEGs in TCGA Ovarian Patients |
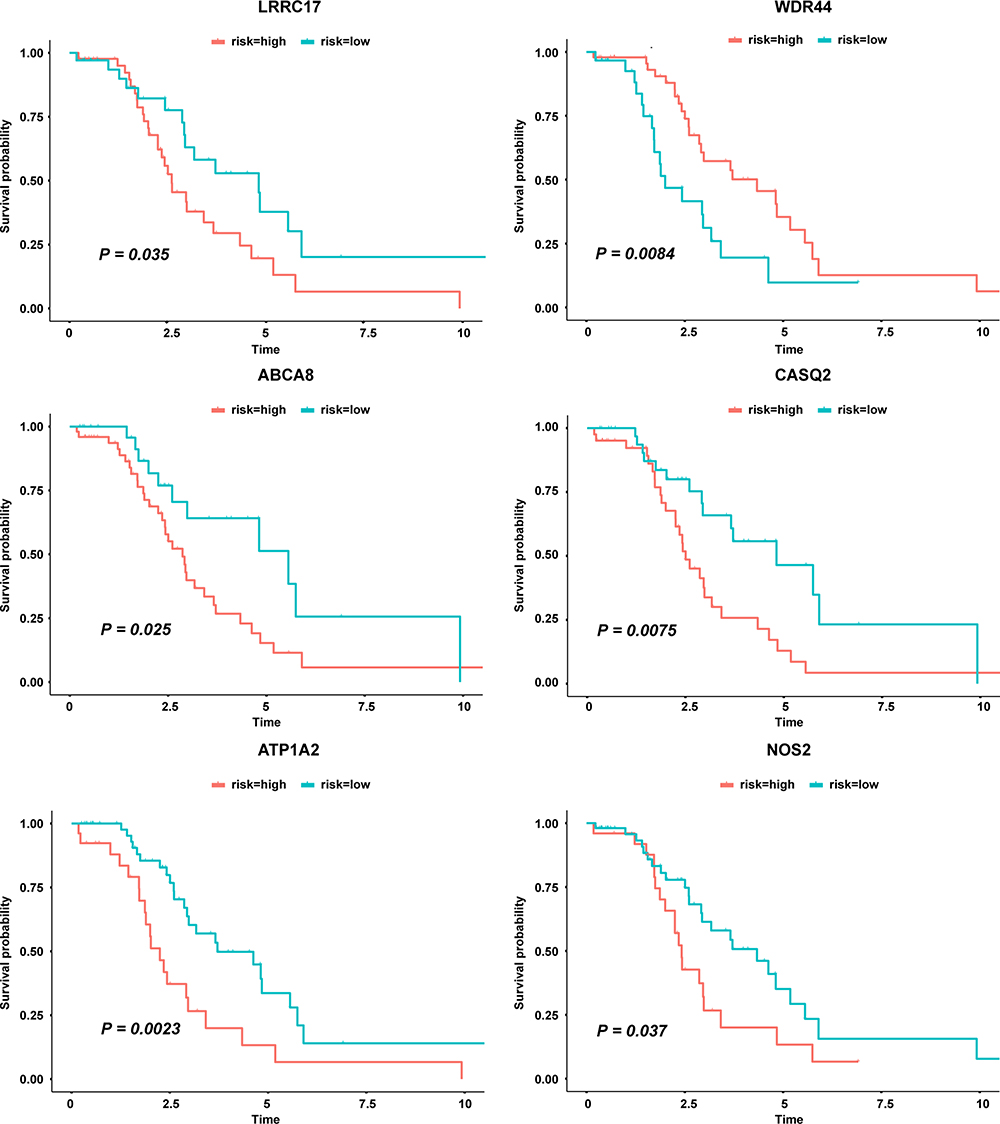 |
Figure 4 Genes significantly related to patient survival in both Kaplan Meier survival analysis and univariate cox regression analysis. |
Construction of Protein Interaction Network and Determination of Hub Genes Containing ATP1A2, CASQ2 and RYR2
Protein-protein interaction information was obtained from the STRING website. The generated network was composed of 61 nodes (genes) and 52 edges (interactions), where red nodes represent upregulated DEGs, blue nodes represent downregulated DEGs in platinum-resistant samples and the size of each node is proportional to the number of proteins interacting with it (Figure 5A). Based on the PPI network, the MCC algorithm indicated the top ten hub genes: Protocadherin-15 (PCDH15) and Cadherin-23 (CDH23) both with score = 10; Retinal guanylyl cyclase 1 (GUCY2D) with score = 9; Photoreceptor cilium actin regulator (C2orf71) with score = 8; Catenin beta-1 (CTNNB1) and Ryanodine receptor 2 (RYR2) both with score = 5; Sodium/potassium-transporting ATPase subunit alpha-2 (ATP1A2), Myelin proteolipid protein (PLP1) and Calsequestrin-2 (CASQ2) all with score = 4; and Krueppel-like factor 4 (KLF4) with score = 3 (Table 5). Network analysis of the top ten hub genes was also conducted (Figure 5B). According to survival analysis and hub genes, ATP1A2, CASQ2 and RYR2 were finally identified as potential prognostic genes.
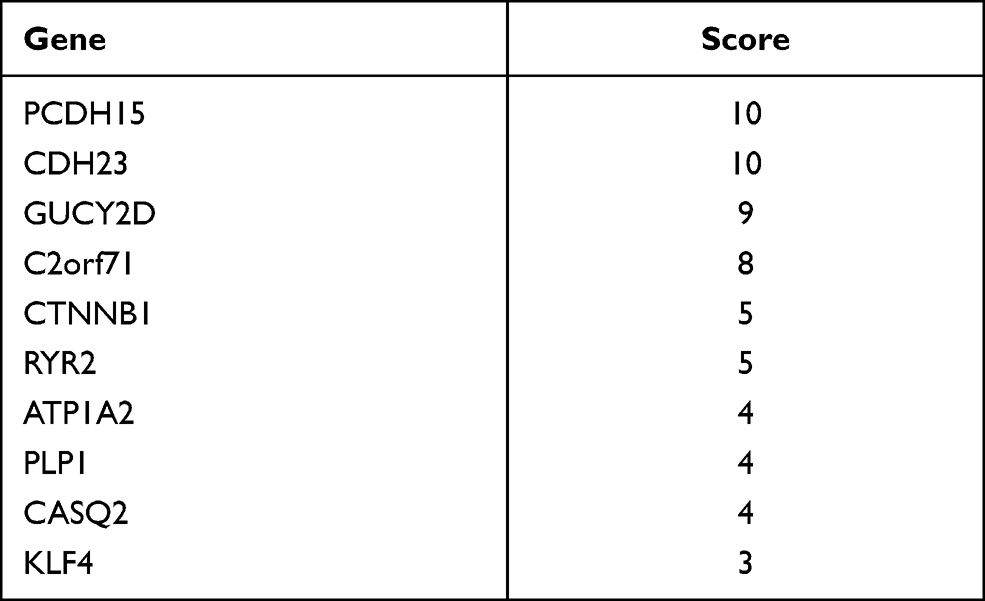 |
Table 5 MCC Score of Top 10 Hub Genes |
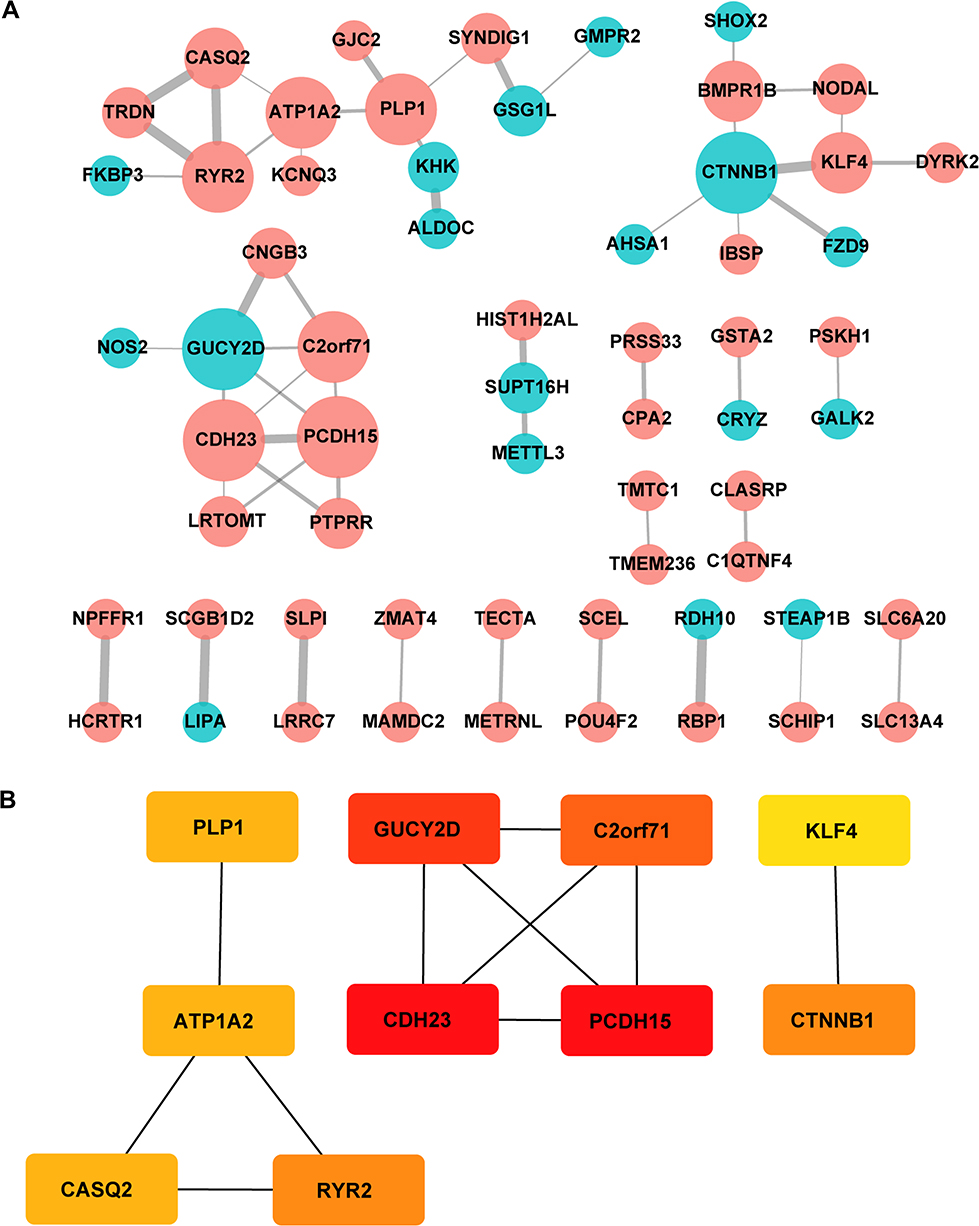 |
Figure 5 Protein interaction networks and hub genes. (A) PPI network constructed with all the 139 DEGs. Red nodes represent upregulated DEGs and blue nodes represent downregulated DEGs. The size of each node is proportional to the number of proteins interacting with it. (B) The top 10 hub genes determined by cytoHubba MCC algorithm, including CDH23, PCDH15, GUCY2D, C2orf71, CTNNB1, RYR2, ATP1A2, CASQ2, PLP1 and KLF4. Genes are displayed in colors from red (high score) to yellow (low score). |
Lasso Regression Prognostic Prediction Model Containing ATP1A2 and CASQ2 Had a Significant Predictive Value
The P values of ATP1A2, CASQ2, and RYR2 were all greater than 0.05 in the multivariate Cox regression analysis, revealing that they were not directly correlated with prognosis. We further investigated prognostic genes by searching for genes that are potentially related to these three genes and created a predictive model using Lasso regression analysis. First, Pearson correlation analysis was used to screen genes with significant contributions (P < 0.05), then, univariate Cox regression analysis was used to gauge the association between significantly correlated genes and prognosis, and, finally, Lasso regression analysis was used to reduce dimensionality. Through the steps described above, it was discovered that CASQ2 is a potential prognostic-related gene of ATP1A2 and a predictive model based on ATP1A2 and 8 related genes was constructed (Figure 6). The 8 related genes were LDLRAD2, TMEM57, PODN, ACADM, GBP2, GPR88, UBL4B and CASQ2. The P value of the Wilcoxon test was 0.00015 and the AUC of ROC curve was 0.747, indicating that the model had a significant predictive value.
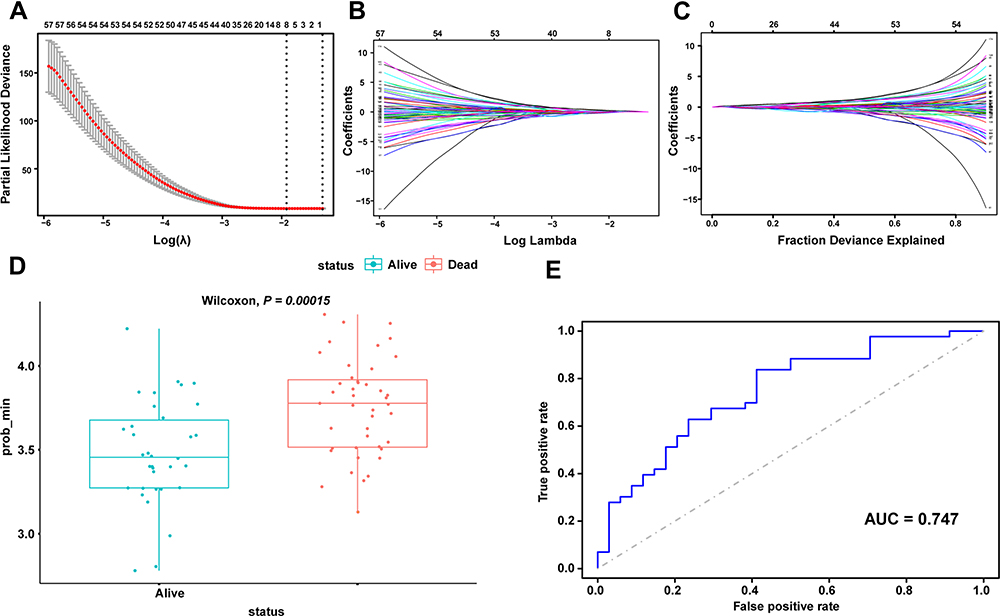 |
Figure 6 Prognostic prediction module construction by Lasso (A) calculating the minimum criteria. (B and C) Lambda min shrinkage and selection operator (Lasso) regression was performed. (D) Wilcoxon test for prognostic models. (E) ROC curves for prognostic models. |
ATP1A2, CASQ2 and RYR2 Were Upregulated in Tissue Samples from Platinum-Resistant Patients and Related to Poor Prognosis
Serous ovarian cancer tissues samples (62 samples) collected in 2014–2018 in Qilu Hospital were analyzed using immunohistochemistry. The clinical characteristics of patients are presented in Table 6. The expression of ATP1A2, CASQ2 and RYR2 was significantly higher in platinum-resistant patients than that in platinum-sensitive patients (Figure 7A). Also, resistant patients had a significantly higher histologic score than that of sensitive patients (Figure 7B). In accordance with the TCGA data, the difference in the expression of ATP1A2 and CASQ2 between resistant and sensitive samples was significant, while the difference in RYR2 expression between the two groups was not (P > 0.05) (Figure 7C). The AUC of ROC curve for chemotherapy resistant patients was 0.703, 0.828 and 0.760, indicating that ATP1A2, CASQ2 and RYR2, respectively, might distinguish platinum-resistant and sensitive patients (Figure 7D). According to the overall survival data of patients treated in Qilu Hospital and their IHC score, a ROC curve was calculated and the AUC of each gene was greater than 0.6, indicating that these three genes were related to the patients’ prognosis (Figure 7E).
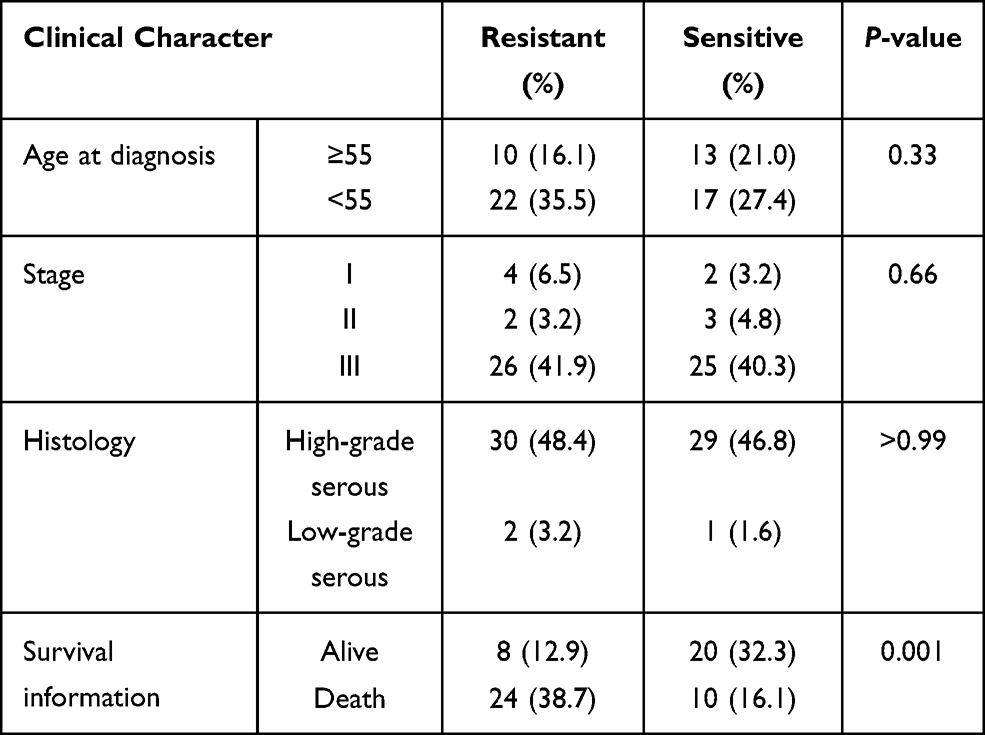 |
Table 6 Patients’ Information from Qilu Hospital |
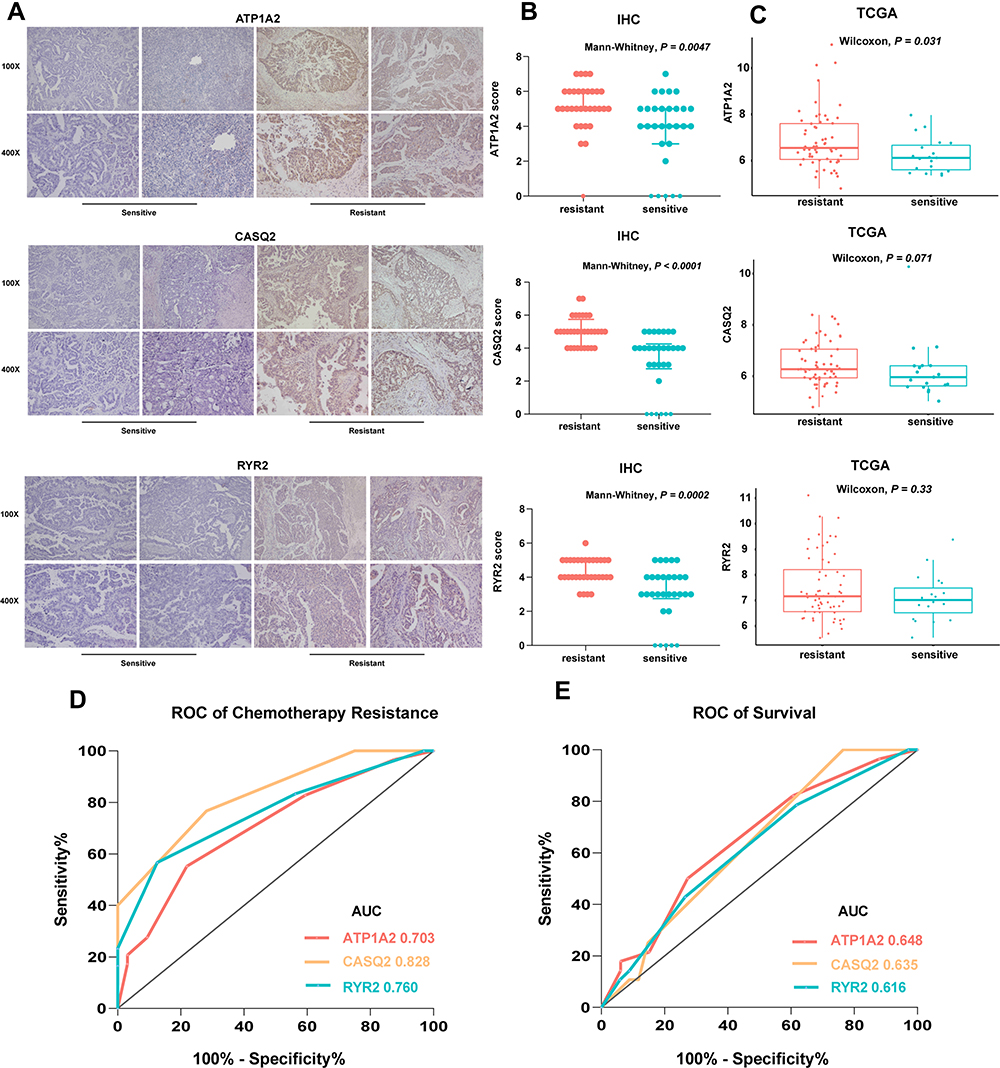 |
Figure 7 (A) Representative images of immunohistochemistry analysis of ATP1A2, CASQ2 and RYR2 in serous ovarian cancer samples. (B) The expression of ATP1A2, CASQ2 and RYR2 genes in TCGA samples. P values from Wilcoxon test. (C) IHC score of ATP1A2, CASQ2 and RYR2 in serous ovarian cancer samples. Medians and interquartile range are shown. P values from Mann–Whitney test. (D and E) ROC curve of chemotherapy status and survival based on the clinical data from Qilu Hospital. |
ATP1A2 and CASQ2 Expression Were Higher in Platinum-Resistant Cell Lines Than Those in Platinum-Sensitive Cell Lines
We selected two cell lines, SKOV3 and OVCAR8, as representatives of platinum-resistant and platinum-sensitive cells, respectively. The MTT assay was used to calculate the IC50 of cisplatin on cell viability and confirm their resistance/sensitivity status. After 48 h and 72 h of cisplatin treatment, the IC50 values for SKOV3 were 42.29 μM and 19.06 μM and those for OVCAR8 were 10.14 μM and 7.552 μM, respectively (Figure 8A). The expression of both ATP1A2 and CASQ2 in SKOV3 was significantly higher than that in OVCAR8 (P < 0.05). Although the expression of RYR2 appeared to be higher in SKOV3 than that in OVCAR8, it did not reach statistical significance (P > 0.05) (Figure 8B). Overall, the experimental results using SKOV3 and OVCAR8 were similar to data obtained from the CCLE (Figure 8C).
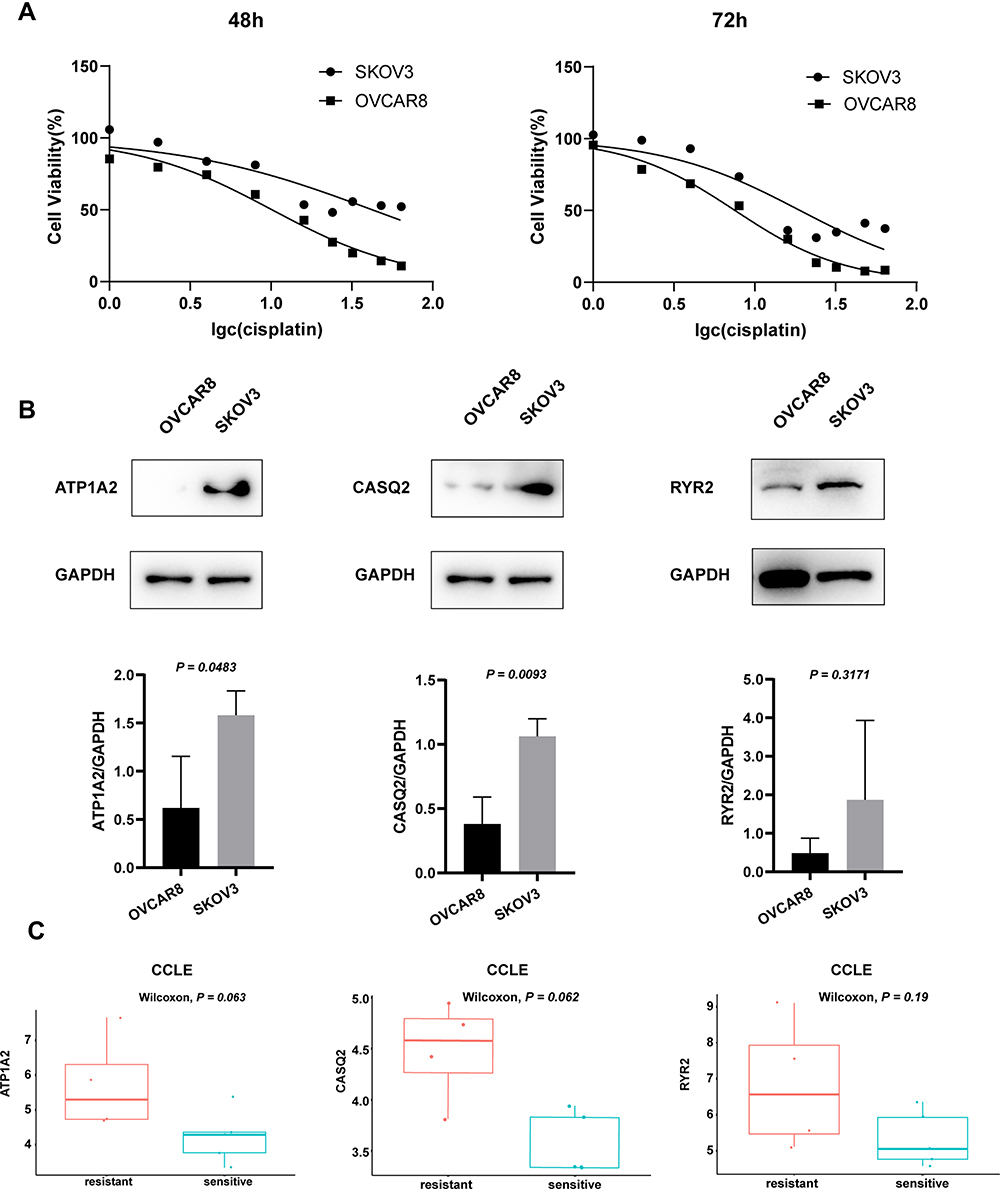 |
Figure 8 (A) Cell viability of OVCAR8 and SKOV3 cells treated with cisplatin for 48 h and 72 h. After 48 h and 72 h treatment, the IC50 values for SKOV3 were 42.29 μM and 19.06 μM and those for OVCAR8 were 10.14 μM and 7.552 μM, respectively. (B) Representative Western blot images, quantitation, and statistical analysis of ATP1A2, CASQ2 and RYR2 levels in OVCAR8 and SKOV3 cell lines. Image J software was used for quantitation, P values from t-test. (C) The expression of ATP1A2, CASQ2 and RYR2 genes in the CCLE samples. P values from Wilcoxon test. |
ATP1A2, CASQ2 and RYR2 Had Four Common Signaling Pathways Identified by Single-Gene-Related GSEA
Gene set enrichment analysis was conducted using the relative expression of genes closely related to the expression of target genes (ATP1A2, CASQ2 and RYR2) identified in TCGA and the CCLE databases. The intersection of the results revealed that common enrichment pathways among the three genes were KRAS signaling, mTORC1 signaling, oxidative phosphorylation and fatty acid metabolism (Figure 9). Among them, KRAS signaling was upregulated, while the other three were downregulated.
 |
Figure 9 GSEA of the genes most related to the expression of target gene in TCGA and CCLE database. |
Discussion
The identification of genes related to drug resistance as novel prognostic markers has been a great challenge in serous ovarian cancer research. In this study, through the combination of bioinformatics and experimental verification, potential molecules and underlying mechanisms affecting the prognosis of patients with platinum-resistant epithelial ovarian cancer were explored. The results of differential analysis and enrichment analysis identified genes involved in cellular calcium homeostasis and stem cell pluripotency regulation. Survival analysis revealed that two genes, ATP1A2 and CASQ2, were related to the prognosis of platinum-resistant ovarian cancer patients. PPI network analysis indicated that ATP1A2, CASQ2 and RYR2 may interact with each other. In addition, tissue immunohistochemistry and cell culture experiments were used to further verify the relationship between these three target genes and platinum resistance and prognosis. Finally, the possible underlying mechanism was explored through single-gene-related GSEA, which indicated that these genes are associated with KRAS and mTOR pathways, affecting cell oxidative phosphorylation and fatty acid metabolism.
The ATP1A2 gene encodes the α-2 subunit of Na+/K+-ATPase, a transmembrane protein that maintains an electrochemical gradient across membranes. This protein is composed of two subunits, an α subunit (with four subtypes) and a β subunit (with three subtypes). The distribution of Na+/K+-ATPases with particular combinations of subunit subtypes is tissue-specific.11,12 Cardiac glycosides are specific inhibitors of Na+/K+-ATPase whose anti-tumor effects were first described by Shiratori in 1967.13 Since then, their anti-tumor effects have been reported for breast cancer, colon cancer, pancreatic cancer, lung cancer, prostate cancer, glioblastoma and melanoma, motivating the conduction of many clinical trials.14,15 Several studies have indicated that Na+/K+-ATPase plays a role in ovarian cancer pathophysiology. For example, Huang et al reported that the overexpression of ATP1A2 may be related to the poor prognosis of advanced ovarian cancer.16 Moreover, (+)-Strebloside, a cardiac glycoside that inhibits the activity of Na+/K+-ATPase, inhibits p53 expression and NF-κB activity, inducing ovarian cancer cell apoptosis and impairing its proliferation.17 Another evidence for the participation of Na+/K+-ATPase in ovarian cancer pathophysiology comes from Tummala et al, which revealed for the first time that decreased expression of ATP1B1 is associated with resistance to oxaliplatin in ovarian cancer.18 However, its role in platinum resistance is still unclear. Here, our analysis and experimental verification indicated that ATP1A2, as one of the subunit subtypes of Na+/K+-ATPases, is highly expressed in platinum-resistant ovarian cancer and associated with a poor prognosis.
The RYR2 gene encodes the ryanodine receptor 2, which forms calcium channels that mediate the release of Ca2+ from the sarcoplasmic reticulum into the cytoplasm. The activity of these channels is regulated by calsequestrin 2, a protein encoded by the CASQ2 gene that participates in the storage and transport of Ca2+.19 Therefore, RYR2 and CASQ2 are both involved in the regulation of intracellular calcium homeostasis. Because of the variety of cellular processes affected by calcium, pointing out the specific role of calcium in cancer cells is complex. Schmidt et al found that the expression of Orai1 and STIM1, proteins that regulate intracellular Ca2+ mobilization, increase in drug-resistant ovarian cancer cells.20 This feature is, at least partly, due to the enhancement of Akt activity and plays a role in drug resistance in ovarian cancer cells.20 Pelzl et al showed that the expression of Na+/Ca2+-exchanger isomers, which accelerate calcium efflux, is higher in drug-resistant ovarian cancer cells than in drug-sensitive ovarian cancer cells.21 In summary, it seems that both promoting calcium influx and accelerating calcium efflux can increase the drug resistance of ovarian cancer cells. Instead of the isolated effects of proteins responsible for calcium influx or efflux, it is the dynamic changes in calcium levels that play regulates a variety of cell processes, including the entrance into S phase and M phase of the cell cycle22,23 and tumor cell survival.24,25 Calcium homeostasis also affects the biology of cancer stem cells (CSCs), key players in tumor drug resistance. Heejin Lee found that calcium channel blockers reduce the stemness and induce apoptosis in ovarian CSCs by inhibiting the AKT/ERK signaling pathway, indicating that calcium channel blockers may be used as potential drugs to prevent ovarian cancer recurrence.26 In the present study, the main GO and KEGG enrichment categories of DEGs in drug-resistant ovarian cancer cells were “calcium ion regulation” and “stem cell pluripotency”. Moreover, two of the three prognostic genes identified in this study, RYR2 and CASQ2, are related to the regulation of calcium homeostasis. Indeed, the expression of RYR2 correlates with tumor grade in breast cancer and participates in breast cancer cell epithelial-mesenchymal transition.27,28 RYR1, in concert with GSTO1, enhances the resistance to chemotherapy and promotes tumor initiation and recurrence of breast cancer.29 On the other hand, little is known about the role of CASQ2 in tumor pathophysiology. Through bioinformatic analysis and experimental verification, we found that CASQ2 is highly expressed in drug-resistant samples and may affect the prognosis of platinum-resistant ovarian cancer patients. Immunohistochemistry staining showed that RYR2 was highly expressed in drug-resistant samples and was related to prognosis. These findings did not agree with the results of bioinformatic analysis. Such discrepancy may be due to the small sample size of clinical specimens analyzed herein. Therefore, further research with an expanded sample size might solve this issue. Given the interaction between CASQ2 and RYR2 in protein interaction network analysis, our results ultimately indicate that RYR2 and CASQ2 may play important roles in platinum resistance of ovarian cancer, probably by affecting calcium homeostasis.
Further analysis using single-gene-related GSEA revealed that the most significant pathways were oxidative phosphorylation, fatty acid metabolism, and mTORC1 signaling, which were downregulated, and KRAS signaling, which was upregulated. There is evidence that metabolic reprogramming may be related to platinum resistance in ovarian cancer. Pioneering studies on cancer biology have shown that tumors increase glucose uptake and metabolize glucose to lactic acid even under normoxia. This phenomenon is called the “Warburg effect”.30,31 Recent research has found that tumor cells can also enhance oxidative phosphorylation or increase overall metabolic activity and this phenotype may be related to tumor recurrence or chemotherapy resistance.32 Dar et al found that, compared with platinum-sensitive cells, platinum-resistant cells have increased metabolic activity.33 In ovarian cancer patient-derived xenografts (PDXs) models, the rate of oxygen consumption and mitochondrial respiration of the drug-resistant PDX were higher than those of the sensitive model, indicating that its oxidative phosphorylation capacity increased.34 However, Maccio et al concluded that cisplatin can induce death in tumor cells by shifting their metabolism from glycolysis to oxidative phosphorylation.7 Therefore, it can be speculated that platinum-sensitive cells may have high rates of oxidative phosphorylation compared with resistant cells. Gentric et al reported that ovarian cancer cells with high rates of oxidative phosphorylation, which also needs fatty acid metabolism to support mitochondrial respiration, seem to be more sensitive to chemotherapy; the underlying mechanism may be related to chronic oxidative stress and ferroptosis caused by high metabolic activity.35 Consistent with Geraldine Gentric’s study, our results revealed that oxidative phosphorylation and fatty acid metabolism were reduced in platinum-resistant samples. The apparent controversy of metabolic heterogeneity in ovarian cancer may be explained by the presence and characteristics of CSCs. CSCs are cells with specific molecular markers that have tumorigenic ability, maintain tumor growth and resist radiotherapy and chemotherapy.36 They are common in hematological malignancies and solid tumors, such as breast cancer, brain tumors, prostate cancer and colon cancer.37–41 Ovarian CSCs have more glycolytic activity than differentiated tumor cells, allowing them to resist and survive under stress conditions, especially hypoxic conditions.42 Such ability may be related to drug resistance.42 Pastò et al observed that CD44+CD117+ ovarian CSCs have increased expression of OXPHOS-related enzymes and increased mitochondrial ROS production, indicating that the mitochondrial electron transport system is preferentially used.43 This revealed that ovarian CSCs possess metabolic plasticity and can shift between glycolysis and oxidative phosphorylation.
The mTORC1 pathway plays a central role in the regulation of growth and metabolism in eukaryotic cells, affecting anabolism, autophagy and catabolism.44 In addition, mTORC1 can also regulate mitochondrial metabolism, standing as an important regulator of mitochondrial function.45 John T’s study found that mTOR can regulate mitochondrial respiration through the YY1-PGC-1a transcription complex.46 Here, GSEA results showed that the target genes were related to the downregulation of the mTORC1 pathway, indicating that mitochondrial oxidative function in platinum-resistant cells was affected and the rate of oxidative phosphorylation was likely reduced.
KRAS is an important oncogene whose mutations are most common in borderline serous tumors, low-grade serous ovarian cancer and mucinous carcinoma. In recurrent low-grade serous ovarian cancer, the frequency of KRAS mutations is as high as 70%.47 Moreover, Martinez-Outschoorn et al observed that RAS mutations can reprogram the metabolism of cancer cells,48 which explains the potential role of KRAS signaling in ovarian cancer drug resistance. Our data indicate that the upregulation of the KRAS pathway may affect oxidative phosphorylation and fatty acid metabolism in platinum-resistant cells, leading to metabolic reprogramming of tumor cells.
This study used bioinformatics to analyze a large amount of data combined with tissue immunohistochemistry and cell culture experiments, but there are still shortcomings. First, RNA-seq expression data were limited to those available in public databases for tissues and cells. Second, the number of clinical samples in which we validated the bioinformatics analysis was small. Therefore, further studies should expand the sample size and explore the mechanisms underlying platinum resistance using cell and animal experiments.
Conclusion
In conclusion, we found that ATP1A2, CASQ2 and RYR2 are highly expressed in platinum-resistant ovarian cancer and ATP1A2 and CASQ2 are related to poor prognosis. These three target genes may mediate platinum resistance through KRAS and mTORC1 pathways. Calcium homeostasis regulation and metabolic reprogramming are potential mechanisms affecting platinum resistance.
Institutional Review Board Statement
The study was conducted according to the guidelines of the Declaration of Helsinki and approved by the Ethics Committee of Qilu Hospital of Shandong University. All patients provided informed consent before data collection.
Data Sharing Statement
RNA-seq data and clinical information of TCGA cohort was downloaded from TCGA website (https://portal.gdc.cancer.gov/). IC50 information of cell lines was accessed in the GDSC database (https://www.cancerrxgene.org/) and their RNA-seq data was downloaded from the CCLE database (https://portals.broadinstitute.org/ccle).
Acknowledgments
The authors thank the patients that provided tissue samples used in this research for their contribution to our work.
Funding
This work was supported by the National Nature Science Foundation of China (81702559 and 81902657), China Postdoctoral Science Fund (21510077311145 and 21300076311047) and Science Foundation of Qilu Hospital of Shandong Province.
Disclosure
The authors declare no conflict of interest.
References
1. Siegel RL, Miller KD, Jemal A. Cancer statistics, 2020. CA Cancer J Clin. 2020;70(1):7–30. doi:10.3322/caac.21590
2. Lheureux S, Gourley C, Vergote I, Oza AM. Epithelial ovarian cancer. Lancet. 2019;393(10177):1240–1253. doi:10.1016/S0140-6736(18)32552-2
3. Wilson MK, Pujade-Lauraine E, Aoki D, et al. Fifth ovarian cancer consensus conference of the Gynecologic Cancer InterGroup: recurrent disease. Ann Oncol. 2017;28(4):727–732. doi:10.1093/annonc/mdw663
4. Pujade-Lauraine E, Banerjee S, Pignata S. Management of platinum-resistant, relapsed epithelial ovarian cancer and new drug perspectives. J Clin Oncol. 2019;37(27):2437–2448. doi:10.1200/JCO.19.00194
5. Galluzzi L, Senovilla L, Vitale I, et al. Molecular mechanisms of cisplatin resistance. Oncogene. 2012;31(15):1869–1883. doi:10.1038/onc.2011.384
6. Freimund AE, Beach JA, Christie EL, Bowtell DDL. Mechanisms of drug resistance in high-grade serous ovarian cancer. Hematol Oncol Clin North Am. 2018;32(6):983–996. doi:10.1016/j.hoc.2018.07.007
7. Maccio A, Madeddu C. Cisplatin: an old drug with a newfound efficacy – from mechanisms of action to cytotoxicity. Expert Opin Pharmacother. 2013;14(13):1839–1857. doi:10.1517/14656566.2013.813934
8. Chen SH, Chang JY. New insights into mechanisms of cisplatin resistance: from tumor cell to microenvironment. Int J Mol Sci. 2019;20:17.
9. Matulonis UA, Sood AK, Fallowfield L, Howitt BE, Sehouli J, Karlan BY. Ovarian cancer. Nat Rev Dis Primers. 2016;2:16061.
10. Yu G, Wang L-G, Han Y, He Q-Y. ClusterProfiler: an R package for comparing biological themes among gene clusters. OMICS. 2012;16(5):284–287. doi:10.1089/omi.2011.0118
11. Blanco G. Na, K-ATPase subunit heterogeneity as a mechanism for tissue-specific ion regulation. Semin Nephrol. 2005;25(5):292–303. doi:10.1016/j.semnephrol.2005.03.004
12. Kaplan JH. Biochemistry of Na, K-ATPase. Annu Rev Biochem. 2002;71:511–535. doi:10.1146/annurev.biochem.71.102201.141218
13. Shiratori O. Growth inhibitory effect of cardiac glycosides and aglycones on neoplastic cells: in vitro and in vivo studies. Gann. 1967;58:521–528.
14. Bejcek J, Spiwok V, Kmonickova E, Rimpelova S. Na+/K+-ATPase revisited: on its mechanism of action, role in cancer, and activity modulation. Molecules. 2021;26(7):1905. doi:10.3390/molecules26071905
15. Prassas I, Diamandis EP. Novel therapeutic applications of cardiac glycosides. Nat Rev Drug Discov. 2008;7(11):926–935. doi:10.1038/nrd2682
16. Huang W, Zhang Y, Xu Y, et al. Comprehensive analysis of the expression of sodium/potassium-ATPase α subunits and prognosis of ovarian serous cystadenocarcinoma. Cancer Cell Int. 2020;20(309). doi:10.1186/s12935-020-01414-5
17. Chen WL, Ren Y, Ren J, et al. (+)-strebloside-induced cytotoxicity in ovarian cancer cells is mediated through cardiac glycoside signaling networks. J Nat Prod. 2017;80(3):659–669. doi:10.1021/acs.jnatprod.6b01150
18. Tummala R, Wolle D, Barwe SP, Sampson VB, Rajasekaran AK, Pendyala L. Expression of Na, K-ATPase-beta(1) subunit increases uptake and sensitizes carcinoma cells to oxaliplatin. Cancer Chemother Pharmacol. 2009;64(6):1187–1194. doi:10.1007/s00280-009-0985-x
19. Venetucci L, Denegri M, Napolitano C, Priori SG. Inherited calcium channelopathies in the pathophysiology of arrhythmias. Nat Rev Cardiol. 2012;9(10):561–575. doi:10.1038/nrcardio.2012.93
20. Schmidt S, Liu G, Liu G, et al. Enhanced Orai1 and STIM1 expression as well as store operated Ca2+ entry in therapy resistant ovary carcinoma cells. Oncotarget. 2014;5(13):4799–4810. doi:10.18632/oncotarget.2035
21. Pelzl L, Hosseinzadeh Z, Alzoubi K, et al. Impact of Na+/Ca2+ exchangers on therapy resistance of ovary carcinoma cells. Cell Physiol Biochem. 2015;37(5):1857–1868. doi:10.1159/000438547
22. Taylor JT, Zeng XB, Pottle JE, et al. Calcium signaling and T-type calcium channels in cancer cell cycling. World J Gastroenterol. 2008;14(32):4984–4991. doi:10.3748/wjg.14.4984
23. Steinhardt RA, Alderton J. Intracellular free calcium rise triggers nuclear envelope breakdown in the sea urchin embryo. Nature. 1988;332(6162):364–366. doi:10.1038/332364a0
24. Parkash J, Asotra K. Calcium wave signaling in cancer cells. Life Sci. 2010;87(19–22):587–595. doi:10.1016/j.lfs.2010.09.013
25. Heise N, Palme D, Misovic M, et al. Non-selective cation channel-mediated Ca2+-entry and activation of Ca2+/calmodulin-dependent kinase II contribute to G2/M cell cycle arrest and survival of irradiated leukemia cells. Cell Physiol Biochem. 2010;26(4–5):597. doi:10.1159/000322327
26. Lee H, Kim JW, Kim DK, et al. Calcium channels as novel therapeutic targets for ovarian cancer stem cells. Int J Mol Sci. 2020;21(7):2327.
27. Davis FM, Parsonage MT, Cabot PJ, et al. Assessment of gene expression of intracellular calcium channels, pumps and exchangers with epidermal growth factor-induced epithelial-mesenchymal transition in a breast cancer cell line. Cancer Cell Int. 2013;13(1):76. doi:10.1186/1475-2867-13-76
28. Abdul M, Ramlal S, Hoosein N. Ryanodine receptor expression correlates with tumor grade in breast cancer. Pathol Oncol Res. 2008;14(2):157–160. doi:10.1007/s12253-008-9045-9
29. Lu H, Chen I, Shimoda LA, et al. Chemotherapy-induced Ca(2+) release stimulates breast cancer stem cell enrichment. Cell Rep. 2017;18(8):1946–1957. doi:10.1016/j.celrep.2017.02.001
30. Otto Warburg FW, Negelein E. The metabolism of tumors in the body. J Gen Physiol. 1927;8:519–530. doi:10.1085/jgp.8.6.519
31. Warburg O. On the origin of cancer cells. Science. 1956;123(3191):309–314. doi:10.1126/science.123.3191.309
32. Nayak AP, Kapur A, Barroilhet L, Patankar MS. Oxidative phosphorylation: a target for novel therapeutic strategies against ovarian cancer. Cancers. 2018;10(9):337. doi:10.3390/cancers10090337
33. Dar S, Chhina J, Mert I, et al. Bioenergetic adaptations in chemoresistant ovarian cancer cells. Sci Rep. 2017;7(1):8760. doi:10.1038/s41598-017-09206-0
34. Ricci F, Brunelli L, Affatato R, et al. Overcoming platinum-acquired resistance in ovarian cancer patient-derived xenografts. Ther Adv Med Oncol. 2019;11:1758835919839543. doi:10.1177/1758835919839543
35. Gentric G, Kieffer Y, Mieulet V, et al. PML-regulated mitochondrial metabolism enhances chemosensitivity in human ovarian cancers. Cell Metab. 2019;29(1):156–173 e110. doi:10.1016/j.cmet.2018.09.002
36. Yang M, Liu P, Huang P. Cancer stem cells, metabolism, and therapeutic significance. Tumour Biol. 2016;37(5):5735–5742. doi:10.1007/s13277-016-4945-x
37. Bonnet D, Dick JE. Human acute myeloid leukemia is organized as a hierarchy that originates from a primitive hematopoietic cell. Nat Med. 1997;3(7):730–737. doi:10.1038/nm0797-730
38. Ricci-Vitiani L, Lombardi DG, Pilozzi E, et al. Identification and expansion of human colon-cancer-initiating cells. Nature. 2007;445(7123):111–115. doi:10.1038/nature05384
39. Al-Hajj M, Wicha MS, Benito-Hernandez A, Morrison SJ, Clarke MF. Prospective identification of tumorigenic breast cancer cells. Proc Natl Acad Sci U S A. 2003;100(7):3983–3988. doi:10.1073/pnas.0530291100
40. Collins AT, Maitland NJ. Prostate cancer stem cells. Eur J Cancer. 2006;42(9):1213–1218. doi:10.1016/j.ejca.2006.01.037
41. Wilson RJ, Thomas CD, Fox R, Roy DB, Kunin WE. Spatial patterns in species distributions reveal biodiversity change. Nature. 2004;432(7015):393–396. doi:10.1038/nature03031
42. Li SS, Ma J, Wong AST. Chemoresistance in ovarian cancer: exploiting cancer stem cell metabolism. J Gynecol Oncol. 2018;29(2):e32. doi:10.3802/jgo.2018.29.e32
43. Pastò A
44. Deleyto-Seldas N, Efeyan A. The mTOR-autophagy axis and the control of metabolism. Front Cell Dev Biol. 2021;9:655731. doi:10.3389/fcell.2021.655731
45. de la Cruz Lopez KG, Toledo Guzman ME, Sanchez EO, Garcia Carranca A. mTORC1 as a regulator of mitochondrial functions and a therapeutic target in cancer. Front Oncol. 2019;9:1373. doi:10.3389/fonc.2019.01373
46. Cunningham JT, Rodgers JT, Arlow DH, Vazquez F, Mootha VK, Puigserver P. mTOR controls mitochondrial oxidative function through a YY1-PGC-1alpha transcriptional complex. Nature. 2007;450(7170):736–740. doi:10.1038/nature06322
47. Guo T, Dong X, Xie S, Zhang L, Zeng P, Zhang L. Cellular mechanism of gene mutations and potential therapeutic targets in ovarian cancer. Cancer Manag Res. 2021;13:3081–3100. doi:10.2147/CMAR.S292992
48. Martinez-Outschoorn UE, Curry JM, Ko YH, et al. Oncogenes and inflammation rewire host energy metabolism in the tumor microenvironment: RAS and NFkappaB target stromal MCT4. Cell Cycle. 2013;12(16):2580–2597. doi:10.4161/cc.25510
 © 2021 The Author(s). This work is published and licensed by Dove Medical Press Limited. The
full terms of this license are available at https://www.dovepress.com/terms
and incorporate the Creative Commons Attribution
- Non Commercial (unported, 3.0) License.
By accessing the work you hereby accept the Terms. Non-commercial uses of the work are permitted
without any further permission from Dove Medical Press Limited, provided the work is properly
attributed. For permission for commercial use of this work, please see paragraphs 4.2 and 5 of our Terms.
© 2021 The Author(s). This work is published and licensed by Dove Medical Press Limited. The
full terms of this license are available at https://www.dovepress.com/terms
and incorporate the Creative Commons Attribution
- Non Commercial (unported, 3.0) License.
By accessing the work you hereby accept the Terms. Non-commercial uses of the work are permitted
without any further permission from Dove Medical Press Limited, provided the work is properly
attributed. For permission for commercial use of this work, please see paragraphs 4.2 and 5 of our Terms.