Back to Journals » OncoTargets and Therapy » Volume 8
Identification of the key genes connected with plasma cells of multiple myeloma using expression profiles
Received 30 December 2014
Accepted for publication 6 March 2015
Published 20 July 2015 Volume 2015:8 Pages 1795—1803
DOI https://doi.org/10.2147/OTT.S80075
Checked for plagiarism Yes
Review by Single anonymous peer review
Peer reviewer comments 3
Editor who approved publication: Dr Faris Farassati
Kefeng Zhang,1 Zhongyang Xu,1 Zhaoyun Sun2
1Spinal Surgery, Jining No 1 People’s Hospital, Jining, 2Department of Orthopedics, The People’s Hospital of Laiwu City, Laiwu, Shandong Province, People’s Republic of China
Objective: To uncover the potential regulatory mechanisms of the relevant genes that contribute to the prognosis and prevention of multiple myeloma (MM).
Methods: Microarray data (GSE13591) were downloaded, including five plasma cell samples from normal donors and 133 plasma cell samples from MM patients. Differentially expressed genes (DEGs) were identified by Student’s t-test. Functional enrichment analysis was performed for DEGs using the Gene Ontology (GO) and Kyoto Encyclopedia of Genes and Genomes (KEGG) databases. Transcription factors and tumor-associated genes were also explored by mapping genes in the TRANSFAC, the tumor suppressor gene (TSGene), and tumor-associated gene (TAG) databases. A protein–protein interaction (PPI) network and PPI subnetworks were constructed by Cytoscape software using the Search Tool for the Retrieval of Interacting Genes (STRING) database.
Results: A total of 63 DEGs (42 downregulated, 21 upregulated) were identified. Functional enrichment analysis showed that HLA-DRB1 and VCAM1 might be involved in the positive regulation of immune system processes, and HLA-DRB1 might be related to the intestinal immune network for IgA production pathway. The genes CEBPD, JUND, and ATF3 were identified as transcription factors. The top ten nodal genes in the PPI network were revealed including HLA-DRB1, VCAM1, and TFRC. In addition, genes in the PPI subnetwork, such as HLA-DRB1 and VCAM1, were enriched in the cell adhesion molecules pathway, whereas CD4 and TFRC were both enriched in the hematopoietic cell pathway.
Conclusion: Several crucial genes correlated to MM were identified, including CD4, HLA-DRB1, TFRC, and VCAM1, which might exert their roles in MM progression via immune-mediated pathways. There might be certain regulatory correlations between HLA-DRB1, CD4, and TFRC.
Keywords: multiple myeloma, functional enrichment, transcription factor analysis, PPI network, pathway enrichment
Introduction
Multiple myeloma (MM) is a malignant plasma cell (PC) disorder and is characterized by the infiltration of malignant PCs, which are the endpoint of B-cell differentiation, in the bone marrow.1–4 The mortality of MM is relatively high; approximately 63,000 individuals die from MM annually, accounting for 0.9% of all cancer deaths.5 Therefore, many studies have been conducted to explore the molecular mechanisms of MM etiology.6,7
MM is known to be associated with heterogeneous cytogenetic abnormalities, including hyperdiploid and nonhyperdiploid karyotypes.8 In patients with a nonhyperdiploid karyotype, many chromosomal translocations are involved, which could lead to the altered expression of related proteins (cyclin D1 and cyclin D3) and genes (WHSC1 and MAF).4 Additionally, the interaction of genes and proteins are also implicated in the pathogenesis of MM. For instance, a previous study demonstrated that IL-6 contributes to the pathogenesis of MM and that the concentrations of insulin-like growth factor binding protein-1 and the soluble IL-6 receptor are positively associated with the risk of MM.9
Despite these significant discoveries, due to the difficulty of obtaining the metaphases of malignant PC clone, there is limited knowledge regarding the genetics of MM due to the difficulty of obtaining malignant PC clones in metaphase. Fortunately, the application of advanced molecular techniques such as microarrays and next-generation sequencing facilitate the improvement of our understanding from a genetic level10 Egan et al11 and Chapman et al12 have analyzed the genomic events that initiate MM using the genomic sequencing.
Microarray data (GSE13591) were established by Agnelli et al13 who analyzed these data using a combined FISH and microarray approach and identified near-tetraploidy as a hallmark of the tumor. They also highlighted that loss of heterozygosity is a prominent mechanism in the regulation of mRNA and gene expressions. In their further studies based on these microarray data, the authors provide an elaborate elucidation of the Hedgehog pathway in MM, laying an elaborate foundation for the use of Hedgehog inhibitor detection in clinical trials.14 Other investigations based on these microarray data (GSE13591) have also been carried out. Lionetti et al15 defined the microRNA/mRNA regulatory network of MM. HOXB7 expression in MM is identified by both microarray data (GSE13591) analysis and further verification of experiments.16,17 Moreover, another study reconstructed gene regulatory networks by combining gene expression profiles from seven publicly available datasets; however, the emphasis of this study was to identify critical genes that predict overall survival in the prognosis of MM.18
Nevertheless, none of the aforementioned studies further analyzed the functions, pathways, or the potential correlations of the identified differentially expressed genes (DEGs) between normal and MM PCs. For this study, we downloaded the microarray data (GSE13591) and reanalyzed them using bioinformatics methods including the identification of DEGs in MM, as well as performed the Gene Ontology (GO), Kyoto Encyclopedia of Genes and Genomes (KEGG), protein–protein interaction (PPI), and PPI subnetwork analyses of these DEGs. These approaches are based on multiple bioinformatic packages, which employ powerful statistical methods,19,20 thus facilitating the identification of critical DEGs and their pathways that are involved in the development of normal PCs into MM. In addition, along with predicting the interactions of the DEGs at the protein level, we aimed to uncover the potential regulatory mechanisms of the relevant genes that contribute to the prognosis and prevention of MM.
Methods
Microarray data and data preprocessing
The gene expression profile GSE13591, deposited by Agnelli et al13 was downloaded from the Gene Expression Omnibus (GEO) database.21 The microarray platform was the GPL96 (HG-U133A) Affymetrix Human Genome U133A Array (Affymetrix, Inc., Santa Clara, CA, USA). The expression profile included 138 samples, comprising five PC samples obtained from normal donors (control group) and 133 PC samples derived from MM patients (MM group).
The raw expression profile data were preprocessed using the Affy package in Bioconductor22 and the Affymetrix annotation files from the Brain Array Lab (Microarray Lab, University of Michigan, Ann Arbor, MI, USA). The background correction, quantile data normalization, and probe summarization were performed by the Robust Multi-array Average algorithm to obtain a gene expression matrix.23
Identification of DEGs
The DEGs between the MM and control groups were identified based on Student’s t-test in the linear models for the microarray data (Limma) package.24 Raw P-values were adjusted into false discovery rates (FDRs) by the Benjamini and Hochberg method.25 The thresholds for DEG selection were FDR <0.05 and |log2FC (fold change)| >1.
Functional enrichment analysis of DEGs
The GO26,27 and KEGG28 pathway29 enrichment analyses were performed to identify the biological functions and pathways of the identified DEGs, based on the hypergeometric distribution algorithm. P<0.05 was chosen as the cut-off value for enriched functions and pathways.
Gene function annotation of DEGs
By mapping the DEGs using the TRANSFAC database,30 the transcription factors among the DEGs were identified. Combined with information from the tumor suppressor gene (TSGene)31 and tumor-associated gene (TAG) databases,32 all known oncogenes and tumor suppressor genes among the DEGs were extracted.
PPI network construction and module analyses
The DEGs were mapped using the Search Tool for the Retrieval of Interacting Genes (STRING)33 database34 to reveal potential correlations between the DEGs at the protein level. Only the interaction pairs that contained at least one DEG were selected to construct the PPI network, with the cut-off value of a confidence score >0.85. Cytoscape software35 was used to visualize the PPI network. Furthermore, the PPI subnetwork was identified using BioNet,36 and FDR <0.01 was chosen as the cut-off value. The KEGG pathway enrichment analysis of the genes in the PPI subnetwork was performed.
Results
DEGs between the MM and control groups
A total of 166 transcripts, corresponding to 63 DEGs, including 42 downregulated DEGs and 21 upregulated DEGs, were identified between the MM and control groups, as shown in the heat map of the cluster analysis of DEGs (Figure 1).
 | Figure 1 The heat map of the cluster analysis of differentially expressed genes. |
Enrichment analysis of DEGs
GO enrichment analysis revealed that 262 functional terms for downregulated DEGs and 78 for upregulated DEGs were enriched; the top ten functional terms ranked by statistical significance were listed in Table 1 (for down- and upregulated DEGs, respectively). As presented in Table 1, the top three significantly enriched GO terms for downregulated DEGs were regulation of immune system processes, immune response, and positive regulation of immune system processes (in which HLA-DRB1, VCAM1, A2M, CXCL12, and HMOX1 might be involved; P=9.99E-16), whereas the top three for upregulated DEGs were primary metabolic processes (in which ATF3, CCNB1IP1, DBF4, DUSP5, and EEF1E1 may participate; P=0.0008866), organic substance metabolic processes (P=0.0014942), and response to axon injury (P=0.0016905).
 | Table 1 Top ten enriched GO of downregulated DEGs and upregulated DEGs |
The KEGG pathway enrichment analysis revealed that 22 pathways for downregulated DEGs and two pathways for upregulated DEGs were enriched. The top ten significant pathways for downregulated DEGs and the two pathways for upregulated DEGs were shown in Table 2. Among them, the top three KEGG pathways for downregulated DEGs were intestinal immune network for immunoglobulin (Ig)A production (P=5.55E-14), antigen processing and presentation (P=7.19E-14), and asthma (P=7.84E-14). The enrichment result implied that the genes HLA-DMA, HLA-DPA1, HLA-DPB1, HLA-DQA1, HLA-DQA2, HLA-DRB1, HLA-DRB3, and HLA-DRB4 might be involved in the top three pathways. The two enriched pathways for upregulated genes were the mitogen-activated protein kinase signaling pathway (P=0.0088912) involving DUSP5, GADD45A, and JUND, and the cell cycle (P=0.0178289), involving DBF4 and GADD45A.
 | Table 2 The top ten enriched KEGG pathways of downregulated DEGs and the two enriched KEGG pathways of upregulated DEGs |
Analysis of gene function annotation
By integrating the information in the TRANSFAC database, there were three transcription factors identified, including one downregulated gene (CEBPD) and two upregulated genes (JUND and ATF3). Additionally, three TAGs, including one downregulated gene (CEBPD) and two upregulated genes (JUND and EEF1E1), were selected.
PPI network and subnetwork analysis
The PPI network of genes was constructed, as shown in Figure 2. The top ten genes/proteins with the highest degrees (the numbers of PPI pairs that the gene/protein possessed) in the PPI network were HLA-DRB1, VCAM1, A2M, CXCL12, CEBPD, HMOX1, CD79A, TFRC, CD19, and GADD45A, with the degrees of 113, 88, 82, 70, 67, 46, 44, 42, 37, and 35, respectively. The PPI subnetwork of genes included 15 nodal genes, of which the top two were HLA-DRB1 and VCAM1, both with a degree of 4, while the degree of TFRC was 1 (Figure 3).
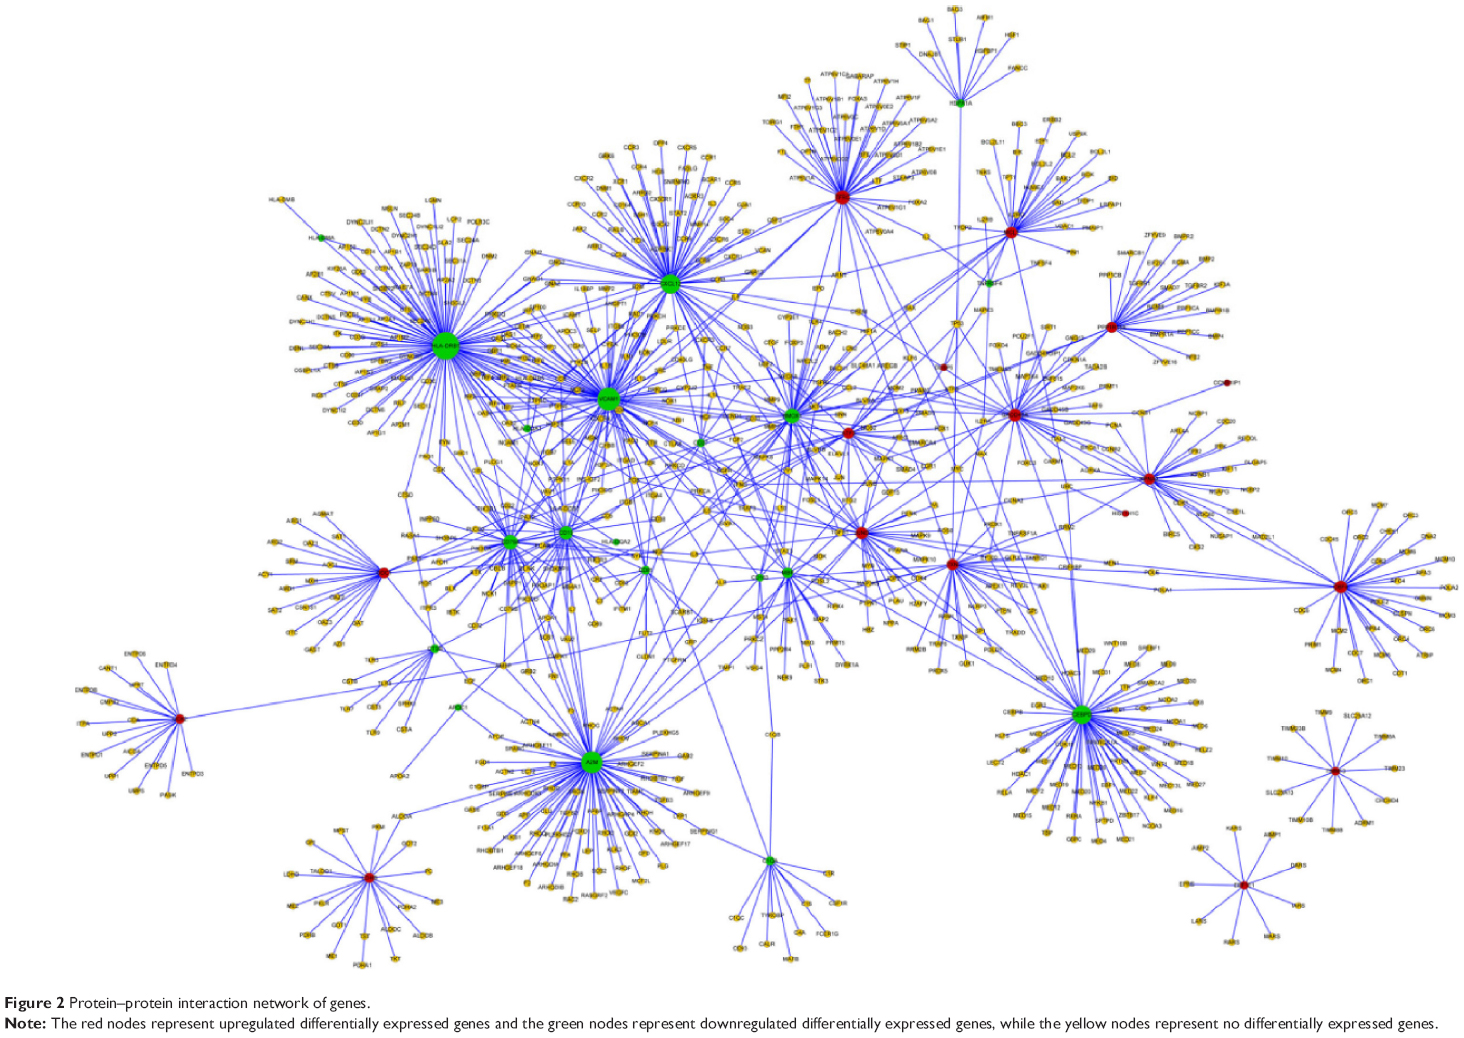 | Figure 2 Protein–protein interaction network of genes. |
 | Figure 3 Protein–protein interaction in the subnetwork of genes. |
For the genes identified in the PPI subnetwork, a total of 20 KEGG pathways were enriched (Table 3). The top three pathways were cell adhesion molecules (P=3.86E-06; in which HLA-DRB1, CD4, HLA-DMA, VCAM1, and HLA-DMB might be involved), the B-cell receptor signaling pathway (P=1.13E-05; in which CD19, CD81, CD79A, and INPP5D might participate), and antigen processing and presentation (P=1.19E-05, in which HLA-DRB1, CD4, HLA-DMA, and HLA-DMB might be involved).
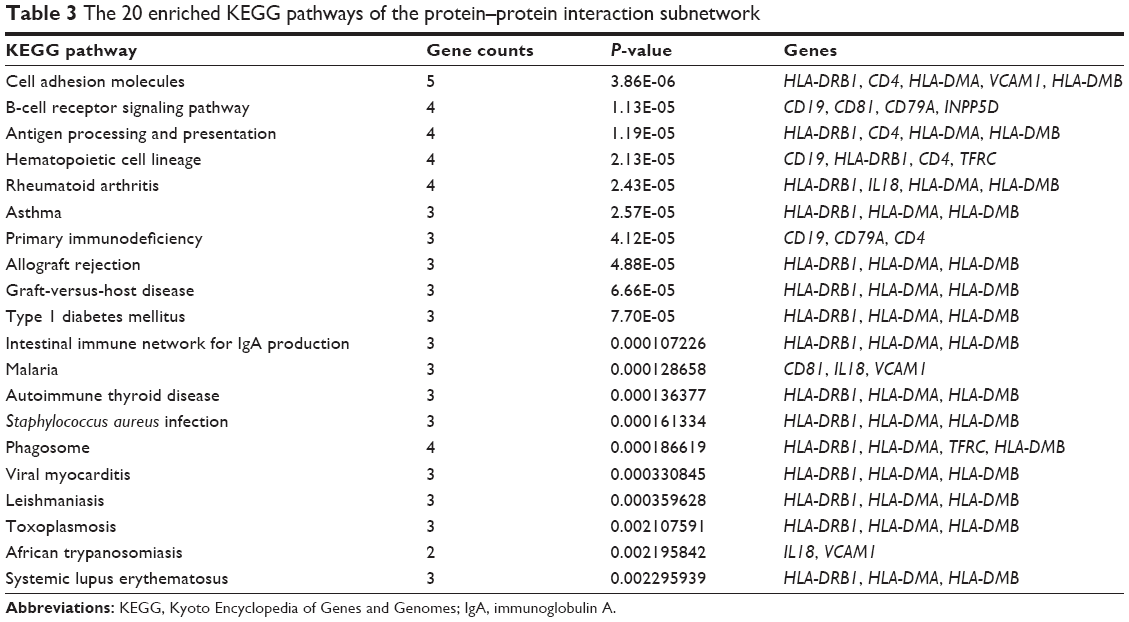 | Table 3 The 20 enriched KEGG pathways of the protein–protein interaction subnetwork |
Discussion
In this study, a total of 63 DEGs (42 downregulated, 21 upregulated) between the MM and control groups were identified. Based on functional and pathway enrichment analyses by GO and KEGG, genes such as HLA-DRB1 and VCAM1 might be involved in the positive regulation of immune system processes; meanwhile, HLA-DRB1 might also participate in the intestinal immune network for the IgA production pathway. In the PPI network, genes such as HLA-DRB1 and TFRC were ranked in the top ten nodal genes with high degrees. In the PPI subetwork, critical nodal genes, including HLA-DRB1, VCAM1, CD4, and TFRC, were identified.
CD4 encodes a T-lymphocyte membrane glycoprotein, which is a receptor for human immunodeficiency virus and functions to initiate or augment the early phase of T-cell activation.37 In patients with MM, although impaired T-cell function and viral-specific cytotoxic T-lymphocytes have been reported, the presence of expanded T-cell populations such as clonal CD4+ T-cells has also been detected.38 CD4 plays significant roles in immune responses mediated by cells and antibodies.39–41 T-helper 17 cells (TH17, a new subset of CD4+ T-cells) have been suggested as a therapeutic target in MM to improve immune function, as the number of TH17 cells is remarkably increased in MM, accompanied by elevated levels of several proinflammatory cytokines.38 The antigen specificity of T-cells makes great sense for the immune system.42 In the present study, CD4 was predicted as a crucial nodal gene in the PPI subnetwork and it was implicated in the antigen processing and presentation pathway, indicating that this gene might play a central role in the immune system through the involvement of this pathway in the development of MM cells from normal PCs.
HLA-DRB1 (major histocompatibility complex, class II, DR Beta 1), which encodes more than 1,196 alleles, is a polymorphic locus of the HLA system.43 It is a member of the HLA class II alpha chain paralogs, which comprise an alpha (DPA) and a beta (DPB) chain and are expressed in antigen-presenting cells.44,45 Via presenting peptides from extracellular proteins, HLA-DRB1 plays a pivotal role in the immune system.46 For instance, it could bind peptides from antigens and present them on the cell surface to be recognized by CD4 T-cells.47 Additionally, HLA-DPB1 alleles are found to be positively associated with IgA deficiency in German individuals.48 Although few studies exist regarding the immune function of HLA-DPB1 related to MM, our pathway analysis suggests that HLA-DRB1 might be involved in the intestinal immune network for the IgA production pathway, implying that HLA-DPB1 might exert a regulatory role in MM development via participation in this pathway. Notably, combined with the potential role of CD4 and the predicted correlations in the PPI subnetwork, a regulatory relationship between HLA-DPB1 and CD4 might exist.
Transferrin receptor (TFRC) is closely related to cellular iron intake.49 TFRC is also related to the immune response.50 The blocking of CD4 results in an increasing peptide dose of CD22 and consequently has an intermediate effect on the response of EK35 (one T-cell clone) response to TFRC,51 indicating that a relationship might exist between the CD4 and TFRC genes. As revealed in our subnetwork, CD4 was linked to TFRC, and both were predicted to be associated with the hematopoietic cell pathway, providing a clue that TFRC might also be involved in MM progression via mediating CD4.
VCAM1 is a member of the Ig superfamily.52 VLA4, which acts as a cell adhesion receptor of VCAM1, mediates the cell adhesion of myeloma cells to bone marrow stroma in MM.53 Moreover, the expression of VLA4 in MM cells could mediate VCAM1 binding to mesenchymal stem cells.4 These results hint that VCAM1 participates in the pathogenesis of MM through its receptor, VLA4. In addition, VCAM1 was implicated in the cell adhesion molecule pathway in our study. Thus, we speculate that VCAM1 might contribute to the development of MM via the cell adhesion molecule pathway.
Conclusion
In conclusion, several crucial genes involved in MM were identified, including CD4, HLA-DRB1, TFRC, and VCAM1. All of these genes might exert their roles in the progression of normal PCs to MM cells via immune-mediated pathways. Notably, certain regulatory correlations might exist between HLA-DRB1, CD4, and TFRC. However, because the results are based on microarray data with a small sample size, more experimental validations are warranted.
Disclosure
The authors report no conflicts of interest in this work.
References
Bladé J, Samson D, Reece D, et al. Criteria for evaluating disease response and progression in patients with multiple myeloma treated by high-dose therapy and haemopoietic stem cell transplantation. Myeloma Subcommittee of the EBMT. European Group for Blood and Marrow Transplant. Br J Haematol. 1998;102(5):1115–1123. | ||
Ruiz-Argüelles GJ, Katzmann JA, Greipp PR, Gonchoroff NJ, Garton JP, Kyle RA. Multiple myeloma: circulating lymphocytes that express plasma cell antigens. Blood. 1984;64(2):352–356. | ||
Tarte K, Zhan F, De Vos J, Klein B, Shaughnessy J. Gene expression profiling of plasma cells and plasmablasts: toward a better understanding of the late stages of B-cell differentiation. Blood. 2003;102(2):592–600. | ||
Hideshima T, Mitsiades C, Tonon G, Richardson PG, Anderson KC. Understanding multiple myeloma pathogenesis in the bone marrow to identify new therapeutic targets. Nat Rev Cancer. 2007;7(8):585–598. | ||
Becker N. Epidemiology of multiple myeloma. Recent Results Cancer Res. 2011;183:25–35. | ||
Chng WJ, Glebov O, Bergsagel PL, Kuehl WM. Genetic events in the pathogenesis of multiple myeloma. Best Pract Res Clin Haematol. 2007;20(4):571–596. | ||
Bergsagel PL, Kuehl WM. Molecular pathogenesis and a consequent classification of multiple myeloma. J Clin Oncol. 2005;23(26):6333–6338. | ||
Fonseca R, Barlogie B, Bataille R, et al. Genetics and cytogenetics of multiple myeloma: a workshop report. Cancer Res. 2004;64(4):1546–1558. | ||
Birmann BM, Neuhouser ML, Rosner B, et al. Prediagnosis biomarkers of insulin-like growth factor-1, insulin, and interleukin-6 dysregulation and multiple myeloma risk in the Multiple Myeloma Cohort Consortium. Blood. 2012;120(25):4929–4937. | ||
Corre J, Munshi N, Avet-Loiseau H. Genetics of multiple myeloma: another heterogeneity level? Blood. 2015;125(12):1870–1876. | ||
Egan JB, Shi CX, Tembe W, et al. Whole-genome sequencing of multiple myeloma from diagnosis to plasma cell leukemia reveals genomic initiating events, evolution, and clonal tides. Blood. 2012;120(5):1060–1066. | ||
Chapman MA, Lawrence MS, Keats JJ, et al. Initial genome sequencing and analysis of multiple myeloma. Nature. 2011;471(7339):467–472. | ||
Agnelli L, Mosca L, Fabris S, et al. A SNP microarray and FISH-based procedure to detect allelic imbalances in multiple myeloma: an integrated genomics approach reveals a wide gene dosage effect. Genes Chromosomes Cancer. 2009;48(7):603–614. | ||
Blotta S, Jakubikova J, Calimeri T, et al. Canonical and noncanonical Hedgehog pathway in the pathogenesis of multiple myeloma. Blood. 2012;120(25):5002–5013. | ||
Lionetti M, Biasiolo M, Agnelli L, et al. Identification of microRNA expression patterns and definition of a microRNA/mRNA regulatory network in distinct molecular groups of multiple myeloma. Blood. 2009;114(25):e20–e26. | ||
Agnelli L, Storti P, Todoerti K, et al. Overexpression of HOXB7 and homeobox genes characterizes multiple myeloma patients lacking the major primary immunoglobulin heavy chain locus translocations. Am J Hematol. 2011;86(12):E64–E66. | ||
Storti P, Donofrio G, Colla S, et al. HOXB7 expression by myeloma cells regulates their pro-angiogenic properties in multiple myeloma patients. Leukemia. 2011;25(3):527–537. | ||
Agnelli L, Forcato M, Ferrari F, et al. The reconstruction of transcriptional networks reveals critical genes with implications for clinical outcome of multiple myeloma. Clin Cancer Res. 2011;17(23):7402–7412. | ||
Cavalieri D, De Filippo C. Bioinformatic methods for integrating whole-genome expression results into cellular networks. Drug Discov Today. 2005;10(10):727–734. | ||
Horimoto K, Toh H. Statistical estimation of cluster boundaries in gene expression profile data. Bioinformatics. 2001;17(12):1143–1151. | ||
Gene Expression Omnibus. Available from: http://www.ncbi.nlm.nih.gov/geo/. Accessed June 30, 2015. | ||
Gautier L, Cope L, Bolstad BM, Irizarry RA. affy – analysis of Affymetrix GeneChip data at the probe level. Bioinformatics. 2004;20(3):307–315. | ||
Irizarry RA, Hobbs B, Collin F, et al. Exploration, normalization, and summaries of high density oligonucleotide array probe level data. Biostatistics. 2003;4(2):249–264. | ||
Smyth GK. Linear models and empirical bayes methods for assessing differential expression in microarray experiments. Stat Appl Genet Mol Biol. 2004;3:Article3. | ||
Benjamini Y, Hochberg Y. Controlling the false discovery rate: a practical and powerful approach to multiple testing. J R Stat Soc Series B Methodol. 1995;57(1):289–300. | ||
Gene Ontology Consortium. Available from: http://www.geneontology.org/. Accessed June 30, 2015. | ||
Ashburner M, Ball CA, Blake JA, et al. Gene ontology: tool for the unification of biology. The Gene Ontology Consortium. Nat Genet. 2000;25(1):25–29. | ||
Kanehisa M, Goto S. KEGG: Kyoto encyclopedia of genes and genomes. Nucleic Acids Res. 2000;28(1):27–30. | ||
Matys V, Fricke E, Geffers R, et al. TRANSFAC: transcriptional regulation, from patterns to profiles. Nucleic Acids Res. 2003;31(1):374–378. | ||
Zhao M, Sun J, Zhao Z. TSGene: a web resource for tumor suppressor genes. Nucleic Acids Res. 2013;41(Database issue):D970–D976. | ||
Chen JS, Hung WS, Chan HH, Tsai SJ, Sun HS. In silico identification of oncogenic potential of fyn-related kinase in hepatocellular carcinoma. Bioinformatics. 2013;29(4):420–427. | ||
STRING: Search Tool for the Retrieval of Interacting Genes/Proteins. Available from: http://string-db.org/. Accessed June 30, 2015. | ||
Franceschini A, Szklarczyk D, Frankild S, et al. STRING v9.1: protein-protein interaction networks, with increased coverage and integration. Nucleic Acids Res. 2013;41(Database issue):D808–D815. | ||
Saito R, Smoot ME, Ono K, et al. A travel guide to Cytoscape plugins. Nat Methods. 2012;9(11):1069–1076. | ||
Beisser D, Klau GW, Dandekar T, Müller T, Dittrich MT. BioNet: an R-Package for the functional analysis of biological networks. Bioinformatics. 2010;26(8):1129–1130. | ||
Traunecker A, Lüke W, Karjalainen K. Soluble CD4 molecules neutralize human immunodeficiency virus type 1. Nature. 1988;331(6151):84–86. | ||
Prabhala RH, Pelluru D, Fulciniti M, et al. Elevated IL-17 produced by TH17 cells promotes myeloma cell growth and inhibits immune function in multiple myeloma. Blood. 2010;115(26):5385–5392. | ||
Toes RE, Ossendorp F, Offringa R, Melief CJ. CD4 T cells and their role in antitumor immune responses. J Exp Med. 1999;189(5):753–756. | ||
Eto D, Lao C, DiToro D, et al. IL-21 and IL-6 are critical for different aspects of B cell immunity and redundantly induce optimal follicular helper CD4 T cell (Tfh) differentiation. PLoS One. 2011;6(3):e17739. | ||
Prabhala RH, Neri P, Bae JE, et al. Dysfunctional T regulatory cells in multiple myeloma. Blood. 2006;107(1):301–304. | ||
Germain RN, Margulies DH. The biochemistry and cell biology of antigen processing and presentation. Annu Rev Immunol. 1993;11:403–450. | ||
Kwok J, Lau RW, Halliwell J, Marsh SG. Identification of a novel HLA-DRB1*11:129 allele in a Chinese individual by sequence-based typing. Tissue Antigens. 2013;81(4):237–239. | ||
Wang M, Chen X, Zhang M, Zhu W, Cho K, Zhang H. Detecting significant single-nucleotide polymorphisms in a rheumatoid arthritis study using random forests. BMC Proc. 2009;3 Suppl 7:S69. | ||
He B, Zhang H, Shi T. A comprehensive analysis of the dynamic biological networks in HCV induced hepatocarcinogenesis. PLoS One. 2011;6(4):e18516. | ||
van der Helm-van Mil AH, Verpoort KN, le Cessie S, Huizinga TW, de Vries RR, Toes RE. The HLA-DRB1 shared epitope alleles differ in the interaction with smoking and predisposition to antibodies to cyclic citrullinated peptide. Arthritis Rheum. 2007;56(2):425–432. | ||
Zarour HM, Storkus WJ, Brusic V, Williams E, Kirkwood JM. NY-ESO-1 encodes DRB1*0401-restricted epitopes recognized by melanoma-reactive CD4+ T cells. Cancer Res. 2000;60(17):4946–4952. | ||
MacHulla HK, Schönermarck U, Schaaf A, et al. HLA-A, B, Cw and DRB1, DRB3/4/5, DQB1, DPB1 frequencies in German immunoglobulin A-deficient individuals. Scand J Immunol. 2000;52(2):207–211. | ||
Muckenthaler MU, Galy B, Hentze MW. Systemic iron homeostasis and the iron-responsive element/iron-regulatory protein (IRE/IRP) regulatory network. Annu Rev Nutr. 2008;28:197–213. | ||
Heller MC, Jackson KA, Watson JL. Identification of immunologically relevant genes in mare and foal dendritic cells responding to infection by Rhodococcus equi. Vet Immunol Immunopathol. 2010;136(1–2):144–150. | ||
Felix NJ, Donermeyer DL, Horvath S, et al. Alloreactive T cells respond specifically to multiple distinct peptide-MHC complexes. Nat Immunol. 2007;8(4):388–397. | ||
Boscacci RT, Pfeiffer F, Gollmer K, et al. Comprehensive analysis of lymph node stroma-expressed Ig superfamily members reveals redundant and nonredundant roles for ICAM-1, ICAM-2, and VCAM-1 in lymphocyte homing. Blood. 2010;116(6):915–925. | ||
Sanz-Rodríguez F, Hidalgo A, Teixidó J. Chemokine stromal cell-derived factor-1alpha modulates VLA-4 integrin-mediated multiple myeloma cell adhesion to CS-1/fibronectin and VCAM-1. Blood. 2001;97(2):346–351. |
 © 2015 The Author(s). This work is published and licensed by Dove Medical Press Limited. The
full terms of this license are available at https://www.dovepress.com/terms
and incorporate the Creative Commons Attribution
- Non Commercial (unported, 3.0) License.
By accessing the work you hereby accept the Terms. Non-commercial uses of the work are permitted
without any further permission from Dove Medical Press Limited, provided the work is properly
attributed. For permission for commercial use of this work, please see paragraphs 4.2 and 5 of our Terms.
© 2015 The Author(s). This work is published and licensed by Dove Medical Press Limited. The
full terms of this license are available at https://www.dovepress.com/terms
and incorporate the Creative Commons Attribution
- Non Commercial (unported, 3.0) License.
By accessing the work you hereby accept the Terms. Non-commercial uses of the work are permitted
without any further permission from Dove Medical Press Limited, provided the work is properly
attributed. For permission for commercial use of this work, please see paragraphs 4.2 and 5 of our Terms.