Back to Journals » OncoTargets and Therapy » Volume 10
Identification of the anticancer effects of a novel proteasome inhibitor, ixazomib, on colorectal cancer using a combined method of microarray and bioinformatics analysis
Received 15 April 2017
Accepted for publication 1 June 2017
Published 19 July 2017 Volume 2017:10 Pages 3591—3606
DOI https://doi.org/10.2147/OTT.S139686
Checked for plagiarism Yes
Review by Single anonymous peer review
Peer reviewer comments 2
Editor who approved publication: Dr Carlos E Vigil
Video abstract presented by Qiaowei Fan.
Views: 541
Qiaowei Fan, Bingrong Liu
Department of Gastroenterology and Hepatology, The Second Affiliated Hospital of Harbin Medical University, Harbin, Heilongjiang, People’s Republic of China
Purpose: The study aimed to explore the anticancer effects of a novel proteasome inhibitor, ixazomib, on colorectal cancer (CRC) using a combined method of microarray and bioinformatics analysis.
Materials and methods: Cell proliferation was tested by Cell Counting Kit-8 (CCK-8) assay for SW620 cells treated with different concentrations of ixazomib and different treatment times. The microarray analysis was conducted for six samples, including three samples of SW620 cells untreated with ixazomib and three samples of SW620 cells treated with ixazomib. The differentially expressed genes (DEGs) between untreated and treated samples were identified by the Linear Models for Microarray data (LIMMA) package in R language. The Gene Ontology (GO) functional and Kyoto Encyclopedia of Genes and Genomes (KEGG) pathway enrichment analysis were performed for the DEGs using the Database for Annotation, Visualization and Integrated Discovery (DAVID) and KEGG Orthology-Based Annotation System (KOBAS) online tool. The protein–protein interaction (PPI) network was constructed using the Search Tool for the Retrieval of Interacting Genes/Proteins (STRING) database, and module analysis was performed for the PPI network.
Results: Ixazomib could inhibit the proliferation of SW620 cells in a dose-dependent and time-dependent manner. A total of 743 DEGs, including 203 upregulated DEGs such as HSPA6 and 540 downregulated DEGs such as APCDD1, were identified. Eighty-three GO terms were enriched for DEGs, which were mainly related to protein folding, apoptotic process, transcription factor activity, and proteasome. Thirty-seven KEGG pathways were perturbed, including pathway of apoptosis and cell cycle. Forty-six hub genes, such as TP53, JUN, and ITGA2, were screened out, and three modules with important functions were mined from the PPI network.
Conclusion: The novel proteasome inhibitor ixazomib significantly inhibited the proliferation of human CRC SW620 cells. It exerted anticancer effects through targeting the expression of DEGs, such as HSPA6, APCDD1, TP53, and JUN, and affecting the signaling pathways including apoptosis and cell cycle pathway, which demonstrated the promising potential of ixazomib for CRC therapy.
Keywords: colorectal cancer, ixazomib, differentially expressed genes, functional enrichment analysis, protein–protein interaction
Introduction
Colorectal cancer (CRC) is a worldwide health burden, ranking the third most common cancer in men and the second in women.1 Despite progress made in the treatment of CRC, which has increased survival rates of CRC patients, metastasis, recurrence, and chemoresistance remain as obstacles to effective therapy.2–4 Therefore, discovering innovative therapeutic agents are urgently required to combat these problems.
The ubiquitin–proteasome system (UPS) is the major proteolytic system mediating the degradation of intracellular proteins in eukaryotes.5 Misfolded, damaged, or specific proteins are targeted for destruction through the attachment of ubiquitin molecules and degraded by the 26S proteasome.6–8 These proteasome substrates include regulatory proteins involved in cell proliferation, cell cycle regulation, transcription, signal transduction, apoptosis, and many other biological processes (BPs).9,10 The stabilization of UPS is necessary for maintaining cellular homeostasis and normal functions.
Malignant cells, with hypermetabolism and uncontrolled proliferation, depend more on high proteasome activity than normal cells. Inhibition of proteasome activity may cause various effects on tumor cells, including anti-inflammatory, antiproliferative, and apoptotic effects, which result in cancer cell death ultimately. It has been reported that malignant cells are highly susceptible to proteasome inhibition.11–13 Therefore, proteasome inhibitors emerged as attractive anticancer therapeutics.
Ixazomib (MLN2238), a novel proteasome inhibitor, was approved by US Food and Drug Administration in November 2015 for use in combination with lenalidomide and dexamethasone for the treatment of patients with relapsed or refractory multiple myeloma who received at least one previous therapy.14 It is the first globally approved, orally administered proteasome inhibitor used for the treatment of this patient population.15 It not only achieved satisfactory clinical outcomes in MM patients but also showed obvious anticancer effects against multiple tumors including chronic lymphocytic leukemia, prostate cancer, breast cancer, and neuroblastoma.16–19 However, researches focusing on the antitumor effects of ixazomib on CRC are limited, and the anti-CRC mechanisms of ixazomib remain far more to be elucidated.
In this study, we utilized a microarray- and bioinformatics-based method to identify the anticancer effects of ixazomib on CRC cells. Differentially expressed genes (DEGs) were screened out between SW620 cells treated with or without ixazomib. Functional and pathway enrichment analyses were performed for the DEGs to recognize the biological functions and signaling pathways affected by ixazomib. Protein–protein interaction (PPI) network was constructed to identify hub genes. Subnetwork analysis was further performed to mine the molecular complex in the PPI network. To the best of our knowledge, this is the first study using a combined method of microarray and bioinformatics analysis to identify the comprehensive anticancer mechanisms of ixazomib on CRC cells. Our study demonstrated ixazomib as a potential drug against CRC, providing new insights on CRC therapy.
Materials and methods
Cell culture
Human CRC cell line SW620 was obtained from the Cell Bank of the Type Culture Collection of the Chinese Academy of Sciences (Shanghai, China). The cells were cultured in RPMI-1640 medium (HyClone Laboratories, Logan, UT, USA) supplemented with 10% fetal bovine serum (Clark Bioscience, Seabrook, MD, USA), 100 U/mL penicillin, and 100 μg/mL streptomycin (Beyotime Institute of Biotechnology, Shanghai, China) at 37°C in a humidified atmosphere containing 5% CO2.
CCK-8 test for cell proliferation assay
Cell proliferation was measured by CCK-8 assay (Dojindo Molecular Technologies, Inc., Rockville, MD, USA) according to the manufacturer’s instructions. SW620 cells (2×10⁴/mL) suspended in RPMI-1640 medium containing 10% fetal bovine serum were seeded in 96-well plates with 100 μL/well and incubated for 24 h. The cells were then treated with various concentrations of ixazomib (Selleck, Shanghai, China) for 24 and 48 h. Cells incubated without ixazomib for the same periods of time were set as the control groups. After various periods of incubation, 10 μL of CCK-8 solution was added to each well and incubated with cells for 2 h at 37°C. The optical density was then detected with a microplate reader at a wavelength of 450 nm.
Cancer cells’ treatment, RNA extraction, and purification
SW620 cells were seeded in a sterile cell culture dish (10×10 cm) for 24 h first to allow for cell attachment and growth. Then, cells were treated with ixazomib at the concentration of 1 μmol/L (1,000 nmol/L), which exerts a moderate inhibition on the proliferation of SW620 cells according to the CCK-8 cell proliferation assay, for 24 h. Cells cultured without ixazomib for the same culture time were set as the controls. Following 24 h incubation at 37°C, the cells were harvested and the total RNA was extracted using the TRIzol reagent (Thermo Fisher Scientific, Waltham, MA, USA). RNA quantity and quality were assessed using the Nanodrop and Agilent 2100 bioanalyzer systems, respectively. The experiment was carried out in triplicate. Then, the qualified RNAs from three samples treated with ixazomib and three control (untreated) samples were further purified using the NucleoSpin® RNA Clean-up XS kit (Macherey-Nagel, Düren, Germany) and RNase-Free DNase Set (Qiagen NV, Venlo, the Netherlands) according to the manufacturers’ instructions.
Microarray hybridization procedure
Gene expression levels of each sample were measured using the Affymetrix GeneChip Human Genome U133 Plus 2.0 Array (Affymetrix, Inc., Santa Clara, CA, USA). According to the manufacturer’s instructions, total RNA were amplified, labeled using the GeneChip™ 3′ IVT PLUS Reagent Kit (Affymetrix, Inc.) to obtain biotin-labeled cRNA. Microarray hybridization and washing were carried out using the GeneChip™ Hybridization, Wash, and Stain Kit (Affymetrix, Inc.) in Hybridization Oven 645 (Affymetrix, Inc.) and Fluidics Station 450 (Affymetrix, Inc.). Slides were scanned by GeneChip® Scanner 3000 (Affymetrix, Inc.) and Command Console Software 4.0 (Affymetrix, Inc.) with default settings. Then, a total of six CEL files (three files of ixazomib-treated samples and three control samples) were obtained for further analysis.
Microarray data preprocessing
The raw data in CEL files of the six samples were first converted into probe expression values using the affy package in R language and preprocessed for background adjustment, quantile normalization, final summarization, and log2 transformation by robust multiarray average (RMA) algorithm in affy package.20,21 Then, the probe-level data were transformed to the expression values of genes according to the probe set annotation file of Affymetrix GeneChip Human Genome U133 Plus 2.0 Array, which was downloaded from the website of Affymetrix. If more than one probe corresponded to the same gene symbol, the average expression value of these probes was calculated as the expression value of the specific gene. After data preprocessing, we got the expression profile dataset including 21,275 genes for each of the six samples.
DEGs screening and hierarchical clustering analysis
The DEGs between ixazomib-treated samples and control samples were identified using the Linear Models for Microarray data (LIMMA) package in R language.22 The log2fold change (log2FC) was calculated. And, the |log2FC| >1.5 and adjusted P-value <0.05 were used as the threshold for identifying DEGs. Hierarchical clustering analysis of the identified DEGs was further performed using the pheatmap package in R and displayed in a heatmap.23
Gene Ontology (GO) functional and KEGG pathway enrichment analysis of DEGs
The GO analysis is a commonly used approach providing functional studies of large-scale genomic or transcriptomic data.24 Kyoto Encyclopedia of Genes and Genomes (KEGG) database collects the pathway-related information about how molecules are networked.25 In the present study, the GO functional analysis comprising three ontology categories of BP, cellular component (CC), and molecular function (MF) for the DEGs was performed using the Database for Annotation, Visualization and Integrated Discovery (DAVID, Version 6.8; https://david.ncifcrf.gov/), an online tool containing an integrated biological knowledgebase and analytic tools for systematically extracting biological meaning from a large number of genes or proteins.26 The P-value <0.05 was set as the cutoff criterion for GO functional analysis. The KEGG enrichment analysis was carried out by KEGG Orthology-Based Annotation System (KOBAS; http://kobas.cbi.pku.edu.cn/) to identify the most significantly enriched KEGG pathways of the DEGs with corrected P-value <0.05 set as the threshold.27
Construction of PPI network
The PPI network of DEGs was constructed using the Search Tool for the Retrieval of Interacting Genes/Proteins (STRING, Version 10.0; http://www.string-db.org/), which contains information regarding >932 million interactions of >9 million proteins.28 Interactions including stable physical associations, transient binding, substrate chaining, and information relay between the DEGs were considered for PPI network construction. All interactions in the PPI network were provided with a confidence score, which represented the existence possibility of the interaction judged by STRING between the two genes. Only interactions with the score of ≥0.4 were selected for PPI network construction, and the PPI network was visualized using the Cytoscape (http://cytoscape.org/) software.29 Genes serve as “nodes” in the PPI network, and edges stand for associated interactions. The “degree” of a node represents the number of interactions between the specific gene and other genes. In the study, the connectivity degree of each network node was calculated by the plugin of CentiScaPe (http://apps.cytoscape.org/apps/centiscape) in Cytoscape.30 Nodes with a degree of more than 10 were deemed as hub nodes, indicating close connections with other nodes and crucial roles in the network.
Module mining and analysis of the PPI network
Genes in the same network module often execute the same BPs together. In this study, the plugin of Molecular Complex Detection (MCODE) in Cytoscape was used to mine and analyze modules from original PPI network.31 The significant modules with MCODE score ≥5 and nodes ≥5 were further selected for GO BP analysis to find important BPs where these modules participated in, which was performed using the DAVID online tool with a threshold of P-value <0.05.
Results
Ixazomib inhibits the proliferation of SW620 cells in a dose-dependent and time-dependent manner
The effect of ixazomib on the proliferation of CRC SW620 cells was determined by the CCK-8 assay. For ixazomib at the concentration of 100, 500, 1,000, and 2,000 nmol/L with a treatment time of 24 h, the inhibition rate (mean ± standard deviation) was 4.69±8.04, 28.36±4.49, 35.03±3.49, and 39.46%±2.58%, respectively, compared with the control groups. The corresponding inhibition rate with the same ixazomib concentration gradient for a treatment time of 48 h was 13.60±8.74, 41.88±3.34, 59.29±12.70, and 84.07%±2.67%, respectively. As shown in Figure 1, the inhibition rate gradually increased with an increase in concentration and treatment time of ixazomib, indicating that ixazomib inhibits the proliferation of SW620 cells in a dose-dependent and time-dependent manner.
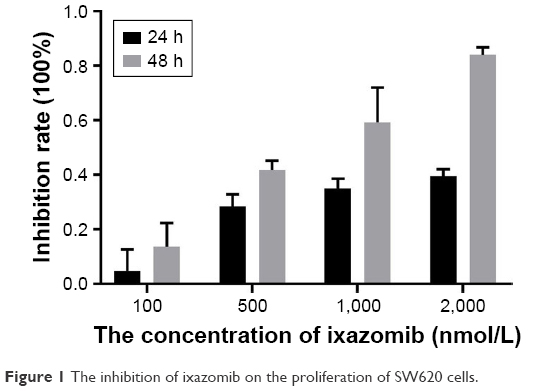 | Figure 1 The inhibition of ixazomib on the proliferation of SW620 cells. |
Identification of DEGs between ixazomib-treated and untreated samples
To remove systematic bias, the original data were first preprocessed by affy package in R language. Gene expression profile data with an excellent degree of standardization were used for the analysis of DEGs. Based on the cutoff criteria, a total of 743 DEGs were identified between ixazomib-treated and untreated samples, including 203 upregulated and 540 downregulated genes. The genes’ expression variations are shown in volcano plot in Figure 2, with DEGs marked in red. The top 10 significantly upregulated and downregulated DEGs are listed in Table 1.
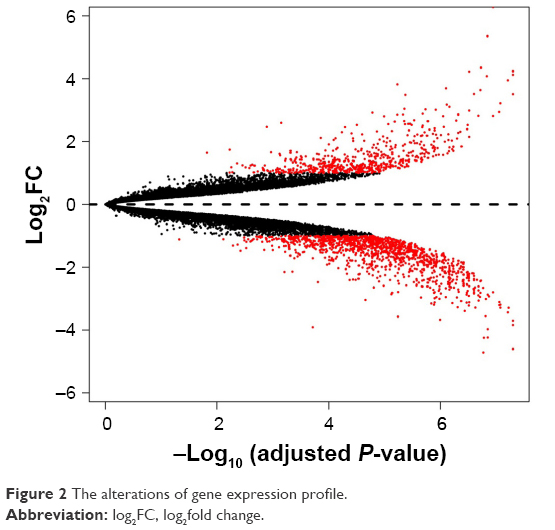 | Figure 2 The alterations of gene expression profile. |
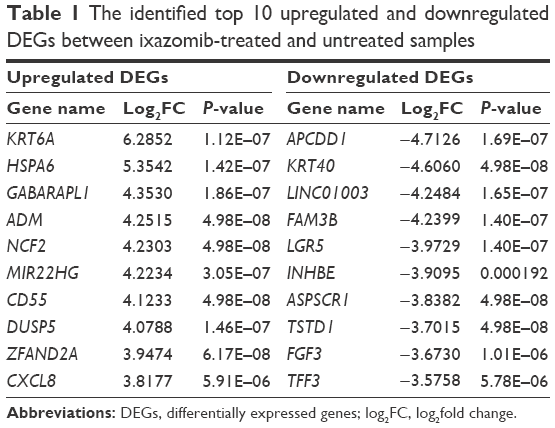 | Table 1 The identified top 10 upregulated and downregulated DEGs between ixazomib-treated and untreated samples |
Hierarchical clustering of DEGs
Hierarchical clustering of the identified DEGs is displayed in Figure 3. As shown in the heatmap, three ixazomib-treated samples owned strong gene expression similarity and were categorized into one cluster, whereas three untreated samples were grouped into the other cluster. The results of hierarchical cluster analysis demonstrated that based on the expression of DEGs, the ixazomib-treated samples could be clearly distinguished from the untreated samples, which indicated good specificity of the DEGs.
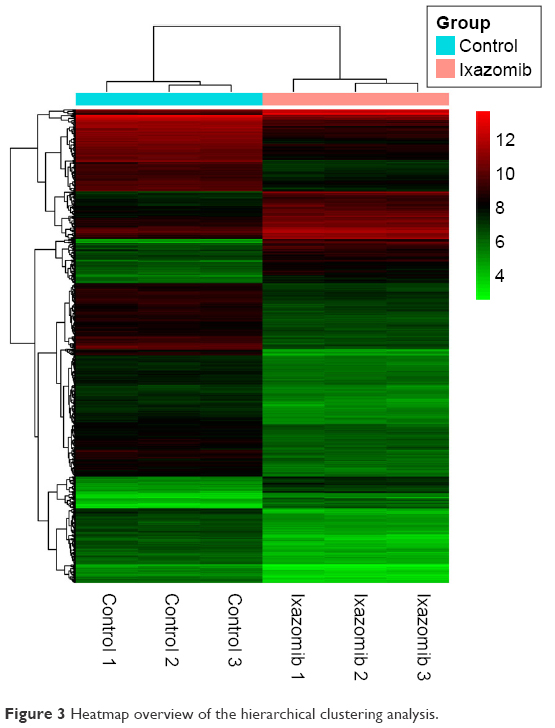 | Figure 3 Heatmap overview of the hierarchical clustering analysis. |
GO functional enrichment analysis
Based on the cutoff criterion, a total of 83 GO terms were enriched by the DEGs, including 67 BP terms, eight CC terms, and eight MF terms. According to the BP terms, DEGs mainly participated in BPs regarding responses to unfolded protein and protein refolding (GO:0006986, GO:0036499, and GO:0042026), apoptosis (GO:0042981, GO:0043065, GO:0006915, and GO:0097193), negative regulation of cell proliferation and growth (GO:0008285 and GO:0030308), and cell cycle arrest (GO:0006977 and GO:0007050). According to the CC terms, DEGs were principally enriched in mitochondrion-related CCs (GO:0005739 and GO:0005759) and proteasome-related CCs (GO:0000502 and GO:0022624). According to the MF terms, DEGs were enriched in MFs including protein binding (GO:0005515 and GO:0051082), transcription factor activity (GO:0000982), hydrolase activity (GO:0016787), and phosphatase activity (GO:0016791). The top 35 BP terms and all the eight CC terms and MF terms are listed in Table 2, and the rest 32 BP terms are listed in Table S1.
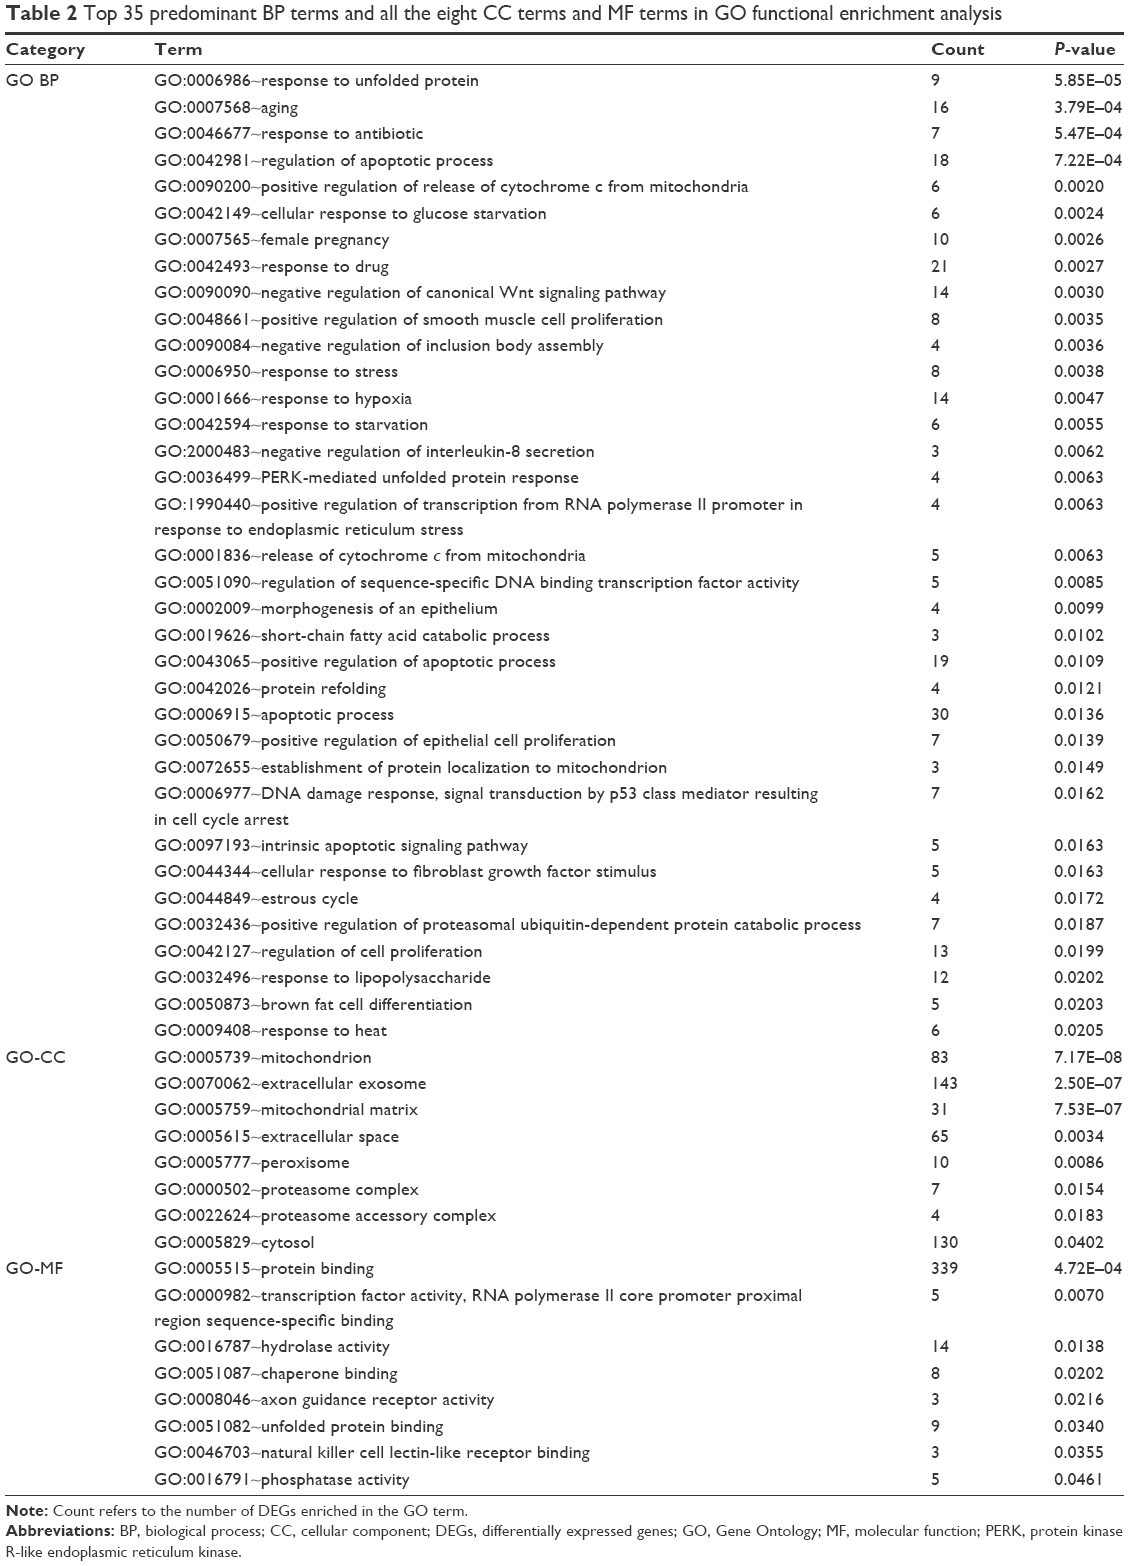 | Table 2 Top 35 predominant BP terms and all the eight CC terms and MF terms in GO functional enrichment analysis |
KEGG pathway enrichment analysis
There were 37 KEGG pathways enriched in the study, including metabolic pathways (hsa01100), apoptosis (hsa04210), cell cycle (hsa04110), p53 signaling pathway (hsa04115), and MAPK signaling pathway (hsa04010). The top 25 significantly enriched KEGG pathways of DEGs are listed in Table 3, and the KEGG pathway of apoptosis is displayed in Figure 4, with DEGs colored in red. Notably, the pathway of proteasome (hsa03050), which was directly related to the mechanism of ixazomib, was enriched in KEGG analysis, demonstrating the credibility of the results.
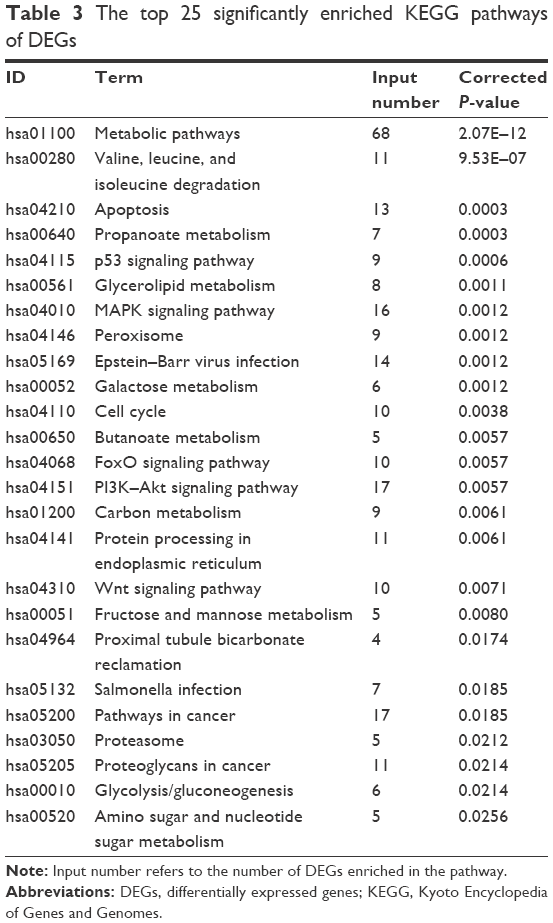 | Table 3 The top 25 significantly enriched KEGG pathways of DEGs |
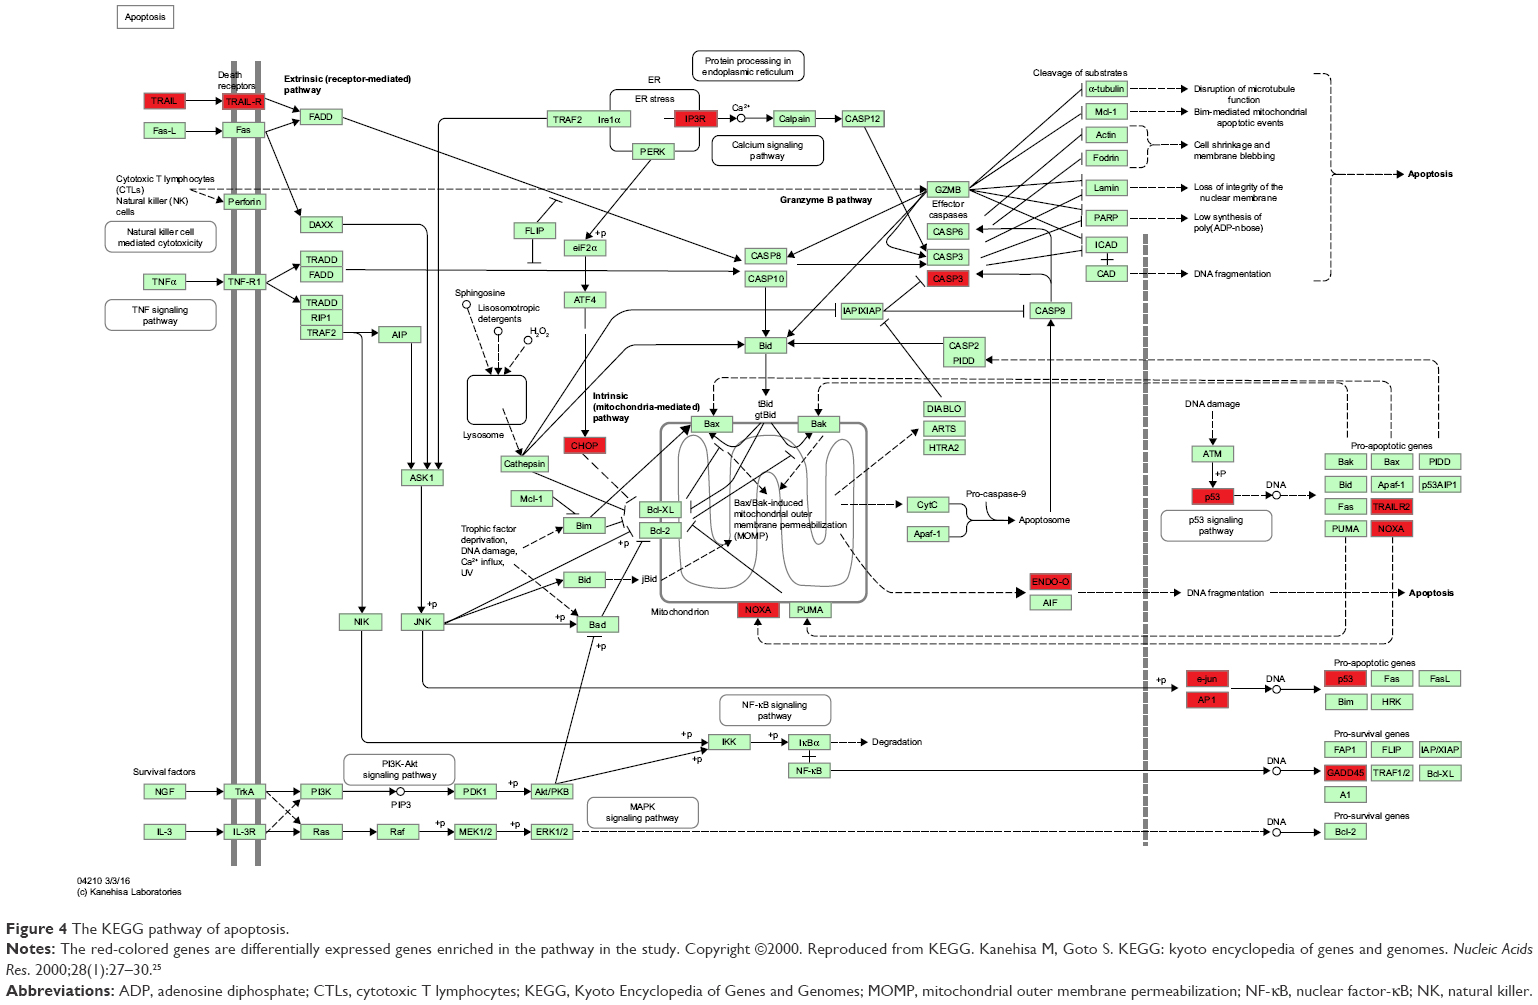 | Figure 4 The KEGG pathway of apoptosis. |
PPI network construction and hub gene identification
After STRING analysis of the DEGs, the PPI network was constructed with 430 nodes and 1,126 interactions and is shown in Figure 5. After degree calculating, a total of 46 hub genes were identified with the degree of >10 (Table 4). Among these, TP53, TSPO, JUN, FOS, ITGA2, CDKN1A, DECR1, HSPA5, BMP4, and HMOX1 were the top 10 hub genes with the closest connections to other nodes.
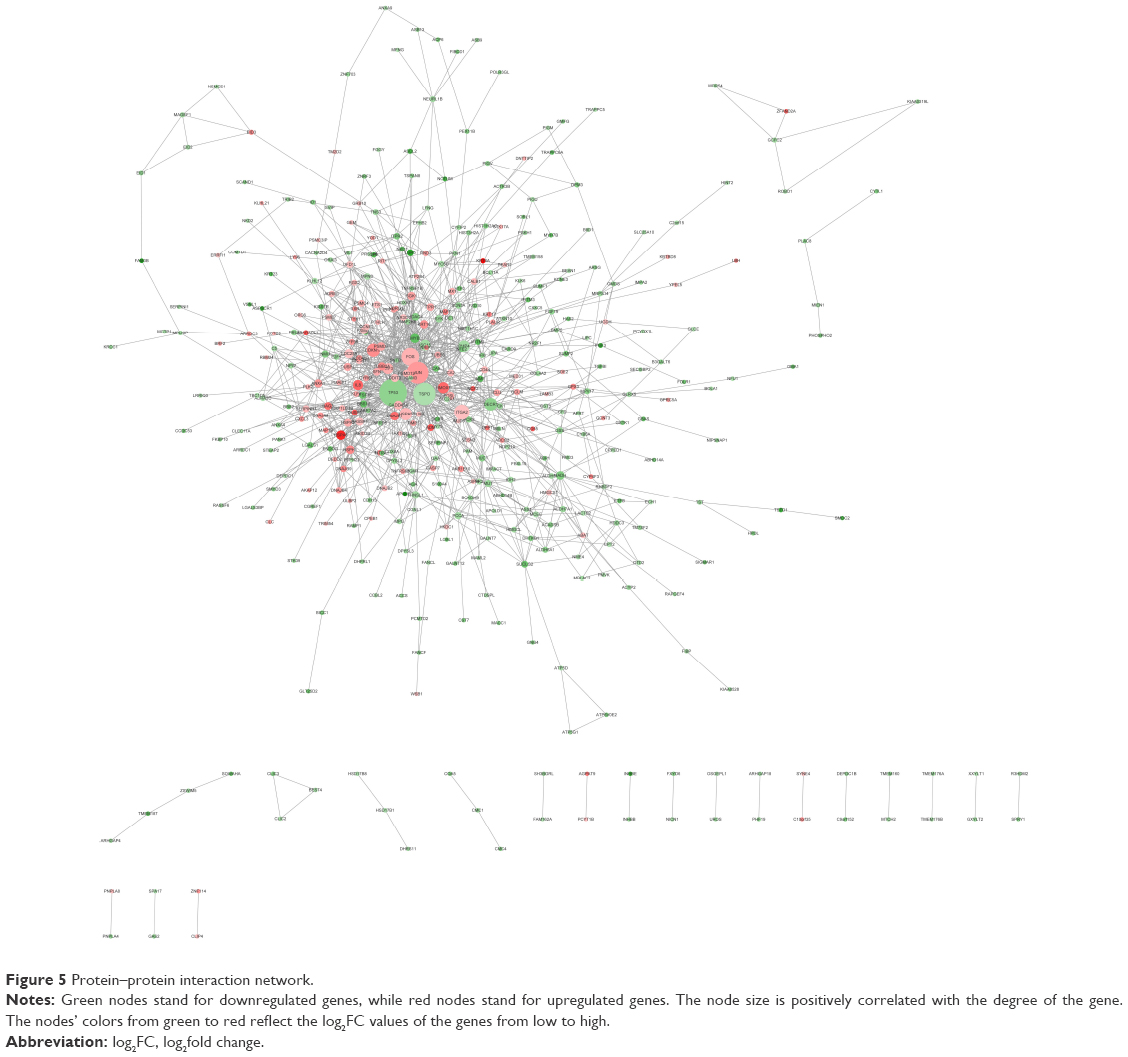 | Figure 5 Protein–protein interaction network. |
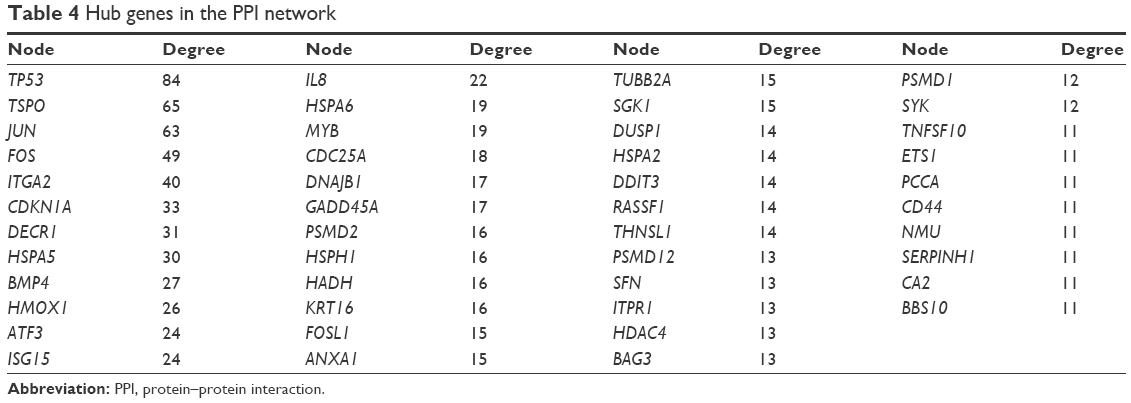 | Table 4 Hub genes in the PPI network |
Module analysis of the PPI network
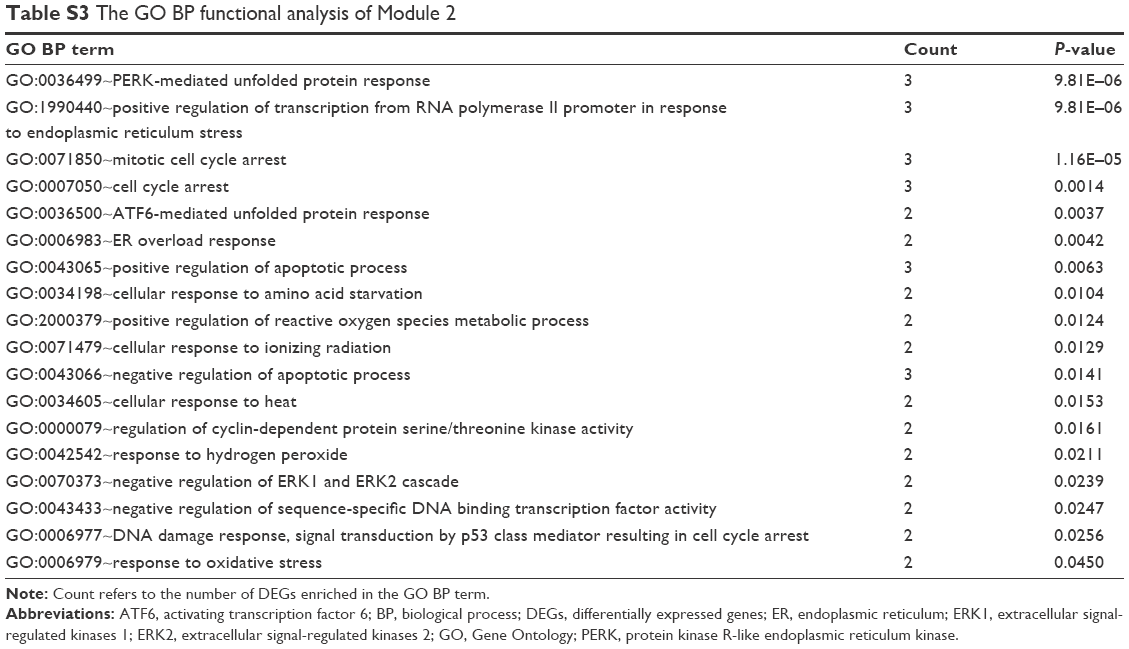
A total of 17 modules were mined from the PPI network. Among these, three modules (Module 1, Module 2, and Module 3) with both MCODE score ≥5 and nodes ≥5 (Figure 6) were further selected for functional analysis. GO BP functional analysis showed that the functions of Module 1 were mainly associated with transcription (GO:0006366, GO:0045944, GO:1902895, and GO:0061614), the regulation of apoptosis (GO:0043065 and GO:0042981), and the regulation of cell proliferation (GO:0008285 and GO:0042127) (Table S2). Module 2 exhibited a close relationship with BPs about cell cycle arrest (GO:0071850 and GO:0007050) and cellular response to stimuli (GO:0034198 and GO:0006979) (Table S3). The genes in Module 3 were mainly associated with ubiquitin-dependent protein catabolism (GO:0051436 and GO:0043161) and cellular signaling pathway (such as GO:0090090, GO:0038061, and GO:0060071) (Table S4).
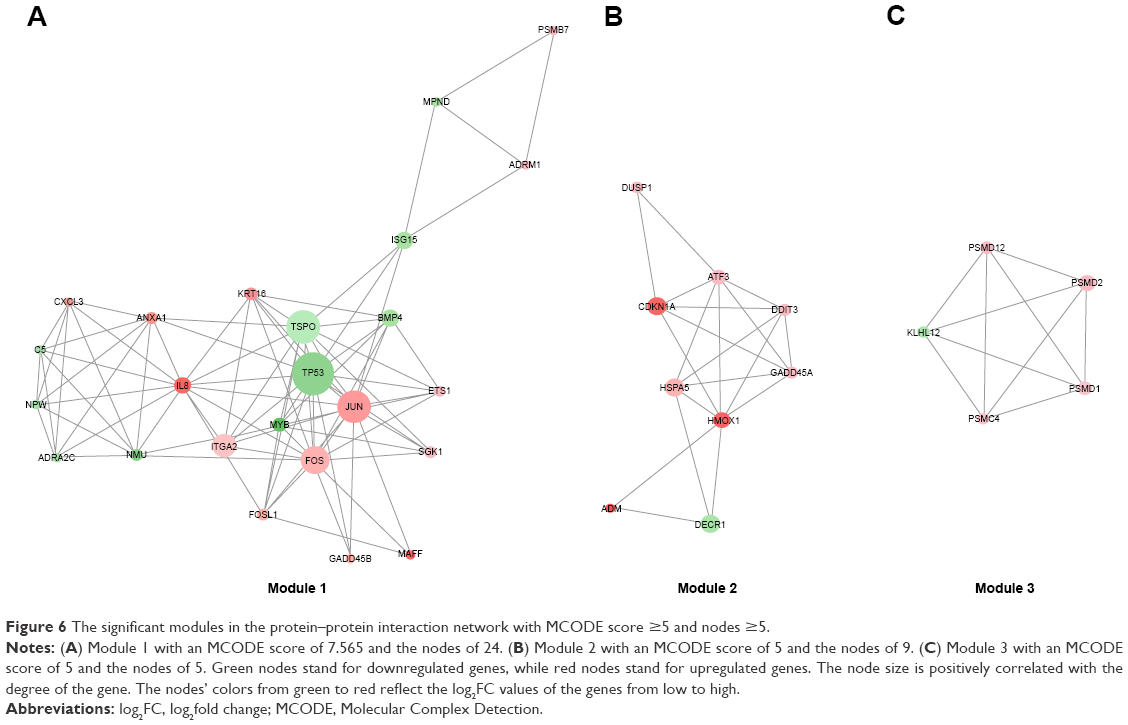 | Figure 6 The significant modules in the protein–protein interaction network with MCODE score ≥5 and nodes ≥5. |
Discussion
CRC is one of the most lethal cancers worldwide.1 Therapies nowadays can not effectively overwhelm the problems, such as metastasis, recurrence, and chemoresistance.2–4 Searching for novel strategies is still of great urgency for CRC treatment. Ixazomib, a second-generation oral proteasome inhibitor, has shown excellent therapeutic effects on multiple myeloma patients. Meanwhile, it also displayed obvious anticancer effects against some solid tumors in vitro and in vivo.17–19 Therefore, it is valuable to explore the antitumor effect of ixazomib on CRC.
In the present study, we first investigated the effect of ixazomib on the proliferation of SW620 cells. It was observed that ixazomib had antiproliferation effect on SW620 cells. CCK-8 assay showed that ixazomib significantly reduced cell proliferation in a dose-dependent and time-dependent manner. To further explore the anticancer activities and the potential mechanisms of ixazomib on CRC cells, we performed a combination analysis of microarray and bioinformatics.
According to the microarray analysis, a total of 743 DEGs were identified between ixazomib-treated and untreated samples. Among these, 203 genes, such as HSPA6, CASP7, and CDKN1A, were upregulated and 540 genes, such as APCDD1, MYB, and TGFBI, were downregulated. Up to 83 GO terms were enriched by the DEGs, including BP terms regarding apoptosis, regulation of proliferation, and cell cycle arrest, MF terms regarding protein binding and transcription factor activity, and CC terms regarding mitochondrion and proteasome. There were 37 KEGG pathways significantly affected by ixazomib, such as pathway of apoptosis and pathway of cell cycle. In addition, 46 hub genes including TP53, JUN, and ITGA2 and three modules with important functions were mined from the PPI network. These results demonstrated that these altered genes, biological functions, and pathways may be important targets of ixazomib acting against CRC.
HSPA6, heat shock 70 kDa protein 6 (also known as HSP70B′), is a member of heat shock protein 70 (HSP70) family. Although the function of HSPA6 remains far more to be elucidated due to limited researches, a recent study has demonstrated that HSPA6 augmented garlic extract-induced inhibition of proliferation, migration, and invasion of bladder cancer cells.32 In that study, HSPA6 was the most highly upregulated gene in bladder cancer EJ cells after garlic extract treatment.32 Overexpression of HSPA6 has been verified to enhance the G2/M phase cell cycle arrest and the inhibition of matrix metallopeptidase 9 enzyme activity induced by garlic extract.32 In the present study, HSPA6 was the second most highly upregulated gene as a result of ixazomib treatment (log2FC =5.3542, adjusted P-value =1.42E-07), suggesting that HSPA6 may be a key target of ixazomib in preventing tumor proliferation and invasion.
APCDD1 was the most downregulated gene in response to ixazomib in SW620 cells (log2FC =−4.7126, adjusted P-value =1.69E−07). APCDD1 has been proposed to play an important role in the proliferation of cancer cells.33 Plasmid-mediated overexpression of APCDD1 has been shown to promote the growth of colon cancer cells, while reducing the expression of APCDD1 by transfecting with antisense S-oligodeoxynucleotides was declared to decrease tumor growth.33 In the study, APCDD1 was significantly reduced after ixazomib treatment, demonstrating a potential antiproliferation mechanism of ixazomib through downregulating the expression of APCDD1.
An important identified anti-CRC effect of ixazomib is the induction of apoptosis, reflecting in the enrichment of apoptotic GO terms such as positive regulation of apoptotic process (GO:0043065), intrinsic apoptotic signaling pathway (GO:0097193), and the activation of apoptosis KEGG pathway, which is the third significant KEGG pathway enriched by the DEGs.
Induction of apoptosis is an important mechanism of anticancer agents. There are two mainly independent apoptotic signaling cascades: the extrinsic and intrinsic pathways. The former is usually initiated by the binding of extracellular death receptor ligands, such as tumor necrosis factor (TNF), TNF-related apoptosis-inducing ligand (TRAIL), and Fas ligand (FasL) to their transmenbrane receptors, which results in the activation of caspase-8 and caspase-10. The latter, in contrast, is often triggered by internal sensors, such as DNA damage, metabolic stress, and the presence of unfolded proteins, which leads to the release of mitochondrial cytochrome c into the cytosol and the subsequent activation of caspase-9. Caspase-8, caspase-9, and caspase-10 are called initiator caspases. Once activated, they can spark the downstream executor caspases, such as caspase-3, caspase-6, and caspase-7 (CASP7), which cleave a series of substrates, leading to characteristic apoptotic signs including nuclear condensation and DNA fragmentation.34
In the present study, the important executor caspase, CASP7, was significantly upregulated in ixazomib-treated samples (log2FC =2.1502, adjusted P-value =3.05E-07). Meanwhile, apoptotic BPs such as intrinsic apoptotic signaling pathway (GO:0097193) and positive regulation of release of cytochrome c from mitochondria (GO:0090200) together with apoptosis-related CCs such as mitochondrion (GO:0005739) and mitochondrial matrix (GO:0005759) were enriched by DEGs, demonstrating that ixazomib may execute its anti-CRC effects by upregulating apoptotic proteins and inducing cytochrome c releasing from mitochondria into cytosol, which resulted in the apoptosis of SW620 cells eventually.
Another important anticancer mechanism of ixazomib is the perturbation of cell cycle progression, reflecting in GO cell cycle arrest terms (such as GO:0007050~cell cycle arrest and GO:0006977~DNA damage response, signal transduction by p53 class mediator resulting in cell cycle arrest) and the KEGG cell cycle pathway (hsa04110).
CDKN1A, also known as p21, was enriched in all the cell cycle-related GO terms and the KEGG cell cycle pathway in the study. The most known function of p21 is serving as a negative cell cycle regulator. It can block the cell cycle progression through binding to and inhibiting cell cycle promoters such as cyclin-dependent kinases (CDKs) and proliferating cell nuclear antigen (PCNA).35 Overexpression of p21 has been shown to induce G1 phase arrest and inhibit tumor growth in vitro and in vivo.36 It is also essential to sustain G2 arrest after DNA damage.37
In the study, p21 (CDKN1A) was significantly upregulated after ixazomib treatment (log2FC =2.7978, adjusted P-value =1.01E−05), together with cell cycle-related GO terms and cell cycle KEGG pathway, suggesting a possible anticancer mechanism of cell cycle arrest induction by ixazomib on CRC cells.
Tumor protein p53 (TP53), a hub gene with the highest degree in the PPI network (degree =84), was downregulated in response to ixazomib treatment (log2FC =−2.0571, adjusted P-value =1.96E-06). According to the International Agency for Research on Cancer (IARC) TP53 database (version R18, http://p53.iarc.fr/), SW620 is a cell line bearing mutant p53.38 Compared to wild-type p53, mutations in TP53 not only result in the loss of tumor suppressive functions but also lead to oncogenic properties, which is called gain oncogenic function (GOF) of the gene.39,40 The GOF of mutant p53 results in tumor progression and resistance to therapy.40 Therefore, targeting mutant p53 is an attractive strategy of cancer therapy. In the present study, the expression of TP53 was decreased, indicating that the oncogenic mutation p53 could be inhibited by ixazomib.
JUN (also known as c-Jun), is a hub gene with the third highest degree (63) in the PPI network. Despite the oncogenic role of JUN reported by some researches,41,42 recent studies have revealed the tumor suppressive function of the gene.43–45 It has been shown that the compound TRX-E-002-1 could induce c-Jun-dependent apoptosis in ovarian cancer stem cells through activating and enhancing the expression of c-Jun.43 Prolonged activation of c-Jun promotes apoptosis induced by α-tocopherol ether-linked acetic acid in human prostate cancer cells.44 Moreover, proteasome inhibitors, including bortezomib, carfilzomib, and ixazomib, were demonstrated to trigger multiple myeloma cell death via upregulation of c-Jun.45
Consistent with previous researches, c-Jun was significantly upregulated in ixazomib-treated samples in the study (log2FC =2.5028, adjusted P-value =2.05E-06). c-Jun was also involved in GO BPs such as response to drug (GO:0042493), release of cytochrome c from mitochondria (GO:0001836), and negative regulation of cell proliferation (GO:0008285). Combining these results, ixazomib was indicated to inhibit the proliferation and induce the apoptosis of SW620 cells through upregulating the expression of c-Jun.
ITGA2, a hub gene in Module 1, has a connectivity degree of 40, which is the fifth highest degree in the PPI network. Integrin α2, the protein encoded by ITGA2, is an important subunit of integrin α2β1, which is a receptor for collagens.46 Integrin α2β1 has been demonstrated to suppress metastasis of breast cancer.47 Loss of expression of integrin α2 subunit resulted in more advanced disease and reduced the survival of CRC patients.48 These researches suggested a tumor-suppressing function of ITGA2. At present, the expression of ITGA2 was increased in response to the treatment of ixazomib (log2FC =1.5901, adjusted P-value =1.48E-04), indicating a potential ITGA2-mediated anticancer effect enhanced by ixazomib.
Activating transcription factor 3 (ATF3), a member of the activation transcription factor/cAMP responsive element-binding family of transcription factors, is a hub gene in Module 2 with a degree of 24. ATF3 has significant effects on the cell cycle progression and apoptosis during carcinogenesis.49–52 It is reported to induce S phase arrest and apoptosis in diarylheptanoid-induced neuroblastoma cell death.53 It also acts as a proapoptotic protein in response to retigeric acid B-induced apoptosis in prostate cancer cells through activating downstream genes involved in cell cycle arrest and cell death, such as DDIT4, GADD45A, and CDC25A.54 Moreover, ATF3 plays a driving role in various drugs induced apoptosis in CRC.55–57 According to the microarray analysis, ATF3 was significantly upregulated as a result of ixazomib treatment (log2FC =2.0248, adjusted P-value =2.32E−05), indicating that ixazomib exerts an antitumor function by elevating the expression of ATF3, inducing cell cycle arrest, and apoptosis in CRC.
The functions of Module 3 were mainly related with ubiquitin-dependent protein catabolism and proteasome. The genes of PSMD1, PSMD2, PSMC4, and PSMD12 in Module 3 encode separate subunits of proteasome (gene database at The National Center for Biotechnology Information (NCBI), https://www.ncbi.nlm.nih.gov/gene). They all were found to be upregulated after ixazomib treatment (log2FC =1.5276, 2.2345, 2.0028, and 1.7703, respectively, and adjusted P-value =1.42E−05, 7.15E−07, 1.30E−06, and 7.24E−06, respectively). Since ixazomib potently inhibits the function of proteasome, upregulation of these genes were considered to be a compensate feedback of CRC cells trying to remedy the decreased performance of proteasome.
Conclusion
Our study provides a comprehensive microarray and bioinformatics analysis of the anticancer effects of ixazomib on CRC. Ixazomib was demonstrated to significantly inhibit the proliferation of SW620 cells in a dose-dependent and time-dependent manner. DEGs, such as HSPA6, APCDD1, and p21, hub genes, including TP53, JUN, and ITGA2, and pathways of apoptosis and cell cycle may be the therapeutic targets of ixazomib against CRC. Our results indicated the promising potential of ixazomib for CRC therapy, and further experimental studies are needed to confirm our findings.
Disclosure
The authors report no conflicts of interest in this work.
References
Ferlay J, Soerjomataram I, Dikshit R, et al. Cancer incidence and mortality worldwide: sources, methods and major patterns in GLOBOCAN 2012. Int J Cancer. 2015;136(5):E359–E386. | ||
Kassahun WT. Unresolved issues and controversies surrounding the management of colorectal cancer liver metastasis. World J Surg Oncol. 2015;13:61. | ||
Fatemi SR, Pourhoseingholi MA, Asadi F, et al. Recurrence and five-year survival in colorectal cancer patients after surgery. Iran J Cancer Prev. 2015;8(4):e3439. | ||
Marin JJ, Sanchez de Medina F, Castaño B, et al. Chemoprevention, chemotherapy, and chemoresistance in colorectal cancer. Drug Metab Rev. 2012;44(2):148–172. | ||
Hershko A, Ciechanover A. The ubiquitin system. Annu Rev Biochem. 1998;67:425–479. | ||
Pickart CM. Mechanisms underlying ubiquitination. Annu Rev Biochem. 2001;70:503–533. | ||
Goldberg AL. Protein degradation and protection against misfolded or damaged proteins. Nature. 2003;426(6968):895–899. | ||
Ciechanover A. Proteolysis: from the lysosome to ubiquitin and the proteasome. Nat Rev Mol Cell Biol. 2005;6(1):79–87. | ||
Orlowski RZ, Kuhn DJ. Proteasome inhibitors in cancer therapy: lessons from the first decade. Clin Cancer Res. 2008;14(6):1649–1657. | ||
Dalton WS. The proteasome. Semin Oncol. 2004;31(6 suppl 16):3–9. [discussion 33]. | ||
Delic J, Masdehors P, Omura S, et al. The proteasome inhibitor lactacystin induces apoptosis and sensitizes chemo- and radioresistant human chronic lymphocytic leukaemia lymphocytes to TNF-alpha-initiated apoptosis. Br J Cancer. 1998;77(7):1103–1107. | ||
Orlowski RZ, Eswara JR, Lafond-Walker A, Grever MR, Orlowski M, Dang CV. Tumor growth inhibition induced in a murine model of human Burkitt’s lymphoma by a proteasome inhibitor. Cancer Res. 1998;58(19):4342–4348. | ||
LeBlanc R, Catley LP, Hideshima T, et al. Proteasome inhibitor PS-341 inhibits human myeloma cell growth in vivo and prolongs survival in a murine model. Cancer Res. 2002;62(17):4996–5000. | ||
US Food and Drug Administration. FDA approves Ninlaro, new oral medication to treat multiple myeloma [press release]; 2015 [November 20]. Available from: www.fda.gov/NewsEvents/Newsroom/PressAnnouncements/ucm473771.htm. Accessed December 11, 2015. | ||
Shirley M. Ixazomib: first global approval. Drugs. 2016;76(3):405–411. | ||
Paulus A, Masood A, Miller KC, et al. The investigational agent MLN2238 induces apoptosis and is cytotoxic to CLL cells in vitro, as a single agent and in combination with other drugs. Br J Haematol. 2014;165(1):78–88. | ||
Wei X, Zhou P, Lin X, et al. MLN2238 synergizes BH3 mimetic ABT-263 in castration-resistant prostate cancer cells by induction of NOXA. Tumour Biol. 2014;35(10):10213–10221. | ||
Wang H, Yu Y, Jiang Z, et al. Next-generation proteasome inhibitor MLN9708 sensitizes breast cancer cells to doxorubicin-induced apoptosis. Sci Rep. 2016;6:26456. | ||
Li H, Chen Z, Hu T, et al. Novel proteasome inhibitor ixazomib sensitizes neuroblastoma cells to doxorubicin treatment. Sci Rep. 2016;6:34397. | ||
Gautier L, Cope L, Bolstad BM, Irizarry RA. affy – analysis of Affymetrix GeneChip data at the probe level. Bioinformatics. 2004;20(3):307–315. | ||
Irizarry RA, Hobbs B, Collin F, et al. Exploration, normalization, and summaries of high density oligonucleotide array probe level data. Biostatistics. 2003;4(2):249–264. | ||
Smyth GK. Limma: linear models for microarray data. In: Gentleman R, Carey VJ, Huber W, Irizarry RA, Dudoit S, editors. Bioinformatics and Computational Biology Solutions Using R and Bioconductor. New York, NY: Springer; 2005:397–420. | ||
Kolde R [webpage on the Internet]. Pheatmap: Pretty heatmaps. R package version 1.0.8: 2015. Available from: https://cran.r-project.org/web/packages/pheatmap/index.html. Accessed May 14, 2016. | ||
Ashburner M, Ball CA, Blake JA, et al. Gene ontology: tool for the unification of biology. The Gene Ontology Consortium. Nat Genet. 2000;25(1):25–29. | ||
Kanehisa M, Goto S. KEGG: kyoto encyclopedia of genes and genomes. Nucleic Acids Res. 2000;28(1):27–30. | ||
Dennis G Jr, Sherman BT, Hosack DA, et al. DAVID: database for annotation, visualization, and integrated discovery. Genome Biol. 2003;4(5):3. | ||
Wu J, Mao X, Cai T, Luo J, Wei L. KOBAS server: a web-based platform for automated annotation and pathway identification. Nucleic Acids Res. 2006;34(Web Server issue):W720–W724. | ||
Szklarczyk D, Franceschini A, Wyder S, et al. STRING v10: protein–protein interaction networks, integrated over the tree of life. Nucleic Acids Res. 2015;43(Database issue):D447–D452. | ||
Shannon P, Markiel A, Ozier O, et al. Cytoscape: a software environment for integrated models of biomolecular interaction networks. Genome Res. 2003;13(11):2498–2504. | ||
Scardoni G, Petterlini M, Laudanna C. Analyzing biological network parameters with CentiScaPe. Bioinformatics. 2009;25(21):2857–2859. | ||
Bader GD, Hogue CW. An automated method for finding molecular complexes in large protein interaction networks. BMC Bioinformatics. 2003;4:2. | ||
Shin SS, Song JH, Hwang B, et al. HSPA6 augments garlic extract-induced inhibition of proliferation, migration, and invasion of bladder cancer EJ cells; Implication for cell cycle dysregulation, signaling pathway alteration, and transcription factor-associated MMP-9 regulation. PLoS One. 2017;12(2):e0171860. | ||
Takahashi M, Fujita M, Furukawa Y, et al. Isolation of a novel human gene, APCDD1, as a direct target of the beta-Catenin/T-cell factor 4 complex with probable involvement in colorectal carcinogenesis. Cancer Res. 2002;62(20):5651–5656. | ||
Lamkanfi M, Kanneganti TD. Caspase-7: a protease involved in apoptosis and inflammation. Int J Biochem Cell Biol. 2010;42(1):21–24. | ||
Luo Y, Hurwitz J, Massagué J. Cell-cycle inhibition by independent CDK and PCNA binding domains in p21Cip1. Nature. 1995;375(6527):159–161. | ||
Gartel AL, Serfas MS, Tyner AL. p21 – negative regulator of the cell cycle. Proc Soc Exp Biol Med. 1996;213(2):138–149. | ||
Bunz F, Dutriaux A, Lengauer C, et al. Requirement for p53 and p21 to sustain G2 arrest after DNA damage. Science. 1998;282(5393):1497–1501. | ||
Bouaoun L, Sonkin D, Ardin M, et al. TP53 variations in human cancers: new lessons from the IARC TP53 database and genomics data. Hum Mutat. 2016;37(9):865–876. | ||
Muller PA, Vousden KH. p53 mutations in cancer. Nat Cell Biol. 2013;15(1):2–8. | ||
Oren M, Rotter V. Mutant p53 gain-of-function in cancer. Cold Spring Harb Perspect Biol. 2010;2(2):a001107. | ||
Vogt PK, Bos TJ. The oncogene jun and nuclear signalling. Trends Biochem Sci. 1989;14(5):172–175. | ||
Koutselini H, Malliri A, Papadakis E, Gillespie D, Spandidos D. C-jun oncogene expression in nonsmall cell lung-cancer. Oncol Rep. 1994;1(2):353–356. | ||
Alvero AB, Heaton A, Lima E, et al. TRX-E-002-1 induces c-Jun-dependent apoptosis in ovarian cancer stem cells and prevents recurrence in vivo. Mol Cancer Ther. 2016;15(6):1279–1290. | ||
Jia L, Yu W, Wang P, Li J, Sanders BG, Kline K. Critical roles for JNK, c-Jun, and Fas/FasL-signaling in vitamin E analog-induced apoptosis in human prostate cancer cells. Prostate. 2008;68(4):427–441. | ||
Fan F, Tonon G, Bashari MH, et al. Targeting Mcl-1 for multiple myeloma (MM) therapy: drug-induced generation of Mcl-1 fragment Mcl-1(128-350) triggers MM cell death via c-Jun upregulation. Cancer Lett. 2014;343(2):286–294. | ||
Rathinam R, Alahari SK. Important role of integrins in the cancer biology. Cancer Metastasis Rev. 2010;29(1):223–237. | ||
Ramirez NE, Zhang Z, Madamanchi A, et al. The α2β1 integrin is a metastasis suppressor in mouse models and human cancer. J Clin Invest. 2011;121(1):226–237. | ||
Lindmark G, Gerdin B, Påhlman L, Glimelius B, Gehlsen K, Rubin K. Interconnection of integrins alpha 2 and alpha 3 and structure of the basal membrane in colorectal cancer: relation to survival. Eur J Surg Oncol. 1993;19(1):50–60. | ||
Cho RJ, Huang M, Campbell MJ, et al. Transcriptional regulation and function during the human cell cycle. Nat Genet. 2001;27(1):48–54. | ||
Fan F, Jin S, Amundson SA, et al. ATF3 induction following DNA damage is regulated by distinct signaling pathways and over-expression of ATF3 protein suppresses cells growth. Oncogene. 2002;21(49):7488–7496. | ||
Hai T, Hartman MG. The molecular biology and nomenclature of the activating transcription factor/cAMP responsive element binding family of transcription factors: activating transcription factor proteins and homeostasis. Gene. 2001;273(1):1–11. | ||
Liang G, Wolfgang CD, Chen BP, Chen TH, Hai T. ATF3 gene. Genomic organization, promoter, and regulation. J Biol Chem. 1996;271(3):1695–1701. | ||
Tian Z, An N, Zhou B, Xiao P, Kohane IS, Wu E. Cytotoxic diarylheptanoid induces cell cycle arrest and apoptosis via increasing ATF3 and stabilizing p53 in SH-SY5Y cells. Cancer Chemother Pharmacol. 2009;63(6):1131–1139. | ||
Liu Y, Gao F, Jiang H, et al. Induction of DNA damage and ATF3 by retigeric acid B, a novel topoisomerase II inhibitor, promotes apoptosis in prostate cancer cells. Cancer Lett. 2013;337(1):66–76. | ||
Lee SH, Min KW, Zhang X, Baek SJ. 3,3′-diindolylmethane induces activating transcription factor 3 (ATF3) via ATF4 in human colorectal cancer cells. J Nutr Biochem. 2013;24(4):664–671. | ||
Song HM, Park GH, Eo HJ, Jeong JB. Naringenin-mediated ATF3 expression contributes to apoptosis in human colon cancer. Biomol Ther (Seoul). 2016;24(2):140–146. | ||
Tang W, Su G, Li J, et al. Enhanced anti-colorectal cancer effects of carfilzomib combined with CPT-11 via downregulation of nuclear factor-κB in vitro and in vivo. Int J Oncol. 2014;45(3):995–1010. |
Supplementary materials
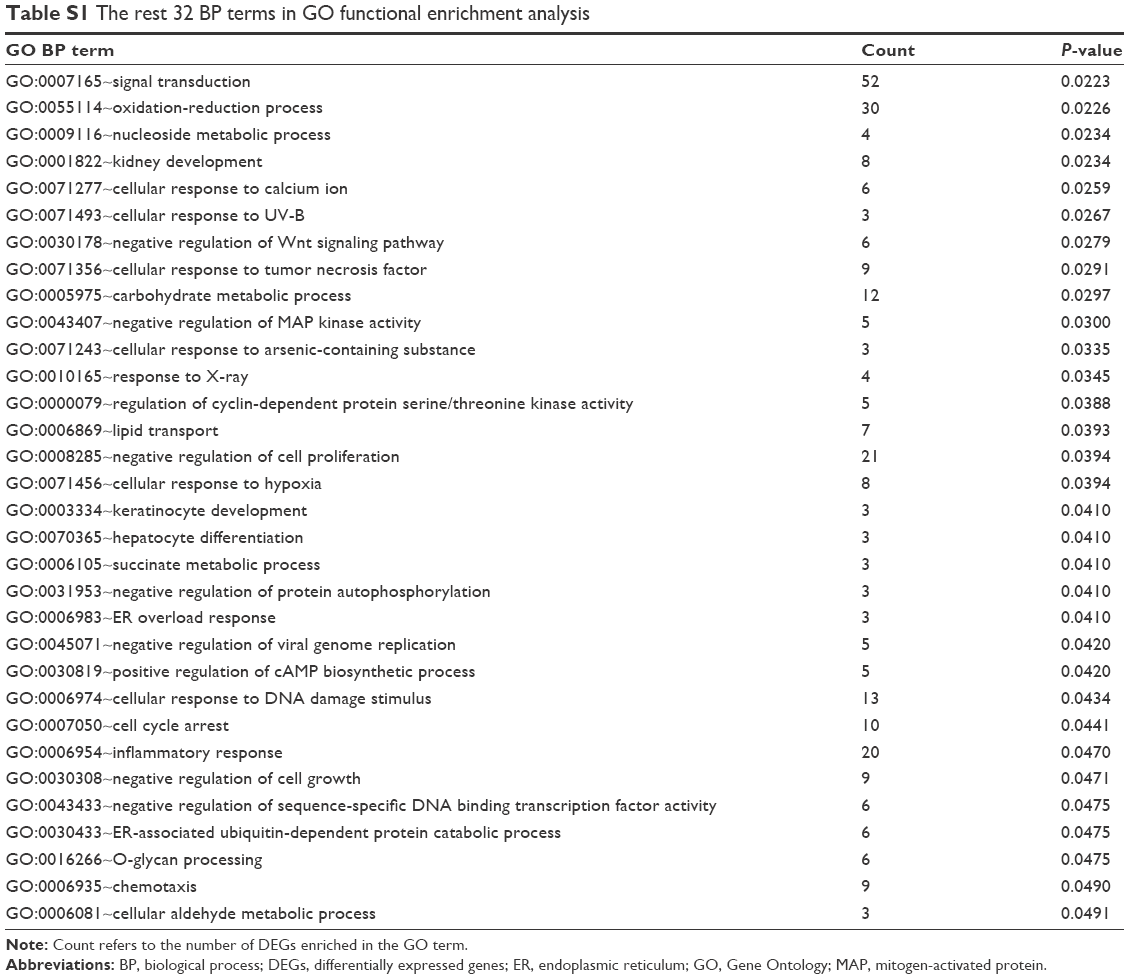 | Table S1 The rest 32 BP terms in GO functional enrichment analysis |
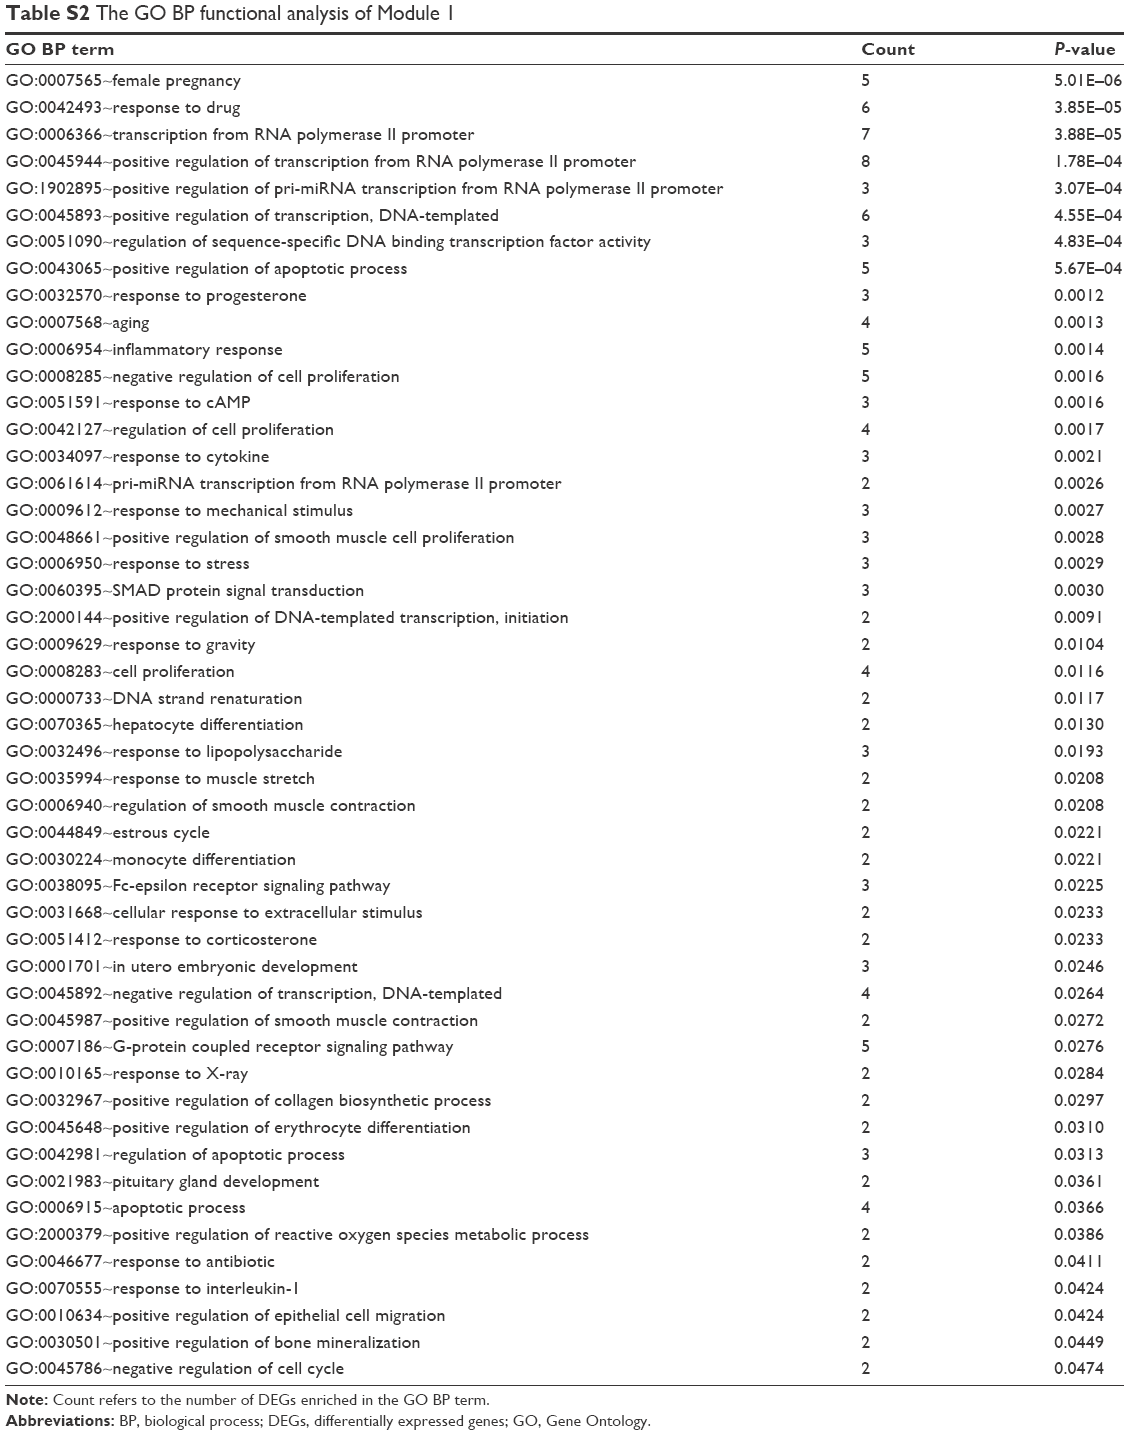 | Table S2 The GO BP functional analysis of Module 1 |
 | Table S3 The GO BP functional analysis of Module 2 |
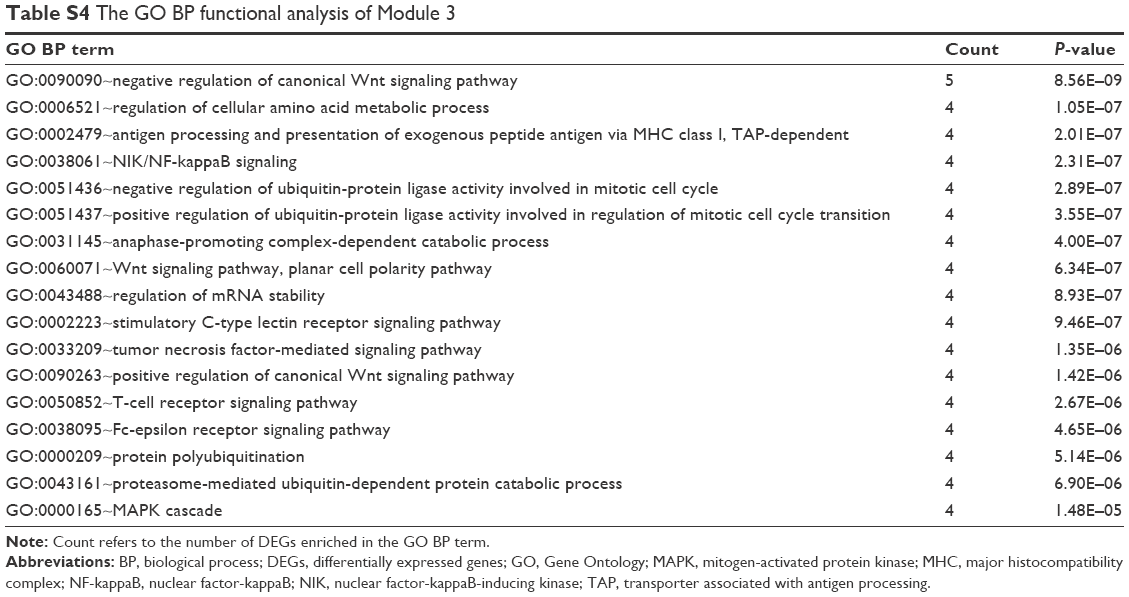 | Table S4 The GO BP functional analysis of Module 3 |
 © 2017 The Author(s). This work is published and licensed by Dove Medical Press Limited. The
full terms of this license are available at https://www.dovepress.com/terms
and incorporate the Creative Commons Attribution
- Non Commercial (unported, 3.0) License.
By accessing the work you hereby accept the Terms. Non-commercial uses of the work are permitted
without any further permission from Dove Medical Press Limited, provided the work is properly
attributed. For permission for commercial use of this work, please see paragraphs 4.2 and 5 of our Terms.
© 2017 The Author(s). This work is published and licensed by Dove Medical Press Limited. The
full terms of this license are available at https://www.dovepress.com/terms
and incorporate the Creative Commons Attribution
- Non Commercial (unported, 3.0) License.
By accessing the work you hereby accept the Terms. Non-commercial uses of the work are permitted
without any further permission from Dove Medical Press Limited, provided the work is properly
attributed. For permission for commercial use of this work, please see paragraphs 4.2 and 5 of our Terms.