Back to Journals » International Journal of Chronic Obstructive Pulmonary Disease » Volume 12
Identification of subtypes in subjects with mild-to-moderate airflow limitation and its clinical and socioeconomic implications
Authors Lee JH ![]() , Rhee CK, Kim K
, Rhee CK, Kim K ![]() , Kim J, Kim SH, Yoo K
, Kim J, Kim SH, Yoo K ![]() , Kim WJ
, Kim WJ ![]() , Park YB
, Park YB ![]() , Park HY, Jung KS
, Park HY, Jung KS
Received 13 December 2016
Accepted for publication 20 February 2017
Published 12 April 2017 Volume 2017:12 Pages 1135—1144
DOI https://doi.org/10.2147/COPD.S130140
Checked for plagiarism Yes
Review by Single anonymous peer review
Peer reviewer comments 2
Editor who approved publication: Prof. Dr. Richard Russell
Jin Hwa Lee,1 Chin Kook Rhee,2 Kyungjoo Kim,2 Jee-Ae Kim,3 Sang Hyun Kim,4 Kwang Ha Yoo,5 Woo Jin Kim,6 Yong Bum Park,7 Hye Yun Park,8 Ki-Suck Jung9
1Division of Pulmonary and Critical Care Medicine, Department of Medicine, School of Medicine, EwhaWomans University, 2Department of Internal Medicine, Seoul St Mary’s Hospital, The Catholic University of Korea, Seoul, 3Pharmaceutical Policy Evaluation Research Team, Research Institution, Health Insurance Review and Assessment Service, 4Big Data Division, Health Insurance Review and Assessment Service, Wonju, 5Department of Internal Medicine, Konkuk University College of Medicine, Seoul, 6Department of Internal Medicine and Environmental Health Center, Kangwon National University Hospital, Chuncheon, 7Division of Pulmonary, Allergy, and Critical Care Medicine, Department of Internal Medicine, Hallym University Kangdong Sacred Heart Hospital, 8Division of Pulmonary and Critical Care Medicine, Department of Medicine, Samsung Medical Center, Sungkyunkwan University School of Medicine, Seoul, 9Division of Pulmonary, Allergy and Critical Care Medicine, Department of Internal Medicine, Hallym University Medical Center, Hallym University College of Medicine, Anyang, South Korea
Purpose: The purpose of this study was to identify subtypes in patients with mild-to-moderate airflow limitation and to appreciate their clinical and socioeconomic implications.
Methods: Subjects who were aged ≥20 years and had forced expiratory volume in 1 second (FEV1) ≥60% predicted and FEV1/forced vital capacity <0.7 were selected from the fourth Korea National Health and Nutrition Examination Survey (KNHANES) in 2007–2012. The data were merged to the National Health Insurance reimbursement database during the same period. k-Means clustering was performed to explore subtypes. For clustering analysis, six key input variables – age, body mass index (BMI), FEV1% predicted, the presence or absence of self-reported wheezing, smoking status, and pack-years of smoking – were selected.
Results: Among a total of 2,140 subjects, five groups were identified through k-means clustering, namely putative “near-normal (n=232),” “asthmatic (n=392),” “chronic obstructive pulmonary disease (COPD) (n=37),” “asthmatic-overlap (n=893),” and “COPD-overlap (n=586)” subtypes. Near-normal group showed the oldest mean age (72±7 years) and highest FEV1 (102%±8% predicted), and asthmatic group was the youngest (46±9 years). COPD and COPD-overlap groups were male predominant and all current or ex-smokers. While asthmatic group had the lowest prescription rate despite the highest proportion of self-reported wheezing, COPD, asthmatic-overlap, and COPD-overlap groups showed high prescription rate of respiratory medicine. Although COPD group formed only 1.7% of total subjects, they showed the highest mean medical cost and health care utilization, comprising 5.3% of the total medical cost. When calculating a ratio of total medical expense to household income, the mean ratio was highest in the COPD group.
Conclusion: Clinical and epidemiological heterogeneities of subjects with mild-to-moderate airflow limitation and a different level of health care utilization by each subtype are shown. Identification of a subtype with high health care demand could be a priority for effective utilization of limited resources.
Keywords: phenotype, COPD, asthma, overlap, health care utilization, cluster
Introduction
The prevalence and mortality of chronic obstructive pulmonary disease (COPD) are increasing when compared to those of the other chronic diseases.1 It is a major burden of current and future society. Meanwhile, it is well known that early detection and management are essential to prevent morbidity and mortality of chronic diseases,2,3 though adults with early hypertension or early diabetes mellitus do not have any symptoms. Nevertheless, early diagnosis of COPD by spirometry in asymptomatic subjects is not recommended in many COPD guidelines, including the Global initiative for chronic Obstructive Lung Disease (GOLD),4 because of negative cost-effectiveness studies.5–8 On the other hand, forced expiratory volume in 1 second (FEV1) has been the only biomarker of COPD, though it does not perfectly correlate with several outcomes such as exercise tolerance, health-related quality of life (QOL), and mortality.9 There have been many attempts to find a novel biomarker of COPD10,11 and/or to make a combination set, such as the body mass index (BMI) (B), the degree of airflow obstruction (O) and dyspnea (D), and exercise capacity (E) (BODE) index.12 However, any specific COPD biomarkers except FEV1 are not widely used. Unfortunately, preserved FEV1 does not guarantee comfortable respiration because some patients with mild COPD experience quite severe exacerbation.13 Even smokers without spirometry impairments showed worse QOL and lower exercise capacity compared to never smokers.14 Several studies describe substantial socioeconomic burden of patients with even mild COPD.15,16 When limited health care resources impede detection and management of early COPD, identification of subgroups with relatively high socioeconomic burden provides a useful and sensible guide to allocation of health care resources. In order to identify a subtype with high demand of health care utilization, a cluster analysis was performed by using the national database, by linking the fourth Korea National Health and Nutrition Examination Survey (KNHANES) in 2007–2012 with the National Health Insurance (NHI) reimbursement database in the same period. For clustering analysis, six major input variables, which were age, smoking status, smoking pack-years, FEV1% predicted, BMI, and the presence or absence of reported wheezing, were selected. These last three variables are likely to represent the degree of airflow obstruction, degree of systemic inflammation, and presence or absence of airway hyper-responsiveness, respectively.12,17–21
Materials and methods
Data and study population selection
This study utilized two data sources of KNHANES and NHI claims.
KNHANES is a national survey with stratified, multistage, and clustered probability design to ensure a representative sample of non-institutionalized citizens from the Korean population. The data collected from the survey assist the establishment of a national health policy and a knowledge base for the evaluation of health risk factors and health indicators.22 Details on the research methodology used to gather and analyze the KNHANES data can be found on KNHANES website (https://knhanes.cdc.go.kr/knhanes/eng/index.do [last accessed on December 25, 2016]).
The NHI claims data were provided by the Korean Health Insurance Review and Assessment Service (HIRA), which was established to review claims submitted by health care providers and assess health care in Korea; it is a single agency independent from insurers, providers, and other interested parties. All Koreans are covered under the NHI system, and the HIRA database contains records of health care service utilization such as physicians’ office visits, emergency room (ER) visits, hospitalization, and prescriptions and payments for both payers and patients.
A total of 43,864 respondents participated in the KNHANES from 2007 through 2012. A total of 20,970 subjects who were aged >19 years and had performed acceptable spirometry were extracted. From the data, 2,172 subjects who had mild-to-moderate airflow limitation, which was defined as having FEV1≥60% predicted23 and a ratio of FEV1 to forced vital capacity (FVC) <0.7, were identified. For clustering analysis, six key input variables were selected: age, BMI, FEV1% predicted, the presence or absence of self-reported wheezing, smoking status, and pack-years of smoking. The presence or absence of self-reported wheezing was determined by the response to the question: “Have you had wheezing or whistling in your chest at any time during the previous year?” Subjects with any missing value of six key input variables (Figure 1) were excluded. K-means clustering was performed to explore subtypes. The data were merged to the NHI reimbursement database for the same period.
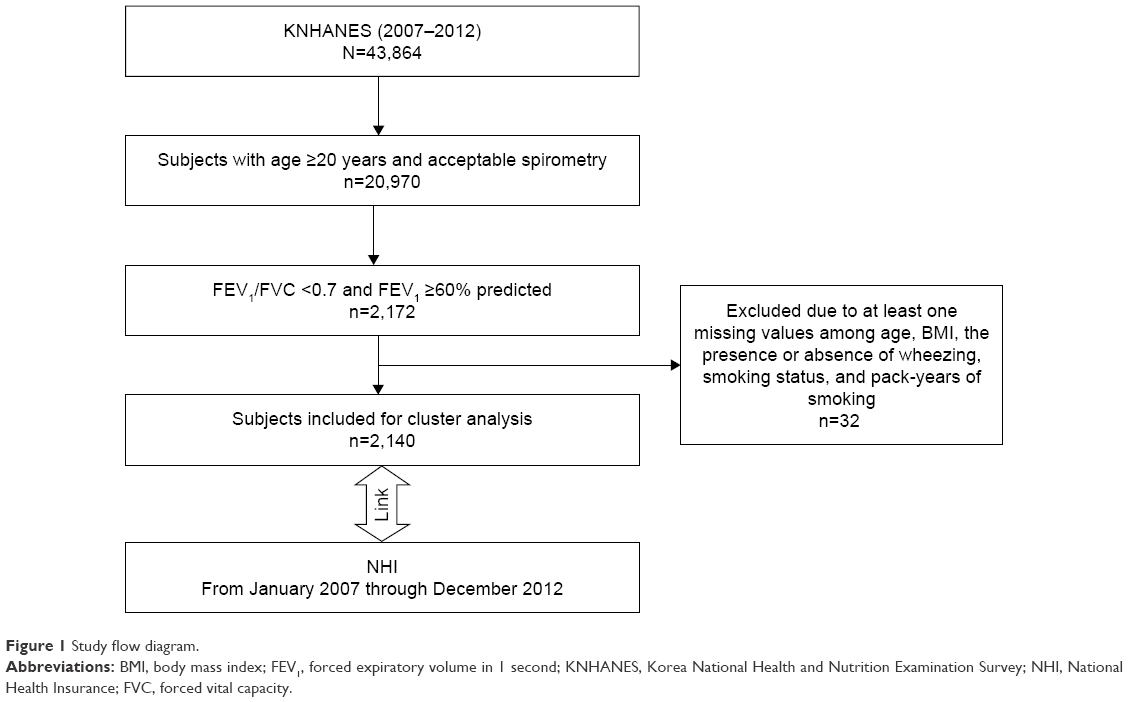 | Figure 1 Study flow diagram. |
Age, sex, BMI, spirometry, smoking status, education, and household income level were included. Lower limit of normal (LLN) for FEV1/FVC was calculated by using the following prediction equations: 125.77628−0.36304× age (years) −0.17146× height (cm) for Korean male and 97.36197−0.26015× age (years) −0.01861× height (cm) for Korean female.24 Subjects’ smoking status was divided into current, former, and never smokers. Current smokers are those who have smoked >100 cigarettes in their lifetime and have smoked within the last month. Former smokers are those who have smoked >100 cigarettes in their lifetime but have not smoked in the past month. Never smokers are people who have smoked <100 cigarettes in their lifetime and do not currently smoke.25 Subjects’ education level was categorized into four groups, which were ≥6 and <9 years, ≥9 and <12 years, ≥12 and <16 years, and ≥16 years of education. Household income level was divided into four groups based on the average total household income: first quartile, second quartile, third quartile, and the fourth quartile; the first quartile means the lowest income group. The EuroQoL five dimensions questionnaire (EQ-5D) index values, which range between 0 (worst imaginable health state) and 1 (best imaginable health state), were obtained.26
Variables on COPD-related health care utilization were extracted from the NHI claims database, which included medical cost, duration of health care use, hospitalization, performed spirometry and radiologic tests, prescribed respiratory medications, and comorbidities. The medical cost was calculated as medical expenses (including insurance benefits and patients’ copayments), including outpatient and inpatient fees. The duration of health care use was defined as the length of hospital stay (including admission to an intensive care unit and ER visits) and the number of outpatient visits.
The National Evidence-based Healthcare Collaborating Agency Ethics Committee of Korea approved this study. The requirement for informed consent from the patients was waived due to the retrospective nature of our study by the ethics committee.
Statistical analyses
For analyses, frequencies, percentages, and mean ± standard deviation (SD) were calculated to compare variables among groups. Statistical significance was tested by using the chi-squared test for categorical (discrete) variables and analysis of variance for continuous variables. The SAS program (ver 9.2 [SAS Institute]) for statistical analyses was used.
Results
Among a total of 2,140 subjects, five groups through k-means clustering – putative “near-normal (n=232),” “asthma (n=392),” “COPD (n=37),” “asthmatic-overlap (n=893),” and “COPD-overlap (n=586)” subtypes – were identified. Asthmatic-overlap means asthma-predominant overlap and COPD-overlap means COPD-predominant overlap. Near-normal group showed the oldest mean age (72±7 years) and highest FEV1 (102%±8% predicted), and asthmatic group was the youngest (46±9 years). Self-reported wheezing was more prevalent in asthma, asthmatic-overlap, and COPD-overlap groups than in COPD and near-normal groups. COPD and COPD-overlap groups were male predominant (100% and 98%, respectively) and all were current or former smokers. Mean pack-years of smoking was higher in COPD (102.9±14.7 pack-years) and COPD-overlap groups (45.3±12.2 pack-years) than those in the other three groups (<10 pack-years) (Figure 2, Table 1).
 | Figure 2 Distribution of five clusters according to mean FEV1% predicted and amount of smoking. |
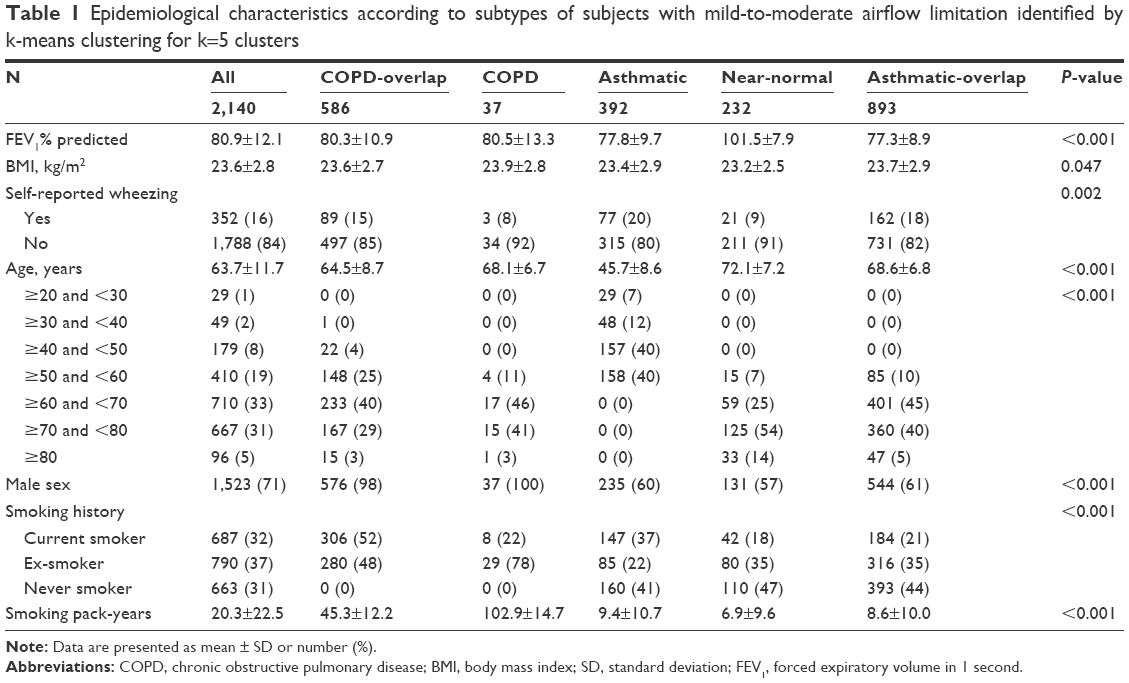 | Table 1 Epidemiological characteristics according to subtypes of subjects with mild-to-moderate airflow limitation identified by k-means clustering for k=5 clusters |
When applying the LLN FEV1/FVC as a criterion for airway obstruction, the asthmatic group showed the highest prevalence of airway obstruction (92%), whereas the lowest prevalence (25%) appeared in the near-normal group. In the near-normal group, all subjects had FEV1 ≥80% predicted. History of physician-diagnosed asthma was more common in asthma and asthmatic-overlap groups. Subjects with the longest education duration and those with the highest household income comprise the largest portion of the asthmatic group (Table 2).
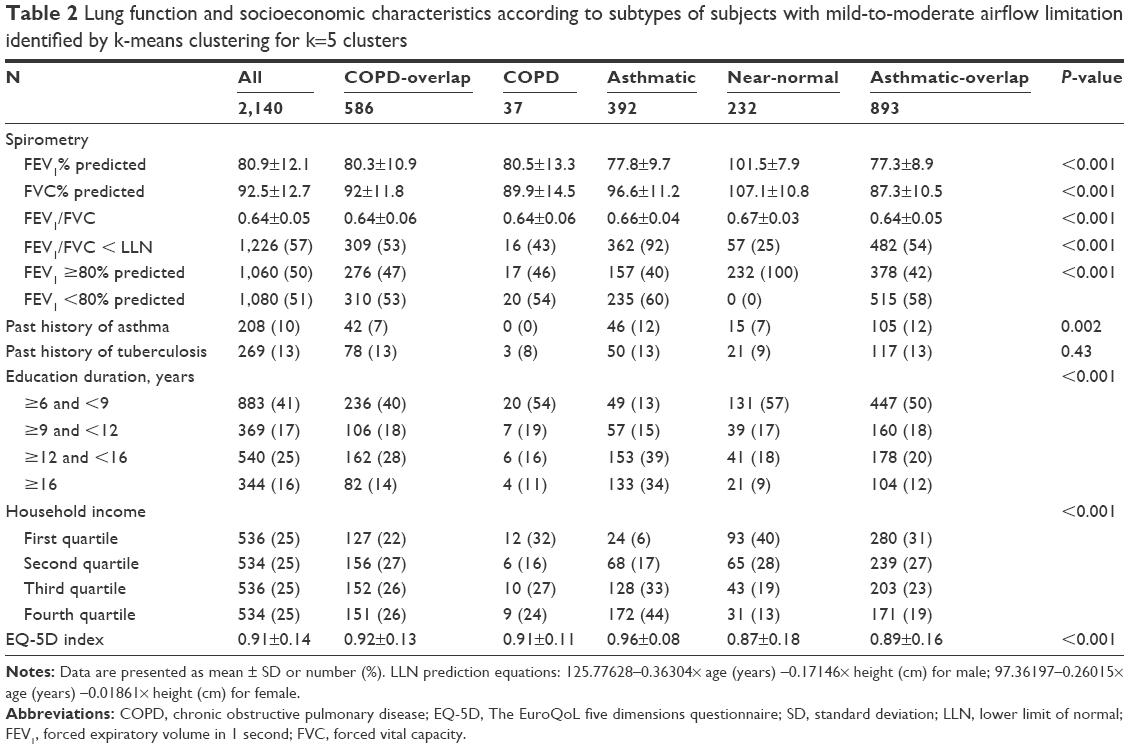 | Table 2 Lung function and socioeconomic characteristics according to subtypes of subjects with mild-to-moderate airflow limitation identified by k-means clustering for k=5 clusters |
While the asthmatic group (7.1%) had the lowest prescription rate despite the highest proportion of self-reported wheezing, the COPD (24.3%), asthmatic-overlap (21.6%), and COPD-overlap groups (17.1%) showed a high prescription rate of respiratory medicine. The most frequently prescribed drug was theophylline followed by oral beta 2 agonist (Table 3, Figure 3A). Among inhaled medications, short-acting beta 2 agonist (SABA) was the most commonly given, whereas long-acting muscarinic antagonist (LAMA) was the most frequently prescribed in the COPD group. Combinations of inhaled corticosteroids (ICSs) and long-acting beta 2 agonists (LABAs) were the most frequently prescribed inhalers in both the asthma and asthmatic-overlap groups (Table 3, Figure 3B).
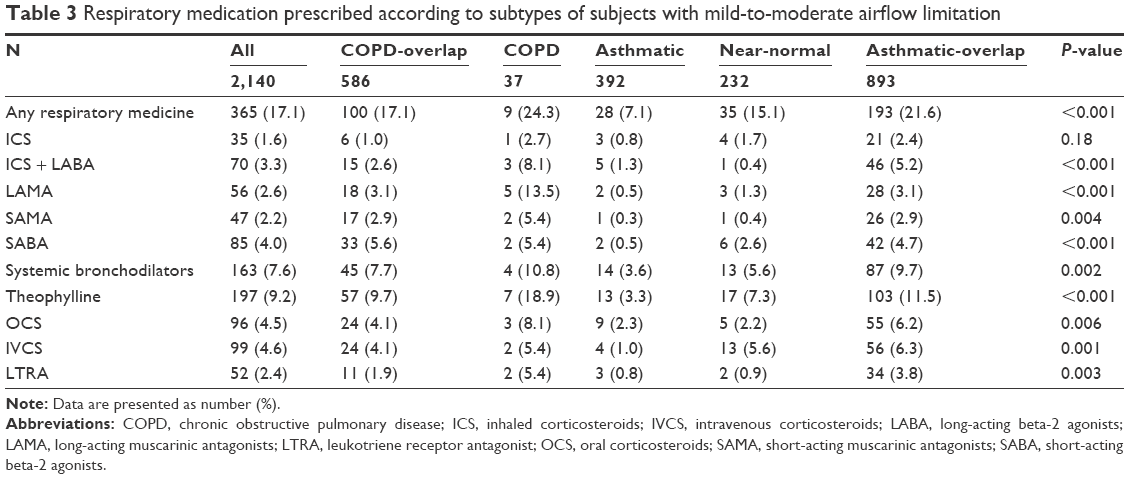 | Table 3 Respiratory medication prescribed according to subtypes of subjects with mild-to-moderate airflow limitation |
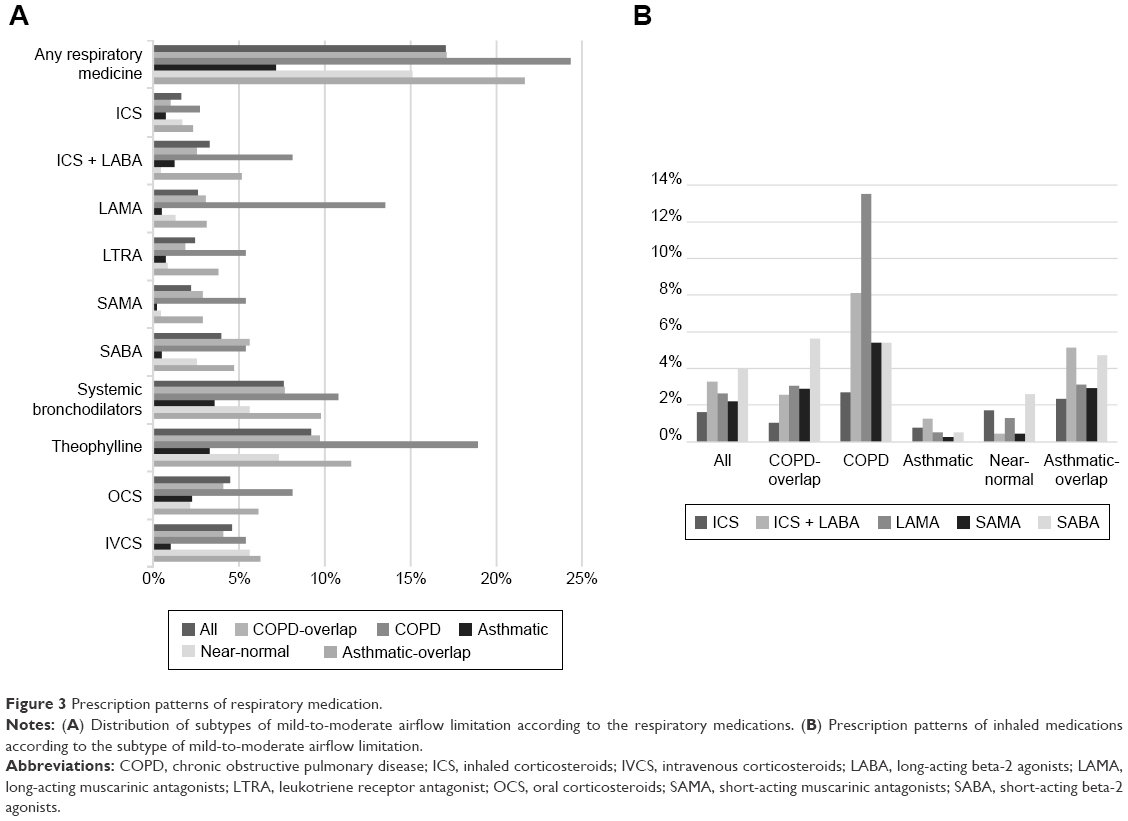 | Figure 3 Prescription patterns of respiratory medication. |
Except the asthmatic group, the other four groups showed a high prevalence of comorbidities such as hypertension, diabetes mellitus, hyperlipidemia, and coronary artery disease. Within the asthmatic group, metabolic syndrome and hyperlipidemia were the most common comorbidities (Table 4).
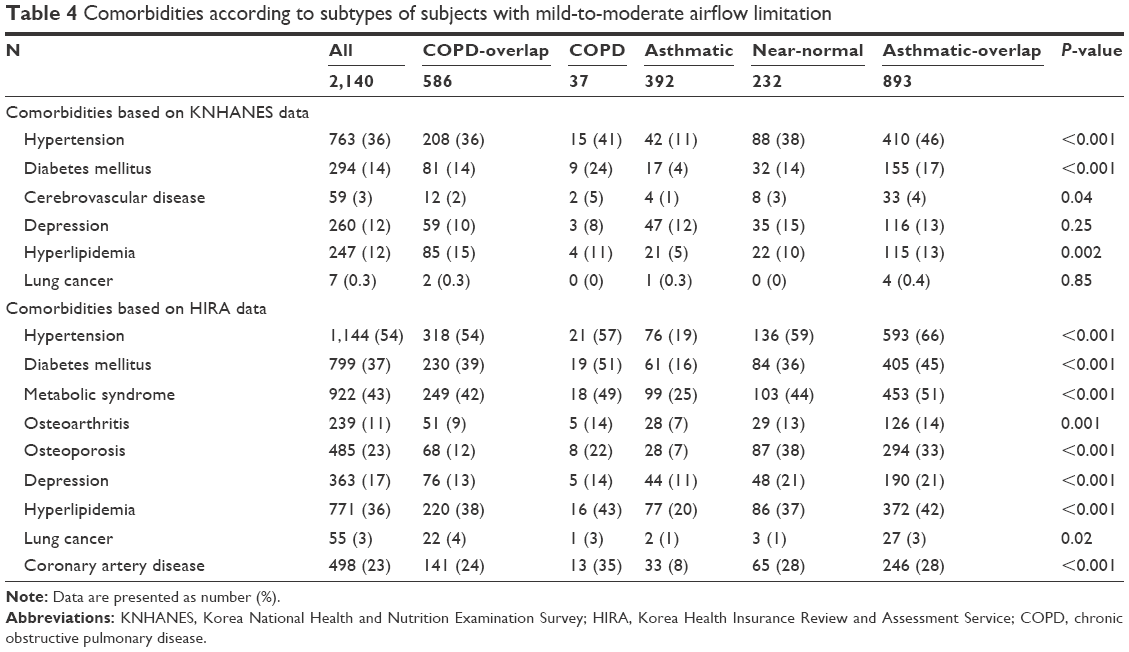 | Table 4 Comorbidities according to subtypes of subjects with mild-to-moderate airflow limitation |
COPD group showed the highest hospitalization rate (16%) and spirometry test (16%) (Table 5). The highest mean in-patient medical cost and the longest total health care used days were observed in the COPD group. Although the COPD group formed only 1.7% of total subjects, their medical cost comprised 5.3% of the total medical cost (Table 6, Figure 4). When calculating a ratio of total medical expense to household income in order to compare the economic burden of medical cost among the five groups, the mean ratio was the highest in the COPD group (Table 6, Figure 5).
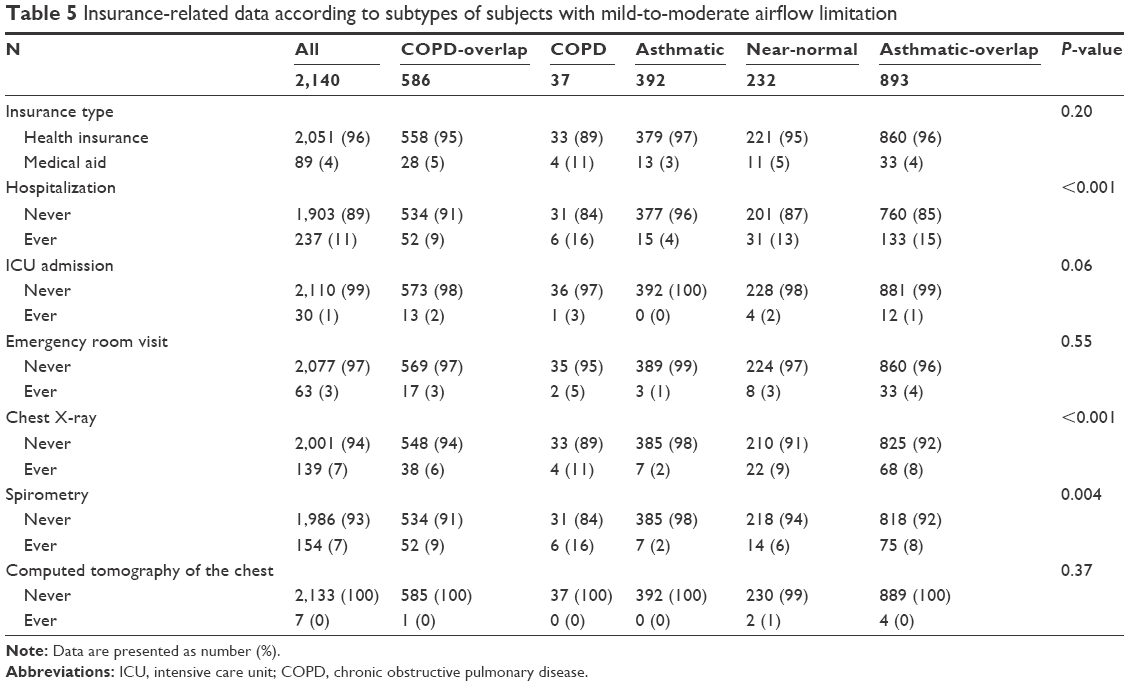 | Table 5 Insurance-related data according to subtypes of subjects with mild-to-moderate airflow limitation |
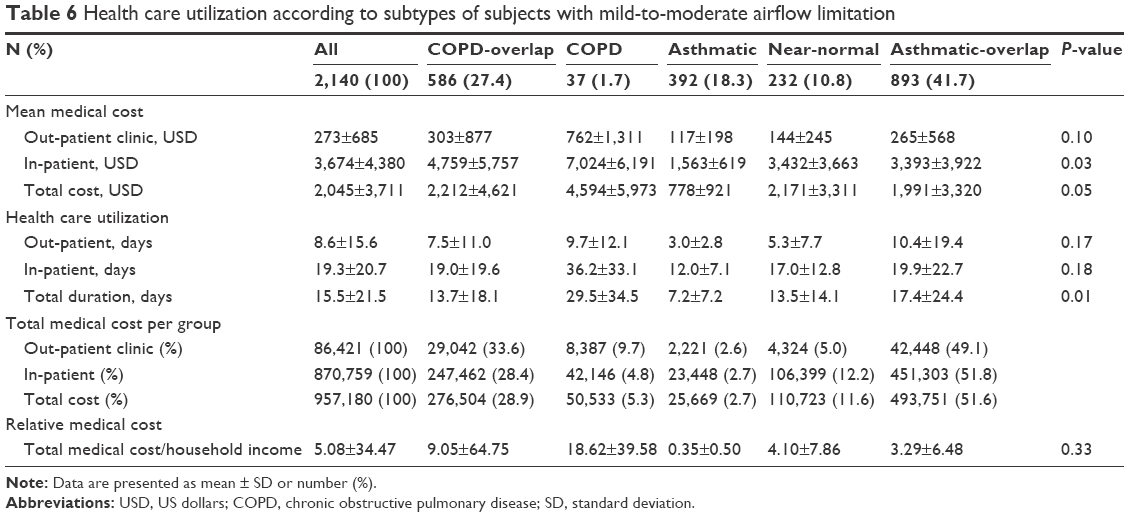 | Table 6 Health care utilization according to subtypes of subjects with mild-to-moderate airflow limitation |
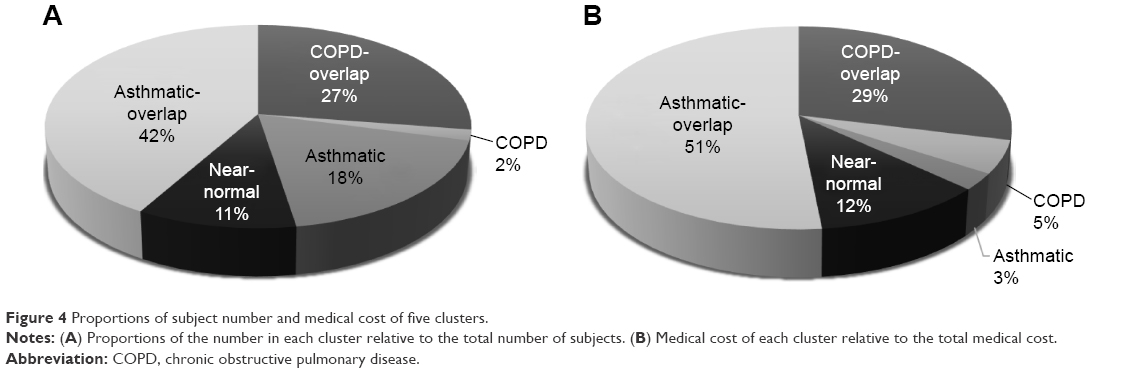 | Figure 4 Proportions of subject number and medical cost of five clusters. |
 | Figure 5 The mean ratio of medical expense to household income according to subtypes of subjects with mild-to-moderate airflow limitation. |
Discussion
This study indicates that clinical and socioeconomic heterogeneity exists among subjects with mild-to-moderate airflow limitation. To identify subtypes with substantial heterogeneity, six key variables that included FEV1% predicted, BMI, the presence or absence of self-reported wheezing, age, smoking status, and pack-years of cigarette smoking, based on previous clinical studies, were chosen.12,17–21,27,28 FEV1% predicted represents severity of airflow limitation. BMI is known to be a predictor of COPD prognosis and a marker of systemic inflammation and may correlate with severity of emphysema.12,17–19 Wheezing might reflect airway hyper-responsiveness,20,21 even though it is quite subjective. Aging and smoking are the most important risk factors of airway disease.27,28
K-means clustering identifies five distinct groups. A cluster called “COPD” exhibited the highest mean medical cost and health care utilization. Particularly, when considering the household income, the medical cost was much higher than those in the other groups. It was 3.7 times higher than the overall mean of total subjects with mild-to-moderate airflow limitation and 53 times higher than that of the asthmatic group. The COPD cluster comprised all men who were over the age of 50 and all current and ex-smokers, and included a large proportion with lower levels of education and lower economic status. They had the highest rate of hospitalization and prescription implying frequent health care utilization. On the contrary, those in the asthmatic cluster were all aged <60 years. There were 40% of women and 41% of never smokers. Despite the highest proportion of self-reported wheezing and airway obstruction on the basis of the LLN, the highest EQ-5D index and the lowest health resource utilization and prescription rates were found in the asthmatic group. One third of the asthmatic group reported that they had an education level and 77% belonged to the top half of economic classes, suggesting relatively high socioeconomic status. There were two kinds of overlap clusters, asthma-predominant overlap and COPD-predominant overlap. The main differences between the two overlap clusters were the presence or absence of never-smokers, sex distribution, and the most frequently prescribed inhalers. While ICS/LABA was the most frequently prescribed inhaler in asthmatic-overlap group, LAMA was the most common in COPD-overlap. The mean medical cost was higher in the COPD-overlap group compared to the asthmatic-overlap group, whereas the mean duration of health care utilization was longer in asthmatic-overlap group, which might be related to more women being in the asthmatic-overlap group. Medical economic burden relative to household income was the second highest in the COPD-overlap group. While the COPD-overlap group may be close to COPD with airway hyper-responsiveness, the asthmatic-overlap group might be similar to severe asthma with airway remodeling.
This study has several limitations. The fixed ratio (FEV1/FVC <0.7) was used as a criteria of airway obstruction, which is likely to lead to an underdiagnosis of airway obstruction for younger people or an overdiagnosis of airway obstruction for older people.29 It was derived from population-based databases and subjects were not recruited as part of a study of airway disease. Therefore, the key variables for cluster analysis might not be enough to reflect the diverse aspects of airway disease. Nevertheless, our five clusters were very similar to clinical phenotypes in terms of distinct prescription patterns as well as distributions of age, sex, and smoking history. From a different prospective, population-based data were one of the strengths of the study. Since subjects with mild-to-moderate airflow limitation are frequently asymptomatic,30,31 it is sometimes hard to recruit them for research purposes. Nationwide randomization sampling and health care utilization data allowed us to conduct research on this population. Moreover, information about education status and household income as well as smoking history, lung function, BMI, wheezing, history of asthma and tuberculosis, and QOL was available in this study, which were not possible to collect when using only claim data. The other limitations were that our FEV1/FVC was not a post-bronchodilator value and self-reported wheezing was used as an indicator of airway hyper-responsiveness, though these have been largely accepted in previous population-based studies.21,32
It was found that clinical heterogeneity exists even in subjects with mild airflow limitation, which may lead to a different level of health care utilization. In particular one group was the main consumer of medical resources. Since health care resources are limited, finding a group that needs lots of medical resources and managing it intensively can be an effective way to utilize all medical resources.
Conclusion
This study suggests that even mild airflow limitation could lead to high socioeconomic burden. Defining a high-risk group such as our COPD group and targeting this group through early intervention will provide a key to ultimately reduce medical cost.
Acknowledgments
This research was supported by the Research Program funded by the Korea Centers for Disease Control and Prevention (2014-E33003-00) and Basic Science Research Program through the National Research Foundation of Korea (NRF) funded by the Ministry of Science, ICT & Future Planning (2010-0027945). HIRA provided the NHI claim database and merged them with data from the Korean National Health and Nutritional Examination Survey (KNHANES). The abstract of this article was presented at the XXIV World Allergy Congress (WAC), the 21st Congress of Asian Pacific Society of Respirology (APSR), the Chest 2016 Annual Meeting, as a poster presentation with interim findings. The poster’s abstract was published in “Poster Abstracts” in Respirology: http://onlinelibrary.wiley.com/doi/10.1111/resp.12706_4/full, and Chest: http://journal.publications.chestnet.org/article.aspx?articleID=2568574.
Author contributions
Jin Hwa Lee is the guarantor of the accuracy and completeness of the contents of this manuscript, including the data and analysis. Chin Kook Rhee and Kwang Ha Yoo contributed to data acquisition. Jee-Ae Kim and Sang Hyun Kim contributed to data linkage and refinement. Kyungjoo Kim analyzed the data and performed the statistical analysis. All authors critically evaluated the data, revised manuscript, and approved the final version.
Disclosure
The authors report no conflicts of interest in this work.
References
Adeloye D, Chua S, Lee C, et al. Global and regional estimates of COPD prevalence: Systematic review and meta-analysis. J Glob Health. 2015;5(2):020415. | ||
James PA, Oparil S, Carter BL, et al. 2014 evidence-based guideline for the management of high blood pressure in adults: report from the panel members appointed to the Eighth Joint National Committee (JNC 8). JAMA. 2014;311(5):507–520. | ||
American Diabetes A. 4. Prevention or delay of type 2 diabetes. Diabetes Care. 2016;39(Suppl 1):S36–S38. | ||
Global Initiative for Chronic Obstructive Lung Disease. Global Strategy for the Diagnosis, Management and Prevention of COPD; 2017. Available from: http://goldcopd.org/gold-2017-global-strategy-diagnosis-management-prevention-copd/. Accessed January 20, 2017. | ||
Krahn M, Chapman KR. Economic issues in the use of office spirometry for lung health assessment. Can Respir J. 2003;10(6):320–326. | ||
Qaseem A, Wilt TJ, Weinberger SE, et al. Diagnosis and management of stable chronic obstructive pulmonary disease: a clinical practice guideline update from the American College of Physicians, American College of Chest Physicians, American Thoracic Society, and European Respiratory Society. Ann Intern Med. 2011;155(3):179–191. | ||
Force USPST, Siu AL, Bibbins-Domingo K, et al. Screening for chronic obstructive pulmonary disease: US Preventive Services Task Force Recommendation Statement. JAMA. 2016;315(13):1372–1377. | ||
Guirguis-Blake JM, Senger CA, Webber EM, Mularski RA, Whitlock EP. Screening for chronic obstructive pulmonary disease: evidence report and systematic review for the US Preventive Services Task Force. JAMA. 2016;315(13):1378–1393. | ||
Vestbo J, Rennard S. Chronic obstructive pulmonary disease biomarker(s) for disease activity needed–urgently. Am J Respir Crit Care Med. 2010;182(7):863–864. | ||
Faner R, Tal-Singer R, Riley JH, et al. Lessons from ECLIPSE: a review of COPD biomarkers. Thorax. 2014;69(7):666–672. | ||
Sin DD, Vestbo J. Biomarkers in chronic obstructive pulmonary disease. Proc Am Thorac Soc. 2009;6(6):543–545. | ||
Celli BR, Cote CG, Marin JM, et al. The body-mass index, airflow obstruction, dyspnea, and exercise capacity index in chronic obstructive pulmonary disease. N Engl J Med. 2004;350(10):1005–1012. | ||
Lee JH, Cho MH, McDonald ML, et al. Phenotypic and genetic heterogeneity among subjects with mild airflow obstruction in COPDGene. Respir Med. 2014;108(10):1469–1480. | ||
Regan EA, Lynch DA, Curran-Everett D, et al. Clinical and radiologic disease in smokers with normal spirometry. JAMA Intern Med. 2015;175(9):1539–1549. | ||
Pauwels RA, Rabe KF. Burden and clinical features of chronic obstructive pulmonary disease (COPD). Lancet. 2004;364(9434):613–620. | ||
Jansson SA, Backman H, Stenling A, Lindberg A, Ronmark E, Lundback B. Health economic costs of COPD in Sweden by disease severity–has it changed during a ten years period? Respir Med. 2013; 107(12):1931–1938. | ||
Schols AM, Slangen J, Volovics L, Wouters EF. Weight loss is a reversible factor in the prognosis of chronic obstructive pulmonary disease. Am J Respir Crit Care Med. 1998;157(6 Pt 1):1791–1797. | ||
Vestbo J, Prescott E, Almdal T, et al. Body mass, fat-free body mass, and prognosis in patients with chronic obstructive pulmonary disease from a random population sample: findings from the Copenhagen City Heart Study. Am J Respir Crit Care Med. 2006;173(1):79–83. | ||
Bhavani S, Tsai CL, Perusich S, et al. Clinical and immunological factors in emphysema progression. Five-year prospective longitudinal exacerbation study of chronic obstructive pulmonary disease (LES-COPD). Am J Respir Crit Care Med. 2015;192(10):1171–1178. | ||
Burney PG, Chinn S, Britton JR, Tattersfield AE, Papacosta AO. What symptoms predict the bronchial response to histamine? Evaluation in a community survey of the bronchial symptoms questionnaire (1984) of the International Union Against Tuberculosis and Lung Disease. Int J Epidemiol. 1989;18(1):165–173. | ||
Arif AA, Delclos GL, Lee ES, Tortolero SR, Whitehead LW. Prevalence and risk factors of asthma and wheezing among US adults: an analysis of the NHANES III data. Eur Respir J. 2003;21(5):827–833. | ||
Kweon S, Kim Y, Jang MJ, et al. Data resource profile: the Korea National Health and Nutrition Examination Survey (KNHANES). Int J Epidemiol. 2014;43(1):69–77. | ||
Pellegrino R, Viegi G, Brusasco V, et al. Interpretative strategies for lung function tests. Eur Respir J. 2005;26(5):948–968. | ||
Hwang YI, Kim CH, Kang HR, et al. Comparison of the prevalence of chronic obstructive pulmonary disease diagnosed by lower limit of normal and fixed ratio criteria. J Korean Med Sci. 2009;24(4):621–626. | ||
Burney PG, Luczynska C, Chinn S, Jarvis D. The European Community Respiratory Health Survey. Eur Respir J. 1994;7(5):954–960. | ||
Rabin R, de Charro F. EQ-5D: a measure of health status from the EuroQol Group. Ann Med. 2001;33(5):337–343. | ||
Snider GL. Chronic obstructive pulmonary disease: risk factors, pathophysiology and pathogenesis. Annu Rev Med. 1989;40:411–429. | ||
Postma DS, Bush A, van den Berge M. Risk factors and early origins of chronic obstructive pulmonary disease. Lancet. 2015;385(9971):899–909. | ||
Affes Z, Rekik S, Ben Saad H. Defining obstructive ventilatory defect in 2015. Libyan J Med. 2015;10:28946. | ||
Buffels J, Degryse J, Heyrman J, Decramer M, Study D. Office spirometry significantly improves early detection of COPD in general practice: the DIDASCO Study. Chest. 2004;125(4):1394–1399. | ||
Averame G, Bonavia M, Ferri P, et al. Office spirometry can improve the diagnosis of obstructive airway disease in primary care setting. Respir Med. 2009;103(6):866–872. | ||
Xuan W, Peat JK, Toelle BG, Marks GB, Berry G, Woolcock AJ. Lung function growth and its relation to airway hyperresponsiveness and recent wheeze. Results from a longitudinal population study. Am J Respir Crit Care Med. 2000;161(6):1820–1824. |
 © 2017 The Author(s). This work is published and licensed by Dove Medical Press Limited. The
full terms of this license are available at https://www.dovepress.com/terms
and incorporate the Creative Commons Attribution
- Non Commercial (unported, 3.0) License.
By accessing the work you hereby accept the Terms. Non-commercial uses of the work are permitted
without any further permission from Dove Medical Press Limited, provided the work is properly
attributed. For permission for commercial use of this work, please see paragraphs 4.2 and 5 of our Terms.
© 2017 The Author(s). This work is published and licensed by Dove Medical Press Limited. The
full terms of this license are available at https://www.dovepress.com/terms
and incorporate the Creative Commons Attribution
- Non Commercial (unported, 3.0) License.
By accessing the work you hereby accept the Terms. Non-commercial uses of the work are permitted
without any further permission from Dove Medical Press Limited, provided the work is properly
attributed. For permission for commercial use of this work, please see paragraphs 4.2 and 5 of our Terms.