Back to Journals » International Journal of Chronic Obstructive Pulmonary Disease » Volume 14
Identification of relevant variables and construction of a multidimensional index for predicting mortality in COPD patients
Authors Xu L, Ye T, Li J ![]() , Hu Y, Xu W, Wang K, Ou C
, Hu Y, Xu W, Wang K, Ou C ![]() , Chen X
, Chen X ![]()
Received 10 May 2019
Accepted for publication 25 June 2019
Published 1 August 2019 Volume 2019:14 Pages 1703—1711
DOI https://doi.org/10.2147/COPD.S215219
Checked for plagiarism Yes
Review by Single anonymous peer review
Peer reviewer comments 2
Editor who approved publication: Dr Chunxue Bai
Limei Xu,1,* Tiaofei Ye,1,* Jiahui Li,1,* Yuhe Hu,1 Wenhui Xu,1 Kai Wang,1 Chunquan Ou,2 Xin Chen1
1Department of Pulmonary and Critical Care Medicine, Zhujiang Hospital, Southern Medical University, Guangzhou, People’s Republic of China; 2State Key Laboratory of Organ Failure Research, Department of Biostatistics, Guangdong Provincial Key Laboratory of Tropical Disease Research, School of Public Health, Southern Medical University, Guangzhou, People’s Republic of China
*These authors contributed equally to this work
Background and objective: The Body mass index, airflow Obstruction, Dyspnea, and Exercise (BODE) index is a well-known metric for chronic obstructive pulmonary disease (COPD), but it is inadequate for predicting mortality. This study proposed a new index that combines inspiratory muscle training with the BODE index and verified its ability to predict mortality in patients with COPD.
Methods: Cox regression identified predictors of mortality, which were then included in the new index. The receiver operating characteristic (ROC) curve verified the ability of the new index to predict mortality. The Kaplan-Meier curves compared the survival rates of patients with different scores on the new index.
Results: Among the 326 patients, 48 died during follow-up (1–59 months). Cox regression showed that the fat-free mass index (FFMI), forced expiratory volume in one second/the predicted value (FEV1%), modified Medical Research Council (mMRC) score, six-minute–walk test (6MWT) distance, and maximal inspiratory pressure were predictors of mortality (P<0.05); these variables were included in the FODEP index. The AUC of the FODEP index (0.860, 95% CI: 95% CI: 0.817–0.896) was greater than that of the BODE index (0.778, 95% CI: 0.729–0.822). The Kaplan-Meier curves suggested that as the FODEP score increased, so did the risk of morality in patients with COPD. The cumulative survival in the group with the highest FODEP-value was significantly lower than that in the other groups (P<0.01).
Conclusion: The FODEP index was more effective than the BODE index at predicting the risk of mortality in patients with COPD.
Keywords: inspiratory muscle training, FODEP, BODE
Introduction
Chronic obstructive pulmonary disease (COPD), with its high prevalence, mortality, and disability rates and poor treatment response, not only seriously affects patient quality of life but also imposes large societal burdens.1 COPD is heterogeneous and is mainly characterized by respiratory symptoms, although there are also extrapulmonary effects, such as malnutrition2,3 and muscle dysfunction.4 The prognosis of patients with COPD is affected by multiple factors, such as the patients’ symptoms, nutritional status,5 exercise tolerance6 and muscle function.4 A multidimensional evaluation is therefore needed.
The Body mass index, airflow Obstruction, Dyspnea, and Exercise (BODE) index, proposed by Celli et al7 as a multidimensional assessment, is widely used to evaluate COPD.8 It consists of the body mass index (BMI), airflow obstruction (forced expiratory volume in one second/the predicted value (FEV1%)), dyspnea (measured by the modified Medical Research Council (mMRC) scale), and exercise capacity (measured by the six-minute–walk test (6MWT)).7 Compared with spirometry or the ABCD assessment tool from the Global Initiative for Chronic Obstructive Lung Disease (GOLD),9 the BODE index more comprehensively reflects the characteristics of COPD by evaluating the patient’s disease manifestations, nutrition, exercise, and pulmonary function and better predicts mortality10 and hospitalization.1 It is a pioneering tool for the multidimensional comprehensive assessment of COPD.
However, limitations still exist in the BODE index. First, in the BODE, FEV1% is classified according to the three stages identified by the American Thoracic Society (ATS), which is based on a spirometry test and can not directly reflect the severity of the disease.11 However, the GOLD classification system is associated with the severity of COPD12 and its cut-off values tend to be simpler. Furthermore, nutrition is an important factor that affects the prognosis of patients with COPD,13 and the mortality rate is lower in overweight patients than in normal-weight or low-weight patients.14 Among patients with COPD, weight loss mainly results from the loss of skeletal muscle.13 Muscle atrophy in COPD is caused by dyspnea, inadequate nutritional intake, insufficient exercise, and inflammation.15 The fat-free mass index (FFMI)16 has been shown to be better than BMI for assessing the nutritional status of patients with COPD.5 Finally, in addition to limb muscle weakness, respiratory muscle dysfunction is also frequently observed. Inspiratory muscle weakness is not only an important cause of acute exacerbation17 but also a significant predictor of death in patients with COPD.18 However, the BODE index does not include any indicator of respiratory muscle function.
In summary, this study aimed to develop a new index by modifying the BODE index and verifying the ability of the modified index to predict the mortality of patients with COPD to provide a new tool for clinicians when evaluating patients with COPD.
Materials and methods
Patients
From January 1, 2013 to January 1, 2014, 326 outpatients (63 females) with COPD were recruited from Zhujiang Hospital for this prospective cohort study. The inclusion criteria were as follows: age ≥40 years and diagnosis of COPD according to spirometry (FEV1/FVC<0.70 after inhaling 400 µg of salbutamol aerosol). All patients were clinically stable and received appropriate therapy. Patients with bronchial asthma, advanced tuberculosis, bronchiectasis, severe cardiovascular disease, malignant tumors and those who had suffered a respiratory infection in the previous 4 weeks or participated in a rehabilitation program in the previous 3 months were excluded.
Data collection
The data collected at the baseline from all patients include age; sex; pack-years of smoking; pulmonary function, BMI, FFMI, mMRC, 6MWT, maximal inspiratory pressure (MIP), maximal expiratory pressure (MEP), exacerbations in the previous year and COPD assessment test (CAT) score.
Spirometry was performed with a spirometer (Pony FX229; Cosmed, Rome, Italy) at intervals of 20 mins before and after inhalation of 400 μg of salbutamol aerosol.19 The collected parameters of pulmonary function included forced vital capacity (FVC), forced expiratory volume in 1 s (FEV1), FEV1/FVC and FEV1%. The predicted values of FEV1 and FVC are calculated by using ECSC regression equations with appropriate conversion factors.20
FFMI was measured with multifrequency electrodes (Inbody720; Biospace, Seoul, Korea). Each patient was measured twice and the average was calculated and used in subsequent analyses. BMI was calculated using the following formula: body mass/(height)2 (kg/m2). FFMI was calculated using the following formula: fat-free body mass/(height)2 (kg/m2).
The 6MWT was conducted under the supervision of an experienced clinician. During the test, the oxygen saturation level was maintained at above 90%. The tests were performed twice with an interval of at least 1 hr between the two tests. The maximum test result was used in the subsequent analyses.
MIP and MEP were assessed with a digital manometer (AZ-8205; AZ Instruics, Taiwan). Quality control was conducted according to the ATS and the European Respiratory Society (ERS) protocols, and the maximum value out of three measurements was selected.21
Follow-up
Subjects were followed every 3 months for at least 2 years or until death. Acute exacerbations requiring hospital management (emergency visits or admissions), if any, were recorded during the follow-up. The follow-up methods included telephone calls, clinic appointments and home visits. Subjects who were lost to follow-up were excluded from the analysis. One researcher identified and recorded the cause of death listed on the hospital record.
Written informed consent was obtained from all subjects. The protocol, which was in accordance with the Declaration of Helsinki, was approved by the ethics committee of Zhujiang Hospital, Southern Medical University, Guangzhou.
Identification of factors predicting mortality
Univariate Cox regression was used to identify the factors that significantly predicted mortality. The variables included were age, sex, pack-years of smoking, FVC, FEV1, FEV1/FVC, FEV1%, BMI, FFMI, 6MWT, mMRC score, MIP, MEP and number of exacerbations in the previous year. Those factors that were statistically significant were included in multivariate Cox regression.
Construction of FODEP, the new index
The following modifications were made to the BODE index: (1) the reclassification of lung function according to the GOLD guidelines; (2) the substitution of the FFMI for BMI; and (3) the addition of MIP. The newly constructed index was named the FODEP index.
The FODEP index scores range from 0 to 15, as shown in Table 1. According to the classification of airflow limitation based on the GOLD guidelines,12 the threshold for FEV1% ranged from 0 to 3. The value of FFMI ranged from 0 (FFMI ≥21.7 kg/m2 for males or FFMI ≥18.2 kg/m2 for females) to 3 (FFMI ≤16.6 kg/m2 for males or FFMI ≤14.5 kg/m2 for females), based on the ATS statement.22 As recommended,23 a MIP>60 cmH2O is considered normal. The value of MIP was 0 when MIP was >60 cmH2O; otherwise, it was 3. The ranges of mMRC and 6MWT were the same as in the BODE index.
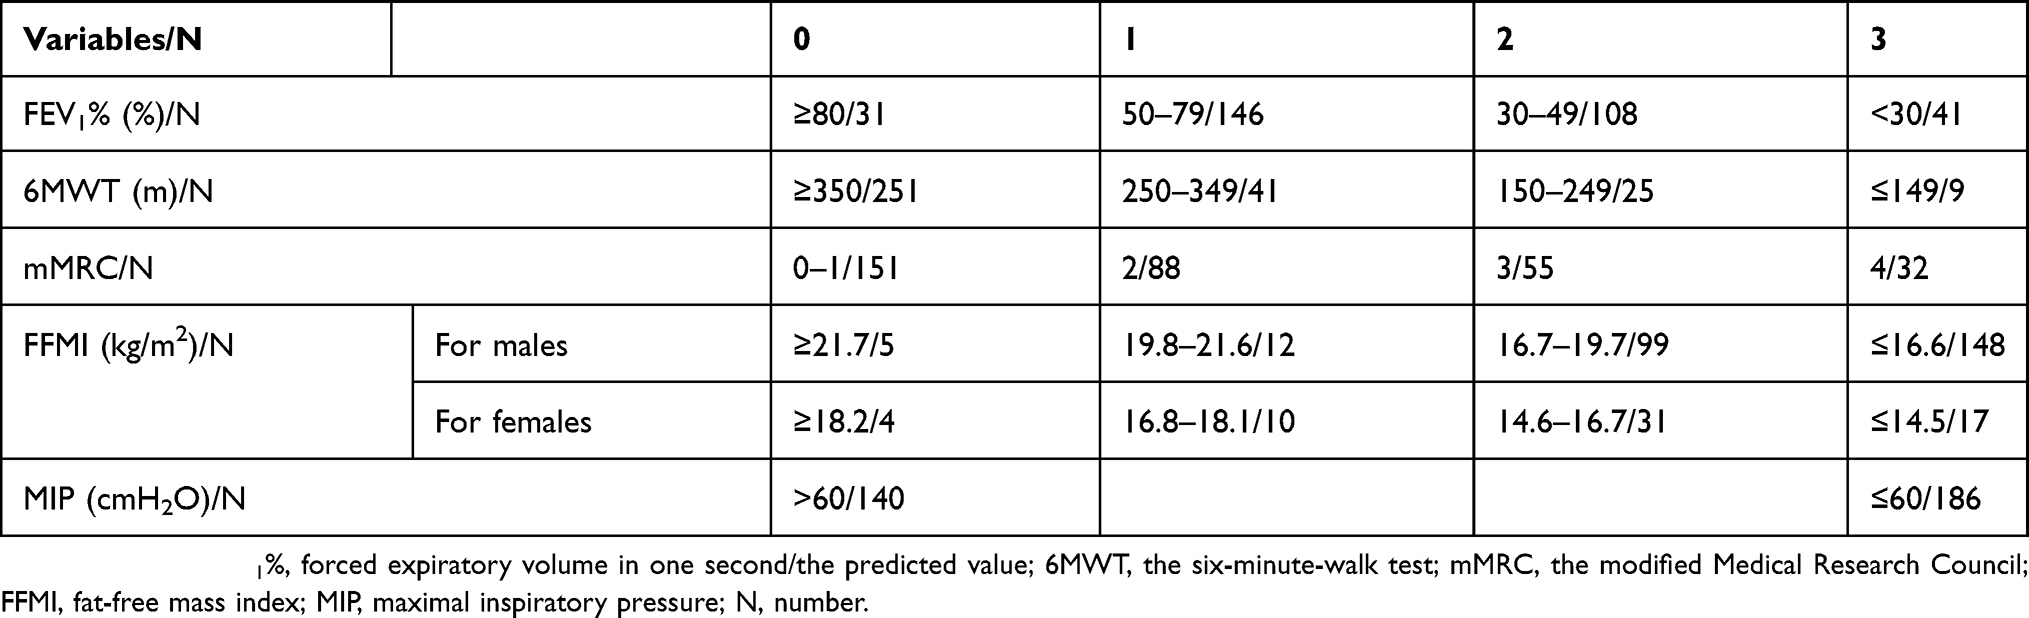 |
Table 1 Construction of the fat-free mass index, degree of airflow obstruction, Dyspnea, exercise capacity, and maximal inspiratory pressure (FODEP) index and the number of subjects in each of the 4 stages for each component of the FODEP index |
Verification of the FODEP index
A receiver operating characteristic (ROC) curve analysis was performed to compare the abilities of the BODE index and the FODEP index to predict mortality in patients with COPD. Patients were categorized into quartiles according to their FODEP scores. Then, Kaplan–Meier curves were plotted for all four groups to compare the differences in survival among the groups.
Statistical analysis
Continuous variables are presented as the mean ± SD, unless otherwise stated. Associations between factors and mortality were evaluated using Cox regression. ROC curve analysis was performed to compare the overall performances of the FODEP index and the BODE index with regard to the prognostic prediction and to determine the optimal threshold. Kaplan–Meier curves were constructed to determine the differences in survival among patients grouped according to their FODEP score quartile. Pearson correlation analysis was used to evaluate the relationship between FODEP and hospitalization. P<0.05 was considered statistically significant. Except for the ROC curve analyses, which were performed with MedCalc Statistical Software version 15.2.2 (MedCalc Software, Ostend, Belgium), all other analyses were conducted with SPSS v. 20 (IBM Corporation, Armonk, NY, USA).
Results
Patient characteristics
In total, 502 patients were initially enrolled, of whom 121 patients were excluded. Then, the remaining 381 patients were followed until the end of the study or death, while 55 patients were lost to follow-up. Thus, 326 patients (63 females; median age: 67.6 years [range: 41–92 years]) were included in the analysis (Figure 1). In this study, patients were followed for a median of 34 months (range: 1–59 months). The baseline characteristics of the survivors and nonsurvivors are shown in Table 2. During follow-up, 19 subjects (5.8%) died in the first 24 months, and 48 (14.7%) died in the first 59 months. Figure 2 shows the change in mortality of the subjects in two different periods. The majority of patients (56 percent) died of respiratory failure, 15 percent died of cardiogenic shock, 10 percent of cerebrovascular accident, and the rest of miscellaneous causes.
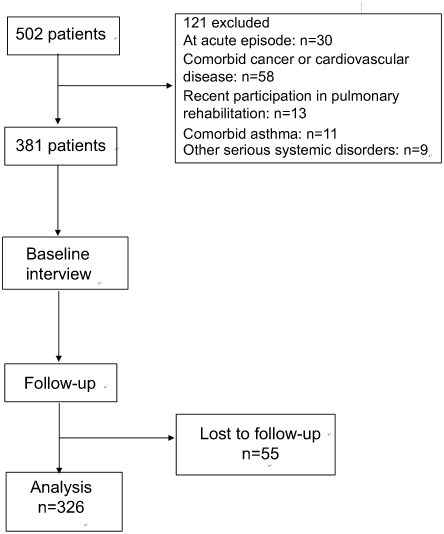 |
Figure 1 Flow chart of the study. Note: We excluded such patients who were at acute episode at the time of enrollment, accompanied by more severe dyspnea and other symptoms, for they were unable to take the lung function test and six-minute-walk test in this study. |
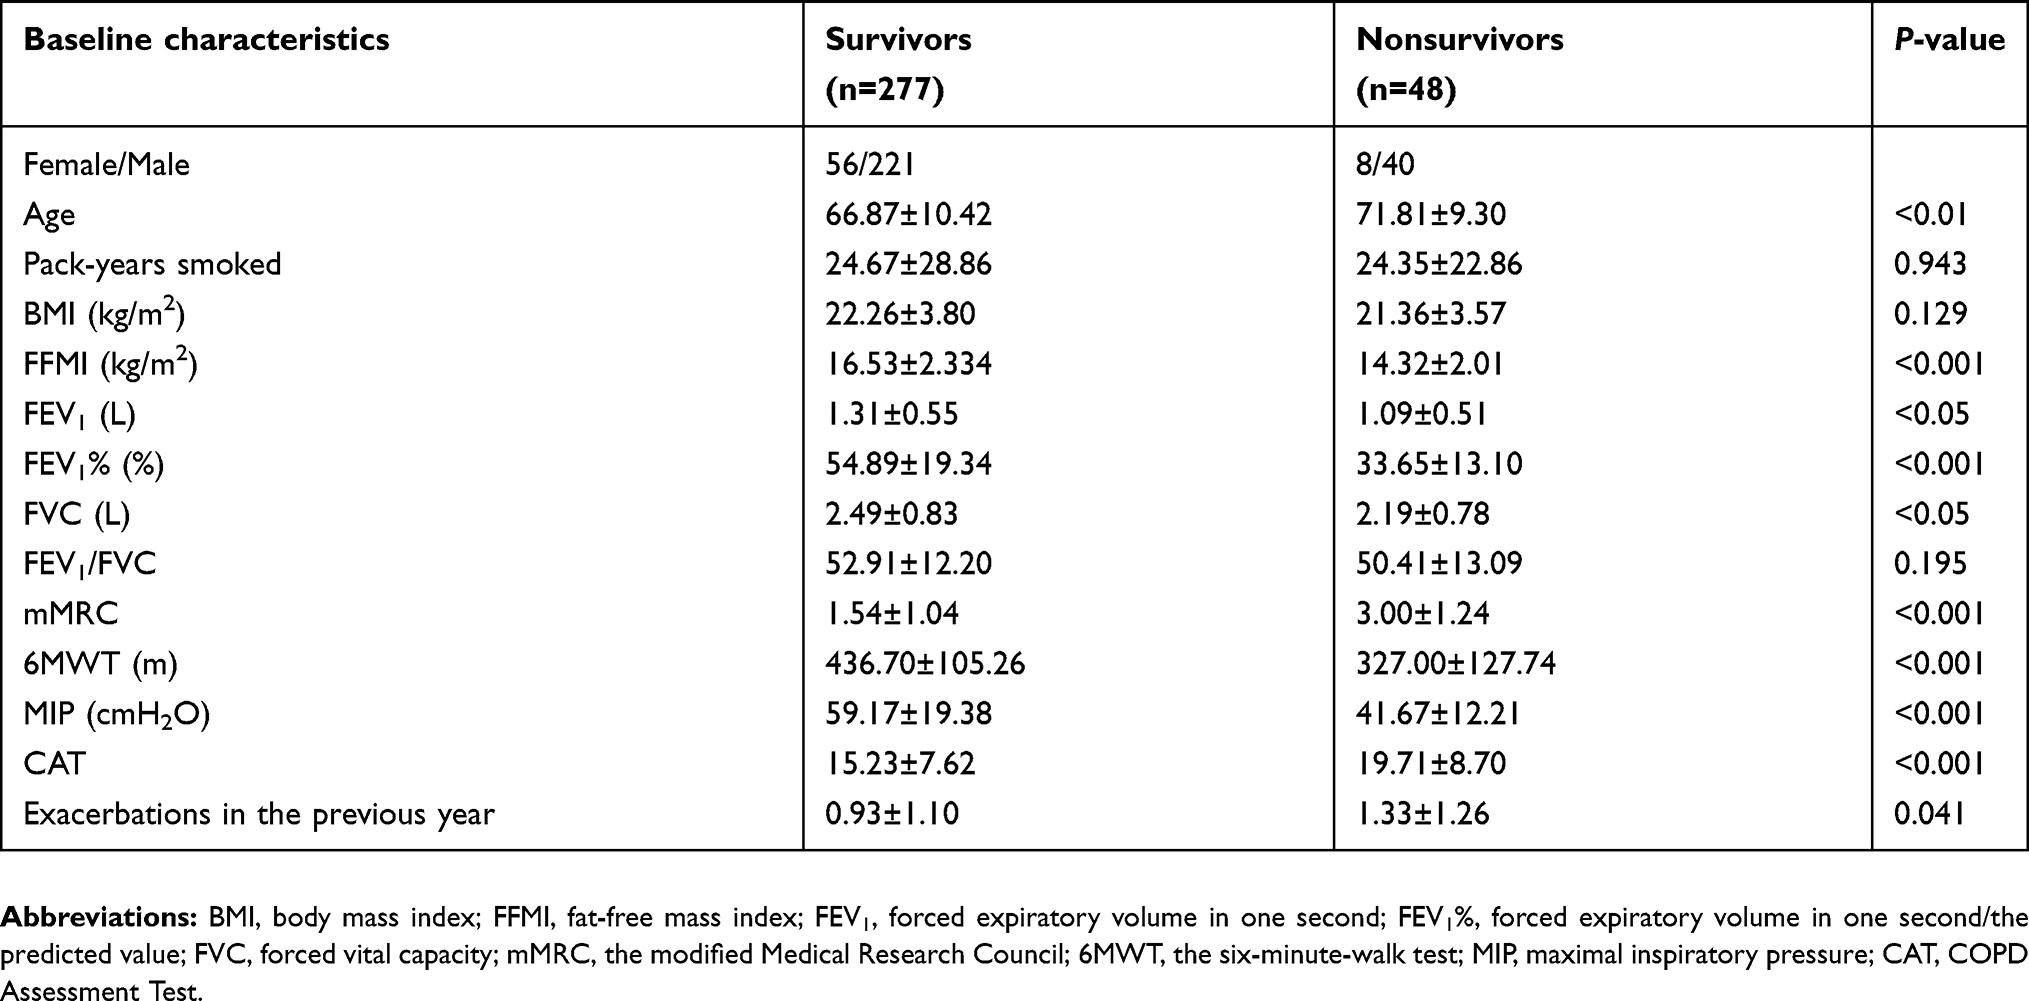 |
Table 2 Baseline characteristics of 277 survivors and 48 nonsurvivors |
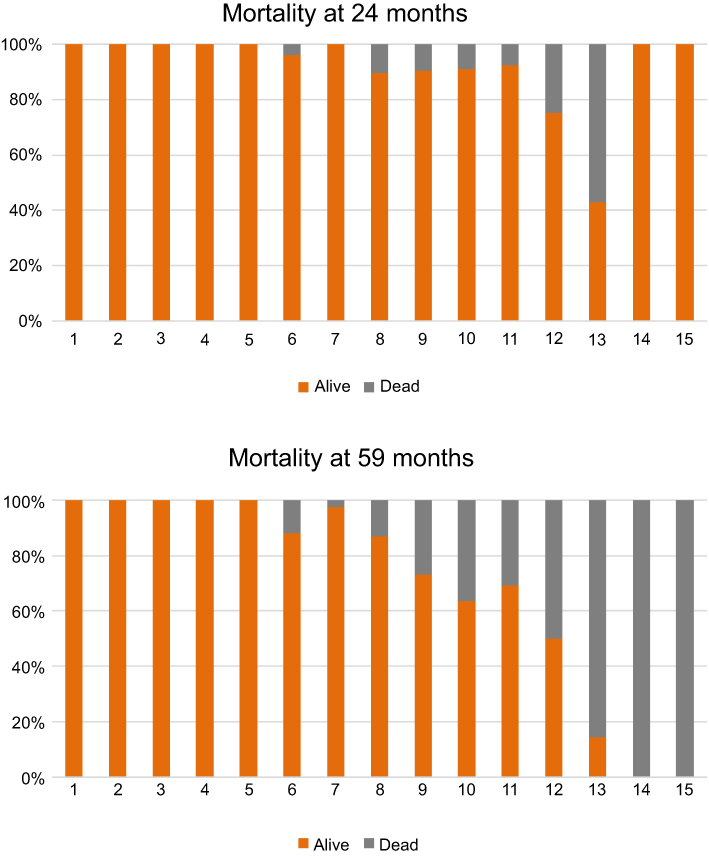 |
Figure 2 FODEP scores and mortality rates over time. For each unit of the FODEP score, the bars show the proportion of subjects alive and dead at the end of 24 months and 59 months. |
Identification of factors predicting mortality
Univariate Cox analysis suggested that the following factors were significantly associated with mortality (Table 3): age, FFMI, FEV1%, mMRC score, 6MWT distance, MIP, FEV1, FVC, MEP, and the number of exacerbations in the previous year. Interestingly, the association between BMI and mortality was not significant (P=0.069). Incorporating the above factors into multivariate Cox analysis revealed that the following factors were still significantly associated with mortality (Table 4): FFMI (P=0.001), FEV1% (P<0.001), mMRC score (P=0.025), 6MWT distance (P=0.001), and MIP (P=0.001).
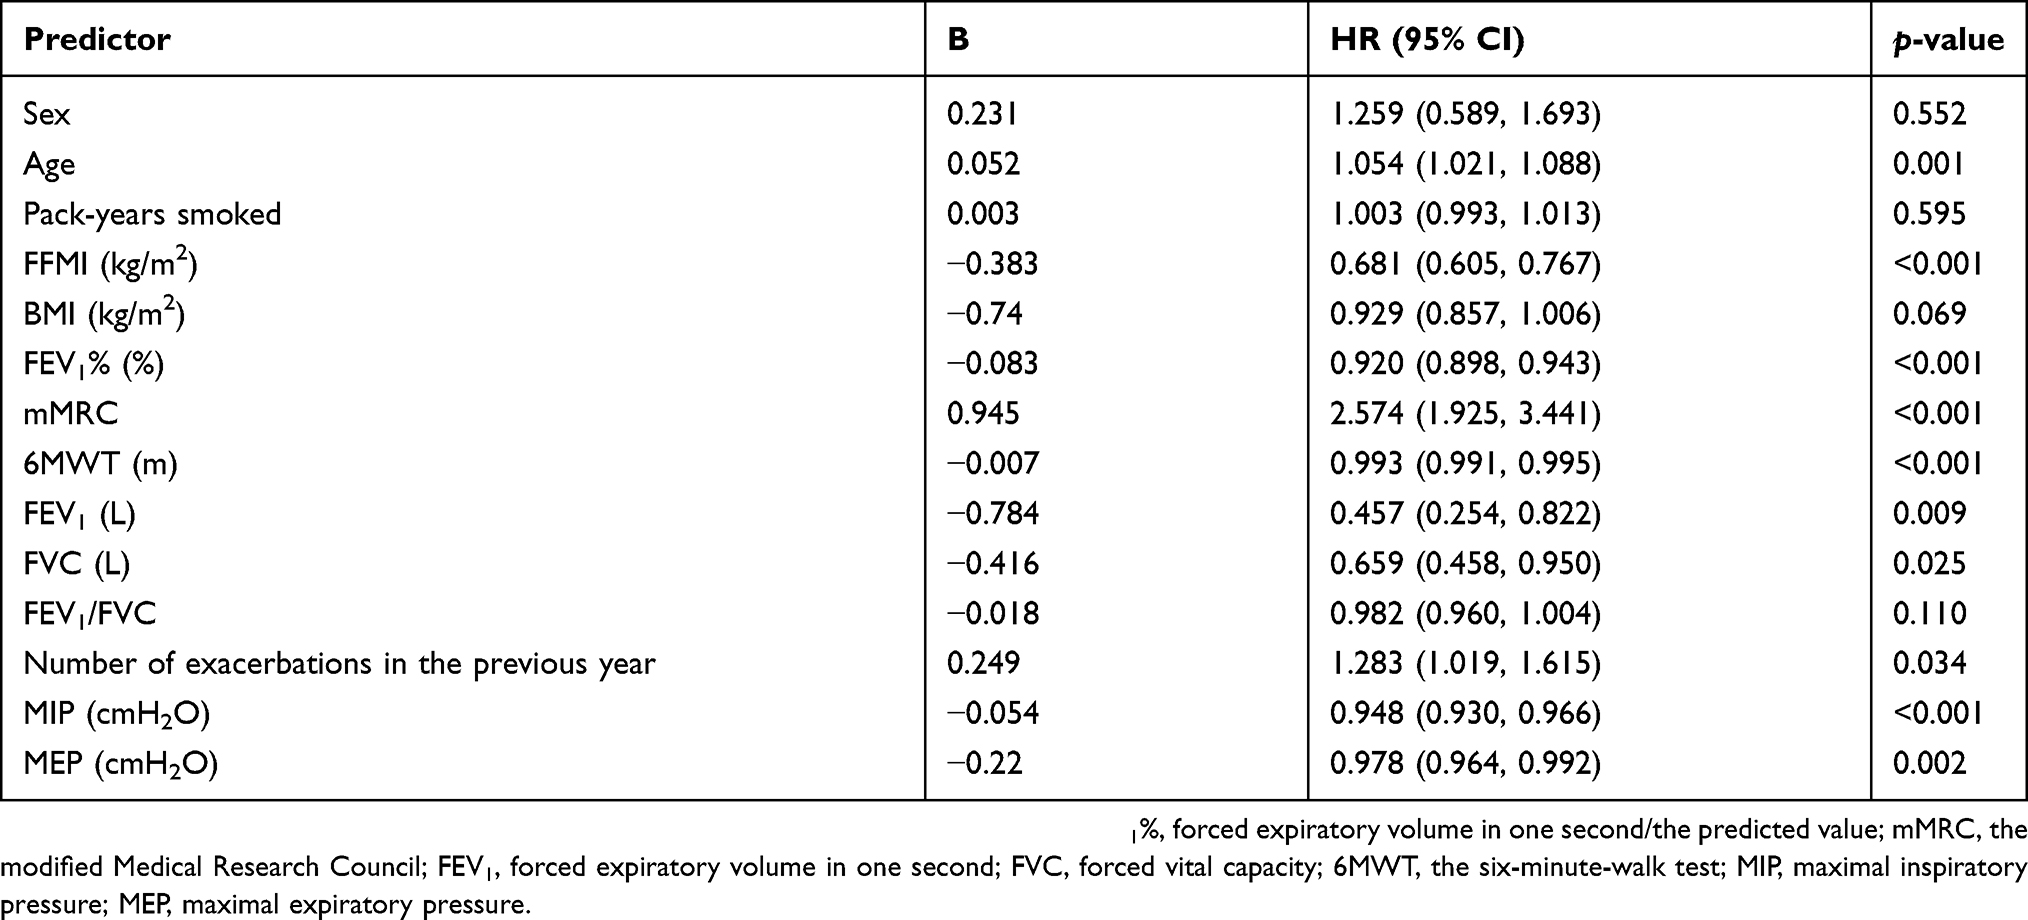 |
Table 3 Univariate Cox regression analysis of independent predictors of death in COPD patients |
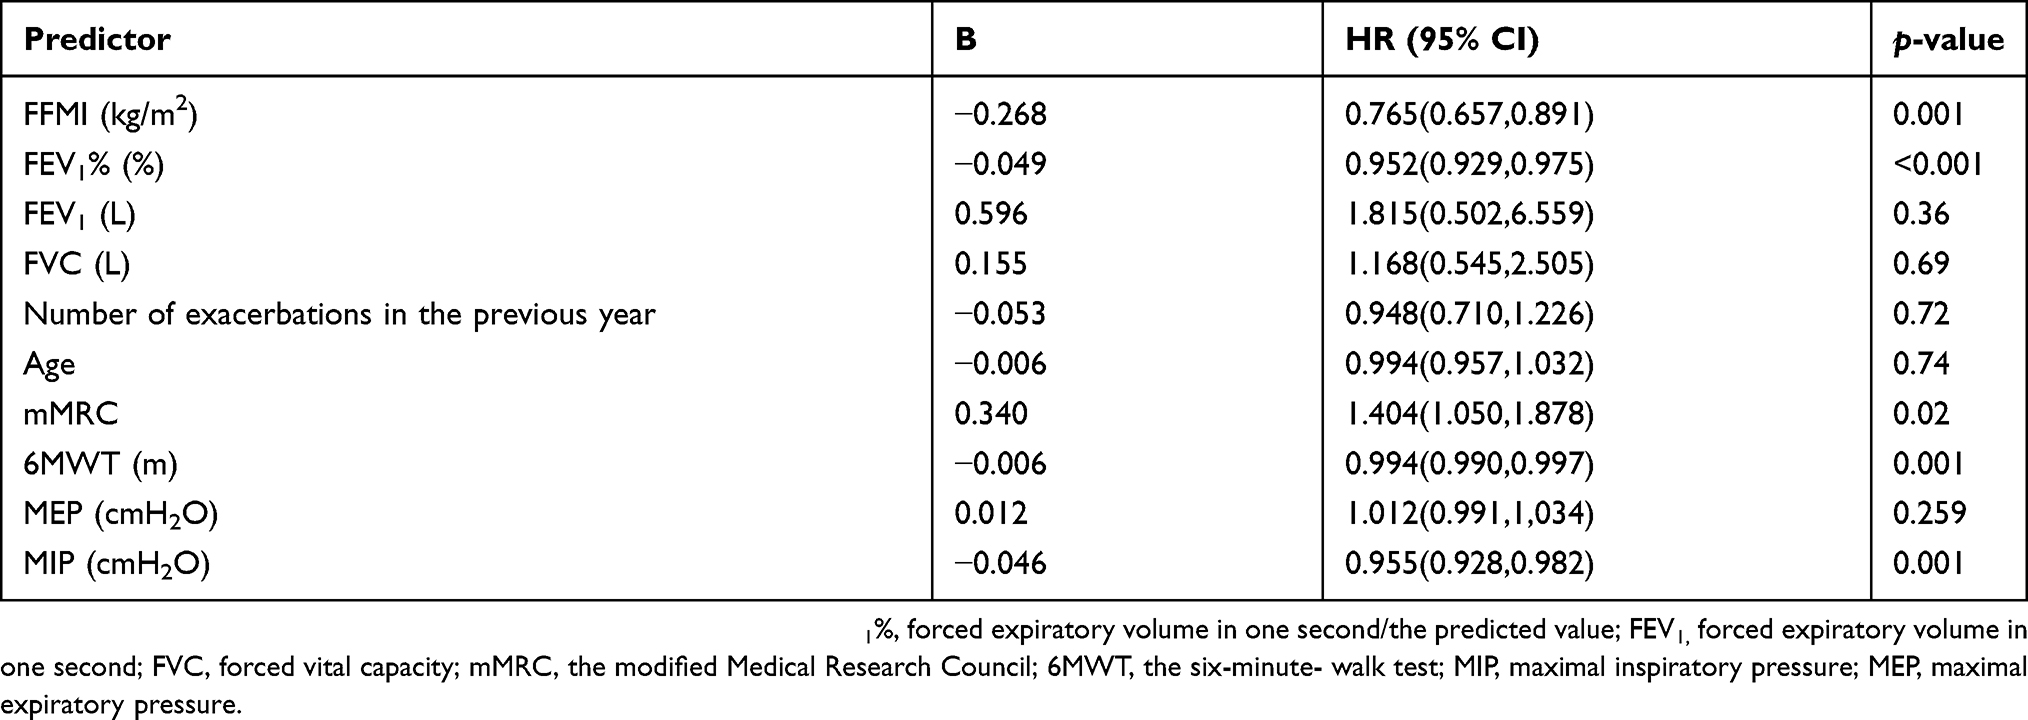 |
Table 4 Multivariate Cox regression analysis of independent predictors of mortality in COPD patients |
Evaluation of the ability of the FODEP index to predict mortality
The ROC curves for the BODE index and the FODEP index are shown in Figure 3. The AUCs for the BODE index and the FODEP index were 0.778 (95% CI: 0.729–0.822) and 0.860 (95% CI: 0.817–0.896), respectively. The AUC of the FODEP index was significantly different from that of the BODE index (P<0.001 by Delong’s method).24 The Youden index of the FODEP index was 0.577, with a sensitivity and specificity of 81.25% and 76.45%, respectively. The Youden index for the BODE index was 0.427, with a sensitivity and specificity of 72.92% and 69.78%, respectively.
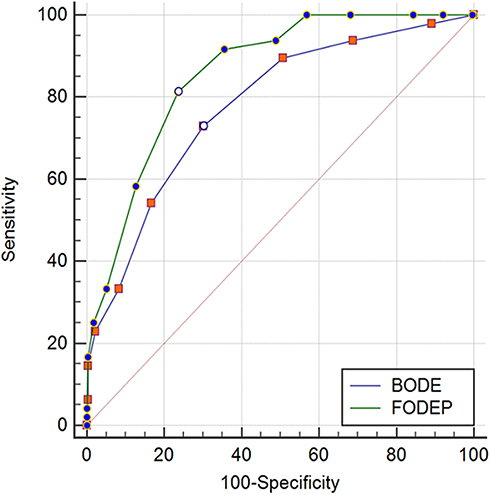 |
Figure 3 ROC curves of the BODE and FODEP index for the prediction of mortality in COPD patients. Note: The AUC of FODEP: 0.860 (95% CI: 0.817–0.896), BODE: 0.778 (95% CI: 0.729–0.822). Difference of ROC curves was significant between FODEP and BODE (P<0.001 by Delong et al (1988)).24 |
Patients were categorized into quartiles according to their FODEP scores as follows: 0–4, 5–8, 9–12, and 13–15. The Kaplan-Meier curves are presented in Figure 4. The survival rate decreased as the FODEP index increased; the association was more significant with a higher FODEP index (P<0.001 by the log-rank test).
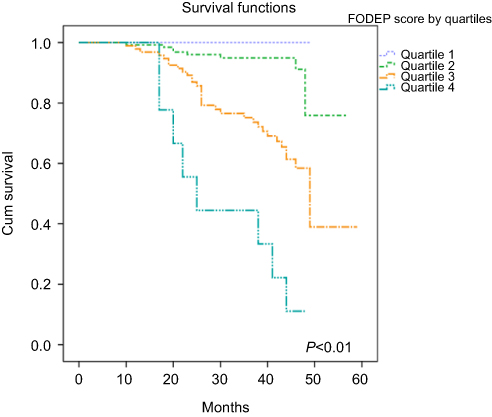 |
Figure 4 Kaplan-Meier survival curves for patients stratified by quartiles of FODEP scores. Note: Quartile 1: scores of 0 to 4; Quartile 2: scores of 5 to 8; Quartile 3: scores of 9 to 12; Quartile 4: scores of 13 to 15. Survival differed significantly among the 4 groups: P<0.01 by the log rank test. |
Correlation between the FODEP index and the number of hospitalizations
The FODEP index has a moderate correlation with the number of hospitalizations (r=0.384, P<0.001). However, as shown in Figure 5, the ROC curves showed there was no significant difference in predicting the risk of rehospitalization between the BODE index and the FODEP index (P=0.7046). The AUC of the FODEP index was 0.632 (95% CI: 0.577–0.684), and the AUC of the BODE index was 0.624 (95% CI: 0.569 −0.677). The Youden index of the FODEP index was 0.238, with a sensitivity and specificity of 72.12% and 51.69%, respectively. The Youden index of the BODE index was 0.186, with a sensitivity and specificity of 63.46% and 55.08%, respectively.
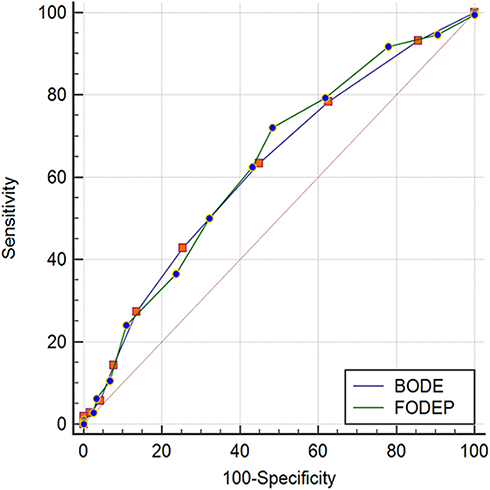 |
Figure 5 ROC curves of the BODE and FODEP indexes for the prediction of the risk of COPD-related hospitalization. Note: The AUC of FODEP: 0.632(95% CI: 0.577–0.684), BODE: 0.624 (95% CI: 0.569 −0.677). Difference of ROC curves was not significant between FODEP and BODE (P=0.7046 by Delong et al (1988)).24 |
Discussion
This study has shown that the FODEP index, consisting of FFMI, FEV1%, the mMRC score, the 6MWT distance and MIP, is a significant and independent predictor of mortality, with every one point increase in the FODEP index score associated with a 1.55-fold increased risk of death.
Univariate Cox regression showed that age, FFMI, FEV1%, mMRC score, 6MWT distance, MIP, FEV1, FVC, MEP, and the number of exacerbations in the previous year were independent predictors of the risk of mortality in COPD patients; these findings were in line with the results of other studies such as DOSE,25 which indicated that smoking status and exacerbation frequency (as well as dyspnea and airflow obstruction) were important predictive factors, or ADO,26 which included age (plus dyspnea and airflow obstruction). However, we found that only five factors (FFMI, FEV1%, mMRC score, 6MWT distance and MIP) were still significantly correlated with mortality in the multivariate Cox regression, which is the reason those variable were chosen for inclusion in the FODEP index.
BMI was used to assess nutritional status in the BODE index; however, it does not reflect the status of skeletal muscle in patients with COPD.27 Compared with BMI, FFMI seems to be more related to muscle atrophy, exercise capacity, and quality of life. FFMI was also found to be a predictor of overall mortality in subjects with normal BMI.28 Thus, replacing BMI with FFMI could more accurately reflect the nutritional status of COPD patients.
Inspiratory muscle strength is commonly reduced in COPD patients, and the degree of reduction is related to the severity of disease.15 Previous studies reported that respiratory muscle weakness is observed in 20–50% of patients, with the reduction ranging from 15% to 30%.29 In 2010, Hill et al23 proposed that respiratory muscle strength is closely linked to dyspnea and exercise capacity. Inspiratory muscle strength, as assessed by MIP, has been shown to be an independent predictor of survival in COPD patients,18 which was consistent with the findings of this study. In addition, as it is less affected by external factors, MIP provides a convenient metric for inspiratory strength. Therefore, MIP was included in the FODEP index.
The ROC curve suggests that the FODEP index may be a better predictor of mortality than the BODE index, although it remains to be confirmed by further study. Kaplan-Meier survival analysis revealed that the FODEP score was closely related to the risk of mortality in patients with COPD, and the cumulative survival rate of patients with the highest FODEP score was significantly lower than that of patients with lower scores.
Exacerbations of COPD are key events in COPD management,30 making exacerbation frequency a marker of disease severity.31 Preventing exacerbations of COPD, especially hospitalizations, is a major goal in the management of patients with COPD. Previous studies have suggested that the BODE index is a better predictor of hospitalization for COPD than is GOLD staging based on FEV1,1 while our study suggested that the FODEP index has a similar ability to predict COPD-related hospitalization as that of the BODE index. Thus, the FODEP index may be helpful in predicting hospitalizations in COPD patients.
This study has certain limitations. The cohort was relatively small, and the observation duration was not long enough. Second, previous studies have shown that image-based COPD classifications can indicate degrees of dyspnea and acute exacerbations.32 Van Tho et al suggested that COPD patients with different phenotypes on imaging examinations may present with different clinical manifestations.32 However, imaging-based phenotypes of COPD were not included in the multidimensional indicators in this study.
Conclusion
Compared with the BODE index, the FODEP index is better able to predict the prognosis of COPD patients. Moreover, the FODEP index provides further insights into the comprehensive assessment and management of COPD patients.
Acknowledgments
This work was supported by the Guangdong Provincial Department of Education High-level University Construction Funding Southern Medical University Clinical Research Startup Program (LC2016PY032), the Guangzhou Innovation and Entrepreneurship Education Project of Universities (201709T26), and the scientific research startup program of Southern Medical University (PY2018N046), and the Medical Scientific Research Foundation of Guangdong Province (A2019425).
Author contributions
Xin Chen is the guarantor of this research. Chunquan Ou and Xin Chen were responsible for the study concept and design. Limei Xu, Tiaofei Ye and Jiahui Li contributed to patient recruitment and patient follow-up. Yuhe Hu and Wenhui Xu acquired the data. Kai Wang analyzed the data. All authors contributed to the data analysis and manuscript drafting and revision, gave final approval of the version to be published and agree to be accountable for all aspects of the work.
Disclosure
The authors report that there are no conflicts of interest related to this work.
References
1. Ong KC, Earnest A, Lu SJ. A multidimensional grading system (BODE index) as predictor of hospitalization for COPD. Chest. 2005;128(6):3810–3816. doi:10.1378/chest.128.6.3810
2. Wouters EF, Schols AM. Prevalence and pathophysiology of nutritional depletion in chronic obstructive pulmonary disease. Respir Med. 1993;87 Suppl B:45–47.
3. Luo Y, Zhou L, Li Y, et al. Fat-free mass index for evaluating the nutritional status and disease severity in COPD. Respir Care. 2016;61(5):680–688. doi:10.4187/respcare.04358
4. Maltais F, Decramer M, Casaburi R, et al. An Official American Thoracic Society/European Respiratory Society statement: update on limb muscle dysfunction in chronic obstructive pulmonary disease. Am J Respir Crit Care Med. 2014;189(9). doi:10.1164/rccm.201306-1150OC
5. Sabino PG, Silva BM, Brunetto AF. Nutritional status is related to fat-free mass, exercise capacity and inspiratory strength in severe chronic obstructive pulmonary disease patients. Clinics (Sao Paulo). 2010;65(6):599–605. doi:10.1590/S1807-59322010000600007
6. Gerardi DA, Lovett L, Benoit-Connors ML, Reardon JZ, ZuWallack RL. Variables related to increased mortality following out-patient pulmonary rehabilitation. Eur Respir J. 1996;9(3):431–435.
7. Celli BR, Cote CG, Marin JM, et al. The body-mass index, airflow obstruction, dyspnea, and exercise capacity index in chronic obstructive pulmonary disease. N Engl J Med. 2004;350(10):1005–1012. doi:10.1056/NEJMoa021322
8. de Torres JP, Casanova C, Marín JM, et al. Prognostic evaluation of COPD patients: GOLD 2011 versus BODE and the COPD comorbidity index COTE. Thorax. 2014;69(9):799–804. doi:10.1136/thoraxjnl-2014-205770
9. Camiciottoli G, Bigazzi F, Bartolucci M, et al. BODE-index, modified BODE-index and ADO-score in chronic obstructive pulmonary disease: relationship with COPD phenotypes and CT lung density changes. Copd. 2012;9(3):297–304. doi:10.3109/15412555.2012.661000
10. Cote CG, Celli BR. BODE index: a new tool to stage and monitor progression of chronic obstructive pulmonary disease. Pneumonol Alergol Pol. 2009;77(3):305–313.
11. American Thoracic Society Statement.Lung function testing: selection of reference values and interpretative strategies. Am Rev Respir Dis. 1991;144(5):1202–1218. doi:10.1164/ajrccm/144.5.1202
12. Global Initiative for Chronic Obstructive Lung Disease. Global strategy for the diagnosis, management and prevention of COPD. 2017. Avail-able from: http://goldcopd.org.
13. Gologanu D, Ionita D, Gartonea T, Stanescu C, Bogdan MA. Body composition in patients with chronic obstructive pulmonary disease. Maedica (Buchar). 2014;9(1):25–32.
14. Cao C, Wang R, Wang J, Bunjhoo H, Xu Y, Xiong W. Body mass index and mortality in chronic obstructive pulmonary disease: a meta-analysis. PLoS One. 2012;7(8):e43892. doi:10.1371/journal.pone.0043892
15. Pothirat C, Chaiwong W, Phetsuk N, et al. The relationship between body composition and clinical parameters in chronic obstructive pulmonary disease. J Med Assoc Thai. 2016;99(4):386–393.
16. VanItallie TB, Yang MU, Heymsfield SB, Funk RC, Boileau RA. Height-normalized indices of the body’s fat-free mass and fat mass: potentially useful indicators of nutritional status. Am J Clin Nutr. 1990;52(6):953–959. doi:10.1093/ajcn/52.6.953
17. Larson JL, Covey MK, Corbridge S. Inspiratory muscle strength in chronic obstructive pulmonary disease. AACN Clin Issues. 2002;13(2):320–332.
18. Kabitz HJ, Walterspacher S, Walker D, Windisch W. Inspiratory muscle strength in chronic obstructive pulmonary disease depending on disease severity. Clin Sci (Lond). 2007;113(5):243–249. doi:10.1042/CS20060362
19. American Thoracic Society Statement.Standardization of Spirometry. 1994 Update. Am J Respir Crit Care Med. 1995;153(3):1107–1136.
20. Quanjer PHTGCJ. Lung volumes and forced ventilatory flows. Report Working Party ‘Standardization of lung function tests’ of ECSC. Eur Respir J. 1993;29(Suppl 6):5–40. doi:10.1183/09041950.005s1693
21. American Thoracic Society/European Respiratory Society. ATS/ERS statement on respiratory muscle testing. Am J Respir Crit Care Med. 2002;166(4):518–624. doi:10.1164/rccm.166.4.518
22. Nici L, Donner C, Wouters E, et al. American Thoracic Society/European Respiratory Society statement on pulmonary rehabilitation. Am J Respir Crit Care Med. 2006;173(12):1390–1413. doi:10.1164/rccm.200508-1211ST
23. Hill K, Cecins NM, Eastwood PR, Jenkins SC. Inspiratory muscle training for patients with chronic obstructive pulmonary disease: a practical guide for clinicians. Arch Phys Med Rehabil. 2010;91(9):1466–1470. doi:10.1016/j.apmr.2010.06.010
24. DeLong ER, DeLong DM, Clarke-Pearson DL. Comparing the areas under two or more correlated receiver operating characteristic curves: a nonparametric approach. Biometrics. 1988;44(3):837–845.
25. Jones RC, Donaldson GC, Chavannes NH, et al. Derivation and validation of a composite index of severity in chronic obstructive pulmonary disease. Am J Respir Crit Care Med. 2009;180(12):1189–1195. doi:10.1164/rccm.200902-0271OC
26. Puhan MA, Garcia-Aymerich J, Frey M, et al. Expansion of the prognostic assessment of patients with chronic obstructive pulmonary disease: the updated BODE index and the ADO index. Lancet. 2009;374(9691):704–711. doi:10.1016/S0140-6736(09)61301-5
27. Kim SB, Kang YA, Jung JY, et al. Body mass index and fat free mass index in obstructive lung disease in Korea. Int J Tuberc Lung Dis. 2014;18(1):102–108. doi:10.5588/ijtld.13.0212
28. Ischaki E, Papatheodorou G, Gaki E, Papa I, Koulouris N, Loukides S. Body mass and fat-free mass indices in COPD: relation with variables expressing disease severity. Chest. 2007;132(1):164–169. doi:10.1378/chest.06-2789
29. Gologanu D. [Dynamic hyperinflation – the main mechanism of decreased exercise tolerance in patients with COPD]. Pneumologia. 2013;62(2):102–105.
30. Seemungal TA, Donaldson GC, Paul EA, Bestall JC, Jeffries DJ, Wedzicha JA. Effect of exacerbation on quality of life in patients with chronic obstructive pulmonary disease. Am J Respir Crit Care Med. 1998;157(5 Pt 1):1418–1422. doi:10.1164/ajrccm.157.5.9709032
31. UK NCGC. Chronic Obstructive Pulmonary Disease: Management of Chronic Obstructive Pulmonary Disease in Adults in Primary and Secondary Care. London: Royal College of Physicians (UK); 2010.
32. Van Tho N, Ogawa E, Trang LT, et al. A mixed phenotype of airway wall thickening and emphysema is associated with dyspnea and hospitalization for chronic obstructive pulmonary disease. Ann Am Thorac Soc. 2015;12(7):988–996. doi:10.1513/AnnalsATS.201411-501OC
 © 2019 The Author(s). This work is published and licensed by Dove Medical Press Limited. The
full terms of this license are available at https://www.dovepress.com/terms
and incorporate the Creative Commons Attribution
- Non Commercial (unported, 3.0) License.
By accessing the work you hereby accept the Terms. Non-commercial uses of the work are permitted
without any further permission from Dove Medical Press Limited, provided the work is properly
attributed. For permission for commercial use of this work, please see paragraphs 4.2 and 5 of our Terms.
© 2019 The Author(s). This work is published and licensed by Dove Medical Press Limited. The
full terms of this license are available at https://www.dovepress.com/terms
and incorporate the Creative Commons Attribution
- Non Commercial (unported, 3.0) License.
By accessing the work you hereby accept the Terms. Non-commercial uses of the work are permitted
without any further permission from Dove Medical Press Limited, provided the work is properly
attributed. For permission for commercial use of this work, please see paragraphs 4.2 and 5 of our Terms.