Back to Journals » Cancer Management and Research » Volume 10
Identification of potential key genes associated with ovarian clear cell carcinoma
Received 11 September 2018
Accepted for publication 12 October 2018
Published 8 November 2018 Volume 2018:10 Pages 5461—5470
DOI https://doi.org/10.2147/CMAR.S187156
Checked for plagiarism Yes
Review by Single anonymous peer review
Peer reviewer comments 4
Editor who approved publication: Dr Antonella D'Anneo
This paper has been retracted
Youzheng Xu, Keng Shen=
Department of Obstetrics and Gynecology, Peking Union Medical College Hospital, Chinese Academy of Medical Sciences and Peking Union Medical College, Eastern District, Beijing 100730, China
Background: Ovarian cancer is the major cause of death from cancer among females worldwide. Ovarian clear cell carcinoma (OCCC) is considered a distinct histopathologic subtype with worse prognosis and resistance to conventional chemotherapy.
Materials and methods: We analyzed five microarray datasets derived from the Gene Expression Omnibus database. GEO2R tool was used to screen out differentially expressed genes (DEGs) between OCCC tumor and normal ovary tissue. Gene Ontology and Kyoto Encyclopedia of Genes and Genomes pathway enrichment analysis were performed using the g:Profiler database and Cytoscape. Based on Search Tool for the Retrieval of Interacting Genes, we performed protein–protein interaction (PPI) network analysis on the DEGs. Real-time PCR (RT-PCR) and Western blotting in frozen samples of normal ovary and OCCC were performed to verify the expression difference of hub genes in OCCC patients.
Results: Thirty upregulated DEGs and 13 downregulated DEGs were identified by cross referencing. Six were chosen as hub genes with high connectivity degree via PPI network analysis, including two upregulated and four downregulated. RT-PCR and Western blotting results showed significant expression difference of the two upregulated genes, SPP1 and EPCAM, between tumor and normal tissues.
Conclusion: Our research suggests that SPP1 and EPCAM are overexpressed in OCCC compared with normal ovary tissue. Clinical study of large sample is required to evaluate the value of SPP1 and EPCAM in the precision treatment and prognostic influence on OCCC in the future.
Keywords: ovarian clear cell carcinoma, differentially expressed genes, SPP1, EPCAM
Introduction
Ovarian cancer accounts for about 4% of worldwide cancer incidence and mortality among women. As the seventh most common cancer and the eighth leading cause of cancer-related death in 2012 with 238,700 cases and 151,900 deaths,1 ovarian cancer has nonspecific symptoms, causing more than 60% of cases to be diagnosed at late stage, with a 5-year survival rate of 30%–40% in most countries.2 Ovarian clear cell carcinoma (OCCC) is considered a rather intriguing subtype among ovarian cancers due to its distinct histopathologic subtype, worse prognosis, and resistance to conventional platinum-based chemotherapy. Studies showed that OCCC has higher prevalence rate in East Asia (15%–25%) than in North America and Europe (1%–12%) due to race difference.3 OCCC occupies less than 5% of all ovarian cancers.4 An increased body mass index >30 and endometriosis are associated with this histological subtype on the basis of several studies with an OR of 2.2–2.3.5
High levels of vascular endothelial factor (vascular endothelial growth factor) expression were revealed in OCCC, correlating with shorter survival. Upregulation of IL-6/STAT-3/hypoxia-inducible factor signaling can also be found in OCCC, which is fundamental in hypoxia-induced angiogenesis.6 HER2 is overexpressed in 14% of OCCCs,7 suggesting a further potential therapeutic agent. Regarding somatic mutations of OCCC, mutations of PIK3CA (32%–33%), ARID1A (46%), KRAS, and BRAF are frequently presented.8–10
Though rarely seen, reliable genetic diagnosis and target therapy for the precise treatment of OCCC patients are needed as its poor prognosis and resistance in chemotherapy. Both clinical approaches and genomic approaches are necessary in this quest.11 However, low incidence of OCCC and small number of samples bring obstacles in clinical trial, experimental research, and genomic analysis.
In this study, bioinformatical methods were applied to detect the differentially expressed genes (DEGs) between OCCC and normal human ovary tissue on gene expression profiling data downloaded from the Gene Expression Omnibus (GEO) database. Gene Ontology (GO) function and Kyoto Encyclopedia of Genes and Genomes (KEGG) pathway enrichment analysis and protein–protein interaction (PPI) network analysis were performed to detect novel indicators of OCCC patients and endeavor to provide potential therapeutic targets for this unique disease.
Materials and methods
Microarray data download and processing
The gene expression profiles of GSE6008, GSE29450, GSE18520, GSE54388, and GSE63885 were downloaded from GEO database (https://www.ncbi.nlm.nih.gov/geo/). GSE6008 was based on GPL96 [HG-U133A] Affymetrix Human Genome U133A array platform. GSE29450, GSE18520, GSE54388, and GSE63885 were based on GPL570 [HG-U133_Plus_2] Affymetrix Human Genome U133 plus 2.0 array platform. GSE63885 contains no normal ovary tissue samples, while GSE18520 and GSE54388 contain no OCCC tissue samples; these three datasets were merged into one named “Dataset C” before further analysis. The original CDF files of the platform and CEL files of the arrays were downloaded from GEO website and Gene Chip Robust Multichip Average was used for normalization, which can adjust the background intensity and normalize the probe intensity of Affymetrix data in the merging process. The data after normalization are exported as Dataset C and analyzed. All datasets were renormalized at the probe level before analysis. All of the data were freely available online.
Tumor and normal ovary samples
Four tumor samples came from four OCCC patients treated at the Peking Union Medical College Hospital, Beijing, China. All patients had been treated with initial cytoreductive surgery followed by platinum-based chemotherapy. Four normal ovary tissue samples came from four benign disease patients surgically treated at the Peking Union Medical College Hospital. All samples were stored in liquid nitrogen tank after dissection. This study was approved by the ethics committee of Peking Union Medical College Hospital. All patients provided written informed consent before the study. This was conducted in accordance with the Declaration of Helsinki. All data were de-identified.
Data processing of DEGs
The GEO2R online analysis tool (https://www.ncbi.nlm.nih.gov/geo/geo2r/) was used to detect the DEGs between OCCC and normal samples, and the adjusted P-value and |log2FC| were calculated. Genes that met the cutoff criteria, adjusted P<0.05 and |log2FC|>2.0, were considered as DEGs. Each dataset owns unique DEGs. Venn diagram tool (online) (http://bioinfogp.cnb.csic.es/tools/venny) was used to analyze overlapping components.
GO and KEGG pathway analysis of DEGs
GO analysis divides gene functions into biological process (BP), molecular function (MF), and cellular component (CC). KEGG analyzes genomes, biological pathways, diseases, chemical substances, and drugs on the DEGs. g:Profiler database (https://biit.cs.ut.ee/gprofiler/) and Cytoscape platform were used to identify the pathways and functional annotation of found genes and visualization of results. P<0.05 and gene counts >10 were considered statistically significant.
PPI network and module analysis
To evaluate the interactive relationships among DEGs, we mapped the DEGs to the Search Tool for the Retrieval of Interacting Genes (STRING) database (http://string-db.org/) with a combined score >0.4. PPI networks were constructed using the Cytoscape software. Nodes with higher degree of connectivity tend to be more essential in the functional network. The top six genes with degree of connectivity >10 were identified as hub genes.
Real-time PCR
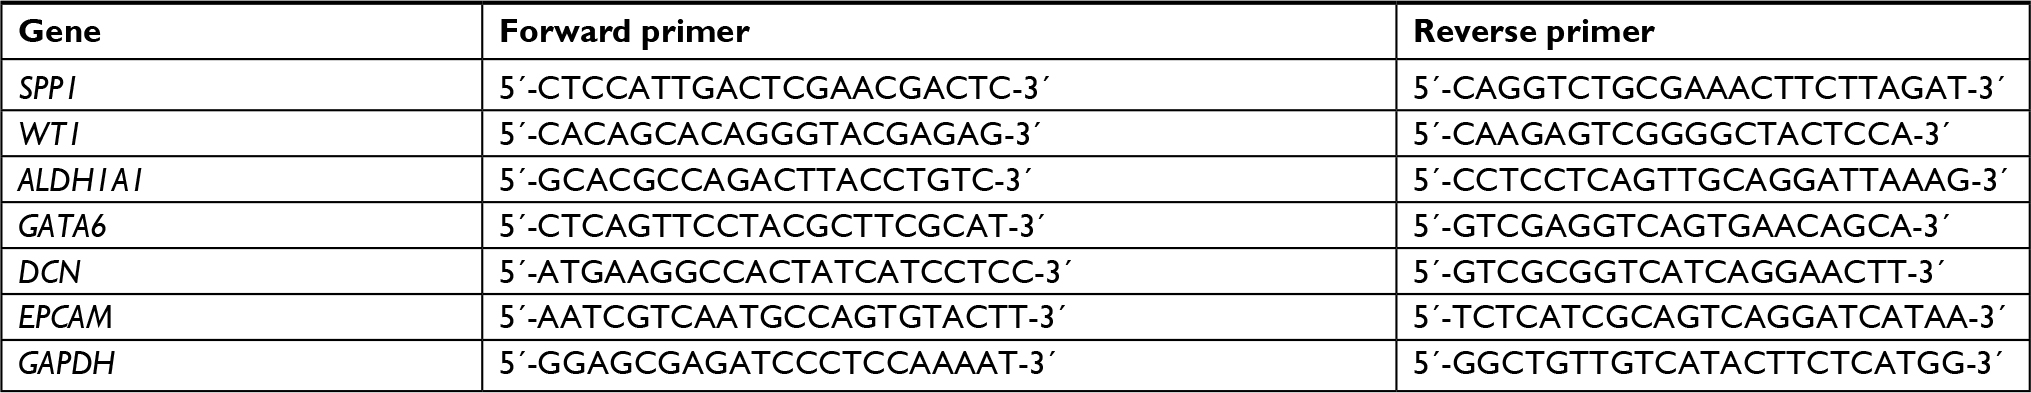
Total RNA was isolated from tissues with TRIzol reagent (Invitrogen) according to the manufacturer’s instructions. Complementary DNA was synthesized by reverse transcription GoScript™ Reverse Transcription System (Promega, Madison, WS, USA). Quantitative real-time PCR (qPCR) analysis used the GoTaq® qPCR Master Mix (Promega). The primer sets are shown in Table S1. The PCR amplification was performed for 40 cycles of 95ºC for 5 seconds and 60ºC for 30 seconds, and melting curve reaction was performed at the end. All data analyses were operated using the 7500 Fast Real-Time PCR Systems (Applied Biosystems). The ΔΔCt method was used to assess the relative expression of different genes.
Western blotting analysis
Tissues were collected and lysed in RIPA (Thermo Fisher Scientific, Waltham, MA, USA) buffer supplemented with phenyl-methane-sulfonyl fluoride (Boster Biology, Pleasanton, CA, USA). The concentration of protein samples was detected using a BCA Protein Assay Kit (Beyotime Institute of Biotechnology). Equal amounts of lysates were separated by 10% SDS-PAGE gels and transferred to polyvinylidene difluoride membranes. Membranes were blocked for 1 hour in BSA blocking buffer (Solarbio Life Sciences, Beijing, China) and probed with primary antibodies (at a dilution of 1:1,000) at 4ºC for 12 hours (rabbit monoclonal to WT1, research resource identifier (RRID): ab89901; rabbit polyclonal to SPP1, RRID: ab8448; rabbit polyclonal to DCN, RRID: ab175404; rabbit polyclonal to EPCAM, RRID: ab71916; rabbit monoclonal to ALDH1A1, RRID: ab52492; rabbit polyclonal to Gata6, RRID: ab22600; and rabbit polyclonal to beta actin, RRID: ab8227). All were purchased from Abcam Corporation. Then they were incubated with the specific horse radish peroxidase (HRP)-conjugated secondary antibody (goat antirabbit IgG HRP [ab6721] from Abcam) for 2 hours before developing with the ECL kit (Merck Millipore, Kenilworth, NJ, USA). Data analysis was performed using ImageJ software to evaluate the expression levels of proteins. Statistical analysis was performed using SPSS 17.0 software (IBM Corp., Armonk, NY, USA) and with GraphPad Prism, version 5 (GraphPad Software). Statistically significant differences (P<0.01) were determined by Student’s t-test or ANOVA in the RT-PCR test and Western blotting analysis, presented as mean ± SD.
Results
Identification of DEGs
Five microarray datasets (GSE6008, GSE29450, GSE18520, GSE54388, and GSE63885) and the number of tumor and normal ovary tissue samples are shown in Table 1. GSE63885 contains no normal ovary tissue samples. GSE18520 and GSE54388 contain no OCCC tissue samples. To accomplish the comparison between normal ovary tissue and tumor, these three datasets were merged into one named “Dataset C”. The GEO2R online analysis tool was used to identify DEGs separately with the cutoff criteria, adjusted P<0.05 and |log2FC|>2.0 (Table 1), to compare OCCC samples with normal ovary samples. DEGs expression heat maps and volcano plots are shown in Figures 1 and 2. Venn analysis was performed to get the intersection of the DEG profiles (Figure 3). Finally, 43 DEGs were significantly differentially expressed among all three groups, of which 30 were significantly upregulated genes and 13 were downregulated genes.
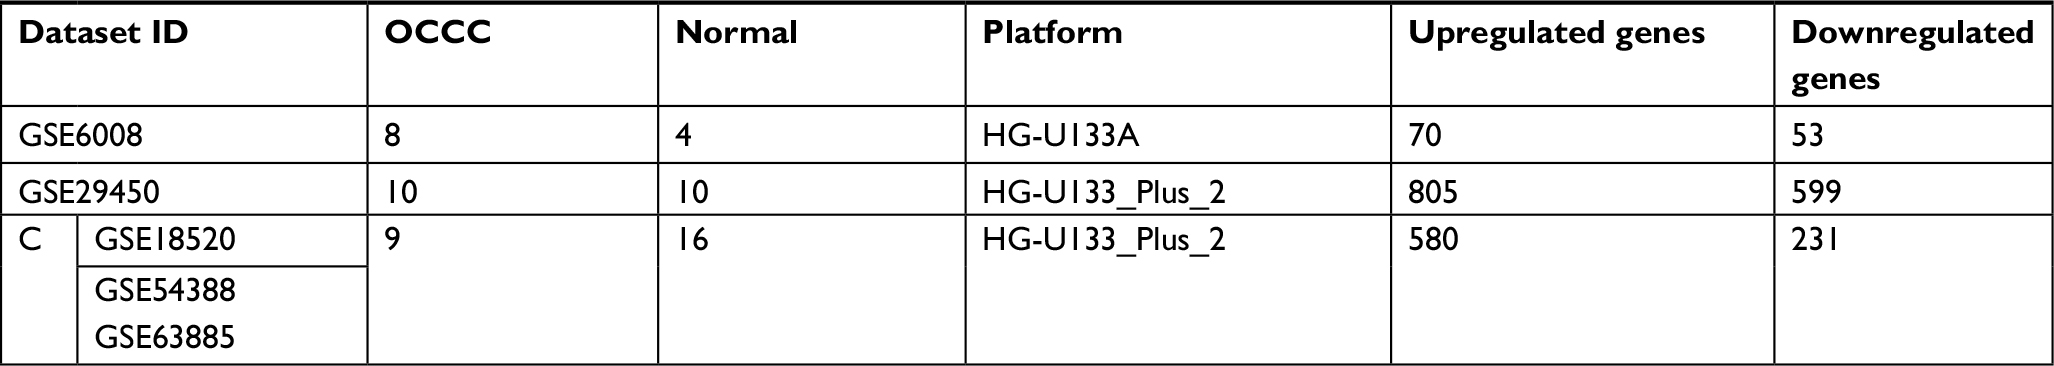 | Table 1 Three analyzed datasets and corresponding DEGs Abbreviations: DEGs, differentially expressed genes; OCCC, ovarian clear cell carcinoma. |
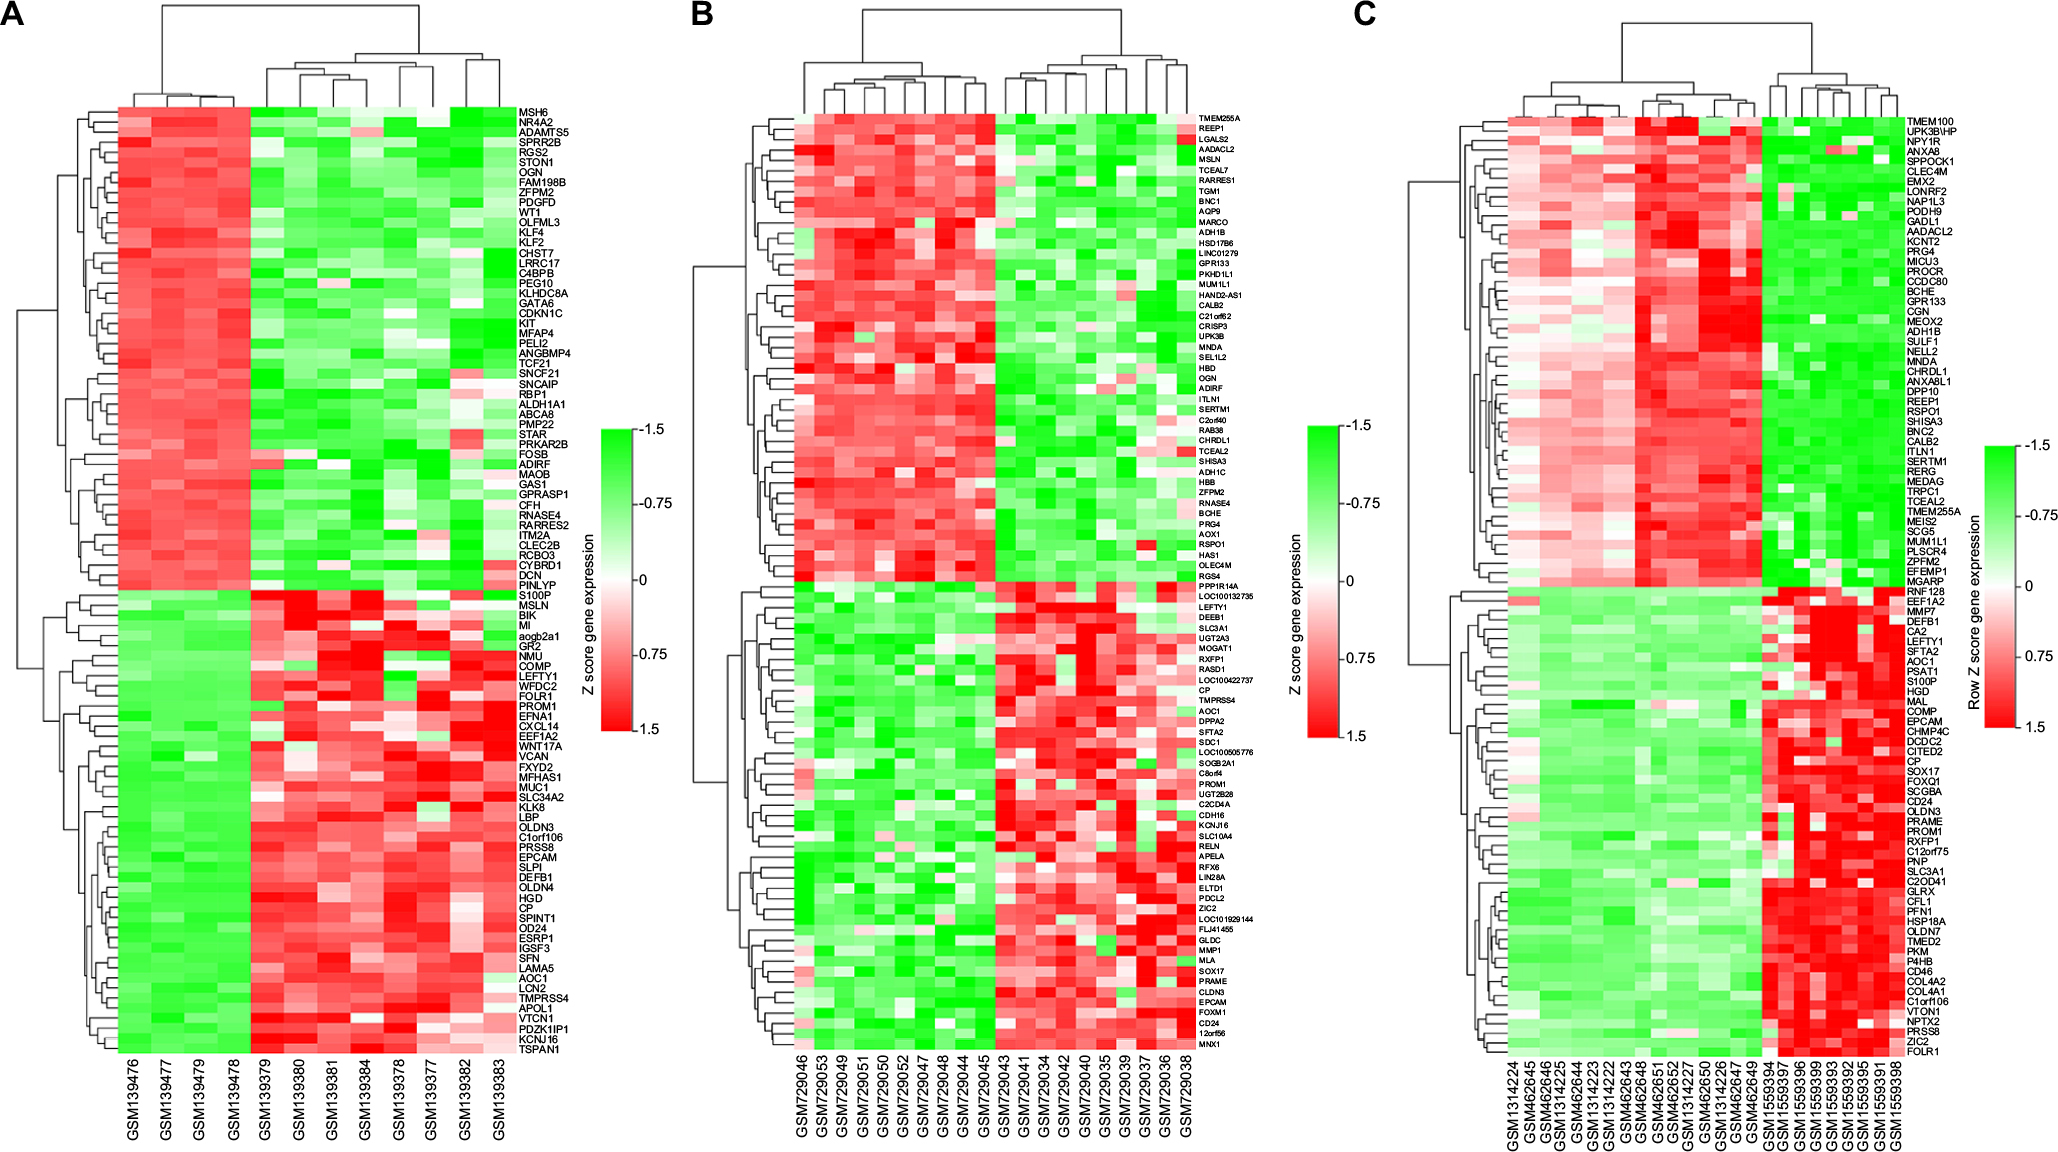 | Figure 1 Heat maps of the differentially expressed genes of (A) GSE6008, (B) GSE29450, and (C) Dataset C. Note: Red: upregulation; green: downregulation. |
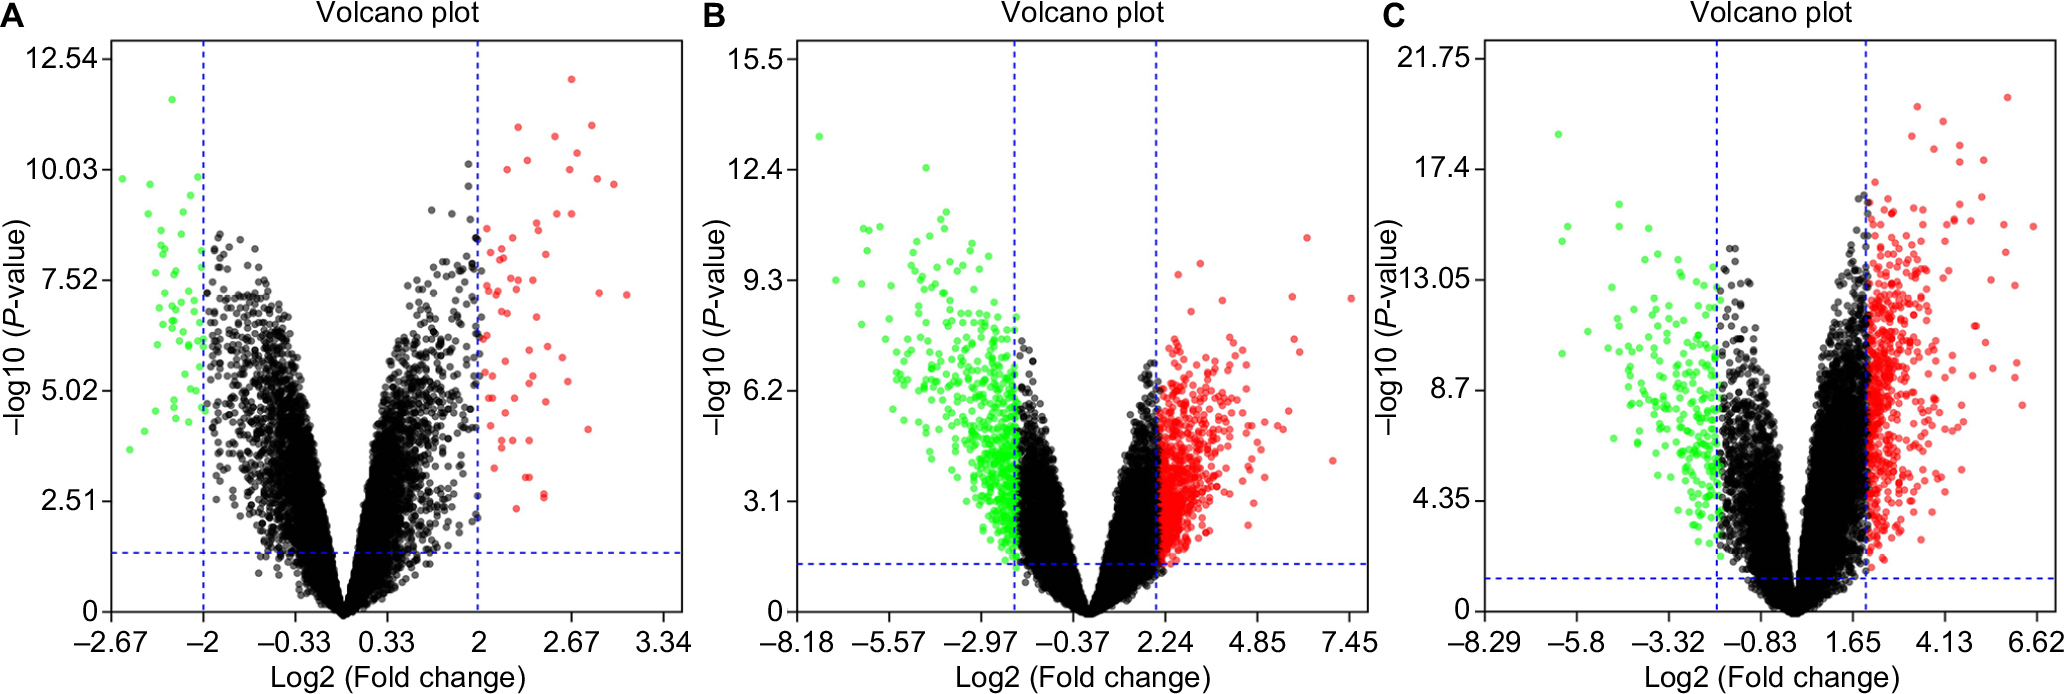 | Figure 2 Volcano plots of the differentially expressed genes of (A) GSE6008, (B) GSE29450, and (C) Dataset C. Note: Red: upregulation; green: downregulation. |
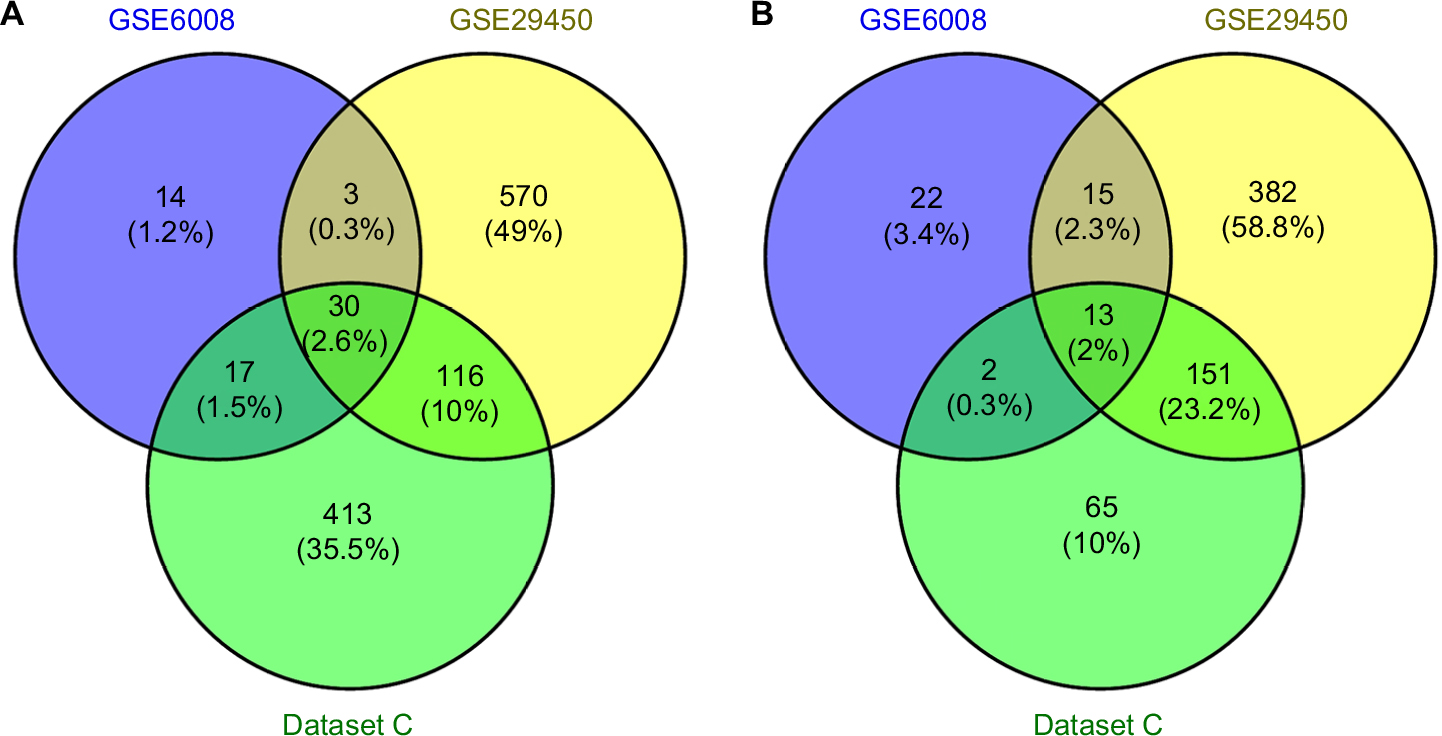 | Figure 3 Venn diagram of DEGs common to all three datasets. Notes: (A) Upregulated genes. (B) Downregulated genes. Abbreviation: DEGs, differentially expressed genes. |
GO function and KEGG pathway enrichment analysis of DEGs g: Profiler were used to analyze GO function and KEGG pathway enrichment for DEGs (Table 2). The enriched GO terms were divided into CC, BP, and MF ontologies. DEGs were mainly enriched in BPs, including tissue development, epithelium development, epithelial cell differentiation, tube development, organ development, and morphogenesis. MF analysis showed that the DEGs were significantly enriched in protein binding. For cell component, the DEGs were enriched in extracellular region, organelle, and space. The results of KEGG pathway analysis showed that DEGs were mainly enriched in extracellular matrix (ECM)-receptor interaction pathway and TGF-beta signaling pathway.
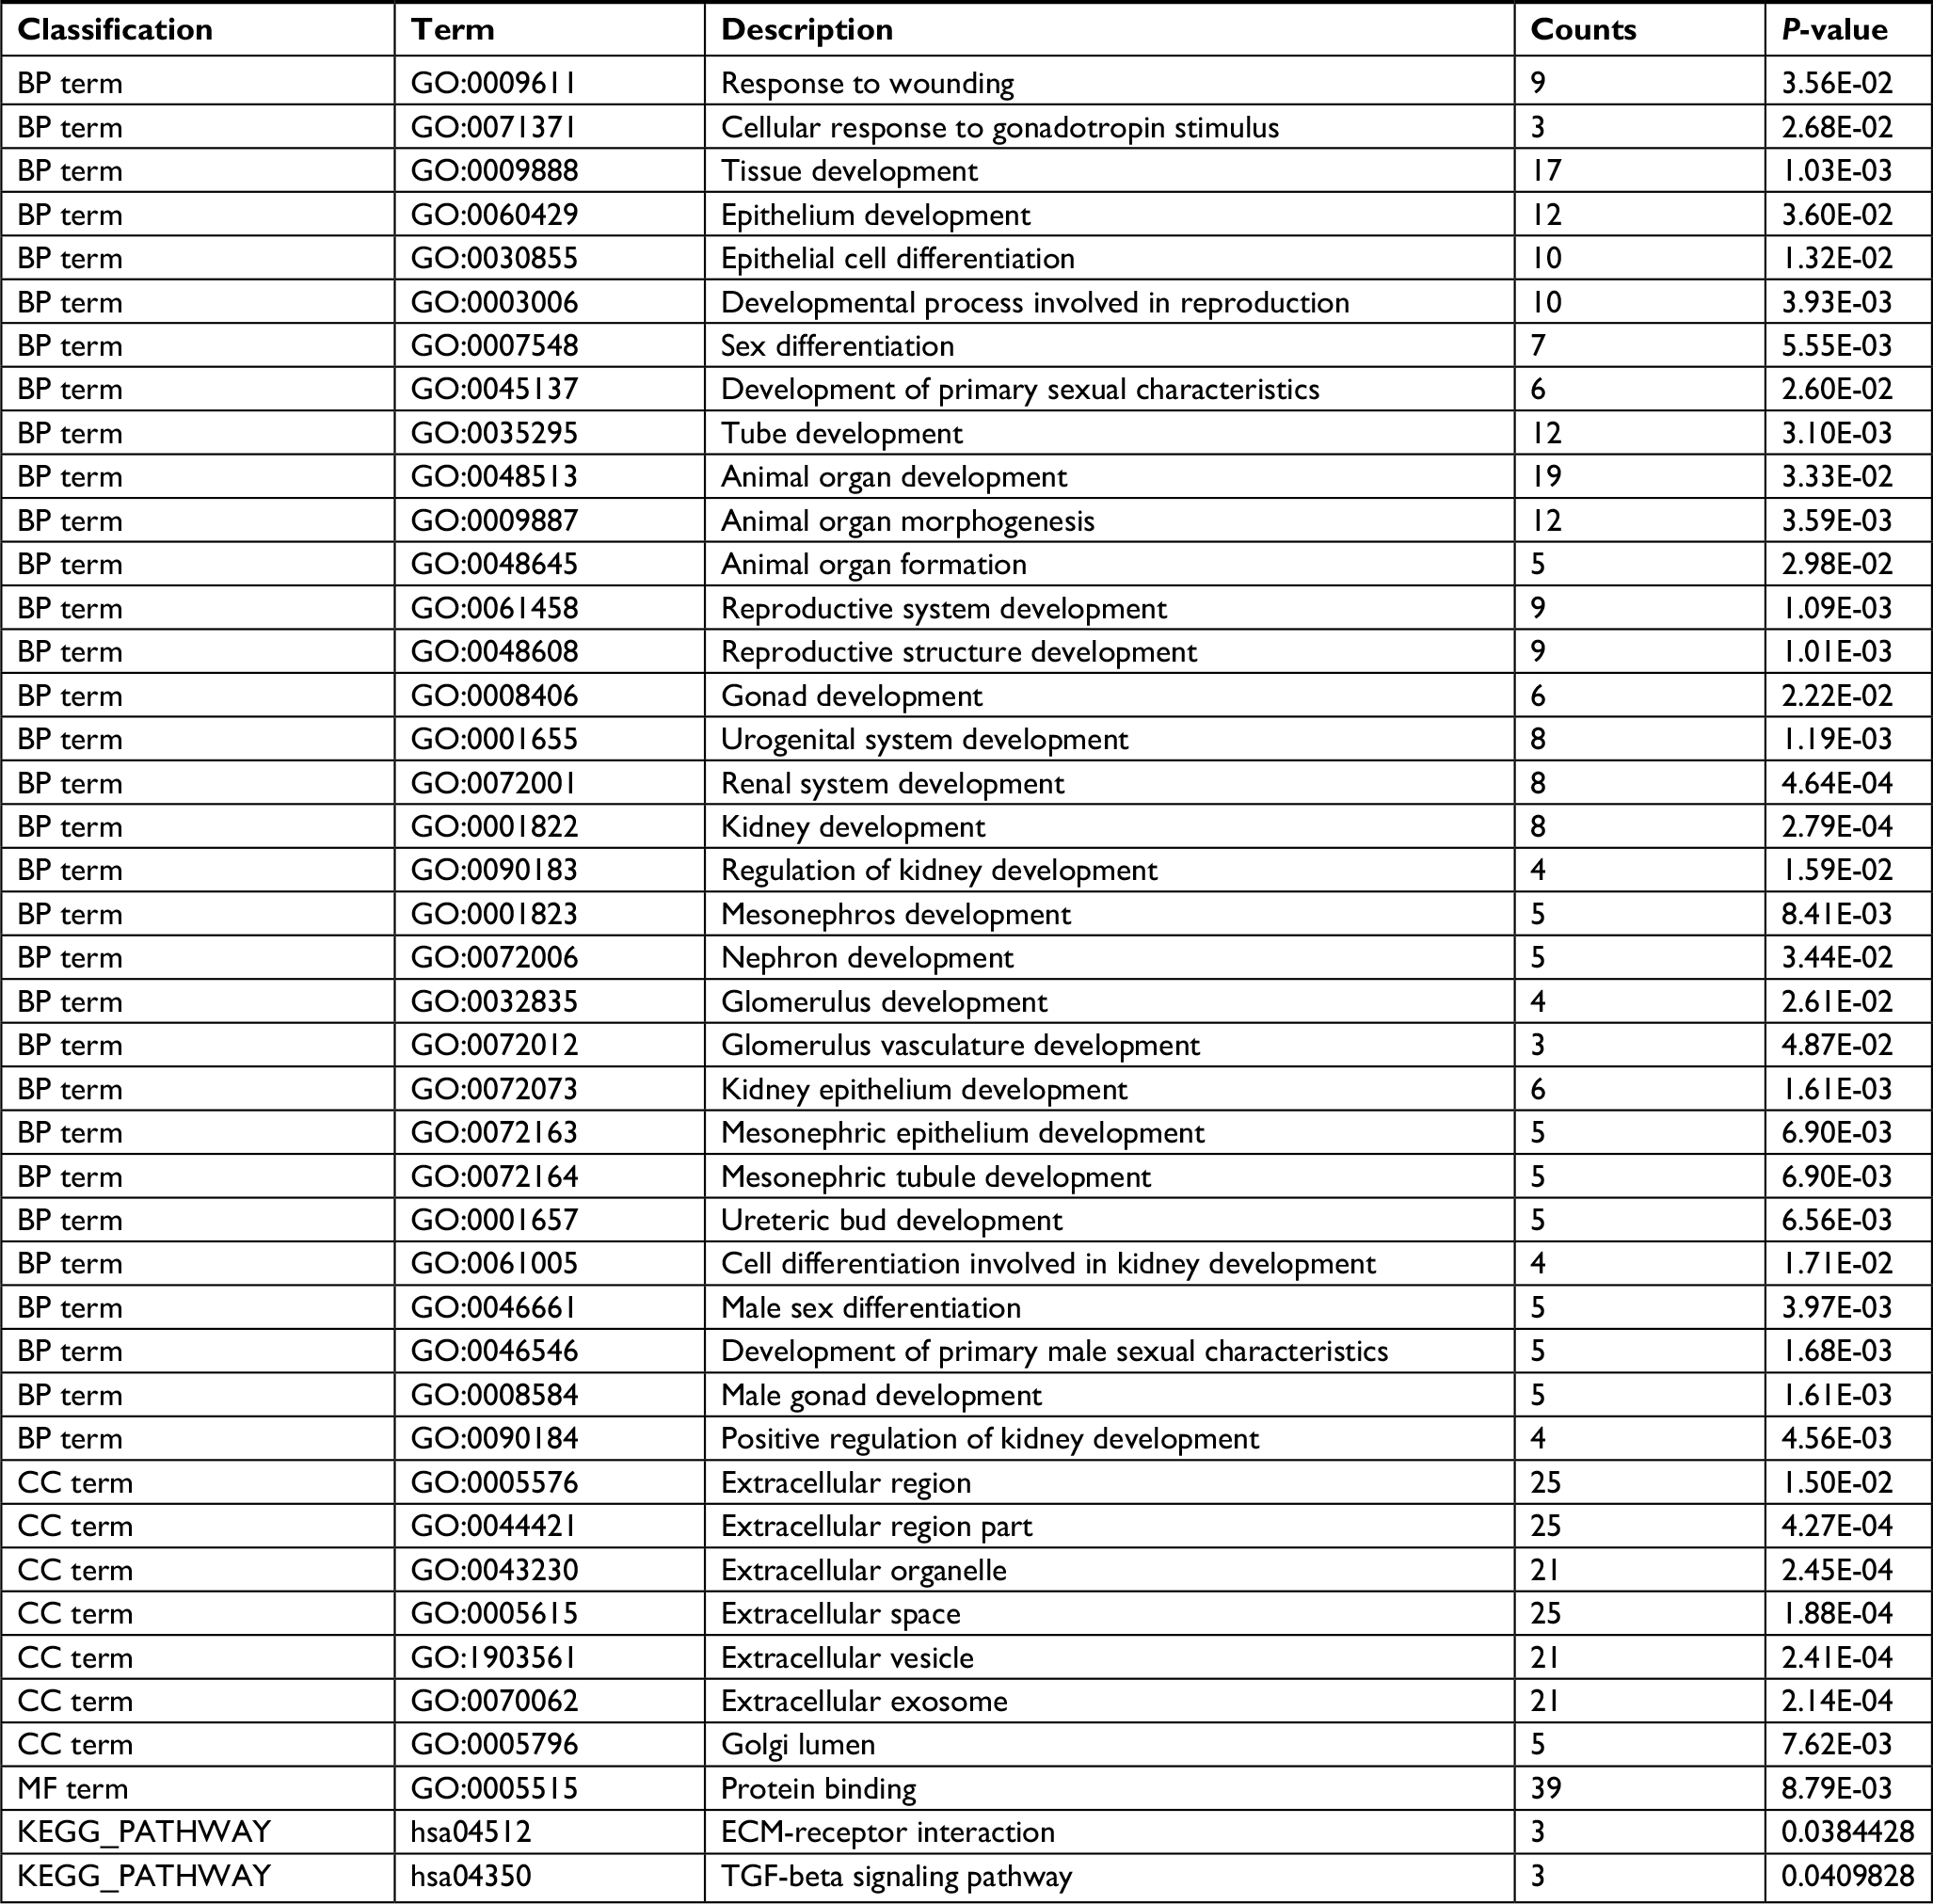 | Table 2 Significantly enriched GO terms and KEGG pathways of DEGs Abbreviations: BP, biological process; CC, cellular component; DEGs, differentially expressed genes; ECM, extracellular matrix; GO, Gene Ontology; KEGG, Kyoto Encyclopedia of Genes and Genomes; MF, molecular function. |
PPI network analysis
To explore the potential relationship between the aberrantly expressed genes, we performed a PPI network analysis with the online software STRING (score >0.4). Results were visualized by Cytoscape, as presented in Figure 4. The top six genes evaluated by connectivity degree in the PPI network were identified (Table 3). Two of these hub genes (SPP1, EPCAM) are upregulated in OCCC.
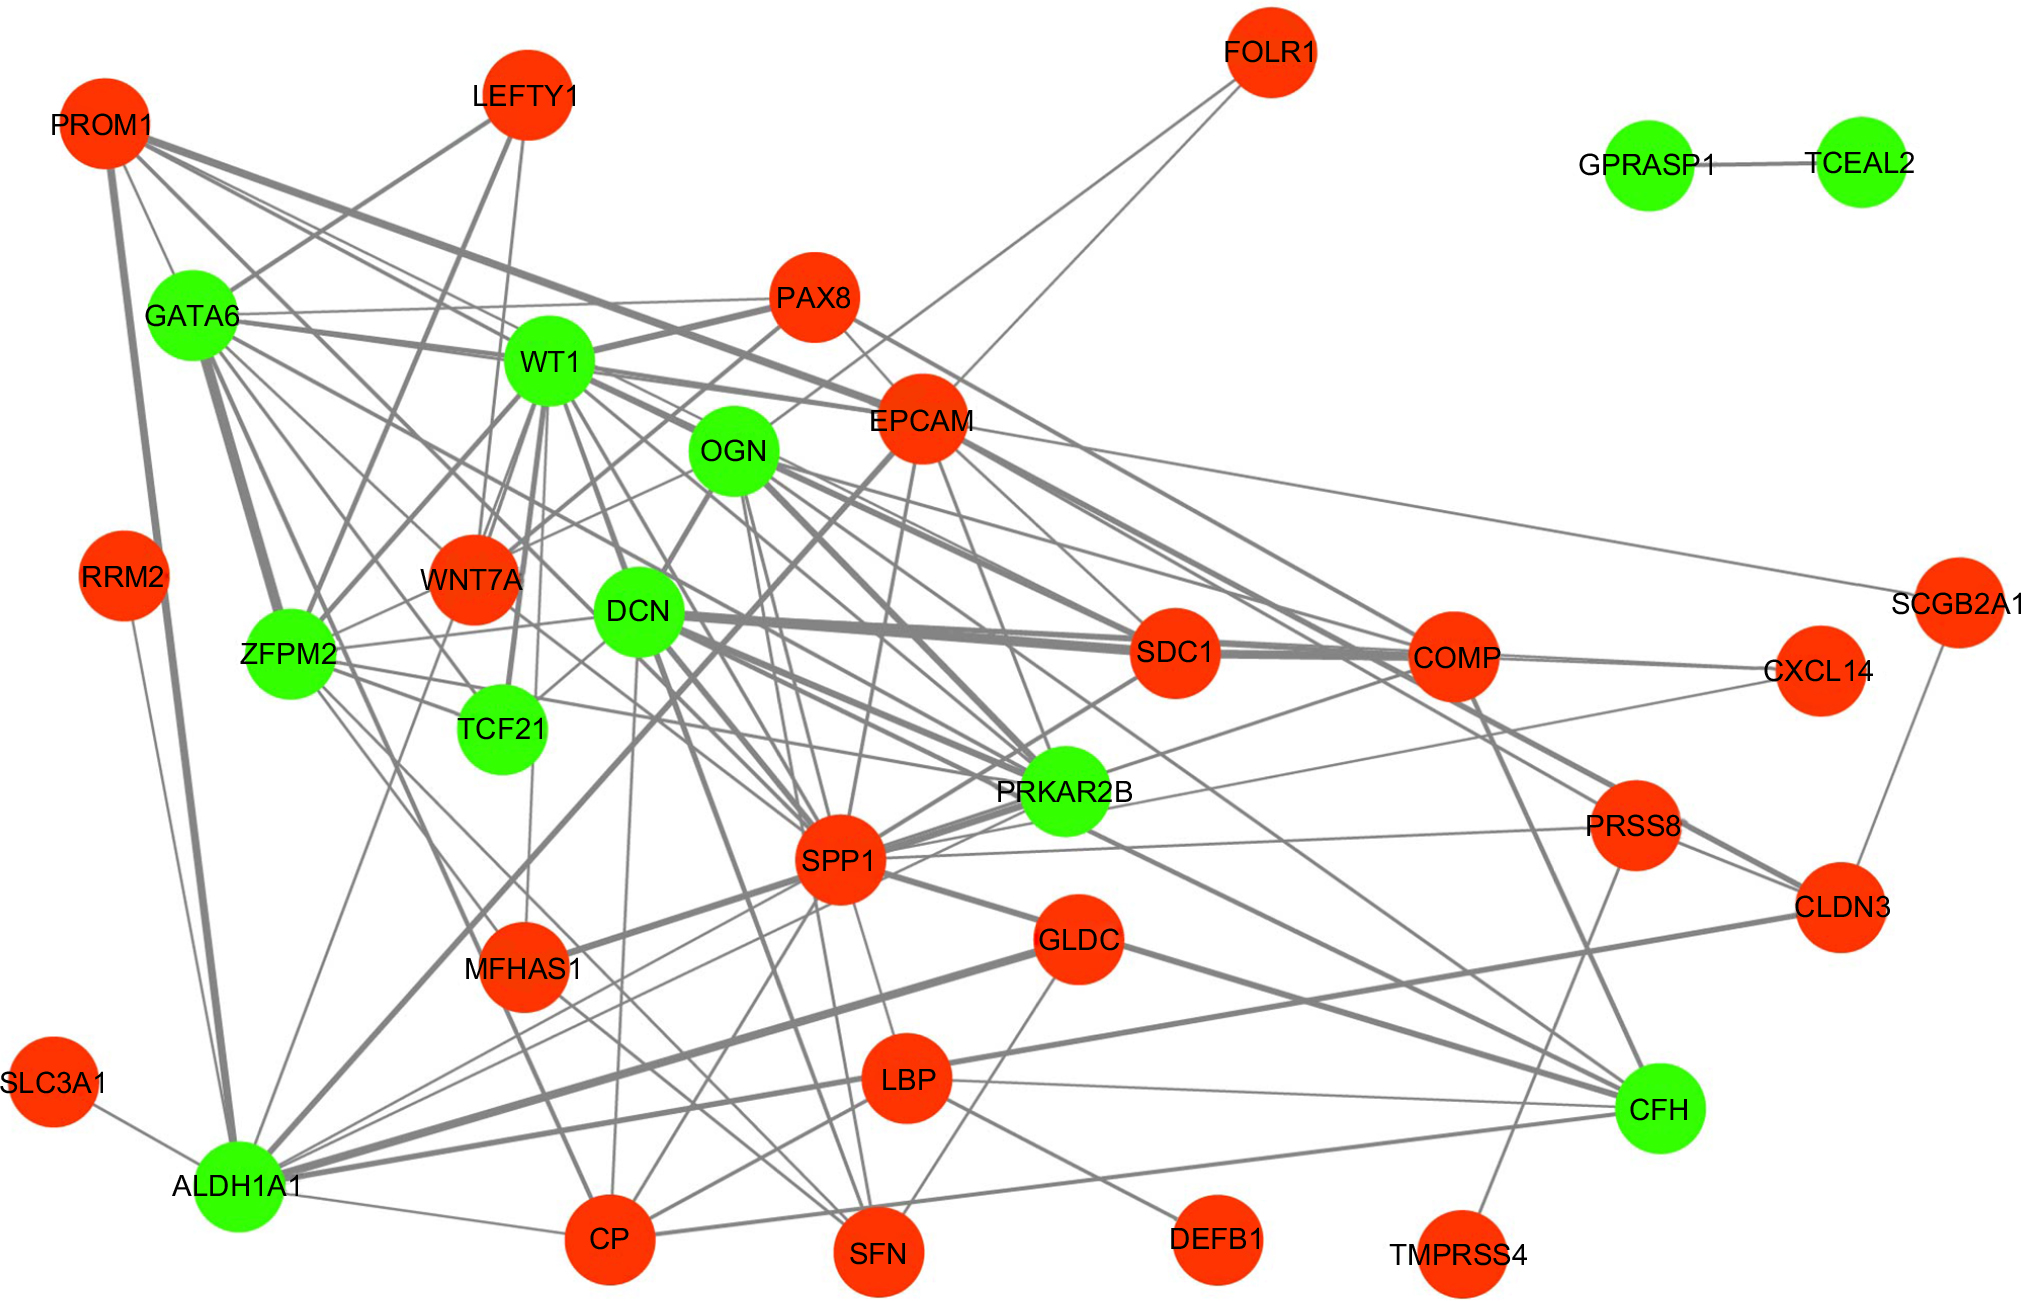 | Figure 4 Protein–protein interaction network constructed with the differentially expressed genes. Notes: Red nodes represent upregulated genes. Green nodes represent downregulated genes. |
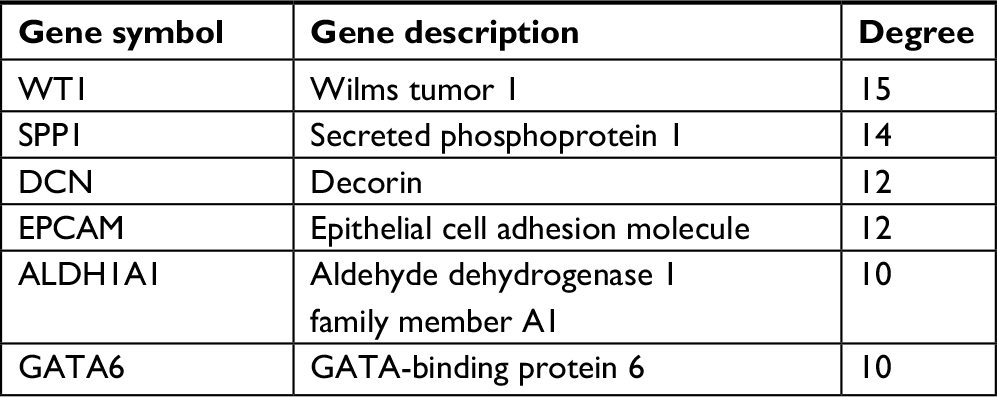 | Table 3 Top six hub genes with higher degree of connectivity |
RT-PCR and western blotting analysis
We used four OCCC tumor tissue samples and four normal ovary tissue samples to evaluate the expression level of the six hub genes by RT-PCR and Western blotting analysis. As is shown in Figure 5A, B, mRNA and protein levels of both SPP1 and EPCAM were significantly upregulated in carcinoma than normal tissues (P<0.01). However, the other four downregulated genes showed no significant difference between two groups.
 | Figure 5 The expression levels of proteins (A) and mRNAs (B) of six hub genes in two groups of samples. Note: *Means the difference is statistically significant (P<0.01). |
Discussion
OCCC is a distinct histopathologic subtype of ovarian cancer. Other than the common characteristics of nonspecific symptoms and low survival rate of ovarian cancer, OCCC shows worse prognosis and resistance to conventional platinum-based chemotherapy, resulting in substantial obstacles for cancer treatment. Although OCCC only occupies less than 5% of all ovarian cancers, efforts have been devoted into the clinical and experimental research on OCCC, in which reliable genetic diagnosis and target therapy remain essential but unclear. Both clinical and genomic approaches are necessary in this quest. However, low incidence of OCCC and small number of samples bring obstacles in clinical trial, experimental research, and genomic analysis.
In the present study, five gene expression datasets were retrieved from GEO, including microarray information of 27 OCCC samples and 30 normal ovary samples. Gene expression and protein–protein expression analyses based on public databases were performed to identify potential key genes correlated with OCCC and screen out DEGs. We identified 30 upregulated DEGs and 13 downregulated DEGs, which were mainly enriched in BPs in GO analysis, including tissue development, epithelium development, epithelial cell differentiation, tube development, organ development, and morphogenesis. MF analysis showed that the DEGs were significantly enriched in protein binding. For cell component, the DEGs were enriched in extracellular region and organelle. The results of KEGG pathway analysis showed that DEGs were mainly enriched in ECM-receptor interaction pathway and TGF-beta signaling pathway.
By PPI network analysis, six hub genes were identified, including WT1, SPP1, DCN, EPCAM, ALDH1A1, and GATA6, two of which (SPP1, EPCAM) are upregulated in OCCC. Four OCCC tumor tissue samples and four normal ovary tissue samples were used to evaluate the expression level of the six hub genes by RT-PCR and Western blotting analysis. mRNA and protein levels of both SPP1 and EPCAM were significantly upregulated in tumor than normal tissues while no significant expression difference between groups was found for the other four downregulated genes .
EPCAM is a epithelial cell adhesion molecule (CAM) that does not belong to any of the four CAMs families (cadherins, selectins, integrins, and immunoglobulin-like CAMs) and discovered as one of the first cancer markers.12 It is a cell surface glycoprotein of ~40 kDa and is highly expressed in epithelial cancers. EPCAM may play key roles in the progression of ovarian cancer through promoting migration, proliferation, inhibiting cell apoptosis and adhesion, and disturbing cell cycle. It may be used as specific therapeutic targets in the treatment of ovarian cancer.13 EPCAM is suggested to be the DEGs between ovarian carcinomas and normal ovarian epithelium, indicating its involvement in the pathogenesis of ovarian cancer.14,15 Battista et al found that overexpression of EPCAM retains its significance independent of established prognostic factors for longer progression-free survival (PFS) (HR, 0.408; 95% CI, 0.197–0.846; P=0.003) but not for PFS (HR, 0.666; 95% CI, 0.366–1.212; P=0.183).16 Another study indicated a significant association of EPCAM overexpression with a more favorable survival in epithelial ovarian cancer patients. Serous cancers showed a significant EPCAM overexpression compared with mucinous types in ovarian carcinoma.17 In addition, serum EPCAM level was found to be a diagnostic marker in epithelial ovarian cancer patients.18
Secreted phosphoprotein 1 (SPP1) is a secreted arginine glycine aspartic acid containing phosphorylated glycoprotein, with a molecular weight of about 325 kDa.19 The human SPP1 gene is located on chromosome 4 with seven exons and six introns.20 The expression of SPP1 is strongly related to tumor metastasis in gastric cancer and esophageal adenocarcinoma.21–23 Previous studies showed that SPP1 is highly expressed in many kinds of tumors, such as colon cancer, prostate cancer, lung cancer, and breast cancer.24–26 Modulation of vascular endothelial growth factor expression and regulation of extracellular matrix protein are the classic pathways in which SPP1 facilitates cancer progression.27,28 Recent study of SPP1 in epithelial ovarian cancer reveals that the expression of SPP1 was higher in cancer tissues than in normal ovarian tissues. And it could be a useful biomarker in diagnosis of ovarian cancer with the diagnostic sensitivity and specificity of 0.66 (95% CI, 0.51–0.78) and 0.88 (95% CI, 0.78–0.93), respectively.29 Silencing SPP1 decreased the cell proliferation, migration, and invasion in vitro and prevented ovarian cancer growth in mice, during which the integrin β1/FAK/AKT pathway was simultaneously inhibited.30 However, the expression and function of SPP1 in OCCC remain unclear. Therefore, SPP1 may be a prognostic factor and potential therapeutic target for OCCC. However, larger multicenter analysis is still needed to confirm these results.
In our study, WT1, DCN, ALDH1A1, and GATA6 were downregulated in cancer compared to normal tissues by bioinformatic analysis. However, the RT-PCR and Western blotting analysis suggest otherwise. The role of these genes in OCCC is not clear. Experimental research of the biological functions of these genes in cancer cell lines is needed in the following study and can be illustrated in the future. Studies of large sample are required to evaluate the value of SPP1, EPCAM, and other genes in the prognostic evaluation and precise treatment of OCCC.
Conclusion
Our research identified six hub genes as potential key genes of OCCC by bioinformatic analysis. SPP1 and EPCAM are overexpressed in OCCC compared with normal ovary tissue. Experimental research is needed to reveal the biological functions of these genes in cancer cell lines. Clinical study of large sample is required to evaluate the value of SPP1 and EPCAM in the precision treatment and prognostic influence on OCCC.
Acknowledgments
This study was funded by the National Natural Science Foundation of China (81572576 [Shen Keng]) and the Chinese Academy of Medical Sciences (CAMS) Initiative for Innovative Medicine (CAMS-2018-12M-1-002 [Keng Shen]).
Author contributions
All authors contributed to data analysis, drafting and revising the article, gave final approval of the version to be published, and agree to be accountable for all aspects of the work.
Disclosure
The authors report no conflicts of interest in this work.
References
Torre LA, Islami F, Siegel RL, Ward EM, Jemal A. Global cancer in women: burden and trends. Cancer Epidemiol Biomarkers Prev. 2017;26(4):444–457. | ||
Allemani C, Weir HK, Carreira H, et al. Global surveillance of cancer survival 1995-2009: analysis of individual data for 25,676,887 patients from 279 population-based registries in 67 countries (CONCORD-2). Lancet. 2015;385(9972):977–1010. | ||
Schnack TH, Høgdall E, Nedergaard L, Høgdall C. Demographic clinical and prognostic factors of primary ovarian adenocarcinomas of serous and clear cell histology – a comparative study. Int J Gynecol Cancer. 2016;26(1):82–90. | ||
Kim SI, Lee JW, Lee M, et al. Genomic landscape of ovarian clear cell carcinoma via whole exome sequencing. Gynecol Oncol. 2018;148(2):375–382. | ||
Pearce CL, Templeman C, Rossing MA, et al. Association between endometriosis and risk of histological subtypes of ovarian cancer: a pooled analysis of case-control studies. Lancet Oncol. 2012;13(4):385–394. | ||
Mabuchi S, Kawase C, Altomare DA, et al. Vascular endothelial growth factor is a promising therapeutic target for the treatment of clear cell carcinoma of the ovary. Mol Cancer Ther. 2010;9(8):2411–2422. | ||
Tan DS, Iravani M, McCluggage WG, et al. Genomic analysis reveals the molecular heterogeneity of ovarian clear cell carcinomas. Clin Cancer Res. 2011;17(6):1521–1534. | ||
Gadducci A, Lanfredini N, Tana R. Novel insights on the malignant transformation of endometriosis into ovarian carcinoma. Gynecol Endocrinol. 2014;30(9):612–617. | ||
Nagao-Kitamoto H, Shreiner AB, Gillilland MG, et al. Functional characterization of inflammatory bowel disease-associated gut dysbiosis in gnotobiotic mice. Cell Mol Gastroenterol Hepatol. 2016;2(4):468–481. | ||
Yamamoto S, Tsuda H, Takano M, Tamai S, Matsubara O. Loss of ARID1A protein expression occurs as an early event in ovarian clear-cell carcinoma development and frequently coexists with PIK3CA mutations. Mod Pathol. 2012;25(4):615–624. | ||
Cancer Genome Atlas Research Network. Integrated genomic analyses of ovarian carcinoma. Nature. 2011;474(7353):609–615. | ||
Trzpis M, McLaughlin PM, de Leij LM, Harmsen MC. Epithelial cell adhesion molecule: more than a carcinoma marker and adhesion molecule. Am J Pathol. 2007;171(2):386–395. | ||
Wang G, Zhang Z, Ren Y. TROP-1/Ep-CAM and CD24 are potential candidates for ovarian cancer therapy. Int J Clin Exp Pathol. 2015;8(5):4705–4714. | ||
Winge MC, Hoppe T, Berne B, et al. Filaggrin genotype determines functional and molecular alterations in skin of patients with atopic dermatitis and ichthyosis vulgaris. PLoS One. 2011;6(12):e28254. | ||
Thyssen JP, Kezic S. Causes of epidermal filaggrin reduction and their role in the pathogenesis of atopic dermatitis. J Allergy Clin Immunol. 2014;134(4):792–799. | ||
Battista MJ, Cotarelo C, Jakobi S, et al. Overexpression of epithelial cell adhesion molecule protein is associated with favorable prognosis in an unselected cohort of ovarian cancer patients. J Cancer Res Clin Oncol. 2014;140(7):1097–1102. | ||
Woopen H, Pietzner K, Richter R, et al. Overexpression of the epithelial cell adhesion molecule is associated with a more favorable prognosis and response to platinum-based chemotherapy in ovarian cancer. J Gynecol Oncol. 2014;25(3):221–228. | ||
Tas F, Karabulut S, Serilmez M, Ciftci R, Duranyildiz D. Clinical significance of serum epithelial cell adhesion molecule (EPCAM) and vascular cell adhesion molecule-1 (VCAM-1) levels in patients with epithelial ovarian cancer. Tumour Biol. 2014;35(4):3095–3102. | ||
Oldberg A, Franzén A, Heinegård D. Cloning and sequence analysis of rat bone sialoprotein (osteopontin) cDNA reveals an Arg-Gly-Asp cell-binding sequence. Proc Natl Acad Sci U S A. 1986;83(23):8819–8823. | ||
Saitoh Y, Kuratsu J, Takeshima H, Yamamoto S, Ushio Y. Expression of osteopontin in human glioma. Its correlation with the malignancy. Lab Invest. 1995;72(1):55–63. | ||
Lin J, Myers AL, Wang Z, et al. Osteopontin (OPN/SPP1) isoforms collectively enhance tumor cell invasion and dissemination in esophageal adenocarcinoma. Oncotarget. 2015;6(26):22239–22257. | ||
Weng S, Zhou L, Han L, Yuan Y. Expression and purification of non-tagged recombinant mouse SPP1 in E. coli and its biological significance. Bioengineered. 2014;5(6):405–408. | ||
Zhuo C, Li X, Zhuang H, et al. Elevated THBS2, COL1A2, and SPP1 expression levels as predictors of gastric cancer prognosis. Cell Physiol Biochem. 2016;40(6):1316–1324. | ||
Chuang CY, Chang H, Lin P, et al. Up-regulation of osteopontin expression by aryl hydrocarbon receptor via both ligand-dependent and ligand-independent pathways in lung cancer. Gene. 2012;492(1):262–269. | ||
Fedarko NS, Jain A, Karadag A, van Eman MR, Fisher LW. Elevated serum bone sialoprotein and osteopontin in colon, breast, prostate, and lung cancer. Clin Cancer Res. 2001;7(12):4060–4066. | ||
Ue T, Yokozaki H, Kitadai Y, et al. Co-expression of osteopontin and CD44v9 in gastric cancer. Int J Cancer. 1998;79(2):127–132. | ||
Cui R, Takahashi F, Ohashi R, et al. Osteopontin is involved in the formation of malignant pleural effusion in lung cancer. Lung Cancer. 2009;63(3):368–374. | ||
Hu Z, Lin D, Yuan J, et al. Overexpression of osteopontin is associated with more aggressive phenotypes in human non-small cell lung cancer. Clin Cancer Res. 2005;11(13):4646–4652. | ||
Hu ZD, Wei TT, Yang M, et al. Diagnostic value of osteopontin in ovarian cancer: a meta-analysis and systematic review. PLoS One. 2015;10(5):e0126444. | ||
Zeng B, Zhou M, Wu H, Xiong Z. SPP1 promotes ovarian cancer progression via Integrin β1/FAK/AKT signaling pathway. Onco Targets Ther. 2018;11:1333–1343. |
Supplementary material
 | Table S1 Primer set for RT-PCR Abbreviation: RT-PCR, real-time PCR. |
 © 2018 The Author(s). This work is published and licensed by Dove Medical Press Limited. The
full terms of this license are available at https://www.dovepress.com/terms
and incorporate the Creative Commons Attribution
- Non Commercial (unported, 3.0) License.
By accessing the work you hereby accept the Terms. Non-commercial uses of the work are permitted
without any further permission from Dove Medical Press Limited, provided the work is properly
attributed. For permission for commercial use of this work, please see paragraphs 4.2 and 5 of our Terms.
© 2018 The Author(s). This work is published and licensed by Dove Medical Press Limited. The
full terms of this license are available at https://www.dovepress.com/terms
and incorporate the Creative Commons Attribution
- Non Commercial (unported, 3.0) License.
By accessing the work you hereby accept the Terms. Non-commercial uses of the work are permitted
without any further permission from Dove Medical Press Limited, provided the work is properly
attributed. For permission for commercial use of this work, please see paragraphs 4.2 and 5 of our Terms.