Back to Journals » OncoTargets and Therapy » Volume 11
Identification of potential core genes in triple negative breast cancer using bioinformatics analysis
Authors Li MX, Jin LT, Wang TJ, Feng YJ ![]() , Pan CP, Zhao DM, Shao J
, Pan CP, Zhao DM, Shao J
Received 25 February 2018
Accepted for publication 1 June 2018
Published 18 July 2018 Volume 2018:11 Pages 4105—4112
DOI https://doi.org/10.2147/OTT.S166567
Checked for plagiarism Yes
Review by Single anonymous peer review
Peer reviewer comments 2
Editor who approved publication: Prof. Dr. Geoffrey Pietersz
Man-Xiu Li, Li-Ting Jin, Tie-Jun Wang, Yao-Jun Feng, Cui-Ping Pan, Dei-Mian Zhao, Jun Shao
Department of Breast Cancer, Hubei Cancer Hospital, Wuhan, People’s Republic of China
Background: Triple-negative breast cancer (TNBC) is a subtype of breast cancer with poor clinical outcome and limited treatment options. Lacking molecular targets, chemotherapy is the main adjuvant treatment for TNBC patients.
Materials and methods: To explore potential therapeutic targets for TNBC, we analyzed three microarray datasets (GSE38959, GSE45827, and GSE65194) derived from the Gene Expression Omnibus (GEO) database. The GEO2R tool was used to screen out differentially expressed genes (DEGs) between TNBC and normal tissue. Gene Ontology function and Kyoto Encyclopedia of Genes and Genomes pathway enrichment analysis were performed using the Database for Annotation, Visualization and Integrated Discovery to identify the pathways and functional annotation of DEGs. Protein–protein interaction of these DEGs was analyzed based on the Search Tool for the Retrieval of Interacting Genes database and visualized by Cytoscape software. In addition, we used the online Kaplan–Meier plotter survival analysis tool to evaluate the prognostic value of hub genes expression in breast cancer patients.
Results: A total of 278 upregulated DEGs and 173 downregulated DEGs were identified. Among them, ten hub genes with a high degree of connectivity were picked out. Overexpression of these hub genes was associated with unfavorable prognosis of breast cancer, especially, CCNB1 overexpression was observed and indicated poor outcome of TNBC.
Conclusion: Our study suggests that CCNB1 was overexpressed in TNBC compared with normal breast tissue, and overexpression of CCNB1 was an unfavorable prognostic factor of TNBC patients. Further study is needed to explore the value of CCNB1 in the treatment of TNBC.
Keywords: triple-negative breast cancer, hub genes, expression profiling data, CCNB1
Introduction
Triple-negative breast cancer (TNBC) is defined as a subtype of breast cancer which lacks expression of estrogen receptor (ER) and progesterone receptor (PR) and demonstrates no amplification of human epidermal growth factor receptor 2 (HER2). This subset accounts for ~12%–17% of all invasive breast cancers.1 TNBC is more frequently diagnosed in younger women and behaves more aggressively in clinical behaviors. Patients with TNBC are more likely to develop relapse and visceral metastasis than other subtypes of breast cancer.2–5 Lacking molecular targets, patients diagnosed with TNBC cannot be treated with endocrine therapy or HER2-targeted therapy. Chemotherapy is currently the main adjuvant treatment for TNBC patients.1 Unfortunately, many tumors are resistant to chemotherapy and relapse or metastasize quickly after adjuvant treatment.6,7 Up to date, TNBC is still a disease with poor outcome and limited treatment options. Hence, it is urgent and necessary to explore novel therapeutic targets for TNBC.
In this study, we tried to detect novel indicators of poor prognosis in TNBC patients and endeavor to provide potential therapeutic targets for this challenging disease. To detect the differentially expressed genes (DEGs) between TNBC and healthy human breast tissue, bioinformatics methods were used to analyze the gene expression profiling data downloaded from the Gene Expression Omnibus (GEO) database. Gene Ontology (GO) functional annotation analysis and Kyoto Encyclopedia of Genes and Genomes (KEGG) pathway enrichment analysis were performed for the screened DEGs. Then, we established a protein–protein interaction (PPI) network to identify hub genes related to TNBC. The survival analysis of these hub genes was performed using the online database Kaplan–Meier plotter.
Materials and methods
Data source
The gene expression datasets analyzed in this study were obtained from the GEO database (https://www.ncbi.nlm.nih.gov/geo/). A total of 1,821 series about human breast cancer were retrieved from the database. After a careful review, three gene expression profiles (GSE38959, GSE45827, and GSE65194) were selected. Among them, GSE38959 was based on the Agilent GPL4133 platform (Agilent-014850 Whole Human Genome Microarray 4×44K G4112F), and GSE45827 and GSE65194 were based on platform GPL570 ([HG-U133_Plus_2] Affymetrix Human Genome U133 Plus 2.0 Array). All of the data were freely available online, and this study did not involve any experiment on humans or animals performed by any of the authors.
Data processing of DEGs
The GEO2R online analysis tool (https://www.ncbi.nlm.nih.gov/geo/geo2r/) was used to detect the DEGs between TNBC and normal samples, and the adjusted P-value and |logFC| were calculated. Genes that met the cutoff criteria, adjusted P<0.05 and |logFC|≥2.0, were considered as DEGs. Statistical analysis was carried out for each dataset, and the intersecting part was identified using the Venn diagram webtool (bioinformatics.psb.ugent.be/webtools/Venn/).
GO and KEGG pathway analysis of DEGs
GO analysis is a common useful method for large scale functional enrichment research; gene functions can be classified into biological process (BP), molecular function (MF), and cellular component (CC). KEGG is a widely used database which stores a lot of data about genomes, biological pathways, diseases, chemical substances, and drugs. GO annotation analysis and KEGG pathway enrichment analysis of DEGs in this study was performed using the Database for Annotation, Visualization and Integrated Discovery (DAVID) tools (https://david.ncifcrf.gov/). P<0.01 and gene counts≥10 were considered statistically significant.
PPI network construction and hub gene identification
The Search Tool for the Retrieval of Interacting Genes (STRING) database (http://string-db.org/) is designed to analyze the PPI information. To evaluate the potential PPI relationship, the DEGs identified previously were mapped to the STRING database. The PPI pairs were extracted with a combined score>0.4. Subsequently, the PPI network was visualized by Cytoscape software (www.cytoscape.org/). Nodes with higher degree of connectivity tend to be more essential in maintaining the stability of the entire network. CytoHubba, a plugin in cytoscape, was used to calculate the degree of each protein node. In our study, the top ten genes were identified as hub genes.
Survival analysis of hub genes
The Kaplan–Meier plotter (http://kmplot.com/analysis/) is an online tool applied to assess the effect of 54,675 genes on survival using 10,461 cancer samples (5,143 breast, 1,816 ovarian, 2,437 lung, and 1,065 gastric cancer). The Kaplan–Meier plotter mRNA breast cancer database was applied to evaluate the prognostic values of hub genes in breast cancer patients, especially in TNBC patients. In our study, TNBC patients were screened out based on ER, PR, and HER-2 negative expression. Probes of genes were selected based on the “only JetSet best probe set,” and the desired probe IDs for each gene are shown in Table S1. For each gene, cancer patients were divided into two groups according to the median values of mRNA expression. P<0.01 was considered to indicate a statistically significant result.
Results
Identification of DEGs
Three gene expression profiles (GSE38959, GSE45827, and GSE65194) were selected in this study. Among them, GSE38959 contained 30 TNBC samples and 13 normal samples, and GSE45827 and GSE65194 included 41 TNBC specimens and eleven normal breast specimens respectively (Table 1). Based on the criteria of P<0.05 and |logFC|≥2, a total of 852 DEGs were identified from GSE38959, including 515 upregulated genes and 337 downregulated genes. In gene chip GSE45827, 2,995 DEGs were identified; 2,117 genes were upregulated, and 878 genes were downregulated. And from GSE65194, 3,031 DEGs including 2,130 upregulated genes and 901 downregulated genes were identified. All DEGs were identified by comparing TNBC samples with normal breast samples. Subsequently, Venn analysis was performed to get the intersection of the DEG profiles (Figure 1). Finally, 451 DEGs were significantly differentially expressed among all three groups, of which 278 were significantly upregulated genes and 173 were downregulated.
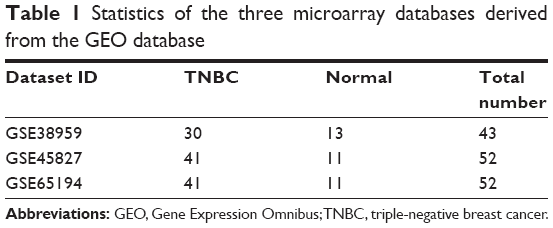 | Table 1 Statistics of the three microarray databases derived from the GEO database |
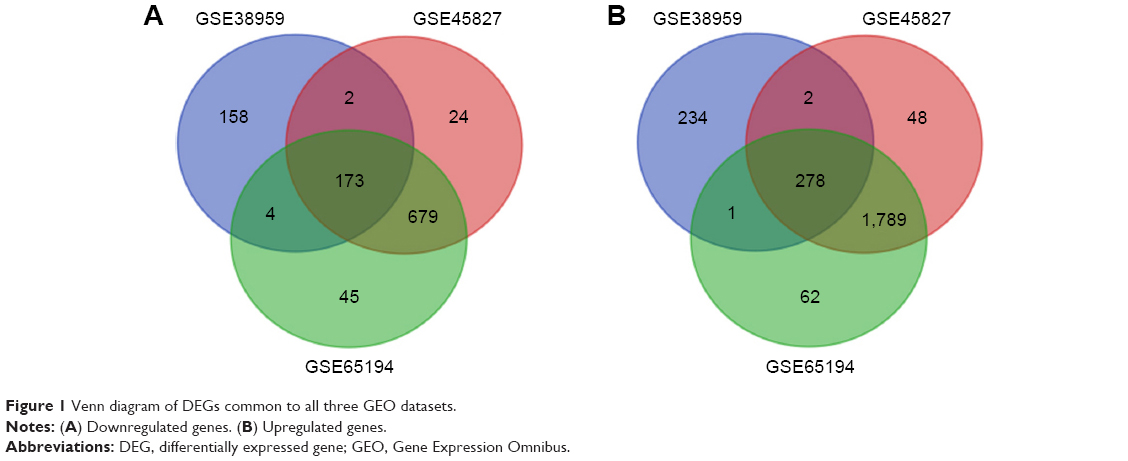 | Figure 1 Venn diagram of DEGs common to all three GEO datasets. |
Functional enrichment analyses of DEGs
GO function and KEGG pathway enrichment analysis for DEGs were performed using the DAVID (Table 2). The enriched GO terms were divided into CC, BP, and MF ontologies. The results of GO analysis indicated that DEGs were mainly enriched in BPs, including sister chromatid cohesion, microtubule-based movement, anaphase-promoting complex-dependent catabolic process, and extracellular matrix (ECM) organization. MF analysis showed that the DEGs were significantly enriched in microtubule binding, transcriptional activator activity, RNA polymerase II core promoter proximal region sequence-specific binding, ATPase activity, and microtubule motor activity. For the cell component, the DEGs were enriched in condensed chromosome kinetochore, microtubule, kinetochore, and spindle. In addition, the results of KEGG pathway analysis showed that DEGs were mainly enriched in pathways in cancer, small cell lung cancer, and ECM–receptor interaction.
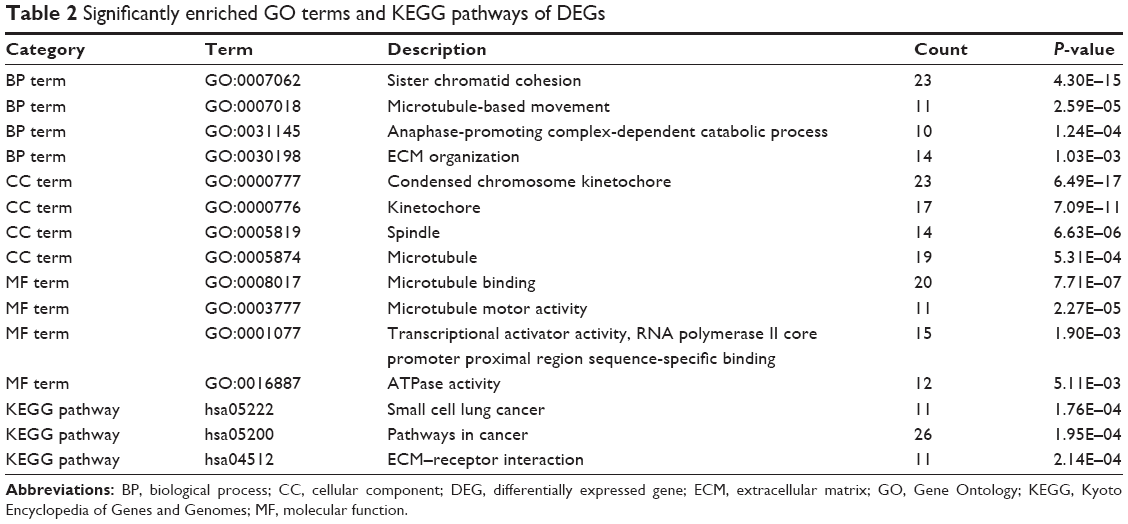 | Table 2 Significantly enriched GO terms and KEGG pathways of DEGs |
PPI network construction and hub gene identification
Protein interactions among the DEGs were predicted with STRING tools. A total of 111 nodes and 1,365 edges were involved in the PPI network, as presented in Figure 2. The top ten genes evaluated by connectivity degree in the PPI network were identified (Table 3). The results showed that cyclin-dependent kinases 1 (CDK1) was the most outstanding gene with connectivity degree=64, followed by cyclin B1 (CCNB1; degree=61), baculoviral IAP repeat containing 5 (BIRC5; degree=60), aurora kinase A (AURKA; degree=58), polo-like kinase 1 (PLK1; degree=56), mitotic arrest deficient 2-like 1 (MAD2L1; degree=54), BUB1 mitotic checkpoint serine/threonine kinase B (BUB1B; degree=54), nuclear division cycle 80 (NDC80; degree=53), budding uninhibited by benzimidazoles 1 (BUB1; degree=52), and kinesin family member 11 (KIF11; degree=52). All of these hub genes were upregulated in TNBC.
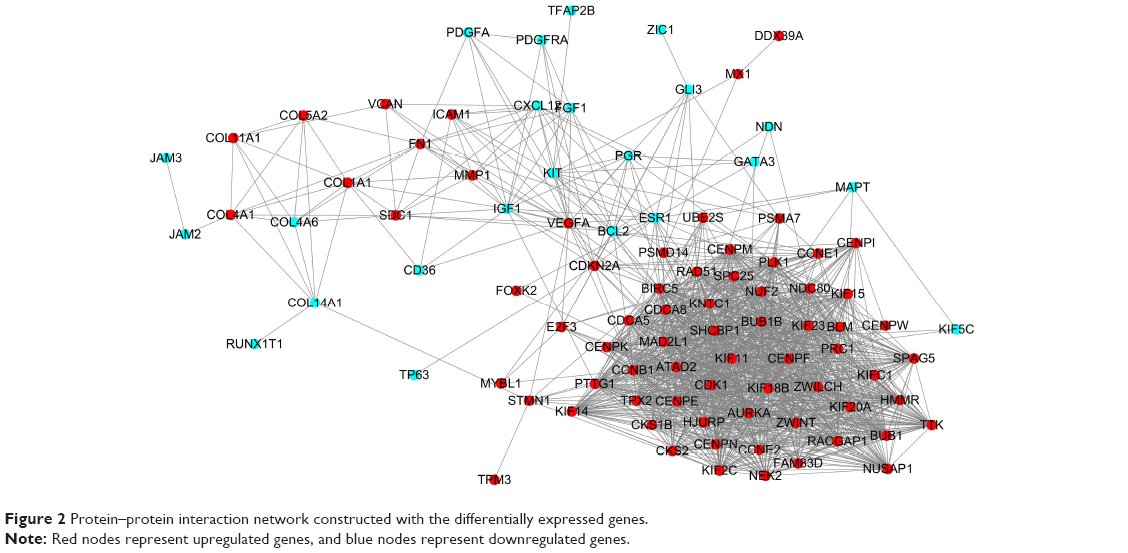 | Figure 2 Protein–protein interaction network constructed with the differentially expressed genes. |
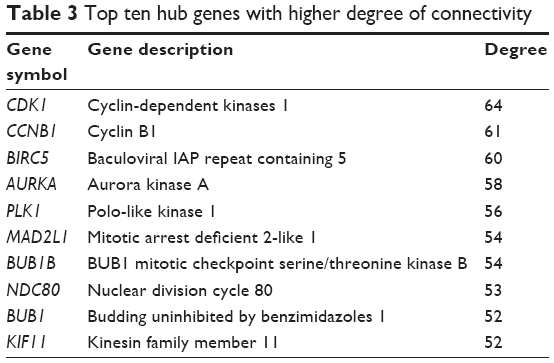 | Table 3 Top ten hub genes with higher degree of connectivity |
Survival analysis of ten hub genes
To investigate the prognostic values of the ten potential hub genes, the Kaplan–Meier plotter bioinformatics analysis platform was used. A total of 1,402 breast cancer patients were available for the analysis of overall survival. We found that high expression of these hub genes was associated with unfavorable overall survival of breast cancer patients (Figure 3).
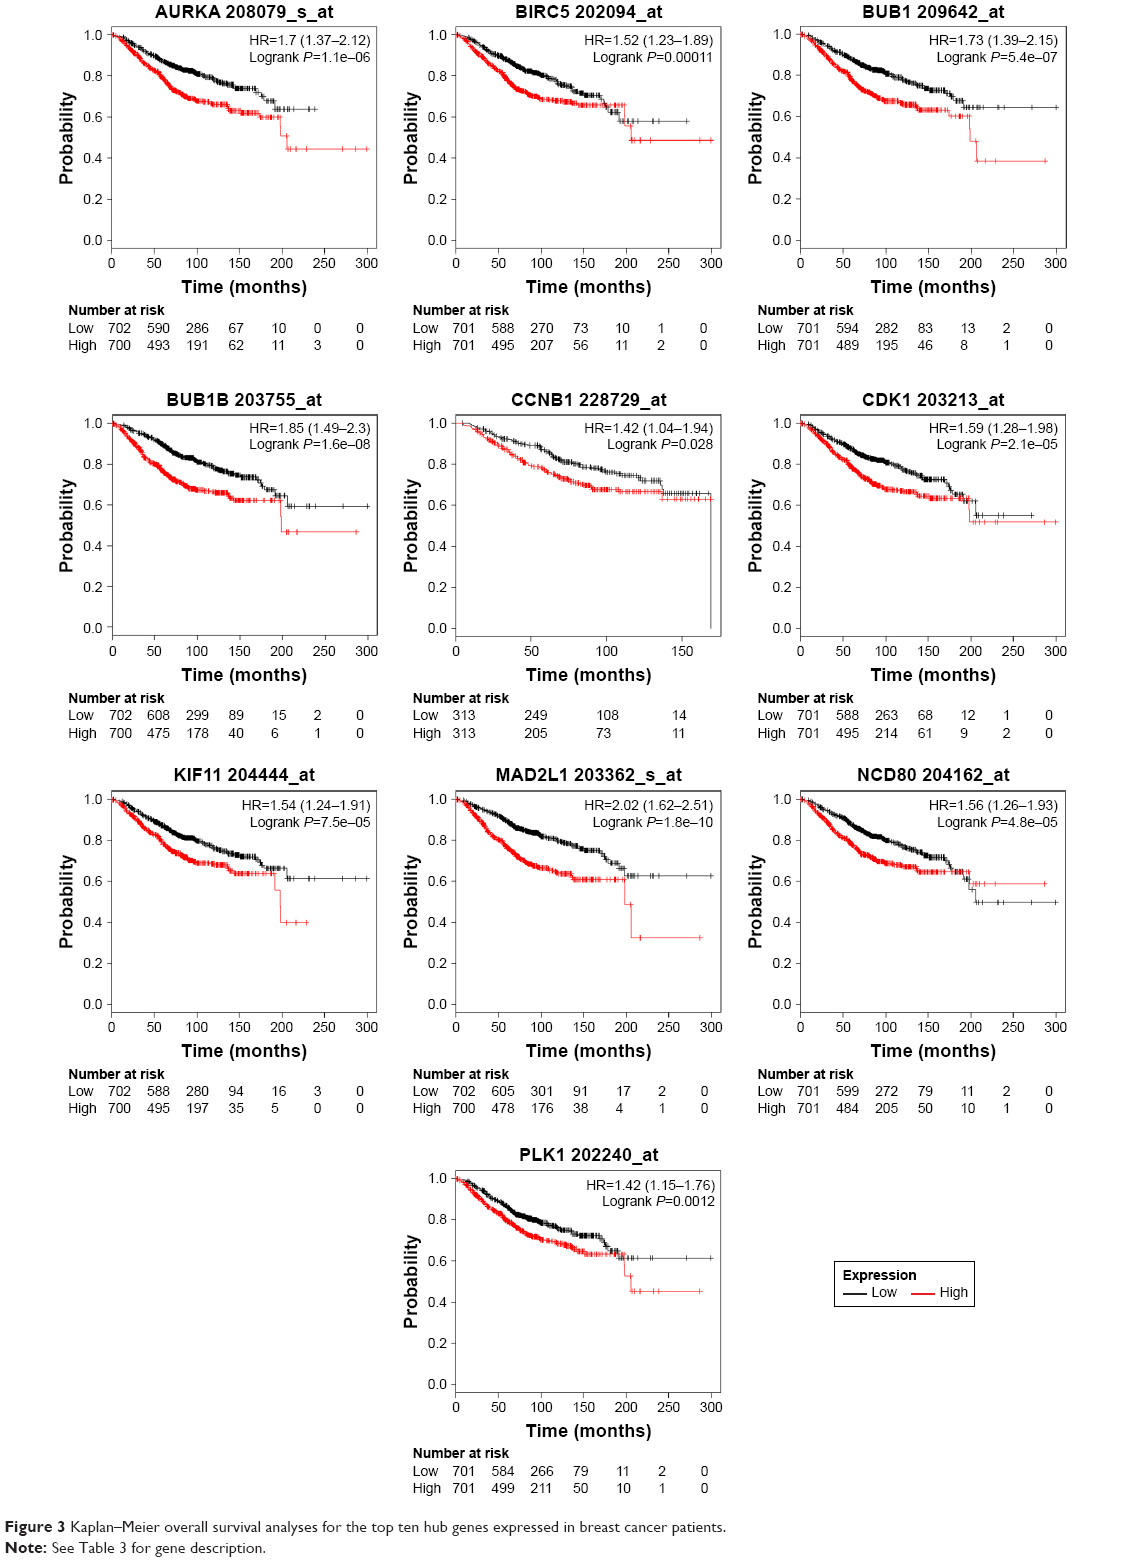 | Figure 3 Kaplan–Meier overall survival analyses for the top ten hub genes expressed in breast cancer patients. |
However, only overexpression of CCNB1 was an unfavorable prognostic factor of relapse-free survival in TNBC patients (HR=2.12; 95% CI: 1.2–3.72; P=0.0078; n=255). There were not enough incidents for overall survival analysis (Figure 4).
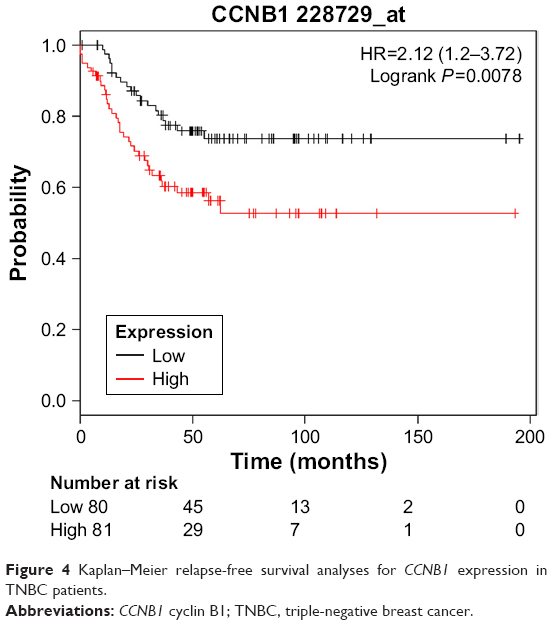 | Figure 4 Kaplan–Meier relapse-free survival analyses for CCNB1 expression in TNBC patients. |
Discussion
Breast cancer is a heterogeneous disease, and the histopathological features and clinical behaviors are distinct among subtypes. TNBC is a unique subtype of breast cancer with poor prognosis. Patients with TNBC have an increased likelihood of relapse and visceral metastasis. Due to lacking a therapeutic target, patients with TNBC could not benefit from endocrine therapy or HER2-targeted therapy, and chemotherapy is currently the mainstay of adjuvant treatment. However, TNBC patients are more likely to develop chemoresistance. Hence, it is crucial to identify new specific targeted therapies for TNBC.
In the present study, gene expression and protein–protein expression analysis based on publicly available databases was performed to identify potential key genes correlated with TNBC. DEGs between TNBC and healthy human breast tissue were screened out based on gene expression profiling data from the GEO database. Totally, we identified 278 upregulated DEGs and 173 downregulated DEGs. These DEGs were associated with the GO BP terms such as condensed chromosome kinetochore, sister chromatid cohesion, kinetochore, and microtubule binding, and significantly enriched in the KEGG terms small cell lung cancer, pathways in cancer, and ECM–receptor interaction. A PPI network was constructed to investigate the interrelationship of the DEGs, and ten hub genes were identified, including AURKA, BIRC5, BUB1B, BUB1, CCNB1, CDK1, KIF11, MAD2L1, NDC80, and PLK1. All of these genes were upregulated in TNBC. Finally, the Kaplan–Meier plotter online tool was applied to predict the relationship between the expression of hub genes and prognosis of TNBC patients. Based on the Kaplan–Meier plotter, overexpression of all the above genes was related to unfavorable prognosis of breast cancer patients. However, only overexpression of CCNB1 was an unfavorable prognostic factor of TNBC patients.
CCNB1, also known as cyclin B1, is a key modulator in controlling cell proliferation.8 Some research has demonstrated that CCNB1 is involved in apoptosis, chemoresistance, and epithelial mesenchymal transitions of tumor cells.9,10 Overexpression of cyclin B1 has been reported in many tumors, such as colorectal cancer, gastric cancer,11 pancreatic carcinoma,12 and lung carcinoma.13 Some of these studies suggested that the overexpression of cyclin B1 may be associated with the poor prognosis of these malignant diseases. For breast cancer, a lot of studies have shown that cyclin B1 overexpression was associated with aggressive clinical behaviors and was an independent prognostic factor. Aaltonen et al14 showed that cyclin B1 overexpression was correlated with an aggressive phenotype and was significantly associated with shorter overall survival and metastasis-free survival in breast cancer patients. Ding et al15 reported that a high level of CCNB1 was closely associated with hormone therapy resistance and poor recurrence-free survival, disease-free survival, and distant metastasis-free survival of ER+ breast cancer patients. And a meta-analysis by Sun et al16 suggested that cyclin B1 overexpression might be an independent potential prognostic marker for disease-specific survival and disease-free survival of breast cancer. TNBC are usually high grade tumors with primitive features, suggesting that cyclin B1 may overexpress in TNBC. Agarwal et al17 reported that cyclin B1 was expressed at a significantly higher level in TNBC cell lines than other subtypes. In our study, cyclin B1 was overexpressed in TNBC compared to normal breast tissue, and overexpression of cyclin B1 was correlated with unfavorable relapse-free survival of TNBC patients. Therefore, cyclin B1 may be a prognostic factor and potential therapeutic target for TNBCs.
Except for CCNB1, we detected other nine hub genes associated with breast cancer, including CDK1, AURKA, BIRC5, MAD2L1, BUB1B, BUB1, PLK1, KIF11, and NDC80. Most of them were reported as an essential factor involved in cell division and proliferation. Proteins encoded by AURKA, BUB1, BUB1B, PLK1, and CDK1 are all serine/threonine kinases involved in the regulation of the cell cycle,18 and overexpression of these genes has been detected in various human cancers and correlated with their prognosis. Roylance et al19 reported that a high AURKA expression level was significantly associated with poorer clinical outcome in breast cancer patients. In Sotiriou et al’s study,20 BUB1 was upregulated and correlated with a poor clinical prognosis in breast cancer patients. Many studies have shown an association between PLK1 overexpression and poor clinical prognosis, and suggested that inhibition of PLK1 may be a potential therapy for cancer treatment.21,22 For CDK1, many research studies have reported its overexpression in cancers and that it acts as an adverse prognostic factor, and many kinds of CDK inhibitors have been developed.23
In our study, BIRC5, KIF11, MAD2L1, and NDC80 were overexpressed in breast cancer compared to normal breast tissues, and overexpression of these genes was significantly correlated with unfavorable clinical outcome in breast cancer patients. The results of our research were consistent with other studies.24–27 However, the role of these genes in TNBC is not clear and further study is needed.
Conclusion
Our bioinformatics analysis identified 451 DEGs between TNBCs and normal breast tissues based on the gene expression datasets obtained from the GEO database. Among them, ten hub genes might be the core genes of breast cancer, including AURKA, BIRC5, BUB1B, BUB1, CCNB1, CDK1, KIF11, MAD2L1, NDC80, and PLK1. All of them were upregulated in breast cancer, and overexpression of these genes was associated with unfavorable clinical outcome in breast cancer patients. In TNBC patients, CCNB1 overexpression is an unfavorable prognostic factor. Further study is needed to confirm the results of our research. Anyway, CCNB1 may be a potential target for TNBC therapy.
Acknowledgment
This study was supported by the Hubei Provincial Natural Science Fund Grant No 2016CFB525.
Disclosure
The authors report no conflicts of interest in this work.
References
Foulkes WD, Smith IE, Reis-Filho JS. Triple-negative breast cancer. N Engl J Med. 2010;363(20):1938–1948. | ||
Hudis CA, Gianni L. Triple-negative breast cancer: an unmet medical need. Oncologist. 2011;16(Suppl 1):1–11. | ||
Dent R, Trudeau M, Pritchard KI, et al. Triple-negative breast cancer: clinical features and patterns of recurrence. Clin Cancer Res. 2007;13(15 Pt 1):4429–4434. | ||
Carey L, Winer E, Viale G, Cameron D, Gianni L. Triple-negative breast cancer: disease entity or title of convenience? Nat Rev Clin Oncol. 2010;7(12):683–692. | ||
Dent R, Hanna WM, Trudeau M, Rawlinson E, Sun P, Narod SA. Pattern of metastatic spread in triple-negative breast cancer. Breast Cancer Res Treat. 2009;115(2):423–428. | ||
Deng X, Apple S, Zhao H, et al. CD24 Expression and differential resistance to chemotherapy in triple-negative breast cancer. Oncotarget. 2017;8(24):38294–38308. | ||
Wein L, Loi S. Mechanisms of resistance of chemotherapy in early-stage triple negative breast cancer (TNBC). Breast. 2017;34(Suppl 1):S27–S30. | ||
Smits VA, Medema RH. Checking out the G(2)/M transition. Biochim Biophys Acta. 2001;1519(1–2):1–12. | ||
Song Y, Zhao C, Dong L, et al. Overexpression of cyclin B1 in human esophageal squamous cell carcinoma cells induces tumor cell invasive growth and metastasis. Carcinogenesis. 2008;29(2):307–315. | ||
Matthess Y, Raab M, Sanhaji M, Lavrik IN, Strebhardt K. Cdk1/cyclin B1 controls Fas-mediated apoptosis by regulating caspase-8 activity. Mol Cell Biol. 2010;30(24):5726–5740. | ||
Wen Y, Cao L, Lian WP, Li GX, Gx L. The prognostic significance of high/positive expression of cyclin B1 in patients with three common digestive cancers: a systematic review and meta-analysis. Oncotarget. 2017;8(56):96373–96383. | ||
Zhou L, Li J, Zhao YP, et al. The prognostic value of Cyclin B1 in pancreatic cancer. Med Oncol. 2014;31(9):107. | ||
Soria JC, Jang SJ, Khuri FR, et al. Overexpression of cyclin B1 in early-stage non-small cell lung cancer and its clinical implication. Cancer Res. 2000;60(15):4000–4004. | ||
Aaltonen K, Amini RM, Heikkilä P, et al. High cyclin B1 expression is associated with poor survival in breast cancer. Br J Cancer. 2009;100(7):1055–1060. | ||
Ding K, Li W, Zou Z, Zou X, Wang C. CCNB1 is a prognostic biomarker for ER+ breast cancer. Med Hypotheses. 2014;83(3):359–364. | ||
Sun X, Zhangyuan G, Shi L, Wang Y, Sun B, Ding Q. Prognostic and clinicopathological significance of cyclin B expression in patients with breast cancer: a meta-analysis. Medicine. 2017;96(19):e6860. | ||
Agarwal R, Gonzalez-Angulo AM, Myhre S, et al. Integrative analysis of cyclin protein levels identifies cyclin B1 as a classifier and predictor of outcomes in breast cancer. Clin Cancer Res. 2009;15(11):3654–3662. | ||
Finetti P, Cervera N, Charafe-Jauffret E, et al. Sixteen-kinase gene expression identifies luminal breast cancers with poor prognosis. Cancer Res. 2008;68(3):767–776. | ||
Roylance R, Endesfelder D, Jamal-Hanjani M, et al. Expression of regulators of mitotic fidelity are associated with intercellular heterogeneity and chromosomal instability in primary breast cancer. Breast Cancer Res Treat. 2014;148(1):221–229. | ||
Sotiriou C, Neo SY, Mcshane LM, et al. Breast cancer classification and prognosis based on gene expression profiles from a population-based study. Proc Natl Acad Sci U S A. 2003;100(18):10393–10398. | ||
Gutteridge RE, Ndiaye MA, Liu X, Ahmad N. Plk1 Inhibitors in Cancer Therapy: From Laboratory to Clinics. Mol Cancer Ther. 2016;15(7):1427–1435. | ||
Liu Z, Sun Q, Wang X, Plk WX. PLK1, A Potential Target for Cancer Therapy. Transl Oncol. 2017;10(1):22–32. | ||
Chae SW, Sohn JH, Kim DH, et al. Overexpressions of Cyclin B1, cdc2, p16 and p53 in human breast cancer: the clinicopathologic correlations and prognostic implications. Yonsei Med J. 2011;52(3):445–453. | ||
Wang SC. PCNA: a silent housekeeper or a potential therapeutic target? Trends Pharmacol Sci. 2014;35(4):178–186. | ||
Wang Z, Katsaros D, Shen Y, et al. Biological and Clinical Significance of MAD2L1 and BUB1, Genes Frequently Appearing in Expression Signatures for Breast Cancer Prognosis. PLoS One. 2015;10(8):e0136246. | ||
Pei YY, Li GC, Ran J, Wei FX. Kinesin family member 11 contributes to the progression and prognosis of human breast cancer. Oncol Lett. 2017;14(6):6618–6626. | ||
Hamy AS, Bieche I, Lehmann-Che J, et al. BIRC5 (survivin): a pejorative prognostic marker in stage II/III breast cancer with no response to neoadjuvant chemotherapy. Breast Cancer Res Treat. 2016;159(3):499–511. |
Supplementary material
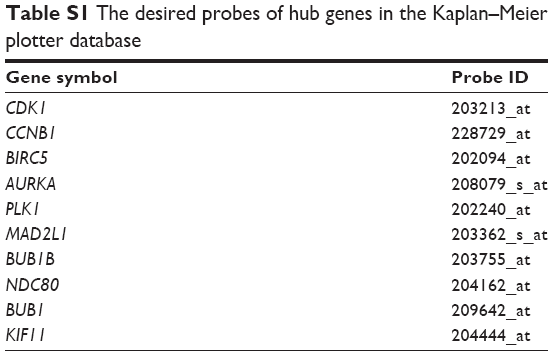 | Table S1 The desired probes of hub genes in the Kaplan–Meier plotter database |
 © 2018 The Author(s). This work is published and licensed by Dove Medical Press Limited. The
full terms of this license are available at https://www.dovepress.com/terms
and incorporate the Creative Commons Attribution
- Non Commercial (unported, 3.0) License.
By accessing the work you hereby accept the Terms. Non-commercial uses of the work are permitted
without any further permission from Dove Medical Press Limited, provided the work is properly
attributed. For permission for commercial use of this work, please see paragraphs 4.2 and 5 of our Terms.
© 2018 The Author(s). This work is published and licensed by Dove Medical Press Limited. The
full terms of this license are available at https://www.dovepress.com/terms
and incorporate the Creative Commons Attribution
- Non Commercial (unported, 3.0) License.
By accessing the work you hereby accept the Terms. Non-commercial uses of the work are permitted
without any further permission from Dove Medical Press Limited, provided the work is properly
attributed. For permission for commercial use of this work, please see paragraphs 4.2 and 5 of our Terms.