")
Back to Archived Journals » Reports in Medical Imaging » Volume 12
Identification of patterns of abnormalities seen on DaTscan™ SPECT imaging in patients with non-Parkinson’s movement disorders
Authors Calle S , Dawood L , Tripathee NR, Cai C , Kaur H, Wan DQ , Ibekwe H, Gayed IW
Received 19 January 2019
Accepted for publication 10 April 2019
Published 23 July 2019 Volume 2019:12 Pages 9—15
DOI https://doi.org/10.2147/RMI.S201890
Checked for plagiarism Yes
Review by Single anonymous peer review
Peer reviewer comments 2
Editor who approved publication: Professor Tarik Massoud
Susana Calle,1 Lydia Dawood,2 Niroj R Tripathee,3 Chunyan Cai,4 Harleen Kaur,5 David Q Wan,5 Henry Ibekwe,6 Isis W Gayed5
1Neuroradiology Section, Department of Diagnostic and Interventional Imaging, The University of Texas Health Science Center at Houston, Houston, TX, USA; 2Department of Surgery, Baylor College of Medicine, Houston, TX, USA; 3Body Imaging Section, Department of Diagnostic and Interventional Imaging, The University of Texas Health Science Center at Houston, Houston, TX, USA; 4Clinical and Translational Sciences Section, The University of Texas Health Science Center at Houston, Houston, TX, USA; 5Nuclear Medicine Section, Department of Diagnostic and Interventional Imaging, The University of Texas Health Science Center at Houston, Houston, TX, USA; 6Memorial Hermann Hospital, Texas Medical Center, Houston, TX, USA
Purpose: To identify patterns of abnormalities using DaTscan™ single photon emissioncomputed tomography (SPECT) imaging of patients with non-Parkinson’s movement disorders.
Materials and methods: A single institution retrospective evaluation was performed of consecutive patients who underwent DaTscan SPECT imaging for Parkinson’s-like movement disorders, excluding those who had scan findings consistent with Parkinson’s disease. Demographic and clinical data were collected for all patients. A single experienced reader graded the degree of decreased dopamine transporter activity using a semi-quantitative visual score. Additional quantitative analysis was utilized to generate z-scores in 101/104 patients. Data were analyzed to establish patterns and frequency of abnormalities on DaTscan. Correlation between quantitative and semi-quantitative visual scores was also performed.
Results: A total of 104 patients were included, of which 77 patients (74%) had abnormal findings on semi-quantitative visual assessment of the DaTscan images and 27 patients (26%) had normal findings. Of the abnormalities, the majority were either mild or moderate decrease in tracer accumulation, in one or both putamina. The most common site of abnormality was the left posterior putamen followed by the right posterior putamen. Quantitative z-score analysis revealed that 14% of the patients exhibited an abnormality, while 86% had normal z-scores.
Conclusion: Semi-quantitative visual DaTscan analysis of patients with non-Parkinson’s movement disorders most commonly reveals mild to moderate decrease in dopamine transporter activity, primarily involving the posterior aspect of one of the putamina.
Keywords: DaTscan™, tremor, movement disorders, dopamine transporter, 123I-ioflupane
Introduction
The increase in life expectancy, primarily in developed countries, also carries a burden of increased development of neurodegenerative disorders.1 Tremor, which is considered the most common movement disorder, can be widely variable in severity ranging from a mild discomfort to a disabling condition. Semiologically, tremor can be classified into resting tremor and action tremor depending on the scenario that elicits greater symptomatology. Classically, Parkinson’s disease (PD) is characterized primarily by resting tremor while essential tremor (ET) presents with action tremor. However, atypical clinical pictures that include both action and resting tremor complicate the clinical distinction between both diagnoses.2 Although PD additionally features bradykinesia, rigidity, and postural instability, many patients do not meet clinical diagnostic criteria, especially in early phases of the disease. Other clinical scenarios characterized by tremor including Parkinson’s plus syndromes, metabolic disorders, vascular parkinsonism (VP), and drug-induced parkinsonism can also variably present with either resting or action tremor. For this reason, the clinical picture alone is often insufficient to definitively categorize patients and establish appropriate therapy. The literature suggests a tendency to over-diagnose PD and therefore, in many cases, to unnecessarily treat patients.3 With the advent of DaTscan™ single photon emission computed tomography (SPECT) imaging, approved in the United States by the Food and Drug Administration in 2011, clinicians are now better able to evaluate patients suffering from movement disorders but with equivocal symptoms of PD.4
The radiopharmaceutical 123I-ioflupane serves as a marker of integrity of the dopaminergic neuronal terminals, and in essence provides an accurate “in vivo” analysis of impairment.1 It has been established that in both PD and dopaminergic-deficient parkinsonian syndrome (PS), clinical symptoms have been found to arise when loss of striatal dopamine exceeds 60%.3 Therefore, imaging findings precede clinical features of neurodegenerative parkinsonian disorders. In healthy individuals, dopaminergic activity in the striatum, composed of the caudate nuclei and putamina, shows a characteristic appearance on DaTscan that resembles mirror images of “commas” in the region of the basal ganglia.5 Conversely, in patients with neurodegenerative PSs, DaTscan SPECT imaging shows gradual loss of dopamine transporters generally beginning at the posterior putamen and progressing anteriorly. These changes have been seen to occur in a contralateral manner relative to symptom laterality with ipsilateral progression over time.6 On visual inspection, asymmetric loss of dopamine transporter activity in this distribution heralds the diagnosis of dopaminergic-deficient PS with a high degree of agreement at two-year follow-up, as determined by Tolosa, et al.3,7 On the other hand, atypical PS has been shown to display a more symmetric involvement with a predilection for the caudate nuclei rather than the putamina.8
Prior studies have shown that 123I-ioflupane binding is normal in ET, drug-induced Parkinsonism, and psychogenic Parkinsonism.9,10 Patients with VP may show normal binding, mildly decreased binding or “punched out” lesions from infarct.6 The distinction between VP and PD is of particular interest, being that these two conditions represent the most common clinical forms that benefit from being distinguished, given their specific therapies. The overlap in striatal binding observed in these two patient populations brought on the attempt to differentiate the two via the analysis of 123I-metaiodobenzylguanidine (123I-MIBG) cardiac scintigraphy in conjunction with the DaTscan. The principle behind integrating cardiac scintigraphy relies on the study’s ability to evaluate postganglionic presynaptic sympathetic innervation of the heart, and in turn how this reflects denervation damage. When both the DaTscan and the 123I-MIBG showed pathological results, PD was more reliably diagnosed as compared to abnormal findings on 123I-ioflupane SPECT alone. Conversely, when 123I-ioflupane SPECT findings were abnormal and 123I-MIBG cardiac scintigraphy was normal, VP was diagnosed.11,12
Relative to patients with Alzheimer’s disease (AD) that often show mildly decreased 123I-ioflupane binding, patients with Lewy body dementia (LBD) tend to present with more significantly diminished striatal binding.13,14 Even normal aging can affect striatal binding with an approximate loss ranging from 5% to 7% per decade.15 However, AD and LBD can also represent a challenging distinction. Similar to the dilemma between PD and VP, the use of 123I-MIBG cardiac scintigraphy has also been employed in the distinction between AD and LBD. Since LBD typically demonstrates abnormalities in myocardial sympathetic innervation and striatal dopamine uptake, when both exams show pathological results, LBD is more confidently diagnosed rather than AD. On the other hand, if the DaTscan images are normal or pathological but the 123I-MIBG cardiac scintigraphy is normal, AD is the appropriate diagnosis.11,12
Quantitative measures have been developed by a wide range of imaging systems to compare different regions of interest in the striatum to healthy age-matched individuals. However, it is well established that the performance of any particular system depends greatly on the data used to train and validate the program. For this reason, it has been particularly challenging to attempt to institute widespread cut-off values of normality.16 Prior studies have opted to select large sets of training and validation sets to determine internal controls with which they can compare patients.16 In the postprocessing phase, Palumbo et al, employed putamen/occipital and caudate/occipital binding ratios using a standardized ROI template to measure uptake values amongst the subjects. Normal and pathological values were established in relation to age-matched controls suggested by their particular software of use.16
Similarly, in our study, a standard deviation equal to or less than −1.6 is considered abnormal using the MIM analysis software when evaluating for PS. A z-score can be derived by comparing the patient’s dopaminergic transporters uptake in the basal ganglia as a standard deviation relative to an age-matched normal population. While this method provides an objective evaluation of dopaminergic denervation, there is considerable variation across imaging systems and no definitive threshold values have been established.5,17
While the impact of DaTscan has been established with regard to PD, little has been said regarding DaTscan findings in patients where PD has been ruled out on either DaTscan, by clinical criteria, or both.18,19 We have observed small abnormalities in many non-Parkinson’s patterns of Datscan. Our objective is to evaluate DaTscan imaging exams retrospectively in those individuals without PD to attempt to identify any consistency of patterns of abnormalities in this patient population and establish new thresholds using quantitative parameters as supportive values for non-Parkinson’s movement disorders.
Materials and methods
Patients population
Approval was obtained from the institutional review board (Committee for the Protection of Human Subjects – CPHS, The University of Texas Health Science Center at Houston – UTHealth). A retrospective analysis was performed of consecutive patients who had undergone a DaTscan at our nuclear medicine lab during a period from January 2016 to August 2017. Patient consent to review medical records was waived by the institutional review board, given the retrospective nature of the study. All patient data confidentiality was maintained throughout the course of the research in compliance with the Declaration of Helsinki. Those patients with a diagnosis of Parkinson’s disease as per the DaTscan were excluded from the study. Demographic and clinical data were collected from the electronic medical record on a total of 104 patients including age, gender, race, presenting symptoms, laterality of symptoms, comorbidities, and findings of other imaging studies.
Imaging protocol
All patients underwent DaTscan using the standard imaging protocol beginning with the oral administration of 50–250 mg of potassium iodide and followed by the intravenous injection of 4–6 mCi of 123I-ioflupane. SPECT imaging was conducted 3–5 hrs post-injection. A Phillips dual-head gamma-camera was used and the patients’ head, arms, and legs were stabilized to limit motion. A radius of rotation of 11–15 cm was used for positioning, and the camera was placed as close to the patient’s head as possible. Image acquisition was performed in a circular 360-degree orbit, at 30 seconds/frame, 120 frames. A minimum of 1.5 million counts, using a low-energy, high-resolution collimator, were obtained for optimal image quality. Images were processed using iterative reconstruction (Astonish program) with 2 iterations in 16 subsets.
Image analysis
An experienced nuclear medicine trained physician, with 25 years of experience, reviewed each of the patient’s DaTscan exams and evaluated the appearance of dopamine transporter concentration in the right anterior putamen, right posterior putamen, left anterior putamen, left posterior putamen, right caudate, and left caudate using a semi-quantitative scale. The reader assigned a score for each of the six structures as follows: 0-normal; 1-mildly decreased; 2-moderately decreased; 3-markedly decreased; 4-absent uptake (Figure 1). If any single score other than 0 was given to any of the structures, the study was considered “abnormal”. If all the structures received a score of 0 on any given patient, that study was considered “normal”.
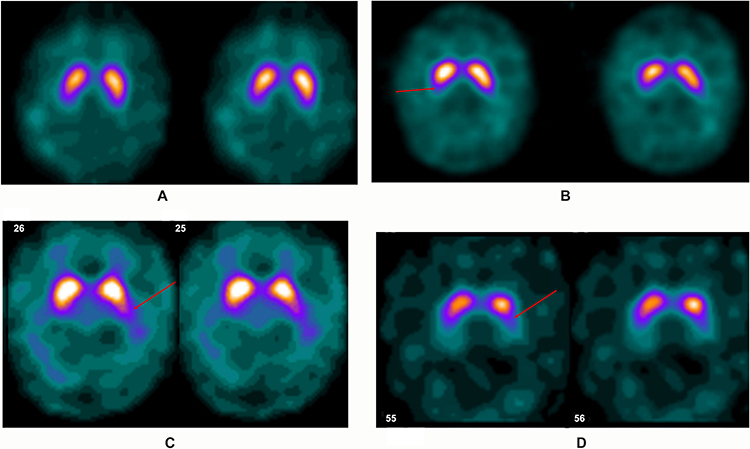 |
Figure 1 DaTscan SPECT images of four separate patients. Image (A) demonstrates the normal “comma” configuration on the striata bilaterally, which would receive a score of 0. The progressive loss of dopamine transporters would then be classified as mild on the right (arrow) on image (B) score of 1, moderate on the left (arrow) on image (C) score of 2 and severe on the left (arrow) on image (D) score of 3. |
Quantitative analysis
MIM Version 6.6 (MIM Software Inc., Cleveland, OH) was implemented to generate a z-score analysis for 101/104 patients. A z-score was obtained for the left and right striatum, left and right anterior putamina, left and right posterior putamina, and left and right caudate. Z-score is an expression of the patient’s standard deviation when compared to the normal population database included with the MIM software. Age-matched regional statistics of the different areas of the basal ganglia (mean and standard deviations) were generated from 123I-ioflupane DaTscan SPECT images of 209 normal controls (73 females, 136 males) from the Parkinson’s Progression Markers Initiative as part of an investigation into DaTscan quantification. The mean age and standard deviation of the group of 209 individuals are 61±11 years. Z-score ≤ −1.6 was considered “abnormal” as per the MIM analysis program criteria. If all the patient’s z-scores were >−1.6 the exam was considered “normal”.
Statistical analysis
We applied analysis of variance to compare the Z-score among different visual semi-quantitative scale grading groups to evaluate their associations in the left and right posterior putamina. We also evaluated their associations by pooling left and right data together through the generalized estimation equation approach to account for the correlation of the left and right measurements within patients. All analyses were performed using SAS 9.4 (Cary, NC) and a p-value less than 0.05 was considered significant.
Results
A total of 104 patients were evaluated, 57 males and 47 females. The average age was 67.9, with a minimum age of 30 and a maximum age of 85. The majority of patients were white Caucasian (62/104), followed by “other” race (18/104), black (14/104), unknown race (7/104), and Asian (3/104).
All patients presented with tremor with or without additional symptoms including gait abnormalities, memory loss, dizziness, and balance issues. Laterality of symptoms was considered to be bilateral symmetric (32/104), left greater than right (9/104), right greater than left (20/104), purely left (9/104), purely right (18/104), predominantly involving face/head (2/104), and unknown (14/104). The ultimate clinical diagnoses given to the patients by their treating physician included ET (17/104), unspecified tremor (6/104), drug-induced tremor (1/104), LBD (3/104), VP (1/104), Parkinsonism (10/104), dystonia/movement disorder (2/104), and non-Parkinson’s movement disorder (64/104). Clinical history is summarized in Table 1.
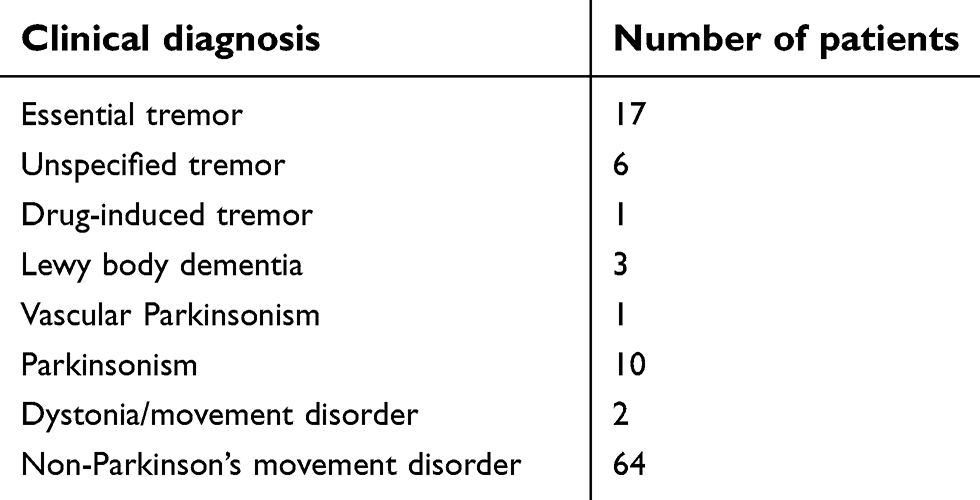 |
Table 1 Distribution of final clinical diagnosis for the patients’ movement disorder |
Seventy-seven of the 104 patients (74%) had an abnormality on DaTscan based on visual assessment, while 27/104 had no abnormalities (26%). By anatomic location, the most commonly affected region was the left posterior putamen, followed by the right posterior putamen, then the left anterior putamen, right anterior putamen, right caudate, and lastly the left caudate. The scoring of each of the structures in the 104 patients is summarized in Table 2. Almost all the patients’ abnormalities were mild to moderate decrease in tracer uptake which is not the typical pattern for Parkinson’s disease where the abnormalities are more severe.
 |
Table 2 Degrees of abnormalities using the visual semi-quantitative score in the different structures of the basal ganglia |
Quantitative z-score analysis revealed that 14% of the patients (14/101) exhibited enough abnormality to generate an abnormal z-score, defined by any value <−1.6, while 86% (87/101) had normal z-scores. The median abnormal z-score was −1.87 in the left putamen and −1.80 in the right putamen in the 14 patients with abnormal z-scores below −1.6. The mean and median z-score in patients that demonstrated abnormalities on visual interpretation only was −0.45 and −0.8 in the left putamen and −0.75 and −0.8 in the right putamen. Since the visually identified defects involved the posterior putamen in almost all of the visually abnormal patients (Figure 2), correlation of z-scores with the degree of abnormality on the semi-quantitative scale was performed for the posterior putamina (Table 3). Statistically significant correlation with p=0.0002 was obtained when visual abnormalities graded on the semi-quantitative scale in both right and/or left putamen were correlated with the quantitative z-scores. Additionally, visual semi-quantitative scale grading significantly correlated with the z-score in the left posterior putamen with p=0.02 and almost reached statistical significance for the right posterior putamen with p=0.06.
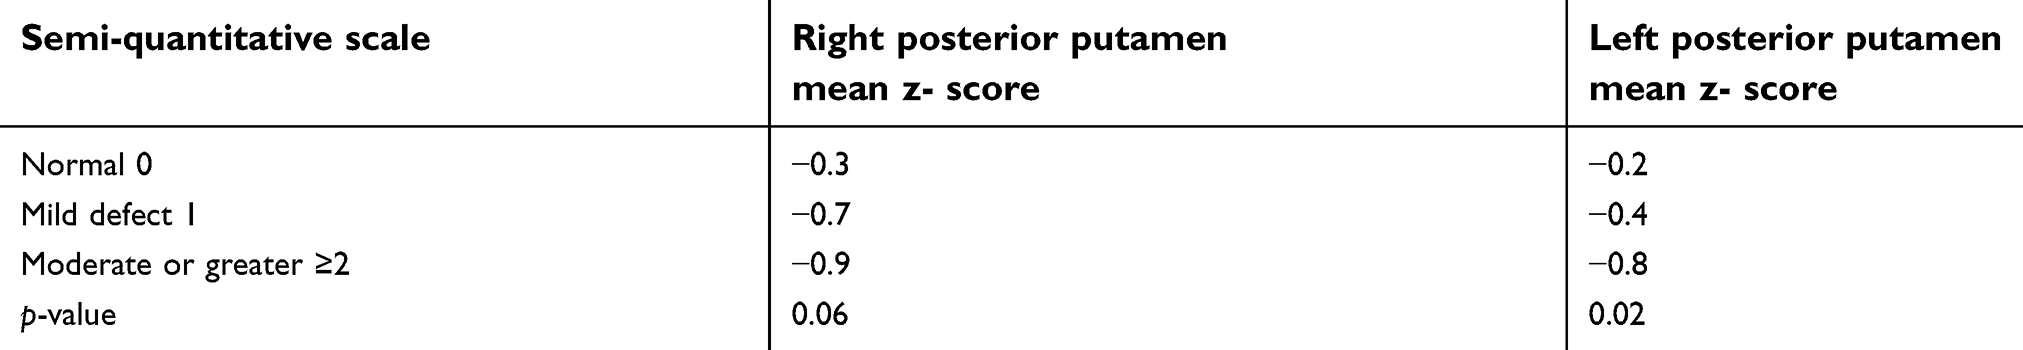 |
Table 3 Association of the visual semi-quantitative score with the quantitative z-score |
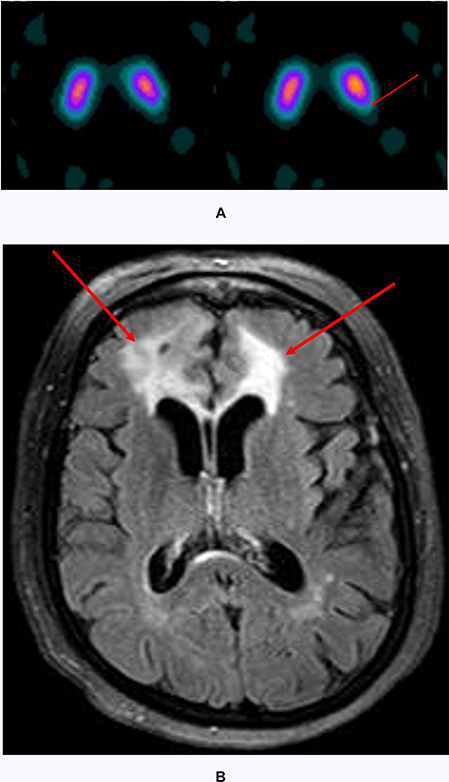 |
Figure 2 A typical pattern of abnormality seen in the left posterior putamen (arrow) of a patient with essential tremor (A) and correlating axial T2/FLAIR slice on MRI (B). The patient is status post left frontal resection of a midline meningioma in the left frontal convexity. Image B shows vasogenic edema of the bilateral frontal lobes (arrows). |
Of the 101 patients with quantitative analysis and z-scores, 14 had an abnormal z-score defined as a score ≤ −1.6 in any of the anatomic structures. In these 14 patients, 13 were also classified as abnormal by visual inspection and 1 patient was normal on visual interpretation. This single patient with normal visual assessment and abnormal z-scores had a final clinical diagnosis of nonspecified non-Parkinson’s movement disorder. Of the patients with abnormal z-scores the mean and median scores for each structure were, respectively: left striatum −1.6 and −1.81, right striatum −1.8 and −1.69, left putamen −1.66 and −1.87, right putamen −1.8 and −1.83, left caudate −1.44 and −1.64, and right caudate −1.51 and −1.55.
Prior magnetic resonance imaging was performed in 54 patients. Twenty-nine of these patients showed microvascular ischemic changes, 10 had cerebral volume loss, 4 had incidental findings including meningiomas and schwannomas, and 11 were reported as normal.
Discussion
In our study, visual interpretation of DaTscan SPECT imaging in patients with conditions resembling PD but without clinical or imaging diagnosis of PD yielded a significant number of mild abnormalities of dopaminergic function. If taking into account a single structure demonstrating decreased dopamine transporter activity, 74% of the patients showed some degree of abnormality based on visual evaluation of the exam. Our results suggest that a large percentage of the non-Parkinson’s movement disorders have a small component of dopamine transporter dysfunction. Interestingly, while ET has not been linked to loss of dopamine transporters, many patients clinically diagnosed with ET showed abnormalities in dopamine transporter activity on DaTscan, primarily in the posterior putamen. It might be a misconception that patients can be diagnosed as having ET or PD, while in reality, they might be a spectrum of disease severity with similar pathophysiology. In fact, patients with clinically diagnosed ET have shown a fourfold to fivefold increased risk of subsequently developing PD as compared to controls.18 Additional studies would have to be conducted to establish whether these non-Parkinson’s patients shown to have abnormalities on DaTscan SPECT imaging in our study correlate with patients who are at greater risk for developing PD further along in their clinical course. This also raises the dilemma whether patients should be managed based on clinical presentation alone, and how much the imaging findings should weigh into treatment planning.
As opposed to the semi-quantitative assessment of the exams, quantitative z-score analysis showed an abnormality in only 14% of the cases. Our study applied a cutoff value of −1.6, below which the score was considered abnormal and above which the score was deemed normal. Using this threshold value, the majority of patients can be classified as having a normal DaTscan analysis, in keeping with prior studies demonstrating that patients with ET and drug-induced Parkinsonism had normal exams. However, it is important to highlight that no definite threshold value has been widely accepted, mainly because of the variability between the normal populations. Good correlation between the visual semi-quantitative score and quantitative z-scores with statistically significant results supports the validity of these mild or small defects in the dopamine transporter function in these patients. However, a lower threshold for z-score abnormality is suggested at – 0.8 with a range between –0.8 and –1.6. This range is obtained from the median z-score in the putamen of patients with a visually identified dopaminergic defect in this study and the lower threshold for patients with abnormal z-score in Parkinson’s disease as previously tested against normal population in the MIM neuroanalysis program. Thus, patients with non-Parkinson’s movement disorders and z-score between –0.8 and –1.6 would be considered abnormal, while z-score equal or less than – 1.6 would identify patients with Parkinson’s disease. These results represent new threshold to identify patients with different types and diagnosis of movement disorder and will need further validation with additional future studies.
Our study limitation is the retrospective nature of the study with no control group of normals for comparison. However, the normal population included in the MIM software can be considered as a good reference which is augmented with the quantitative nature of the z-scores obtained from the MIM analysis program. While our patient number was satisfactory, retrospective review of the available patient data may be deficient in some patients’ clinical data. Also, the absence of Parkinson’s disease as a diagnosis on the DaTscan may have resulted in a large category of the patients being classified as a non-Parkinson movement disorder without a specific diagnosis.
Conclusion
Overlapping symptom profiles in patients with tremor-related movement disorders, as well as different clinical diagnostic criteria, oftentimes complicate the ultimate classification of patients and their appropriate management. While prior literature has determined that DaTscan analysis is generally normal in non-Parkinson patients, we have noted that many of these individuals demonstrate subjective abnormalities, mostly including mild to moderate decrease in striatal binding in the posterior putamina, generally in an asymmetric fashion. New lower threshold for diagnosing non-parkinson movement disorders using quantitative analysis has been identified between z-score −0.8 and −1.6 standard deviation from normal adults’ population.
Acknowledgments
We would like to thank our support team Ms. Karen Swaby and Ms. Monica Atta for documentation, formatting and IRB submission support.
Disclosure
The authors have no conflicts of interest to disclose in this work.
References
1. Nuvoli S, Madeddu AS, Brain G. SPECT with perfusion radiopharmaceuticals and dopaminergic system radiocompounds in dementia disorders. Current Alzheimer Research. 2017. Available from: http://www.eurekaselect.com/146511/article. Accessed April 3, 2019.
2. Marsala SZ, Pistacchi M, Gioulis M, Ferracci F, Capus L. Clinical and imaging study of isolated and mixed rest and action tremor-essential tremor versus Parkinson’s disease. Ann Indian Acad Neurol. 2017;20(2):138–141. doi:10.4103/aian.AIAN_497_16
3. Kupsch AR, Bajaj N, Weiland F, et al. Impact of DaTscan SPECT imaging on clinical management, diagnosis, confidence of diagnosis, quality of life, health resource use and safety in patients with clinically uncertain parkinsonian syndromes: a prospective 1-year follow-up of an open-label controlled study. J Neurol Neurosurg Psychiatry. 2012;83(6):620–628. doi:10.1136/jnnp-2011-301695
4. Cummings J, Fine M, Grachev I, et al. Effective and efficient diagnosis of parkinsonism: the role of dopamine transporter SPECT imaging with ioflupane I-123 injection (DaTscanâ„¢). Ajmc. Available from: https://www.ajmc.com/journals/supplement/2014/a477_mar14_datscan/a440_mar14_datscan_s97tos109. Accessed April 3, 2019.
5. Papathanasiou N, Rondogianni P, Chroni P, et al. Interobserver variability, and visual and quantitative parameters of (123)I-FP-CIT SPECT (DaTSCAN) studies. Ann Nucl Med. 2012;26(3):234–240. doi:10.1007/s12149-011-0564-1
6. Djang DSW, Janssen MJR, Bohnen N, et al. SNM practice guideline for dopamine transporter imaging with 123i-ioflupane SPECT 1.0. J Nucl Med. 2012;53(1):154–163. doi:10.2967/jnumed.111.100784
7. Tolosa E, Borght TV, Moreno E. Accuracy of DaTSCAN (123I-ioflupane) SPECT in diagnosis of patients with clinically uncertain parkinsonism: 2-year follow-up of an open-label study. Mov Disord. 2007;22(16):2346–2351. doi:10.1002/mds.21710
8. Broski SM, Hunt CH, Johnson GB, Morreale RF, Lowe VJ, Peller PJ. Structural and functional imaging in parkinsonian syndromes. RadioGraphics. 2014;34(5):1273–1292. doi:10.1148/rg.345140009
9. Lorberboym M, Treves TA, Melamed E, Lampl Y, Hellmann M, Djaldetti R. [123I]-FP/CIT SPECT imaging for distinguishing drug-induced parkinsonism from Parkinson’s disease. Mov Disord. 2006;21(4):510–514. doi:10.1002/mds.20748
10. Marshall VL, Reininger CB, Marquardt M, et al. Parkinson’s disease is overdiagnosed clinically at baseline in diagnostically uncertain cases: a 3-year European multicenter study with repeat [123 I]FP-CIT SPECT. Mov Disord. 2009;24(4):500–508. doi:10.1002/mds.22108
11. Nuvoli S, Spanu A, Piras MR, et al. 123I-ioflupane brain SPECT and 123I-MIBG cardiac planar scintigraphy combined use in uncertain parkinsonian disorders. Medicine (Baltimore). 2017;96(21):e6967. doi:10.1097/MD.0000000000006967
12. Nuvoli S, Palumbo B, Malaspina S, Madeddu G, Spanu A. 123I-Ioflupane SPET and 123I-MIBG in the Diagnosis of Parkinson’s Disease and Parkinsonian Disorders and in the Differential Diagnosis between Alzheimer’s and Lewy’s Bodies Dementias. J Nucl Med. 2018;21(1):60–68. doi:10.1967/s002449910707
13. McKeith I, O’Brien J, Walker Z, et al. Sensitivity and specificity of dopamine transporter imaging with 123I-FP-CIT SPECT in dementia with Lewy bodies: a phase III, multicentre study. Lancet Neurol. 2007;6(4):305–313. doi:10.1016/S1474-4422(07)70057-1
14. Walker Z, Jaros E, Walker RWH, et al. Dementia with Lewy bodies: a comparison of clinical diagnosis, FP-CIT single photon emission computed tomography imaging and autopsy. J Neurol Neurosurg Psychiatry. 2007;78(11):1176–1181. doi:10.1136/jnnp.2006.110122
15. Lavalaye J, Booij J, Reneman L, Habraken JBA, van Royen EA. Effect of age and gender on dopamine transporter imaging with [123I]FP-CIT SPET in healthy volunteers. Eur J Nucl Med. 2000;27(7):867–869. doi:10.1007/s002590000279
16. Palumbo B, Fravolini ML, Nuvoli S, et al. Comparison of two neural network classifiers in the differential diagnosis of essential tremor and Parkinson’s disease by 123I-FP-CIT brain SPECT. Eur J Nucl Med Mol Imaging. 2010;37(11):2146–2153. doi:10.1007/s00259-010-1481-6
17. Henderson T. Idiopathic Parkinson: diagnosis of the deceptive | neurology times. Available from:https://www.neurologytimes.com/articles/idiopathic-parkinson-diagnosis-deceptive. Accessed April 3, 2019.
18. Benito-León J, Louis ED, Bermejo-Pareja F. Neurological disorders in central spain study group. Risk of incident Parkinson’s disease and parkinsonism in essential tremor: a population based study. J Neurol Neurosurg Psychiatry. 2009;80(4):423–425. doi:10.1136/jnnp.2008.147223
19. Gayed I, Joseph U, Fanous M, et al. The impact of DaTscan in the diagnosis of Parkinson disease. Clin Nucl Med. 2015;40(5):390–393. doi:10.1097/RLU.0000000000000766
 © 2019 The Author(s). This work is published and licensed by Dove Medical Press Limited. The full terms of this license are available at https://www.dovepress.com/terms.php and incorporate the Creative Commons Attribution - Non Commercial (unported, v3.0) License.
By accessing the work you hereby accept the Terms. Non-commercial uses of the work are permitted without any further permission from Dove Medical Press Limited, provided the work is properly attributed. For permission for commercial use of this work, please see paragraphs 4.2 and 5 of our Terms.
© 2019 The Author(s). This work is published and licensed by Dove Medical Press Limited. The full terms of this license are available at https://www.dovepress.com/terms.php and incorporate the Creative Commons Attribution - Non Commercial (unported, v3.0) License.
By accessing the work you hereby accept the Terms. Non-commercial uses of the work are permitted without any further permission from Dove Medical Press Limited, provided the work is properly attributed. For permission for commercial use of this work, please see paragraphs 4.2 and 5 of our Terms.