")
Back to Journals » Pharmacogenomics and Personalized Medicine » Volume 16
Identification of Novel Prognostic Biomarkers That are Associated with Immune Microenvironment Based on GABA-Related Molecular Subtypes in Gastric Cancer
Authors Wang B , Huang L, Ye S, Zheng Z, Liao S
Received 20 March 2023
Accepted for publication 10 June 2023
Published 28 June 2023 Volume 2023:16 Pages 665—679
DOI https://doi.org/10.2147/PGPM.S411862
Checked for plagiarism Yes
Review by Single anonymous peer review
Peer reviewer comments 3
Editor who approved publication: Dr Martin H Bluth
Beibei Wang, Linlin Huang, Shanliang Ye, Zhongwen Zheng, Shanying Liao
Department of Gastroenterology and Hepatology, Guangdong Provincial People’s Hospital, Guangdong Academy of Medical Sciences, Guangzhou, Guangdong, 510080, People’s Republic of China
Correspondence: Shanying Liao, Department of Gastroenterology and Hepatology, Guangdong Provincial People’s Hospital, Guangdong Academy of Medical Sciences, Southern Medical University, No. 106, Zhongshan 2nd Road, Guangzhou, Guangdong, 510080, People’s Republic of China, Email [email protected]; [email protected]
Background: Gamma-aminobutyric acid (GABA) plays an important role in tumorigenesis and progression. Despite this, the role of Reactome GABA receptor activation (RGRA) on gastric cancer (GC) remains unclear. This study was intended to screen RGRA-related genes in GC and investigate their prognostic value.
Methods: GSVA algorithm was used to assess the score of RGRA. GC patients were divided into two subtypes based on the median score of RGRA. GSEA, functional enrichment analysis, and immune infiltration analysis were performed between the two subgroups. Then, differentially expressed analysis, and weighted gene co-expression network analysis (WGCNA) were used to identify RGRA-related genes. The prognosis and expression of core genes were analyzed and validated in the TCGA database, GEO database, and clinical samples. ssGSEA and ESTIMATE algorithms were used to assess the immune cell infiltration in the low- and high-core genes subgroups.
Results: High-RGRA subtype had a poor prognosis and activated immune-related pathways, as well as an activated immune microenvironment. ATP1A2 was identified to be the core gene. The expression of ATP1A2 was associated with the overall survival rate and tumor stage, and its expression was down-regulated in GC patients. Furthermore, ATP1A2 expression was positively correlated with the level of immune cells, including B cells, CD8 T cells, cytotoxic cells, DC, eosinophils, macrophages, mast cells, NK cells, and T cells.
Conclusion: Two RGRA-related molecular subtypes were identified that could predict the outcome in GC patients. ATP1A2 was a core immunoregulatory gene and was associated with prognosis and immune cell infiltration in GC.
Keywords: gastric cancer, GABA, immune response, prognostic marker, molecular subtypes
Corrigendum for this paper has been published.
Introduction
Gastric cancer (GC) is a type of malignancy with a worldwide prevalence of not less than one million in recent years, resulting in over 780,000 deaths, and is the third leading cause of cancer-associated death.1,2 In recent years, the incidence of GC has decreased. This has been made possible by screening for Helicobacter pylori and improving diets. However, the incidence of GC is increasing in younger age groups.3 Despite advances in the current management of GC, including radiation, chemotherapy, and surgery, the 5-year overall survival of patients with advanced GC remains below 30%.4,5 Poor prognosis and high mortality in GC are closely related to lymph node metastasis, delayed diagnosis, and limited treatment options.6 Therefore, the development of new prognostic markers is very helpful for early diagnosis and GC prognosis.
Peritoneal metastasis is common in patients with GC, and approximately 55% of patients with distant metastatic GC experienced it.7,8 Once peritoneal metastases are diagnosed, patients have a survival time of only 4 months, which is significantly lower compared to GC patients without peritoneal metastases.9 Gamma-aminobutyric acid (GABA) is a neurotransmitter that is important for the balance between neuronal excitation and inhibition in the mammalian central nervous system.10 It has been shown that GABA deficiency is closely associated with several neurological diseases, including mania, Alzheimer’s disease, Parkinson’s disease depression, and Huntington’s chorea.11–13 Recent studies revealed that GABA is involved in the progression of cancer. GABA is implicated in the migration, differentiation, and proliferation of cancer cells.14 Tumor-derived GABA is involved in activating β-catenin signaling and contributed to the growth of tumors.15 GABA is involved in prostate cancer progression via inducing gastrin-releasing peptide generation in neuroendocrine cells.16 GABA receptor is a potential therapeutic target and prognostic marker for non-small cell lung cancer.17 Many pathways have been associated with metastasis in cancer, including GABA-related pathways. GABA treatment increased the risk of metastasis in breast cancer.18 Nembutal is a GABA-receptor agonist, which has been to inhibit colon cancer metastasis.19 GABA signaling promoted breast cancer metastasis by mediating the ERK1/2 pathway.20 However, there are few studies on GABA-related pathways involved in GC prognosis.
The advancement of gene sequencing technology and the accessibility of public databases have facilitated the gathering of gene expression data, thereby accelerating the discovery of prognostic biomarkers.21,22 In this study, our team aimed to utilize bioinformatics methods to pinpoint diagnostic biomarkers for gastric cancer. Firstly, GSVA algorithm and Kaplan-Meier were used to assess the prognosis value of GABA-related pathways. Next, GC patients were divided into two subtypes based on the median score of Reactome GABA receptor activation (RGRA). Subsequently, GSEA, functional enrichment analysis, and immune infiltration analysis were performed between the two subgroups. Finally, differentially expressed analysis, and weighted gene co-expression network analysis (WGCNA) were used to identify hub GABA-related genes. The prognosis and expression of hub gene were then analyzed and validated in the TCGA database, GEO database, and clinical samples. Overall, we found that there were two subtypes of GC with different prognoses. To gain more insights into the relationship between subtypes and immunity, the study examined the differences in immune cell infiltration and signaling pathways between the two subtypes. Additionally, ATP1A2 was identified as a potential prognostic biomarker that showed a high correlation with immune cell infiltration in GC. These findings provide a theoretical basis for further studies on the role of ATP1A2 in GC carcinogenesis and progression.
Materials and Methods
Data Collection and Processing
The RNA sequencing expression profile and corresponding clinical characteristics of 353 GC patients were downloaded from The Cancer Genome Atlas (TCGA) database, and this dataset was used as the training cohort. The GSE13911, GSE62254, and GSE84437 datasets and corresponding clinical characteristics were downloaded from the Gene Expression Omnibus (GEO) database, and these datasets were used as the validation cohorts. Probe names were converted to the corresponding gene symbols and data batches were normalized before data analysis. Furthermore, subsequent analyses only included GC patients with complete survival data. A total of five GABA-related pathways and their corresponding genes were downloaded from Molecular Signature Database (https://www.gsea-msigdb.org/gsea/msigdb).
Identification of Prognosis-Related GABA Pathways in GC
Gene Set Variation Analysis (GSVA), is a method that unsupervised assesses the variation in pathway activity across a sample population. By pre-entering a selected set of genes, GSVA is used to assess potential changes in the activity of the pathway in each sample.23 In the present study, the GSVA algorithm was applied to calculate the score of GABA-related gene sets in each GC sample. To evaluate the association between GABA-related pathways and overall survival in GC patients, a Kaplan-Meier survival analysis was then performed. A P-value less than 0.05 was considered a significant difference.
Differentially Expressed Genes (DEGs) Analysis
Based on the median score of Reactome GABA receptor activation (RGRA), GC patients were divided into low- and high-RGRA subgroups. RGRA-related genes (RRGs) between both subgroups, and DEGs between the normal and tumor groups were identified using the “limma” package. The thresholds were adjusted p < 0.05 and llogFCl≥ 0.5. The heatmap and volcano map was plotted using the ‘heatmap’ and ‘ggplot2’ packages.
Enrichment Analysis
We performed Gene Set Enrichment Analysis (GSEA) by uploading the gene expression profile data to GSEA software (https://www.gsea-msigdb.org/g2sea/index.jsp) to evaluate the primary signaling pathways relevant to these subgroups. In addition, we performed Gene ontology (GO) and Kyoto Encyclopedia of Genes and Genomes (KEGG) enrichment analyses of the DEGs using the “clusterProfiler” package. A term with p < 0.05 was considered statistically significant. The results of the top 10 terms were visualized using the “ggplot2” package.
Immune Infiltration Analysis Between the Subgroups
In the present study, a comprehensive assessment of immune infiltrate cell levels in each sample was performed using CIBERSORT, MCPCounter, and TIMER algorithms.24–26 The results of were visualized using the “ggplot2” package. The ESTIMATE software was applied to compare the ESTIMATE score, Immune score, and Stromal score between the two subgroups. The R package “ggplot2” was used to perform Spearman correlation analysis.
Construction of Weighted Gene Co-Expression Network
We established a co-expression network based on the gene expression profiles of the TCGA dataset using the WGCNA tool.27 The co-expression modules were then identified based on the dynamic cutting algorithm by applying “PickSoftThreshold” to test the optimal soft threshold. To test which important module had the highest correlation with the RGRA score, the correlation heatmap of modules and sample features was established. As hub genes, genes were selected with a module membership (MM) value > 0.8 and a gene significance (GS) value > 0.2.28
Construction of Protein-Protein Interaction (PPI) Network
The interrelationship of differentially expressed RRGs (DERGs) was assessed using the Search Tool for the Retrieval of Interacting Genes (STRING) and the PPI network was constructed.29 The visualization of the results of the PPI network was performed with the Cytoscape software (3.8.2). The core genes from the DERGs were identified by the cytoHubba plug-in of Cytoscape software.30
Survival Analysis
Gene Expression Profiling Interaction Analysis (GEPIA) is a database that provides information on the survival results of genes using data from TCGA. Survival analyses were conducted using GEPIA for the association between key gene expression levels and prognostic outcomes.31 Kaplan-Meier plotter could assess the prognostic value of biomarkers for multiple tumors. The results of the survival analysis were validated using the Kaplan-Meier plotter and GEO datasets (GSE62254 and GSE84437).
Cell Culture
The human normal gastric cell line (GES-1) and GC cell lines (BGC-823, MGC-803, and BGC-803) were obtained from Shanghai, China. The cells were cultured in RPMI-1640 medium (Life technologies, Shanghai, China) and maintained at 37 °C in a humidified atmosphere containing 5% CO2.
Measurement of the mRNA Expression of ATP1A2 in GC
From 2021 to 2022, eight pairs of cancer and para-cancer samples were collected from GC patients undergoing surgery at the Department of Gastroenterology, Guangdong Provincial People’s Hospital. The informed consent was obtained from patients. Approval for this research was from the Ethics Committee of Guangdong Provincial People’s Hospital. TRIzol reagent (Pufei, Shanghai, China) was used to extract total RNA from the tissues. DNA was prepared using Transcriptor reverse transcriptase (ThermoFisher Scientific, USA). The gene expression level was quantified by SYBR green PCR Master Mix (ThermoFisher Scientific, USA) using a Real-Time PCR System (ThermoFisher Scientific, USA). Table S1 presented the primers used in this study.
Statistical Analysis
All analyses have been carried out using R software (3.4.1). Comparisons between the two groups were made using the Wilcoxon test. Statistical significance was defined as p < 0.05.
Results
Identification of Prognosis-Related GABA Pathways
Figure 1 showed the detailed analysis process of this study. First, the GSVA algorithm was applied to calculate the score of GABA-related gene sets in each GC sample. Then, the results of the Kaplan-Meier survival analysis indicated that a high level of RGRA was associated with a poor prognosis in GC patients (Figure 2B, p = 0.03). However, the other four GABA-related gene sets (Figure 2A and C–E) did not predict prognosis in GC patients.
 |
Figure 1 Flow chart of the present study. |
 |
Figure 2 Identification of prognosis-related GABA pathways. Association of BIOCARTA GABA PATHWAT (A), REACTOME GABA RECEPTOR ACTIVATION (B), REACTOME GABA SYNTHESIS RELEASE REUPTAKE AND DEGRADATION (C), WP GABA METABOLISM AKA GHB (D), WP GABA RECEPTOR SIGNALING (E) with overall survival of GC. |
GSEA Between the Low- and High-RGRA Subgroups
Based on the median score of RGRA, GC patients were divided into low- and high-RGRA subgroups. A total of 136 RRGs between the subgroups were identified, of which the top 50 genes were shown in a heatmap (Figure 3A). To explore the biological functions that were enriched in the two subgroups, GSEA was carried out. As shown in Figures 3B and C, protein-protein interactions at synapses (NES = 2.94, p.adj < 0.001), GABA B receptor activation (NES = 2.53, p.adj < 0.001), leukocyte transendothelial migration (NES = 2.16, p.adj < 0.001), CD8 TCR pathway (NES = 2.42, p.adj < 0.001), B cell receptor signaling pathway (NES = 2.33, p.adj < 0.001), T cell receptor signaling pathway (NES = 2.35, p.adj < 0.001), chemokine signaling pathway (NES = 2.84, p.adj < 0.001), fceri mediated NF KB activation (NES = 3.01, p.adj < 0.001), signaling by the B cell receptor BCR (NES = 3.06, p.adj < 0.001), and neuronal system (NES = 3.17, p.adj < 0.001) were differentially enriched in the two subgroups.
 |
Figure 3 Identification of DEGs and GSEA. (A) The heatmap presented the top 50 DEGs between low- and high-RGRA subgroups. Bubble diagrams (B) and multipeaked maps (C) represented the GSEA results. |
The Landscape of Immune Cell Infiltrations in the Two Subgroups
CIBERSORT, MCPCounter, and TIMER algorithms indicated there was a significant difference in the levels of immune cells between the two subgroups. Compared with the high-RGRA group, the low-RGRA group exhibited a lower proportion of B cell naïve (p < 0.01), T cells regulatory (p < 0.05), monocytes (p < 0.01), dendritic cells resting (p < 0.01), mast cells resting (p < 0.05), and eosinophils (p < 0.05), whereas the level of T cells CD4 memory activated was relatively higher (p < 0.001) (Figure 4A). Compared with the high-RGRA group, the low-RGRA group had a lower proportion of T cells (p < 0.001), CD8 T cells (p < 0.05), cytotoxic lymphocytes (p < 0.01), B lineage (p < 0.001), monocytic lineage (p < 0.001), myeloid dendritic cells (p < 0.001), neutrophils (p < 0.001), endothelial cells (p < 0.001), and fibroblasts (p < 0.001) (Figure 4B). Compared with the high-RGRA group, the low-RGRA group had a lower proportion of B cell (p < 0.001), T cell CD4 (p < 0.001), T cell CD8 (p < 0.001), neutrophil (p < 0.001), macrophage (p < 0.001), and dendritic cells (p < 0.001) (Figure 4C).
 |
Figure 4 Characterization of tumor immune microenvironment between the low- and high-RGRA subgroups. CIBERSORT (A), MCPCounter (B), and TIMER (C) algorithms were used to assess the immune infiltrate cell levels. *p < 0.05, **p < 0.01, ***p < 0.001. |
Identification of DERGs and Functional Enrichment Analysis
To identify differential genes associated with RGRA, we performed differential expression analysis between two RGRA-associated subgroups. A total of 136 RRGs were identified between the high- and low-RGRA subgroups (Figure 5A). Meanwhile, a total of 6619 DEGs were screened between the normal and tumor groups (Figure 5B). By using the Venn tool, we found 73 DEGs belonging to RRGs (Figure 5C). In addition, GO and KEGG pathways were carried out to further assess the function of 73 DEGs. Cell-cell signaling, regulation of system processes, and chemical synaptic transmission were significantly enriched in biological processes (BP) (Figure 5D). The neuron part, synapse, and somatodendritic compartment were remarkably enriched in cellular components (CC) (Figure 5E). Potassium ion transmembrane transporter activity, monovalent inorganic cation transmembrane transporter activity, and ion-gated channel activity were significantly enriched in molecular function (Figure 5F). Neuroactive ligand-receptor interaction, cAMP signaling pathway, and cell adhesion molecules were significantly enriched in the KEGG pathway (Figure 5G).
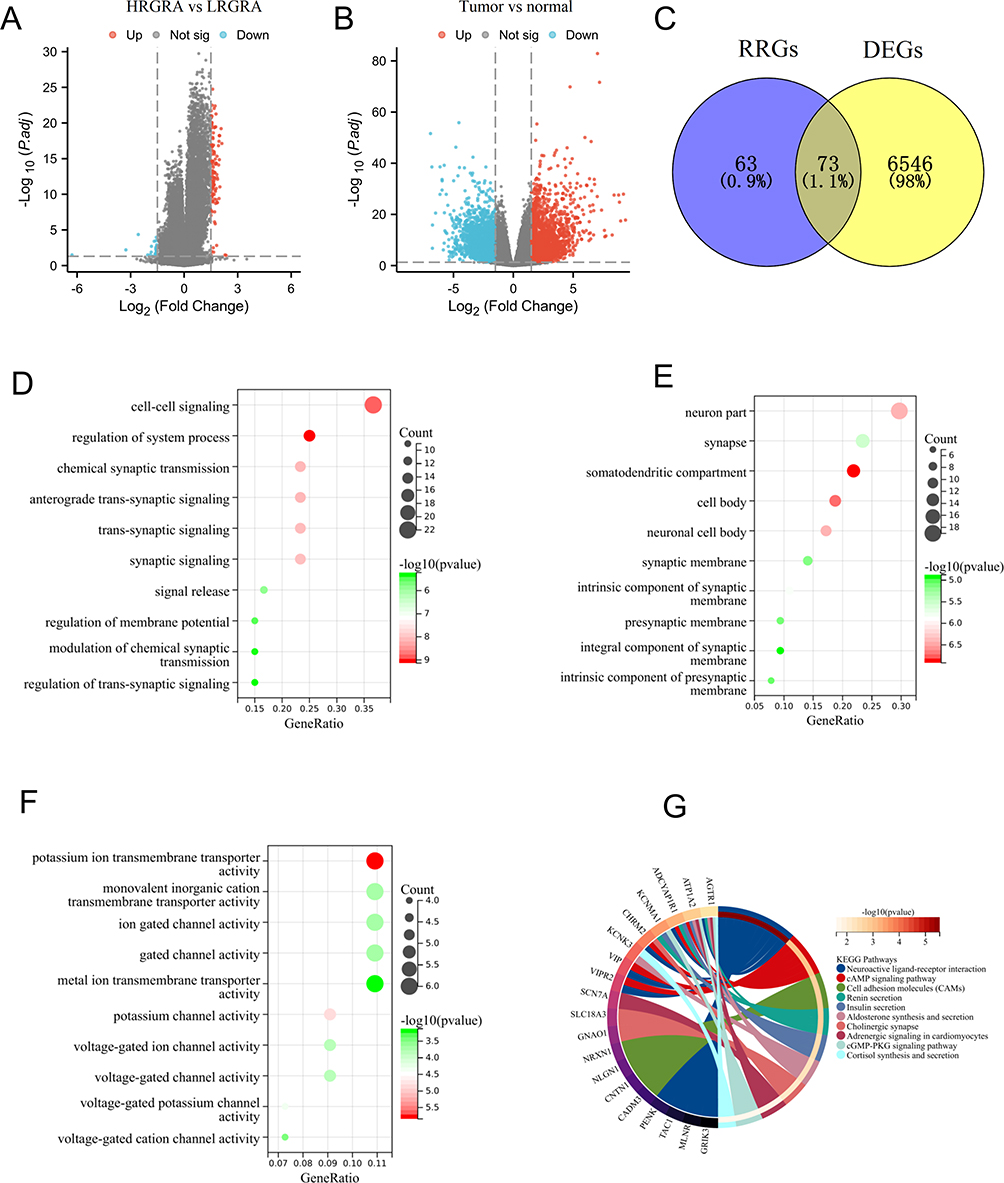 |
Figure 5 Identification of DERGs and functional enrichment analysis. (A) The volcano plot depicts the RRGs between the low- and high-RGRA subgroups. (B) The volcano plot depicts the DEGs between the normal and tumor groups. (C) Identification of intersection genes between RRGs and DEGs. The GO-BP (D), GO-CC (E), and GO-MF (F) results were presented by bubble diagrams. The KEGG (G) results were presented by loop diagrams. |
Identification of Key Modules Related to RGRA
To further identify hub RGRA-associated genes, we performed WGCNA. Figure 6A and B showed that we have chosen β = 5 to ensure a scale-free network and perform WGCNA. Then, 64 modules were identified with different colors (Figure 6C). Among these modules, the bule (r = 0.6, p = 3.3e-38) and paleturquoise (r = 0.6, p = 1.5e-38) modules had the highest correlation with RGRA. Therefore, the genes in the two modules were the subject of a hub gene identification.
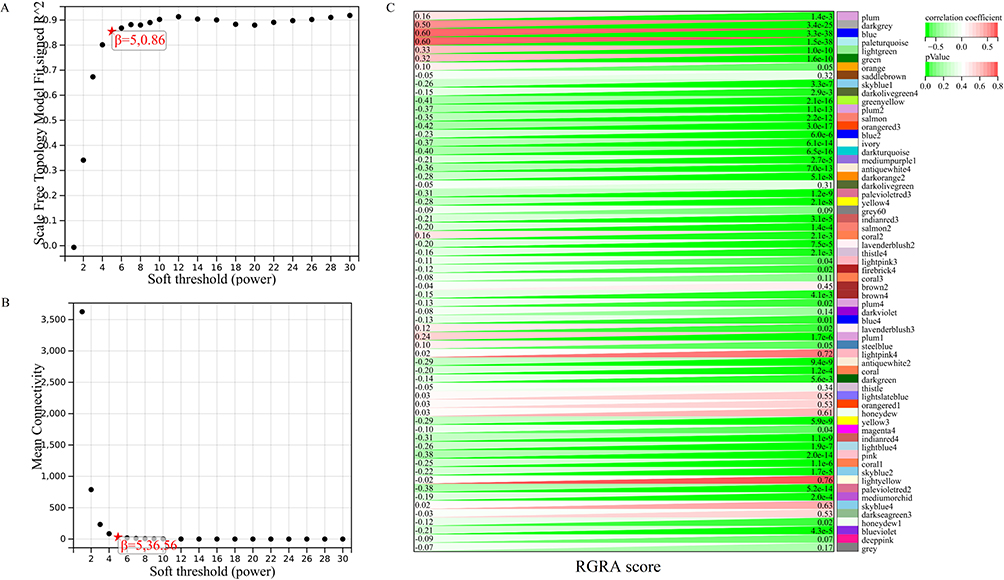 |
Figure 6 Identification of key module related to RGRA. (A and B) To ensure the scale-free distribution, the optimal soft threshold was selected. (C) Heatmap for the correlation between RGRA and modules. |
Identification and Validation of Prognostic Genes
Figure 7A illustrated the PPI network diagram for 73 DERGs. To screen genes with a high degree of association within the key modules, the thresholds of MM > 0.8 and GS > 0.2 were used to identify an important gene (ATP1A2) for further analysis (Figure 7B). The survival analysis by GEPIA showed that the ATP1A2 expression was significantly associated with overall survival in GC patients (p = 0.012, Figure 7C). Compared with the normal group, the expression of ATP1A2 was significantly downregulated in the GC group (p < 0.05, Figure 7D). Furthermore, these results were further validated by external datasets and clinical samples. In the GSE13911 dataset (Figure 8A) and clinical samples (Figure 8B), ATP1A2 expression was significantly downregulated in the tumor group. In the Human Protein Atlas (HPA), the protein expression of ATPA2 was also significantly downregulated in the tumor group (Figure S1A and B). In the Kaplan-Meier plotter (p = 1.4e-06, Figure 8C), GSE62254 (p = 3e-04, Figure 8D), and GSE84437 (p = 0.0172, Figure 8E), ATP1A2 expression was associated with overall survival in GC patients.
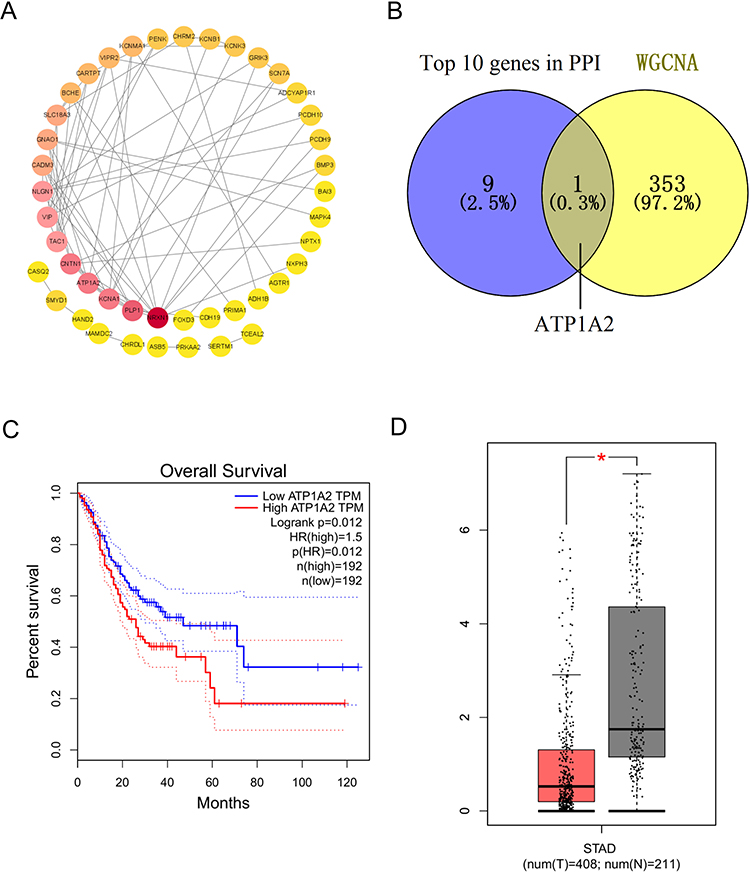 |
Figure 7 Identification of prognostic genes. (A) PPI network of DERGs. (B) Overlap of top 10 DERGs and key module genes. Survival analysis (C) and expression analysis (D) of ATP1A2 genes in GC by GEPIA. *p < 0.05. |
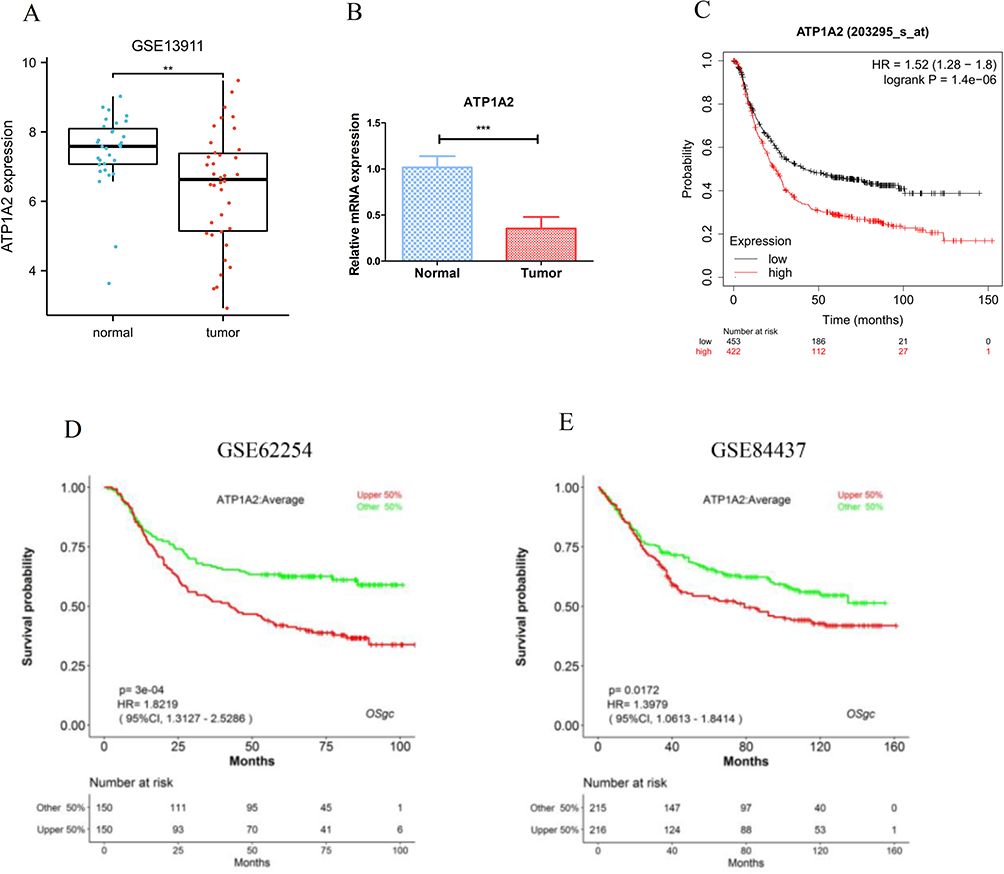 |
Figure 8 Validation of ATP1A2 gene by independent datasets. Validation of ATP1A2 expression by GSE13911 dataset (A) and clinical samples (B). Validation of ATP1A2 prognostic value by Kaplan-Meier plotter (C), GSE62254 (D), and GSE84437 (E). **p < 0.01, ***p < 0.001. |
The relationship between ATP1A2 and clinical features was also investigated. ATP1A2 expression was lower in the over 65 than in the under 65 (p < 0.01, Figure S2A). ATP1A2 expression was lower in the G1&G2 grade than in the G3 grade (p < 0.001, Figure S2B). ATP1A2 expression was lower in stage I than in stage II and stage III (p < 0.01, Figure S2C). ATP1A2 expression was lower in the T1&T2 stage than in the T3&T4 stage (p < 0.01, Figure S2D). No statistical difference was found between ATP1A2 expression and gender (Figure S2E), pathologic N stage (Figure S2F), and pathologic M stage (Figure S2G). All these results showed that ATP1A2 was associated with clinical features in GC patients.
Relationship Between ATP1A2 and Immune Cell Infiltration
In the present study, the level of infiltrating immune cells in GC was assessed through GSEA and ESTIMATE algorithms. Compared with the high-ATP1A2 group, the low-ATP1A2 group exhibited a lower proportion of B cells, CD8 T cells, cytotoxic cells, DC, eosinophils, iDC, macrophages, mast cells, NK cells, pDC, T cells, Tcm, Tem, TFH, Tgd, and Th1 cells, whereas the level of Th17 cells and Th2 cells was relatively higher (Figure 9A). The expression of ATP1A2 was positively correlated with the level of B cells, CD8 T cells, cytotoxic cells, DC, eosinophils, iDC, macrophages, mast cells, NK cells, pDC, T cells, Tcm, Tem, TFH, Tgd, and Th1 cells; while negatively correlated with the level of Th17 cells and Th2 cells (Figure 9B). As shown in Figure 9C, compared with the high-ATP1A2 group, the low-ATP1A2 group exhibited a lower of the stromal score, immune score, and ESTIMATE score.
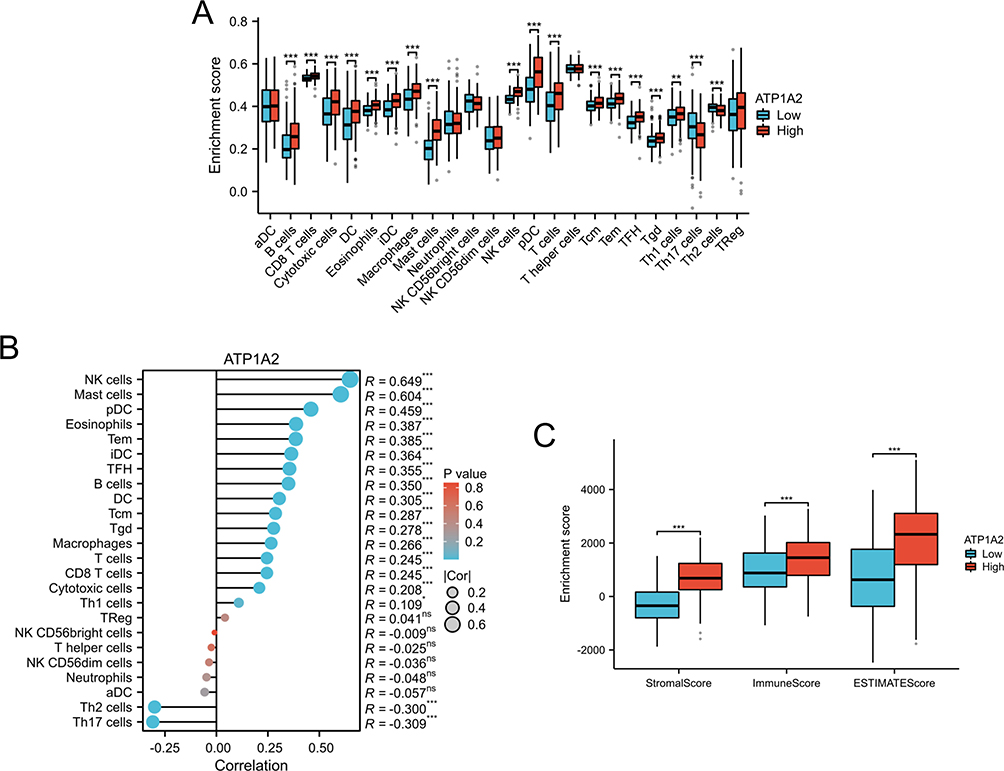 |
Figure 9 Relationship between ATP1A2 and immune cell infiltration. (A) The histogram represents the different levels of immune infiltration between the low- and high-ATP1A2 subgroups. (B) Correlation analysis between ATP1A2 expression and immune cell infiltration. (C) The histogram represents the different levels of Stromal score, Immune score, and ESTIMATE score between the low- and high-ATP1A2 subgroups. *p < 0.05, **p < 0.01, ***p < 0.001. Abbreviation: ns, not significant. |
Validation of ATP1A2 Gene Expression by Cell Experiments
In order to verify the results of our bioinformatics analysis, we further conducted cell experiments. The qRT-PCR results indicated that the levels of ATP1A2 expression were down-regulated in AGS, BGC-823, and MGC-803 cells compared to GES-1 cells (p < 0.01) (Figure 10).
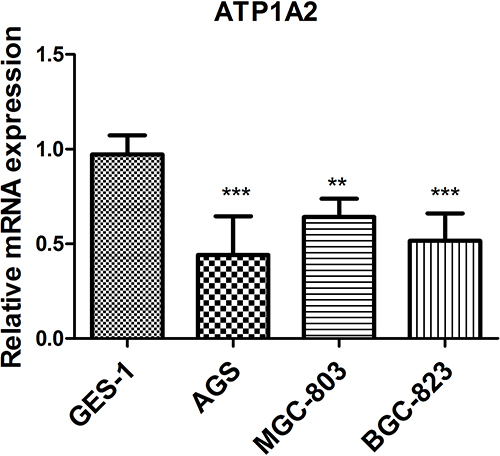 |
Figure 10 Analysis of ATP1A2 gene expression level in GC cell lines. **p < 0.01 and ***p < 0.001. |
Discussion
In recent years, the treatment of GC is based on surgical resection with adjuvant treatments such as targeted therapy, gene therapy, chemotherapy, and radiotherapy, which has only led to a significant decrease in the incidence of gastric cancer.5,32,33 Despite this, GC is still the second most common cause of cancer-related deaths in China.34 Developing new prognostic markers and therapeutic targets will therefore help diagnose and predict GC. The origin of GABA remains unclear, but it has been found in breast, ovarian, stomach, and glioma cancer.35 In addition, GABA also involves in the biological process of tumor cells including migration, differentiation, and proliferation.14 Moreover, GABA level is a predictor of mortality in patients with colon and lung cancer.15 Studies have shown that GABA accumulation promotes immune suppression and tumor cell proliferation and that inhibiting the GABA pathway may improve the effectiveness of immunotherapies against tumors.36 Therefore, genes associated with the GABA pathway should receive attention, and we hypothesized that molecular subtypes based on the GABA pathway could guide the diagnosis of GC and improve its survival rate.
In the present study, the GSVA algorithm was used to calculate the score of GABA-related gene sets in each GC sample. The results indicated that a high level of RGRA was associated with a poor prognosis in GC patients. Subsequently, based on the median score of RGRA, GC patients were divided into low- and high-RGRA subgroups. GSEA results showed that GABA B receptor activation, B cell receptor signaling pathway, T cell receptor signaling pathway, and chemokine signaling pathway were differentially enriched in these two subgroups. A previous study has indicated that GABA participated in the proliferation of the gastric cancer cell line.37 In GC, CXC chemokines and their receptors regulated tumor formation by regulating tumor metastasis, invasion, growth, and transformation, and indirectly by regulating tumor-leucocyte interactions and angiogenesis.38 The immune microenvironment also plays an important role in the progression of chronic inflammation to GC.39 In addition, CIBERSORT, MCPCounter, and TIMER algorithms were used to characterize the immune infiltration landscape between the two subtypes. Our results showed that the high-RGRA subtype had a worse prognosis and an activated immune microenvironment characterized by high infiltration levels of immune cells. Substantially reduced DC, macrophages, T cells, and CD8 T cells, especially in the high-RGRA subtype with a poor prognosis. Their results were consistent with previous studies. The prognosis of GC patients was influenced by DC subsets and CD4/CD8+ cells.40 The M2 phenotype of tumor-associated macrophages could predict the prognosis in GC.41 The presence of CD8+ tumor-infiltrating lymphocytes was an independent prognostic marker for GC patients.42 Thus, the involvement of the GABA pathway in the pathogenesis of GC may be mediated through the regulation of immune responses between the two molecular subtypes.
ATP1A2 is a gene encoding the catalytic subunits of Na/K-ATPases that play a key role in the basic electrophysiology of neurons.43 Recent literatures have shown that there is abnormal expression of ATP1A2 in some type of cancers. This abnormal expression is thought to play a role in the development and onset of cancer.44,45 In addition, ATP1A2 suppressed invasion, migration, apoptosis, and proliferation in prostate cancer by inactivating the Smad/TGF-β pathway.46 In our study, the results of multiple databases showed that ATP1A2 was down-regulated in GC patients. We also found that a higher level of ATP1A2 was associated with shorter overall survival time in GC patients, which was consistent with the effect of ATP1A2 on prognosis in ovarian cancer and bladder cancer.45,47 In addition, this result was validated in other independent datasets. These results indicated that ATP1A2 has potential as a tumor promoter and its high expression was significantly associated with poor prognosis in patients with GC.
Tumor microenvironment is composed of immune cells, endothelial cells, fibroblasts, and stromal cells. It served as an indicator of patients’ prognosis and the effectiveness of immunotherapy.48,49 A recent study has shown that a high immune score is an independent predictor of poor overall survival in patients with GC.50 Compared to the high-ATP1A2 group, the low-ATP1A2 group displayed a decrease in stromal score, immune score, and ESTIMATE score. Our study presented a new angle on the relationship between ATP1A2 and the prognosis of GC patients. It proposed that the correlation between ATP1A2 and immune score implied that ATP1A2 expression could impact the infiltration of immune cells. Additionally, another important result of the present study was that ATP1A2 expression was positively correlated with the level of immune cells, including CD8 T cells, cytotoxic cells, plasmacytoid dendritic cells (pDC), eosinophils, macrophages, mast cells, and T cells. A recent study has revealed that IL-10+ tumor-associated macrophages may contribute to an immunoevasive microenvironment, leading to a poor prognosis and reduced response to fluorouracil-based adjuvant chemotherapy.51 The presence of a higher level of M2 phenotype of tumor-associated macrophages has been linked to poor prognosis in patients with GC.41 A previous study indicated that the presence of mast cells in the tumor area can result in a higher incidence of tumor vascularization, leading to higher rates of tumor growth and metastasis.52 The abundance of intratumoral PD-1+CD8+ T cells is a predictor of an unfavorable prognosis in GC.53 It has been reported that pDC in tumor tissue and peripheral blood could predict poor outcome in patients with GC.54 These findings further showed that ATP1A2 may have an impact on the prognosis of GC patients, in part through the influence of immune cell infiltration in the tumor. Collectively, our research indicated that increased expression of ATP1A2 contributed to immune cell infiltration and was associated with a negative prognosis in patients with GC, which provided insight into the correlation between ATP1A2 expression and patient outcomes in GC.
Conclusion
Overall, two subtypes of GC were characterized based on RGRA-related genes and found that different subtypes of GC exhibited different prognoses. Further insights into the relationship between RGRA and immunity were gained by examining differences in immune cell infiltration and signaling pathways between the RGRA-related subtypes of GC. Furthermore, ATP1A2 was identified as a potential prognostic biomarker that was highly correlated with immune cell infiltration in GC. This provided a theoretical basis for further studies on the role of ATP1A2 in GC carcinogenesis and progression.
Data Sharing Statement
The data used in our study are available from the GEO (https://www.ncbi.nlm.nih.gov/geo/) database, GEPIA2 database (http://gepia2.cancer-pku.cn), and TCGA (https://portal.gdc.cancer.gov/) database.
Ethics Approval and Consent to Participate
This study was performed in accordance with the Helsinki Declaration. Approval for this research was from the Ethics Committee of Guangdong Provincial People’s Hospital. The informed consent was obtained from patients.
Funding
This work was supported by grants from the National Natural Science Foundation of China (No. 82002608), the Science and Technology Program of Guangzhou, China (No. 202102080068 and No. 202102021169).
Disclosure
The authors report no conflicts of interest in this work.
References
1. Sung H, Ferlay J, Siegel RL, et al. Global cancer statistics 2020: GLOBOCAN estimates of incidence and mortality worldwide for 36 cancers in 185 countries. CA. 2021;71:209–249. doi:10.3322/caac.21660
2. Ferlay J, Colombet M, Soerjomataram I, et al. Estimating the global cancer incidence and mortality in 2018: GLOBOCAN sources and methods. Int J Cancer. 2019;144:1941–1953. doi:10.1002/ijc.31937
3. Song M, Rabkin CS, Camargo MC. Gastric cancer: an evolving disease. Curr Treat Options Gastroenterol. 2018;16:561–569. doi:10.1007/s11938-018-0203-1
4. Maharjan U, Kauppila JH. Survival trends in gastric cancer patients between 1987 and 2016: a population-based cohort study in Finland. Gastric Cancer. 2022;25:989–1001. doi:10.1007/s10120-022-01326-5
5. Song Z, Wu Y, Yang J, Yang D, Fang X. Progress in the treatment of advanced gastric cancer. Tumour Biol. 2017;39:1010428317714626. doi:10.1177/1010428317714626
6. Yoon H, Kim N. Diagnosis and management of high risk group for gastric cancer. Gut Liver. 2015;9:5–17. doi:10.5009/gnl14118
7. Shao S, Yang X, Zhang YN, et al. Oncolytic virotherapy in peritoneal metastasis gastric cancer: the challenges and achievements. Front Mol Biosci. 2022;9:835300. doi:10.3389/fmolb.2022.835300
8. Yao X, Ajani JA, Song S. Molecular biology and immunology of gastric cancer peritoneal metastasis. Transl Gastroenterol Hepatol. 2020;5:57. doi:10.21037/tgh.2020.02.08
9. Sasako M, Sano T, Yamamoto S, et al. D2 lymphadenectomy alone or with para-aortic nodal dissection for gastric cancer. N Engl J Med. 2008;359:453–462. doi:10.1056/NEJMoa0707035
10. Gajcy K, Lochyński S, Librowski T. A role of GABA analogues in the treatment of neurological diseases. Curr Med Chem. 2010;17:2338–2347. doi:10.2174/092986710791698549
11. Cherubini E, Di Cristo G, Avoli M. Dysregulation of GABAergic signaling in neurodevelomental disorders: targeting cation-chloride co-transporters to re-establish a proper E/I balance. Front Cell Neurosci. 2021;15:813441. doi:10.3389/fncel.2021.813441
12. Yuan H, Low CM, Moody OA, Jenkins A, Traynelis SF. Ionotropic GABA and glutamate receptor mutations and human neurologic diseases. Mol Pharmacol. 2015;88:203–217. doi:10.1124/mol.115.097998
13. Fontes MAP, Vaz GC, Cardoso TZD, et al. GABA-containing liposomes: neuroscience applications and translational perspectives for targeting neurological diseases. Nanomedicine. 2018;14:781–788. doi:10.1016/j.nano.2017.12.007
14. Watanabe M, Maemura K, Oki K, Shiraishi N, Shibayama Y, Katsu K. Gamma-aminobutyric acid (GABA) and cell proliferation: focus on cancer cells. Histol Histopathol. 2006;21:1135–1141. doi:10.14670/HH-21.1135
15. Huang D, Wang Y, Thompson JW, et al. Cancer-cell-derived GABA promotes β-catenin-mediated tumour growth and immunosuppression. Nat Cell Biol. 2022;24:230–241. doi:10.1038/s41556-021-00820-9
16. Solorzano SR, Imaz-Rosshandler I, Camacho-Arroyo I, et al. GABA promotes gastrin-releasing peptide secretion in NE/NE-like cells: contribution to prostate cancer progression. Sci Rep. 2018;8:10272. doi:10.1038/s41598-018-28538-z
17. Zhang X, Zhang R, Zheng Y, et al. Expression of gamma-aminobutyric acid receptors on neoplastic growth and prediction of prognosis in non-small cell lung cancer. J Transl Med. 2013;11:102. doi:10.1186/1479-5876-11-102
18. Dahn ML, Walsh HR, Dean CA, et al. Metabolite profiling reveals a connection between aldehyde dehydrogenase 1A3 and GABA metabolism in breast cancer metastasis. Metabolomics. 2022;18:9. doi:10.1007/s11306-021-01864-6
19. Thaker PH, Yokoi K, Jennings NB, et al. Inhibition of experimental colon cancer metastasis by the GABA-receptor agonist nembutal. Cancer Biol Ther. 2005;4:753–758. doi:10.4161/cbt.4.7.1827
20. Zhang D, Li X, Yao Z, Wei C, Ning N, Li J. GABAergic signaling facilitates breast cancer metastasis by promoting ERK1/2-dependent phosphorylation. Cancer Lett. 2014;348:100–108. doi:10.1016/j.canlet.2014.03.006
21. Fu J, Lin J, Zeng X, Li G, Wei Y, Xian L. GABRP is a promising prognostic biomarker and associated with immune cell infiltration in lung squamous cell carcinoma. Pharmgenomics Pers Med. 2023;16:357–371. doi:10.2147/PGPM.S403868
22. Yang L, Zhu J, Wang L, He L, Gong Y, Luo Q. A novel risk score model based on gamma-aminobutyric acid signature predicts the survival prognosis of patients with breast cancer. Front Oncol. 2023;13:1108823. doi:10.3389/fonc.2023.1108823
23. Hänzelmann S, Castelo R, Guinney J. GSVA: gene set variation analysis for microarray and RNA-seq data. BMC Bioinform. 2013;14:7. doi:10.1186/1471-2105-14-7
24. Chen B, Khodadoust MS, Liu CL, Newman AM, Alizadeh AA. Profiling tumor infiltrating immune cells with CIBERSORT. Methods Mol Biol. 2018;1711:243–259.
25. Becht E, Giraldo NA, Lacroix L, et al. Estimating the population abundance of tissue-infiltrating immune and stromal cell populations using gene expression. Genome Biol. 2016;17:218. doi:10.1186/s13059-016-1070-5
26. Li T, Fan J, Wang B, et al. TIMER: a web server for comprehensive analysis of tumor-infiltrating immune cells. Cancer Res. 2017;77:e108–e110. doi:10.1158/0008-5472.CAN-17-0307
27. Langfelder P, Horvath S. WGCNA: an R package for weighted correlation network analysis. BMC Bioinform. 2008;9:559. doi:10.1186/1471-2105-9-559
28. Tang J, Kong D, Cui Q, et al. Prognostic genes of breast cancer identified by gene co-expression network analysis. Front Oncol. 2018;8:374. doi:10.3389/fonc.2018.00374
29. Szklarczyk D, Morris JH, Cook H, et al. The STRING database in 2017: quality-controlled protein-protein association networks, made broadly accessible. Nucleic Acids Res. 2017;45:D362–d368. doi:10.1093/nar/gkw937
30. Chin CH, Chen SH, Wu HH, Ho CW, Ko MT, Lin CY. cytoHubba: identifying hub objects and sub-networks from complex interactome. BMC Syst Biol. 2014;8:S11. doi:10.1186/1752-0509-8-S4-S11
31. Tang Z, Li C, Kang B, Gao G, Li C, Zhang Z. GEPIA: a web server for cancer and normal gene expression profiling and interactive analyses. Nucleic Acids Res. 2017;45:W98–w102. doi:10.1093/nar/gkx247
32. Tan Z. Recent advances in the surgical treatment of advanced gastric cancer: a review. Med Sci Monit. 2019;25:3537–3541. doi:10.12659/MSM.916475
33. Johnston FM, Beckman M. Updates on management of gastric cancer. Curr Oncol Rep. 2019;21:67.
34. Chen W, Zheng R, Baade PD, et al. Cancer statistics in China, 2015. CA. 2016;66:115–132. doi:10.3322/caac.21338
35. Jiang SH, Hu LP, Wang X, Li J, Zhang ZG. Neurotransmitters: emerging targets in cancer. Oncogene. 2020;39:503–515. doi:10.1038/s41388-019-1006-0
36. Schuller H, Majidi M, Alwadei H. The GABA-B receptor (GABA-BR) is a novel drug target for the treatment and prevention of pancreatic cancer. Cancer Res. 2007;67:1.
37. Maemura K, Shiraishi N, Sakagami K, et al. Proliferative effects of gamma-aminobutyric acid on the gastric cancer cell line are associated with extracellular signal-regulated kinase 1/2 activation. J Gastroenterol Hepatol. 2009;24:688–696. doi:10.1111/j.1440-1746.2008.05687.x
38. Lee HJ, Song IC, Yun HJ, Jo DY, Kim S. CXC chemokines and chemokine receptors in gastric cancer: from basic findings towards therapeutic targeting. World J Gastroenterol. 2014;20:1681–1693. doi:10.3748/wjg.v20.i7.1681
39. Zavros Y, Merchant JL. The immune microenvironment in gastric adenocarcinoma. Nat Rev Gastroenterol Hepatol. 2022;19:451–467.
40. Li F, Sun Y, Huang J, Xu W, Liu J, Yuan Z. CD4/CD8 + T cells, DC subsets, Foxp3, and IDO expression are predictive indictors of gastric cancer prognosis. Cancer Med. 2019;8:7330–7344. doi:10.1002/cam4.2596
41. Eum HH, Kwon M, Ryu D, et al. Tumor-promoting macrophages prevail in malignant ascites of advanced gastric cancer. Exp Mol Med. 2020;52:1976–1988.
42. Li Q, Zhang D, He W, et al. CD8(+) T cells located in tertiary lymphoid structures are associated with improved prognosis in patients with gastric cancer. Oncol Lett. 2020;20:2655–2664. doi:10.3892/ol.2020.11828
43. Qu J, Yang ZQ, Zhang Y, et al. Common variants of ATP1A3 but not ATP1A2 are associated with Chinese genetic generalized epilepsies. J Neurol Sci. 2015;354:56–62.
44. Bogdanov A, Moiseenko F, Dubina M. Abnormal expression of ATP1A1 and ATP1A2 in breast cancer. F1000Research. 2017;6:10. doi:10.12688/f1000research.10481.1
45. Tan Z, Fu S, Feng R, et al. Identification of potential biomarkers for progression and prognosis of bladder cancer by comprehensive bioinformatics analysis. J Oncol. 2022;2022:1802706. doi:10.1155/2022/1802706
46. Zhang B, Zhu Z, Zhang X, Li F, Ding A. Inhibition of the proliferation, invasion, migration, and epithelial-mesenchymal transition of prostate cancer cells through the action of ATP1A2 on the TGF-β/Smad pathway. Transl Androl Urol. 2022;11:53–66.
47. Zhang X, Wei X, Bai G, et al. Identification of three potential prognostic genes in platinum-resistant ovarian cancer via integrated bioinformatics analysis. Cancer Manag Res. 2021;13:8629–8646. doi:10.2147/CMAR.S336672
48. Khan M, Lin J, Wang B, Chen C, Huang Z. A novel necroptosis-related gene index for predicting prognosis and a cold tumor immune microenvironment in stomach adenocarcinoma. Front Immunol. 2022;13:968165.
49. Ishimoto T, Sawayama H, Sugihara H, Baba H. Interaction between gastric cancer stem cells and the tumor microenvironment. J Gastroenterol. 2014;49:1111–1120.
50. Zhu X, Xie X, Zhao Q, Zhang L, Li C, Zhao D. Potential prognostic value and mechanism of stromal-immune signature in tumor microenvironment for stomach adenocarcinoma. Biomed Res Int. 2020;2020:4673153.
51. Zhang H, Li R, Cao Y, et al. Poor clinical outcomes and immunoevasive contexture in intratumoral IL-10-producing macrophages enriched gastric cancer patients. Ann Surg. 2022;275:e626–e635. doi:10.1097/SLA.0000000000004037
52. Yano H, Kinuta M, Tateishi H, et al. Mast cell infiltration around gastric cancer cells correlates with tumor angiogenesis and metastasis. Gastric Cancer. 1999;2:26–32.
53. Yu K, Gu Y, Zhang P, et al. Intratumoral PD-1(+)CD8(+) T cells associate poor clinical outcomes and adjuvant chemotherapeutic benefit in gastric cancer. Br J Cancer. 2022;127:1709–1717. doi:10.1038/s41416-022-01939-8
54. Liu X, Yu H, Yan C, et al. Plasmacytoid dendritic cells and ICOS(+) Regulatory T cells predict poor prognosis in gastric cancer: a pilot study. J Cancer. 2019;10:6711–6715.
 © 2023 The Author(s). This work is published and licensed by Dove Medical Press Limited. The full terms of this license are available at https://www.dovepress.com/terms.php and incorporate the Creative Commons Attribution - Non Commercial (unported, v3.0) License.
By accessing the work you hereby accept the Terms. Non-commercial uses of the work are permitted without any further permission from Dove Medical Press Limited, provided the work is properly attributed. For permission for commercial use of this work, please see paragraphs 4.2 and 5 of our Terms.
© 2023 The Author(s). This work is published and licensed by Dove Medical Press Limited. The full terms of this license are available at https://www.dovepress.com/terms.php and incorporate the Creative Commons Attribution - Non Commercial (unported, v3.0) License.
By accessing the work you hereby accept the Terms. Non-commercial uses of the work are permitted without any further permission from Dove Medical Press Limited, provided the work is properly attributed. For permission for commercial use of this work, please see paragraphs 4.2 and 5 of our Terms.