Back to Journals » OncoTargets and Therapy » Volume 11
Identification of molecular target genes and key pathways in hepatocellular carcinoma by bioinformatics analysis
Authors Zhou L, Du Y, Kong L, Zhang X, Chen Q
Received 10 November 2017
Accepted for publication 16 January 2018
Published 4 April 2018 Volume 2018:11 Pages 1861—1869
DOI https://doi.org/10.2147/OTT.S156737
Checked for plagiarism Yes
Review by Single anonymous peer review
Peer reviewer comments 3
Editor who approved publication: Dr William C. Cho
Lei Zhou, Yanyan Du, Lingqun Kong, Xingyuan Zhang, Qiangpu Chen
Department of Hepatobiliary Surgery, The Affiliated Hospital of Binzhou Medical University, Binzhou, China
Background and aim: Hepatocellular carcinoma (HCC) is a major cause of cancer mortality and is increasing incidence worldwide. The aim of this study was to identify the key genes and microRNAs in HCC and explore their potential mechanisms.
Methods: The gene expression profiles of GSE76427, GSE64041, GSE57957, and the microRNA dataset GSE67882 were downloaded from the Gene Expression Omnibus database. The online tool GEO2R was used to obtain differentially expressed genes (DEGs) and miRNAs (DEMs). The gene ontology and the Kyoto Encyclopedia of Genes and Genomes pathway enrichment analysis were performed for DEGs using the Database for Annotation, Visualization, and Integrated Discovery. A protein–protein interaction (PPI) network of the DEGs was constructed by Search Tool for the Retrieval of Interacting Genes and visualized by Cytoscape. Moreover, miRecords was used to predict the target genes of DEMs.
Results: In total, 106 DEGs were screened out in HCC, consisting of 89 upregulated genes and 17 downregulated genes, which were mainly enriched in biological processes associated with oxidation–reduction process. Besides, the Kyoto Encyclopedia of Genes and Genomes pathways including chemical carcinogenesis, drug metabolism-cytochrome P450, tryptophan metabolism, and retinol metabolism were involved. A PPI network was constructed consisting of 105 nodes and 66 edges. A significant module including nine hub genes, ASPM, AURKA, CCNB2, CDKN3, MELK, NCAPG, NUSAP1, PRC1, and TOP2A, was detected from the PPI network by Molecular Complex Detection. The enriched functions were mainly associated with the mitotic cell cycle process, cell division, and mitotic cell cycle. In addition, a total of 21 DEMs were identified, including 9 upregulated and 12 downregulated miRNAs. Interestingly, ZBTB41 was the potential target of seven miRNAs. Finally, the nine hub genes and three miRNA-target genes expression levels were validated by reverse transcription-polymerase chain reaction. The relative expression levels of nine genes (ASPM, AURKA, CDKN3, MELK, NCAPG, PRC1, TOP2A, ZBTB41, and ZNF148) were significantly upregulated in cancer tissues.
Conclusion: This study identified the key genes and potential molecular mechanisms underlying the development of HCC, which could provide new insight for HCC interventional strategies.
Keywords: hepatocellular carcinoma, bioinformatic analysis, differentially expressed genes, differentially expressed microRNAs
Introduction
On the global scale, hepatocellular carcinoma (HCC) is a major contributor to both cancer incidence and mortality. HCC is the fifth most common malignant tumor and the second most common cause of cancer deaths worldwide, with China accounting for over 50% of the world’s burden.1 Although several advances in HCC prevention, early detection, and diagnosis are efficacious and could reduce the incidence and mortality of HCC, the 5-year survival rate remains unsatisfactory.2 Like other cancers, HCC is considered as a heterogeneous disease in which gene aberrations, cellular context, and environmental influences concur to tumor initiation, progression, and metastasis.3 Recently, many studies have demonstrated that multiple genes and cellular pathways participate in the occurrence and development of HCC;4 however, the precise molecular mechanisms underlying HCC progression is not clear. Therefore, it is important to investigate the target molecules and molecular mechanisms underlying the development and progression of HCC for developing more effective diagnostic and therapeutic strategies.
The high-throughput platforms, such as microarrays, for analysis of genetic alteration during tumorigenesis, are increasingly valued as promising tools in medical oncology research.5–7 In the last decade, microarray technology was used to investigate gene expression profiling in HCC carcinogenesis. Recently, microarray technology combining bioinformatics analysis has allowed the comprehensive identification of hundreds of differentially expressed genes (DEGs) involved in the development and progression of HCC, due to their ability to quickly process huge datasets. The reported studies showed that the identification of distinct gene expression signatures and their usefulness as molecular markers played important role in the prediction of HCC occurrence, progression,8 and clinical outcomes such as survival, metastasis, and recurrence in HCC patients,9–11 as well as identification of the candidate drugs for HCC treatment.12 In addition, bioinformatic tools have also greatly performed for detection of miRNA targets to make prediction about miRNAs–target gene interactions for HCC.13,14 In this study, three mRNA microarray datasets and an miRNA dataset were downloaded from Gene Expression Omnibus (http://www.ncbi.nlm.nih.gov/geo/), and analyzed to identify DEGs and differentially expressed miRNAs (DEMs) between HCC tissues and nontumor tissues samples. Subsequently, functional enrichment and network analysis were applied for the identification of DEGs, combined with “mRNA–miRNA” interaction analysis. This work will provide further insight into HCC development at the molecular level and explore the potential molecular targets for new interventional strategies.
Materials and methods
Microarray data
Three gene expression profiles (GSE76427, GSE64041, and GSE57957) and the miRNA expression profile of GSE67882 were downloaded from the Gene Expression Omnibus database. The array data of GSE76427 included 115 HCC tissue samples and 52 nontumor samples (percentages of HCC patients with hepatitis B virus infection and cirrhosis were 46% and 54%, respectively). GSE64041 consisted of 60 paired HCC and nontumor liver tissue samples (all the samples from an unselected patient population with all tumor stages).15 GSE57957 included 39 HCC tissue samples and 39 nontumor samples. The miRNA expression profile of GSE67882 included four HCC tissue samples (hepatitis B virus–infected HCC) and eight nontumor samples (chronic hepatitis B patients with no fibrosis).16
Identification of DEGs
The analysis was performed using the Gene Expression Omnibus online tool GEO2R (http://www.ncbi.nlm.nih.gov/geo/geo2r/), which can compare two groups of samples under the same experimental conditions and was applied to explore DEGs and DEMs between HCC and nontumor samples.17 The adjusted P-values (adj P-value) were applied to correct for the occurrence of false-positive results using the Benjamini and Hochberg false discovery rate method by default. The |logFC| larger than 1 and the adj P-value <0.01 were used as the cut-off criteria.
Gene ontology and pathway enrichment analysis of DEGs
The Database for Annotation, Visualization, and Integrated Discovery (DAVID; http://david.abcc.ncifcrf.gov/) is an online program that provides a comprehensive set of high-throughput gene functional analysis for researchers to understand biological characteristics.18 Gene ontology (GO) and Kyoto Encyclopedia of Genes and Genomes (KEGG) pathway enrichment analysis were performed using DAVID online tool to analyze the DEGs at the functional level; P<0.05 was considered statistically significant.
Protein–protein interaction (PPI) network construction and module analysis
The Search Tool for the Retrieval of Interacting Genes (http://string.embl.de/) database is an online tool designed to construct a PPI network of DEGs and analyze the functional interactions between proteins. A confidence score ≥0.7 was set as significant. Subsequently, the result was visualized using Cytoscape software (3.5.1). The Molecular Complex Detection was performed to screen modules of the PPI network in Cytoscape. The criteria were set as follows: degree cut-off=2, node score cut-off=0.2, k-core=2, and max depth=100.19 Moreover, the DAVID online tool was used to analyze the function and pathway enrichment for DEGs in the modules.
Prediction of miRNA targets
MiRecords (http://c1.accurascience.com/miRecords/) is an online integrated resource produced by 11 established miRNA target prediction programs including TargetScan, MicroInspector, RNA22, DIANA-microT, NBmiRTar, miRanda, PicTar, miTarget, PITA, RNAhybrid, and MirTarget2.20 The genes predicted by at least four programs were identified as the targets of miRNAs.
Tissue samples
Ten HCC tissues and matched nontumor samples were collected from patients with HCC who underwent complete surgical resection at the Affiliated Hospital of Binzhou Medical University (Binzhou, China). Informed consent was obtained from all patients, and the study protocol was approved by our institutional review board of the Affiliated Hospital of Binzhou Medical University.
RNA isolation and determination of target gene expression using quantitative real-time polymerase chain reaction
Total RNA was purified from hepatic tissue using RNAfast200 Total RNA Extract Kit (Fastgene, Shanghai, China). The cDNA was prepared by RevertAid™ First Strand cDNA Synthesis Kit (Thermo Fisher Scientific, Waltham, MA, USA). Real-time reverse transcription-polymerase chain reaction (RT-PCR) was performed using an RT-PCR kit according to the protocols recommended by the manufacturer. An SYBR green-based RT-PCR assay was performed using the sequence detection system (Bio-Rad Laboratories Inc., Hercules, CA, USA). The fold change for each target gene was calculated using the comparative Ct (2−ΔΔCT) method. Primers used for amplification are presented in Table 1.
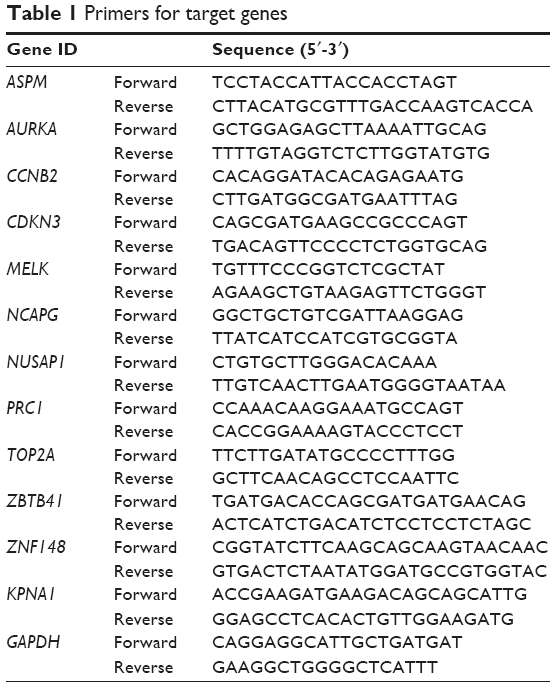 | Table 1 Primers for target genes |
Results
Identification of DEGs
In total, 413, 397, and 488 DEGs were identified from GSE57957, GSE64041, and GSE76427 datasets, respectively, with 106 genes screened out in all three datasets (Figure 1). Moreover, all the 106 genes presented identical expression trends in the three datasets. Among the 106 genes, 89 were upregulated and 17 genes were downregulated in HCC tissues compared to nontumor tissues.
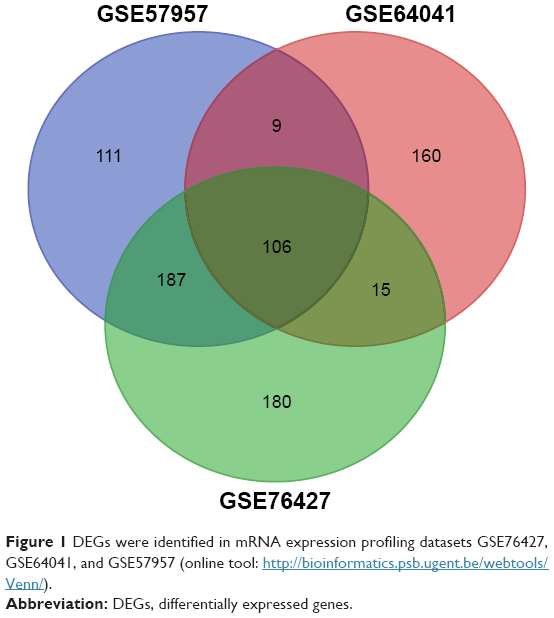 | Figure 1 DEGs were identified in mRNA expression profiling datasets GSE76427, GSE64041, and GSE57957 (online tool: http://bioinformatics.psb.ugent.be/webtools/Venn/). |
GO and KEGG pathway enrichment analysis
To further investigate the function of identified DEGs, DAVID was performed to analyze functional and pathway enrichment. The upregulated genes mainly participated in biological processes associated with the oxidation–reduction process. Moreover, four typical KEGG pathways were overrepresented in upregulated genes, including chemical carcinogenesis, drug metabolism-cytochrome P450, tryptophan metabolism, and retinol metabolism (Table 2). However, no KEGG pathway and GO term were obtained from downregulated genes due to the limited number.
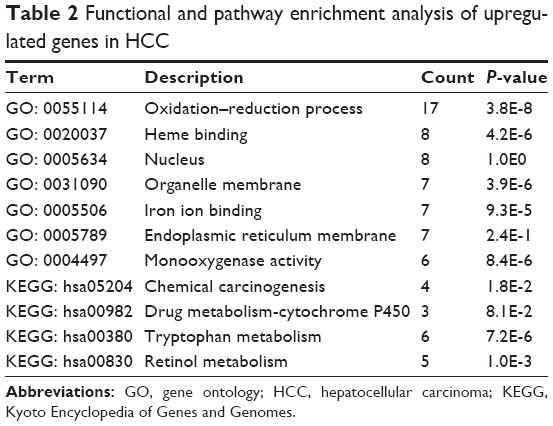 | Table 2 Functional and pathway enrichment analysis of upregulated genes in HCC |
Module selection from the PPI network
Based on the information from the Search Tool for the Retrieval of Interacting Genes database, the PPI network of DEGs consisted of 105 nodes and 66 edges (average node degree of 1.26 and average local clustering coefficient=0.313), including 89 upregulated genes and 16 downregulated genes (except SRXN1 gene), as shown in Figure 2A. A significant module was obtained from the PPI network of DEGs using plug-ins Molecular Complex Detection, including 9 nodes and 36 edges (Figure 2B). The nine hub genes were the abnormal spindle protein homologue (ASPM), aurora kinase S (AURKA), cyclin B2 (CCNB2), cyclin-dependent kinase inhibitor 3 (CDKN3), maternal embryonic leucine zipper kinase (MELK), non-SMC condensing I complex, subunit G (NCAPG), nucleolar and spindle associated protein 1 (NUSAP1), protein regulator of cytokinesis 1 (PRC1), and topoisomerase (DNA) II alpha (TOP2A). Enrichment analysis showed that these hub genes were mainly associated with the mitotic cell cycle process, cell division, and mitotic cell cycle (Table 3).
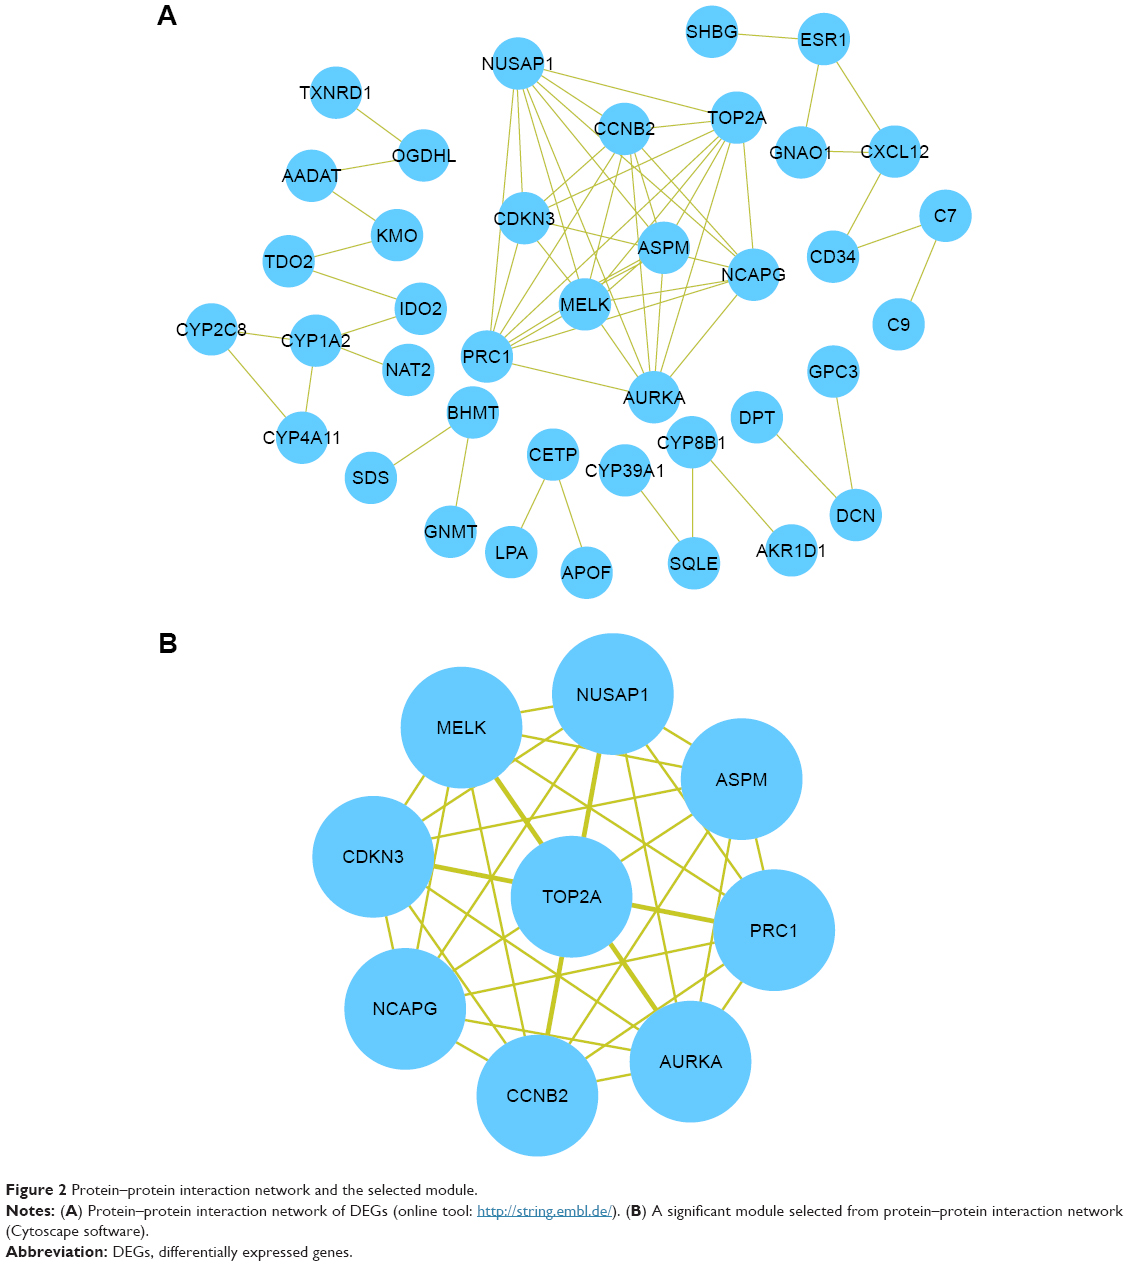 | Figure 2 Protein–protein interaction network and the selected module. |
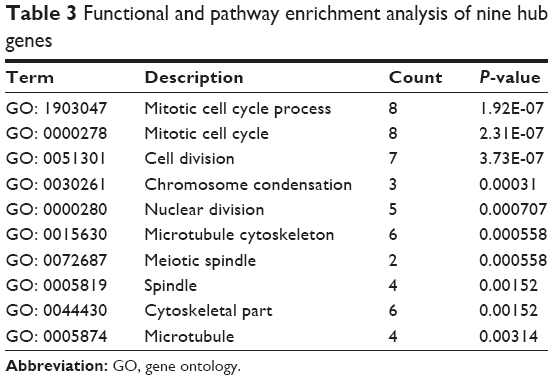 | Table 3 Functional and pathway enrichment analysis of nine hub genes |
Identification of DEMs and target gene prediction
Twenty-one DEMs were screened out from the GSE67882 datasets, including 9 upregulated and 12 downregulated miRNAs. The |logFC| >2 was used as the cut-off criterion. As shown in Table 4, miR-664* and miR-222 were the most significantly upregulated and downregulated miRNAs, respectively. The predicted targets of miRNAs were then obtained from the online tool miRecords database. By comparing the targets of the DEMs, ZBTB41 was found to be a potential target of seven miRNAs, including has-miR-1526, has-miR-142-3p, has-miR-186, hasmiR-222, has-miR-29b, has-miR-494, and has-miR-550. Moreover, ZNF148 and KPNA1 were the potential targets of six miRNAs, respectively. In addition, no target genes were found by hsa-miR-664*, hsa-miR-425*, hsa-let-7f-1*, hsa-miR-1274a, hsa-miR-1260, hsa-miR-1826, hsa-miR-106b, hsa-miR-1246, and hsa-miR-34b*.
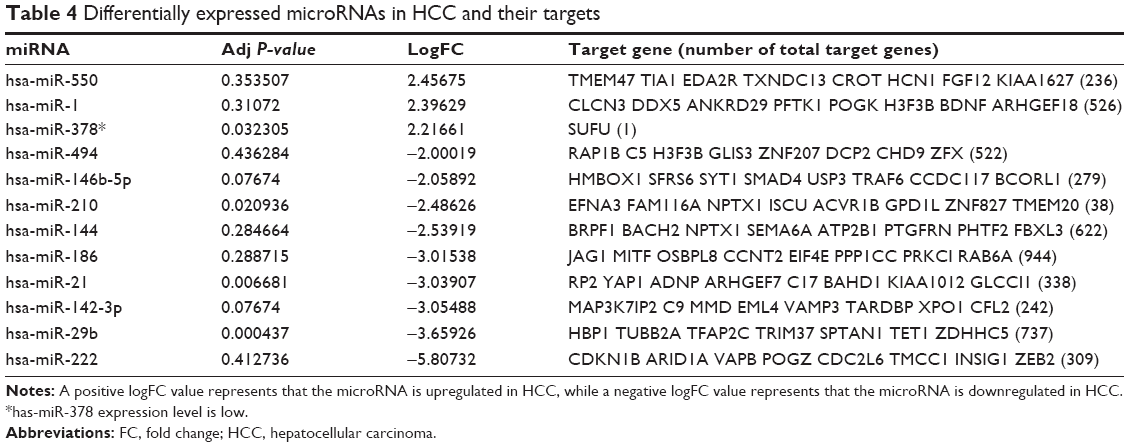 | Table 4 Differentially expressed microRNAs in HCC and their targets |
Validation of target genes by real-time quantitative polymerase chain reaction
As shown in Figure 3, ASPM, ZBTB41, AURKA, TOP2A, and CDKN3 were upregulated about 12-, 9-, 7.5-, 6-, and 5-fold, respectively, in the HCC tissues, compared with the nontumor liver tissues. Besides, NCAPG, PRC1, ZNF148, and MELK were upregulated about 5-, 4.5-, 4-, and 3.8-fold, respectively, in HCC samples. However, CCNB2, NUSAP1, and KPNA1 had no statistically significant changes in the RT-PCR analysis.
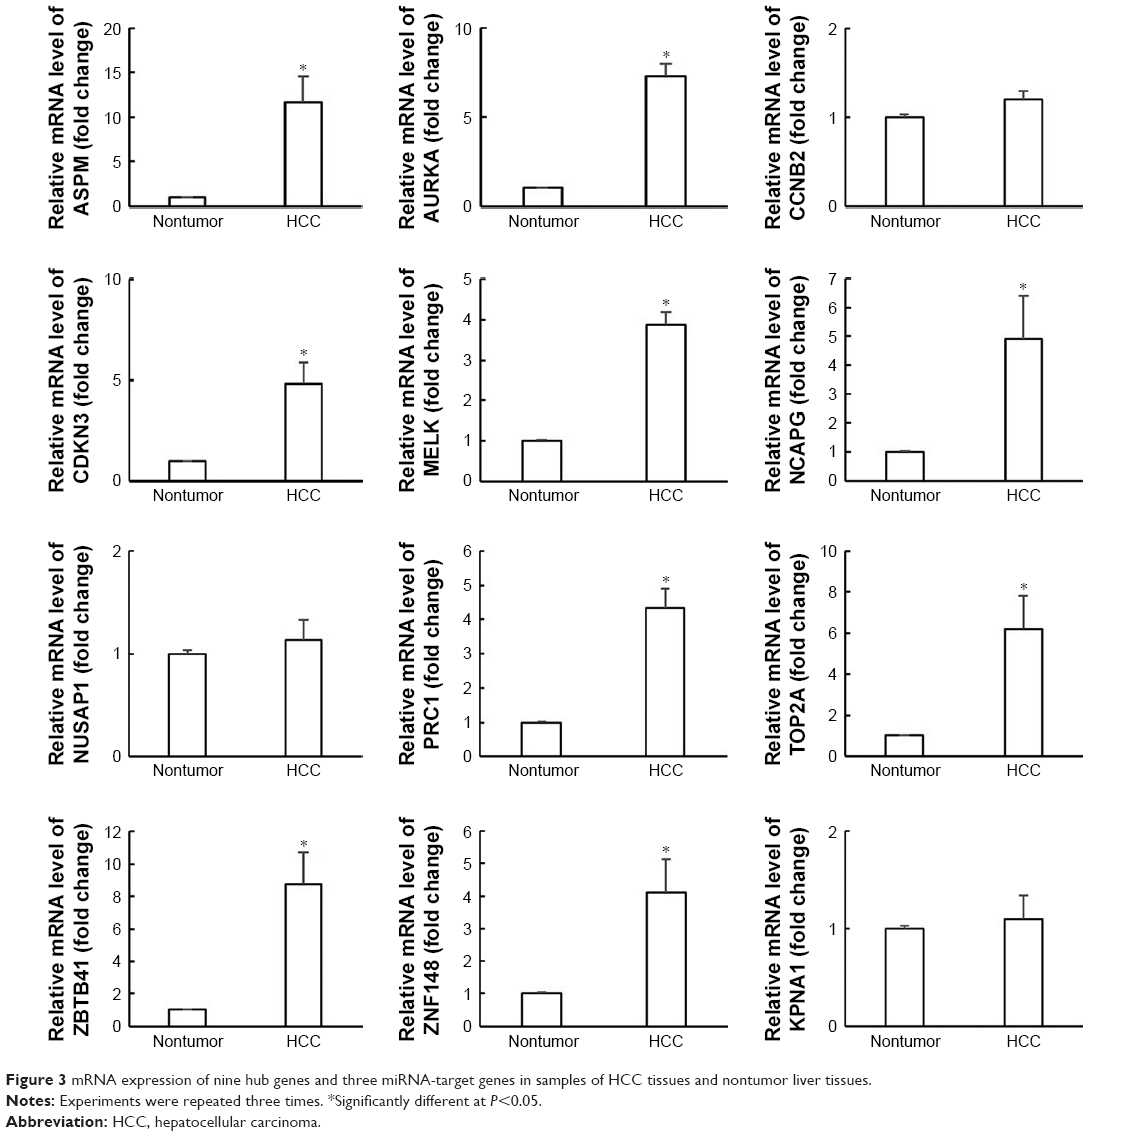 | Figure 3 mRNA expression of nine hub genes and three miRNA-target genes in samples of HCC tissues and nontumor liver tissues. |
Discussion
HCC is a common neoplasia which represents the second leading cause of cancer-related death. Most cases occur in developing countries, with China accounting for over 50% of the world’s burden.1 Understanding the molecular mechanism of HCC is of critical importance for early detection, diagnosis, and treatment. Recently, the rapidly developing and wide use of microarray and high-throughput sequencing technology has revealed thousands of genetic alterations during the progression of diseases, which provide promising targets for early detection, diagnosis, treatment, and prognosis of tumors.
In this study, based on three mRNA datasets, 106 DEGs were identified using bioinformatic analysis, consisting of 89 upregulated genes and 17 downregulated genes in HCC tissues compared to nontumor tissues. Function annotation showed that the upregulated genes were mainly involved in biological processes associated with the oxidation–reduction process. Moreover, the most significantly enriched pathways of the upregulated DEGs were chemical carcinogenesis, drug metabolism-cytochrome P450, tryptophan metabolism, and retinol metabolism. However, no enrichment results were obtained from downregulated genes. By establishing a PPI, nine key genes were identified, which provide new insights for HCC intervention strategy.
Carcinogenesis is a complex process driven by specific genetic/epigenetic alterations and involving multiple signaling cascades. Increased expression of ASPM has been found in many tumors, including pancreatic cancer21 and HCC.22 Moreover, ASPM plays an important role in tumor cell proliferation and invasion, characteristics of the tumor stem cell,23 as well as in patient’s prognosis.22,24 Interestingly, it was reported that ASPM gene expression is strongly associated with cirrhosis caused by hepatitis, indicating that ASPM may be involved in inflammation.25,26
AURKA belongs to the aurora kinase family, which plays a critical role in the regulation of mitotic events such as spindle assembly, function of centrosomes and cytoskeleton, and cytokinesis.27,28 The deregulated expression of AURKA leads to mitotic progression disorders causing tumors such as gastric cancer,29 HCC,30 and pancreatic cancer.31 In HCC, overexpression of AURKA is closely associated with high-grade, high-stage tumors and poor outcome. Microarray studies indicated that AURKA phosphorylates and stabilizes hepatoma upregulated protein,32 a cell cycle regulated gene overexpressed in HCC.33 In addition, it was reported that AURKA can be regulated at the transcriptional level by hypoxia and hypoxia-inducible factor-1, which are important in the tumor microenvironment.34,35 Notably, the GO term enrichment showed that many genes are involved in oxidation–reduction process.
Cyclin B2 (CCNB2), a member of the cyclin family proteins, serves a key role in the progression of G2/M transition by activating CDK1 kinase, and cyclin B2 inhibition induces cell cycle arrest. CCNB2 is overexpressed in many types of tumors including colorectal adenocarcinoma,36 breast cancer,37 and bladder cancer.38 Moreover, CCNB2 overexpression is also associated with tumor aggressiveness and poor clinical outcome. The mechanistic study revealed that overexpressed CCNB2 triggers aurora-A–mediated Plkl hyperactivation, resulting in accelerated centrosome separation and lagging chromosomes. Furthermore, CCNB2 and p53 acting antagonistically can control aurora-A–mediated centrosome splitting and accurate chromosome segregation in normal cells.39
The CDKN3 gene encodes a dual-specificity protein tyrosine phosphatase that dephosphorylates CDK1/CDK2 and other proteins.40 CDKN3 is often overexpressed in several human cancers; meanwhile, this overexpression correlates with reduced survival in several types of cancer.
MELK, a cell cycle–dependent protein kinase that belongs to the KIN1/PAR-1/MARK family,41 participates in diverse biological processes, including cell cycle, RNA processing, and embryonic development. MELK is also involved in the occurrence, progression, and prognosis of multiple tumors. It has been reported that MELK is overexpressed in HCC tissues and plays an important role in the pathogenesis and recurrence of HCC.42
NUSAP1 is an essential microtubule and chromatin-binding protein that cross-links microtubules during mitosis, modulates the dynamics of kinetochore microtubules, and governs chromosome oscillation.43 Moreover, NUSAP1 has been shown to be overexpressed in multiple cancer types and acts as a therapeutic target for HCC and other cancers.44
PRC1 is a microtubule-associated protein involved in cytokinesis and microtubule organization.45 In HCC, the PRC1 expression level is higher compared with paired adjacent nontumor samples, in recurrent HCC compared with primary HCC tissues.46
The TOP2A gene is located on chromosome 17 (17q21-q22), encoding a 170 kDa nuclear enzyme that controls DNA topological structure, chromosome segregation, and cell cycle progression.47 TOP2A expression has been reported to be a significant prognostic marker for tumor advancement and recurrence and a predictor of poor survival in many cancers. In HCC, TOP2A expression at the mRNA and protein level increased compared with that in nontumor samples.48 Moreover, a further study showed that TOP2A overexpression did not arise from TOP2A gene amplification and is significantly associated with HBsAg in the serum, as well as with Ki-67 expression.49
Several studies have shown that dysregulation of miRNAs is responsible for the pathogenesis of multiple cancer types, including HCC. In this study, 21 DEMs were identified in HCC, consisting of 9 upregulated and 12 downregulated miRNAs; miR-664* was the most significantly upregulated miRNA, while miR-222 was the most significantly downregulated miRNA. MiR-222 belongs to the miR-221/222 family located on the X chromosome and shares a high degree of homology.50 Many researchers have reported the role of miR-222 in tumor development as an oncomiR.51 In HCC, it is reported that overexpressed miR-222 enhances cellular invasiveness and motility of HCC cells by activating the AKT pathway.52 Furthermore, increased expression of miR-222 correlates with the advanced stage of HCC, degree of tumor differentiation, and shorter disease-free survival of patients.52
Conclusion
In summary, this comprehensive bioinformatic analysis has identified numerous DEGs and DEMs that may be involved in the progression of HCC. The study provides a set of useful molecular targets for future investigation of the mechanisms and selection of biomarkers for HCC. In addition, further molecular biological experiments will be performed by our team to confirm the function of the identified genes in HCC.
Acknowledgments
We would like to thank Dr Qinghai Guan, Dr Fan Zhang, Dr Yu Cheng, Dr Kun Ou, Dr Xutao Lin, Dr Wentao Zhu, and Dr Baolei Zhao for helpful advice. This work was supported by the Natural Science Foundation of China (No 31640052) and the Natural Science Fund Project of Shandong Province (No ZR2014HP028).
Disclosure
The authors report no conflicts of interest in this work.
References
Jemal A, Bray F, Center MM, Ferlay J, Ward E, Forman D. Global cancer statistics. CA Cancer J Clin. 2011;61(2):69–90. | ||
El-Serag HB. Hepatocellular carcinoma. N Engl J Med. 2011;365(12):1118–1127. | ||
Sanyal AJ, Yoon SK, Lencioni R. The etiology of hepatocellular carcinoma and consequences for treatment. Oncologist. 2010;15(Suppl 4):14–22. | ||
Singal AG, El-Serag HB. Hepatocellular carcinoma from epidemiology to prevention: translating knowledge into practice. Clin Gastroenterol Hepatol. 2015;13(12):2140–2151. | ||
Liu F, Li H, Chang H, Wang J, Lu J. Identification of hepatocellular carcinoma-associated hub genes and pathways by integrated microarray analysis. Tumori. 2015;101(2):206–214. | ||
Yin F, Shu L, Liu X, et al. Microarray-based identification of genes associated with cancer progression and prognosis in hepatocellular carcinoma. J Exp Clin Cancer Res. 2016;35(1):127. | ||
Kulasingam V, Diamandis EP. Strategies for discovering novel cancer biomarkers through utilization of emerging technologies. Nat Clin Pract Oncol. 2008;5(10):588–599. | ||
Shangguan H, Tan SY, Zhang JR. Bioinformatics analysis of gene expression profiles in hepatocellular carcinoma. Eur Rev Med Pharmacol Sci. 2015;19(11):2054–2061. | ||
Critelli RM, De Maria N, Villa E. Biology of hepatocellular carcinoma. Dig Dis. 2015;33(5):635–641. | ||
van Malenstein H, van Pelt J, Verslype C. Molecular classification of hepatocellular carcinoma anno 2011. Eur J Cancer. 2011;47(12):1789–1797. | ||
Hoshida Y, Toffanin S, Lachenmayer A, Villanueva A, Minguez B, Llovet JM. Molecular classification and novel targets in hepatocellular carcinoma: recent advancements. Semin Liver Dis. 2010;30(1):35–51. | ||
Huang XB, Li J, Zheng L, et al. Bioinformatics analysis reveals potential candidate drugs for HCC. Pathol Oncol Res. 2013;19(2):251–258. | ||
Del Vecchio F, Gallo F, Di Marco A, et al. Bioinformatics approach to predict target genes for dysregulated microRNAs in hepatocellular carcinoma: study on a chemically-induced HCC mouse model. BMC Bioinformatics. 2015;16:408. | ||
Shi KQ, Lin Z, Chen XJ, et al. Hepatocellular carcinoma associated microRNA expression signature: integrated bioinformatics analysis, experimental validation and clinical significance. Oncotarget. 2015;6(28):25093–25108. | ||
Makowska Z, Boldanova T, Adametz D, et al. Gene expression analysis of biopsy samples reveals critical limitations of transcriptome-based molecular classifications of hepatocellular carcinoma. J Pathol Clin Res. 2016;2(2):80–92. | ||
Ghosh A, Ghosh A, Datta S, et al. Hepatic miR-126 is a potential plasma biomarker for detection of hepatitis B virus infected hepatocellular carcinoma. Int J Cancer. 2016;138(11):2732–2744. | ||
Barrett T, Wilhite SE, Ledoux P, et al. NCBI GEO: archive for functional genomics data sets-update. Nucleic Acids Res. 2013;41(Database issue):D991–D995. | ||
Huang da W, Sherman BT, Lempicki RA. Systematic and integrative analysis of large gene lists using DAVID bioinformatics resources. Nat Protoc. 2009;4(1):44–57. | ||
Bader GD, Hogue CW. An automated method for finding molecular complexes in large protein interaction networks. BMC Bioinformatics. 2003;4:2. | ||
Xiao F, Zuo Z, Cai G, Kang S, Gao X, Li T. miRecords: an integrated resource for microRNA-target interactions. Nucleic Acids Res. 2009;37(Database issue):D105–D110. | ||
Wang WY, Hsu CC, Wang TY, et al. A gene expression signature of epithelial tubulogenesis and a role for ASPM in pancreatic tumor progression. Gastroenterology. 2013;145(5):1110–1120. | ||
Lin SY, Pan HW, Liu SH, et al. ASPM is a novel marker for vascular invasion, early recurrence, and poor prognosis of hepatocellular carcinoma. Clin Cancer Res. 2008;14(15):4814–4820. | ||
Vange P, Bruland T, Beisvag V, et al. Genome-wide analysis of the oxyntic proliferative isthmus zone reveals ASPM as a possible gastric stem/progenitor cell marker over-expressed in cancer. J Pathol. 2015;237(4):447–459. | ||
Bruning-Richardson A, Bond J, Alsiary R, et al. ASPM and microcephalin expression in epithelial ovarian cancer correlates with tumour grade and survival. Br J Cancer. 2011;104(10):1602–1610. | ||
Wang F, Chang Y, Li J, et al. Strong correlation between ASPM gene expression and HCV cirrhosis progression identified by co-expression analysis. Dige Liver Dis. 2017;49(1):70–76. | ||
He B, Yin J, Gong S, et al. Bioinformatics analysis of key genes and pathways for hepatocellular carcinoma transformed from cirrhosis. Medicine (Baltimore). 2017;96(25):e6938. | ||
Kollareddy M, Dzubak P, Zheleva D, Hajduch M. Aurora kinases: structure, functions and their association with cancer. Biomed Pap Med Fac Univ Palacky Olomouc Czech Repub. 2008;152(1):27–33. | ||
Carmena M, Earnshaw WC. The cellular geography of aurora kinases. Nat Rev Mol Cell Biol. 2003;4(11):842–854. | ||
Kamada K, Yamada Y, Hirao T, et al. Amplification/overexpression of Aurora-A in human gastric carcinoma: potential role in differentiated type gastric carcinogenesis. Oncol Rep. 2004;12(3):593–599. | ||
Jeng YM, Peng SY, Lin CY, Hsu HC. Overexpression and amplification of Aurora-A in hepatocellular carcinoma. Clin Cancer Res. 2004;10(6):2065–2071. | ||
Rojanala S, Han H, Munoz RM, et al. The mitotic serine threonine kinase, Aurora-2, is a potential target for drug development in human pancreatic cancer. Mol Cancer Ther. 2004;3(4):451–457. | ||
Yu CT, Hsu JM, Lee YC, Tsou AP, Chou CK, Huang CY. Phosphorylation and stabilization of HURP by Aurora-A: implication of HURP as a transforming target of Aurora-A. Mol Cell Biol. 2005;25(14):5789–5800. | ||
Tsou AP, Yang CW, Huang CY, et al. Identification of a novel cell cycle regulated gene, HURP, overexpressed in human hepatocellular carcinoma. Oncogene. 2003;22(2):298–307. | ||
Klein A, Flugel D, Kietzmann T. Transcriptional regulation of serine/threonine kinase-15 (STK15) expression by hypoxia and HIF-1. Mol Biol Cell. 2008;19(9):3667–3675. | ||
Gao P, Wang R, Shen JJ, et al. Hypoxia-inducible enhancer/alpha-fetoprotein promoter-driven RNA interference targeting STK15 suppresses proliferation and induces apoptosis in human hepatocellular carcinoma cells. Cancer Sci. 2008;99(11):2209–2217. | ||
Park SH, Yu GR, Kim WH, Moon WS, Kim JH, Kim DG. NF-Y-dependent cyclin B2 expression in colorectal adenocarcinoma. Clin Cancer Res. 2007;13(3):858–867. | ||
Shubbar E, Kovacs A, Hajizadeh S, et al. Elevated cyclin B2 expression in invasive breast carcinoma is associated with unfavorable clinical outcome. BMC Cancer. 2013;13:1. | ||
Lei CY, Wang W, Zhu YT, Fang WY, Tan WL. The decrease of cyclin B2 expression inhibits invasion and metastasis of bladder cancer. Urol Oncol. 2016;34(5):237.e1–e10. | ||
Nam HJ, van Deursen JM. Cyclin B2 and p53 control proper timing of centrosome separation. Nat Cell Biol. 2014;16(6):538–549. | ||
Alonso A, Sasin J, Bottini N, et al. Protein tyrosine phosphatases in the human genome. Cell. 2004;117(6):699–711. | ||
Blot J, Chartrain I, Roghi C, Philippe M, Tassan JP. Cell cycle regulation of pEg3, a new Xenopus protein kinase of the KIN1/PAR-1/MARK family. Dev Biol. 2002;241(2):327–338. | ||
Xia H, Kong SN, Chen J, et al. MELK is an oncogenic kinase essential for early hepatocellular carcinoma recurrence. Cancer Lett. 2016;383(1):85–93. | ||
Li C, Xue C, Yang Q, Low BC, Liou YC. NuSAP governs chromosome oscillation by facilitating the Kid-generated polar ejection force. Nat Commun. 2016;7:10597. | ||
Iyer J, Moghe S, Furukawa M, Tsai MY. What’s Nu(SAP) in mitosis and cancer? Cell Signal. 2011;23(6):991–998. | ||
Subramanian R, Wilson-Kubalek EM, Arthur CP, et al. Insights into antiparallel microtubule crosslinking by PRC1, a conserved nonmotor microtubule binding protein. Cell. 2010;142(3):433–443. | ||
Wang SM, Ooi LL, Hui KM. Upregulation of Rac GTPase-activating protein 1 is significantly associated with the early recurrence of human hepatocellular carcinoma. Clin Cancer Res. 2011;17(18):6040–6051. | ||
Isaacs RJ, Davies SL, Sandri MI, Redwood C, Wells NJ, Hickson ID. Physiological regulation of eukaryotic topoisomerase II. Biochim Biophys Acta. 1998;1400(1–3):121–137. | ||
Wong N, Yeo W, Wong WL, et al. TOP2A overexpression in hepatocellular carcinoma correlates with early age onset, shorter patients survival and chemoresistance. Int J Cancer. 2009;124(3):644–652. | ||
Panvichian R, Tantiwetrueangdet A, Angkathunyakul N, Leelaudomlipi S. TOP2A amplification and overexpression in hepatocellular carcinoma tissues. Biomed Res Int. 2015;2015:381602. | ||
Chistiakov DA, Sobenin IA, Orekhov AN, Bobryshev YV. Human miR-221/222 in physiological and atherosclerotic vascular remodeling. Biomed Res Int. 2015;2015:354517. | ||
Garofalo M, Quintavalle C, Romano G, Croce CM, Condorelli G. miR221/222 in cancer: their role in tumor progression and response to therapy. Curr Mol Med. 2012;12(1):27–33. | ||
Wong QW, Ching AK, Chan AW, et al. MiR-222 overexpression confers cell migratory advantages in hepatocellular carcinoma through enhancing AKT signaling. Clin Cancer Res. 2010;16(3):867–875. |
 © 2018 The Author(s). This work is published and licensed by Dove Medical Press Limited. The
full terms of this license are available at https://www.dovepress.com/terms
and incorporate the Creative Commons Attribution
- Non Commercial (unported, 3.0) License.
By accessing the work you hereby accept the Terms. Non-commercial uses of the work are permitted
without any further permission from Dove Medical Press Limited, provided the work is properly
attributed. For permission for commercial use of this work, please see paragraphs 4.2 and 5 of our Terms.
© 2018 The Author(s). This work is published and licensed by Dove Medical Press Limited. The
full terms of this license are available at https://www.dovepress.com/terms
and incorporate the Creative Commons Attribution
- Non Commercial (unported, 3.0) License.
By accessing the work you hereby accept the Terms. Non-commercial uses of the work are permitted
without any further permission from Dove Medical Press Limited, provided the work is properly
attributed. For permission for commercial use of this work, please see paragraphs 4.2 and 5 of our Terms.