Back to Journals » International Journal of Chronic Obstructive Pulmonary Disease » Volume 16
Identification of Metabolism-Associated Molecular Subtypes of Chronic Obstructive Pulmonary Disease
Authors Hu Y ![]() , Cheng X, Qiu Z, Chen X
, Cheng X, Qiu Z, Chen X
Received 22 April 2021
Accepted for publication 2 August 2021
Published 14 August 2021 Volume 2021:16 Pages 2351—2362
DOI https://doi.org/10.2147/COPD.S316304
Checked for plagiarism Yes
Review by Single anonymous peer review
Peer reviewer comments 3
Editor who approved publication: Prof. Dr. Richard Russell
Yuanlong Hu,1,* Xiaomeng Cheng,1,* Zhanjun Qiu,2 Xianhai Chen2
1Shandong University of Traditional Chinese Medicine, Jinan, Shandong, People’s Republic of China; 2The Affiliated Hospital of Shandong University of Traditional Chinese Medicine, Jinan, Shandong, People’s Republic of China
*These authors contributed equally to this work
Correspondence: Zhanjun Qiu; Xianhai Chen Email [email protected]; [email protected]
Purpose: This study aimed to identify the COPD molecular subtypes reflecting pulmonary function damage on the basis of metabolism-related gene expression, which provided the opportunity to study the metabolic heterogeneity and the association of metabolic pathways with pulmonary function damage.
Methods: Univariate linear regression and the Boruta algorithm were used to select metabolism-related genes associated with forced expiratory volume in the first second (FEV1) and FEV1/forced vital capacity (FVC) in the Evaluation of COPD to Longitudinally Identify Predictive Surrogate Endpoints (ECLIPSE) cohort. COPD subtypes were further identified by consensus clustering with best-fit. Then, we analyzed the differences in the clinical characteristics, metabolic pathways, immune cell characteristics, and transcription features among the subtypes.
Results: This study identified two subtypes (C1 and C2). C1 exhibited higher levels of lower pulmonary function and innate immunity than C2. Ten metabolic pathways were confirmed as key metabolic pathways. The pathways related to N-glycan, hexosamine, purine, alanine, aspartate and glutamate tended to be positively associated with the abundance of adaptive immune cells and negatively associated with the abundance of innate immune cells. In addition, other pathways had opposite trends. All results were verified in Genetic Epidemiology of COPD (COPDGene) datasets.
Conclusion: The two subtypes reflect the pulmonary function damage and help to further understand the metabolic mechanism of pulmonary function in COPD. Further studies are needed to prove the prognostic and therapeutic value of the subtypes.
Keywords: chronic obstructive pulmonary disease, molecular subtype, metabolic pathway, pulmonary function
Introduction
Chronic obstructive pulmonary disease (COPD) is characterized by persistent airflow limitation, and is the third leading cause of death worldwide in 2017.1 It is widely accepted that COPD is an inflammatory lung disease that is associated with not only airway and lung tissue inflammation but also systemic inflammation.2 Extensive clinical studies have shown that systemic inflammation in COPD patients is related to an increased risk of comorbidities,3 reduced pulmonary function,4 and increased mortality and exacerbations.5
Smoking remains the major risk factor leading to morbidity and death in COPD patients,6 in which persistent systemic inflammation caused by smoking plays a key role.7,8 Clinical studies showed that patients with COPD caused by smoking had a higher level of systemic inflammation,9,10 which was associated with the severity of disease.11 Systemic inflammation also exists for smokers without airflow limitation on spirometry.12 Though airflow limitation on spirometry is a traditional gold standard for the diagnosis of COPD, the smoke-induced lung damage characteristic of COPD occurs across the full spectrum of smokers, including those who do not meet the spirometric criteria for COPD.13,14 The long “preclinical” period often delays the diagnosis and treatment of COPD.15 Conventionally, the smokers as “pre-COPD” patients were included to identify the COPD subtypes.16
Dynamic changes in cellular metabolism diversify the effector functions of immune cells.17,18 Circulating mononuclear cells of COPD subjects were impaired in utilizing glucose, pyruvate and fatty acids.19,20 Preserved fatty acid metabolism in smokers could augment inflammatory cytokine response.19 Suppressed engagement of glycolysis leading to reduced inducible regulatory T (iTreg) cells could cause progressive loss of pulmonary function.22,23 Glycine, creatine, threonine and histidine concentrations were inversely associated with interleukin-6 levels in COPD patients and non-COPD smokers.23 Following from this, we speculated that additional metabolic pathways could have an important effect on immune response and consequently pulmonary function damage. Therefore, a study on metabolism-relevant molecular heterogeneity is necessary to refine our understanding of smoking-associated pulmonary function damage.
Multiple large prospective studies have generated a large amount of gene expression data, which have provided rich resources and opportunities to understand the molecular heterogeneity of COPD, such as the Evaluation of COPD to Longitudinally Identify Predictive Surrogate Endpoints (ECLIPSE) study5 and the Genetic Epidemiology of COPD (COPDGene) study.24 Using machine learning methods to identify molecular subtypes may ultimately allow for accurate diagnosis and targeted therapy in COPD.25 The aim of this study was to identify the COPD subtypes on the basis of metabolism-related gene expression by a consensus clustering method, which can reflect the pulmonary function damage. The COPD subtypes provided the opportunity to study the metabolic heterogeneity and the association of metabolic pathways with pulmonary function. Two distinct subtypes were identified, named C1 and C2. Then, we revealed the metabolic pathways, transcription features, clinical characteristics, and immune cell characteristics among the two subtypes.
Materials and Methods
Data Source and Processing
Raw gene expression and phenotype datasets (GSE76705, GSE42057) were obtained from the Gene Expression Omnibus database (http://www.ncbi.nlm.nih.gov/geo/), including the ECLIPSE5 (N=229, white) and COPDGene24,26 (N=135, non-Hispanic white) cohorts, which were downloaded using the GEOquery R package (version 2.56.0). All the subjects were former or current smokers. All CEL files were under the same chip platform (Affymetrix GeneChip Human Genome U133 Plus 2.0 arrays). Gene expression data were corrected for background, RMA normalized, and log2-transformed using the oligo R package (version 1.52.1).
Identification of Metabolism-Associated Gene Signatures
A total of 2752 metabolism-associated genes were obtained from previous studies, involving 114 metabolic pathways.27 Univariate linear regression was performed to screen preliminarily metabolism-related genes associated with forced expiratory volume in the first second (FEV1, % predicted) and FEV1/forced vital capacity (FVC) ratio (%) in the ECLIPSE cohort. The Boruta algorithm28,29 with default parameters was performed to further screen selected genes for associations with FEV1 or FEV1/FVC using the Boruta R package (version 7.0.0), which is a wrapper approach built around a random forest algorithm. The genes were sorted by importance and classified into three categories (“confirmed”, “tentative” and “rejected”) according to the z-scores computed by the Boruta algorithm. The genes classified as “confirmed” were used for further clustering.
Consensus Clustering
Based on the selected genes, consensus clustering was carried out by the cola R package (version 1.6.0) on 229 samples of the ECLIPSE cohort.30,31 We fitted a consensus clustering model to identify the COPD subtypes. In general, the basic workflow of consensus clustering algorithm was as follows. First, the top n features were selected by a certain method (top-value method). Then, the matrix scaled by selected rows was randomly sampled, and these samples were partitioned by a certain partitioning method. Next, the process of sampling and partitioning was repeated 50 times to obtain a list of partitions. Finally, labels of clusters were inferred from the partition list.
We used various combinations of the top-value method and the partitioning method to fit consensus clustering models with classes ranging from 2 to 6 classes.31 Top-value methods were used to assign scores to matrix rows, including the standard deviation (SD), coefficient of variance (CV), median absolute deviation (MAD) and ability to correlate to other rows (ATC) methods.31 Partitioning methods were used to separate samples into subgroups ranging from 2 to 6 classes, including hierarchical clustering, k-means clustering and partitioning around medoids.
The models were assessed to determine optimal fit using the mean silhouette score, the proportion of ambiguous clustering (PAC) score, concordance, and the Jaccard index. Under each combination of top-value method and the partitioning method, the best number of subgroups was determined on the basis of the following three rules. The first rule required that all consensus clustering models with a Jaccard index larger than 0.95 be removed. The second rule required that the maximal number of subgroups be taken as the best number, for consensus clustering models with 1-PAC scores larger than 0.9. The third rule required that the best number of the subgroup was identified by the majority vote among the highest 1-PAC score, the highest mean silhouette, and the highest concordance, if the second rule was not fulfilled.
To assess the generalizability of the subtypes learned from the ECLIPSE dataset, we transferred these selected gene signatures to the COPDGene dataset for clustering using the same top-value and partitioning methods as the best fit used in the ECLIPSE dataset.
Single Sample Gene Set Enrichment Analysis
Single-sample gene set enrichment analysis (ssGSEA)32 was used to calculate the enrichment score (metabolism score) of each metabolic pathway gene set for each sample in the ECLIPSE dataset. The relationship between metabolic score and FEV1/FVC was evaluated by univariate linear regression, and the differences in metabolic scores among different subtypes were evaluated using the limma R package (version 3.44.1).
Gene Set Enrichment Analysis
Gene set enrichment analysis (GSEA) was performed using the clusterProfiler R package (version 3.16.0)33 and the ReactomePA R package (version 1.32.0)34 for GO-BP (Gene Ontology - Biological Process), KEGG (Kyoto Encyclopedia of Genes and Genomes) pathways and Reactome pathways. P-values were corrected with the Benjamini-Hochberg (BH) method. A BH-adjusted P < 0.05 was considered to be significant.
Differential Expression Analysis
Differentially expressed genes (DEGs) were assessed using the limma R package (version 3.44.1) on RMA normalized expression values. The Benjamini-Hochberg (BH) method was applied to correct the p-values. All genes were divided into two gene lists, upregulated genes (log2-fold change>0, BH-adjusted p < 0.05) and downregulated genes (log2-fold change<0, BH-adjusted p < 0.05), and were sorted in reverse order according to the absolute value of log2-fold change (logFC). The gene lists in the ECLIPSE and COPDGene datasets were combined into a single ranking prioritized gene list using the robust rank aggregation (RRA) method via the RobustRankAggreg R package (version 1.1).35 Genes with an RRA score <0.05 were considered robust and important.
Abundance Analysis of Immune Cells
The abundance levels of 24 types of immune cells (18 T cell subsets) in blood were estimated via Immune Cell Abundance Identifier (ImmuCellAI), which is a tool to estimate the abundance of immune cells from the whole gene expression profile of blood based on ssGSEA and compensation matrix.36 The abundance difference was tested using the limma R package (version 3.44.1). The Pearson product moment correlation coefficient was used to determine the correlation between the key metabolic pathways and immune cell abundance by the Hmisc R package (version 4.4–1).
Other Statistical Analyses
All analyses and data plotting were performed using R software (version 4.0.2) and RStudio for Windows. T-tests were used to test for differences between two groups using the ggpubr R package (version 0.4.0). A p-value <0.05 was considered statistically significant.
Results
Nineteen Metabolism-Related Genes Associated with Pulmonary Function Were Identified to Be the Basis for Clustering
We applied a method with two steps inspired by the ideas of a hybrid approach to select genes associated with FEV1 or FEV1/FVC. First, 442 FEV1-related genes (168 genes met “p-value <0.05” adjusted by BH method) and 1638 FEV1/FVC-related genes (292 genes met “p-value <0.05” adjusted by BH method) were preliminarily identified from 2752 metabolism-related genes by univariate linear regression. Then, the Boruta algorithm was used to identify 13 genes related to FEV1 and 13 genes related to FEV1/FVC. Finally, the 19 union set genes were selected as the metabolism-associated gene signatures used to perform consensus clustering analysis (Supplementary Table 1). The detailed performance profiles of 19 genes in different selection processes are shown in Figure 1.
 |
Figure 1 Selected metabolism-associated gene signatures. (A) Forest plot of the association between the selected gene and forced expiratory volume in the first second (FEV1). (B) Attribute importance of selected genes related to FEV1 based on Boruta feature selection. (C) Forest plot of the association between the selected gene and FEV1/forced vital capacity (FVC) ratio. (D) Boxplot showing the attribute importance of selected genes related to the FEV1/FVC ratio based on Boruta feature selection. |
Consensus Clustering Identified Two Metabolism Subtypes in COPD
Because the 1-PAC scores generated were all less than 0.9, we actually came to the conclusion by following the third rule, namely, that the best parameter combination is considered to be k-means and ATC (Supplementary Table 2, Supplementary Figure 1). Consensus clustering based on 19 selected metabolism-related genes identified two optimal subtypes that we refer to herein as C1 and C2. There were 124 samples in the C1 and 105 in the C2. To reproduce and verify ECLIPSE clusters in COPDGene, two clusters based on 19 identical genes were identified using consensus clustering with the parameter combination of k-means and ATC in the same manner as the ECLIPSE clustering. There were 64 samples in the C1 and 71 in the C2.
To assess the assignments of subtypes, we performed PCA showing that the two subtypes were distributed in different corners of the two-dimensional coordinate systems (Figure 2A and B, Supplementary Figure 2A and B). In addition, a consensus matrix with a clear border (Figure 2C, Supplementary Figure 2C) displayed the stability of the two subtypes.
 |
Figure 2 Identification of two metabolism related-subtypes. (A) Principal component analysis displaying the distribution of two subtypes in the ECLIPSE dataset. (B) Multiple density plot showing the distribution of 19 selected genes on two subtypes in the ECLIPSE dataset. (C) Consensus matrix visualizing the stability of the two subtypes in the ECLIPSE dataset. The labels “p1” and “p2” refer to the probability of the sample staying in C1 and C2, respectively. The label “Prob” refers to the probability of the sample staying in the corresponding subgroup. The label “Packs” refers to the pack-years of cigarette smoking. (D) Differences in clinical characteristics between the two subtypes in the ECLIPSE and COPDGene datasets. |
We tested the differences in FEV1 and FEV1/FVC between the two subtypes to validate whether the two subtypes were significantly associated with pulmonary function. The results in the training set (ECLIPSE dataset) demonstrated that the proportion of samples in FEV1 (%predicted), GOLD grade and the FEV1/FVC ratio were significantly different within the 2 subtypes (Figure 2D, Supplementary Table 3). Consistently, the difference in FEV1, GOLD grade and FEV1/FVC within 2 subtypes of the validation set also had significance (Figure 2D, Supplementary Table 4). From the above analysis, C1 showed a more severe degree of airflow limitation than C2. After correcting for age and sex, the subtypes (C1 vs C2) were also significantly associated with FEV1 (ECLIPSE, β = 18.20, 95% CI = 9.55 to 26.86, p = 4.84e-05; COPDGene, β = 11.40, 95% CI = 1.96 to 20.84, p = 0.0183) or FEV1/FVC (ECLIPSE, β = 11.49, 95% CI = 6.30 to 16.67, p = 1.95e-05; COPDGene, β = 9.87, 95% CI = 4.25 to 15.48, p = 6.88e-04) in the ECLIPSE and COPDGene datasets. C1 accounted for a more portion of the COPD patients than C2 (Supplementary Table 5). The results were the same when correcting for age, sex, BMI and current smoking status (Supplementary Table 6). In addition, we found that six-minute-walk distance, emphysema and gas trapping were significantly different within the 2 subtypes in the COPDGene datasets (Supplementary Table 4).
To assess the association between subtypes and exacerbation risk, we collected the three gene signatures associated with exacerbation risk from previous studies (Supplementary Table 7).37,38 In a comparison, the ssGSEA scores of the three gene signatures suggested that C1 tended to be associated with a higher exacerbation risk (Supplementary Figures 3 and 4). Similarly, we could infer indirectly that C1 tended to be associated with a faster pulmonary function decline, according to the higher expression of CCR1 and TLR5 (Supplementary Figure 5).39
Correlation of the COPD Subtypes with Metabolic Pathways
The matrices of gene expression profiles (20,174 genes) in the ECLIPSE and COPDGene datasets were transformed separately into the matrices of ssGSEA scores based on the gene sets collected from previous literature,27 of which the rows consisted of 114 metabolism pathways and the columns consisted of the 229 and 135 patient samples in the ECLIPSE and COPDGene datasets.
We have provided a flow diagram depicting the processes of identifying the key pathways for the two subtypes and pulmonary function (Supplementary Figure 6). Univariate linear regression analysis was performed separately for the ECLIPSE and COPDGene datasets to identify the metabolic pathways associated with FEV1/FVC, which identified 61 metabolic pathways in the ECLIPSE dataset and 35 in the COPDGene dataset (Supplementary Figure 8). There were significant differences in metabolic pathways between these two subtypes, including 85 pathways in the ECLIPSE dataset and 68 pathways in the COPDGene dataset. The intersection of the above four results revealed that the 17 pathways overlapped. As shown in Figure 3A and B, the direction of the correlation and ssGSEA score difference displayed excellent consistency between the two datasets, except for “arginine biosynthesis”.
 |
Figure 3 Correlations of the COPD subtypes with the FEV1/FVC-related metabolism pathway. (A) Forest plot showing the association between 17 metabolic pathway single-sample gene set enrichment analysis (ssGSEA) scores and FEV1/FVC in the entire ECLIPSE and COPDGene datasets. (B) Heatmap displaying the differences in 17 metabolic pathway ssGSEA scores in COPD subtypes (C1 vs C2). (C) Venn diagram showing the overlapping results of univariate linear regression (ssGSEA score to FEV1/FVC) and difference analysis (C1 vs C2) in ECLIPSE and COPDGene datasets. (D) Boxplot showing the attribute importance of 16 metabolism pathway ssGSEA scores (except for “arginine biosynthesis”) related to two COPD subtypes in the ECLIPSE and COPDGene cohorts based on the Boruta method. |
Then, the importance of 16 metabolic pathways (except for “arginine biosynthesis”) was estimated by the Boruta algorithm, which showed that 8 pathways were confirmed as key pathways, namely, “N-glycan biosynthesis”, “thromboxane biosynthesis”, “hexosamine biosynthesis”, “estradiol biosynthesis”, “purine biosynthesis”, “glycosaminoglycan degradation”, “sulfur metabolism” and “alanine, aspartate and glutamate metabolism” (Figure 3D).
An identical data analysis workflow was used to identify the key pathways for the two subtypes and FEV1 values. This result showed that 6 pathways were confirmed as key metabolic pathways, namely, “thromboxane biosynthesis”, “purine biosynthesis”, “sulfur metabolism”, “testosterone biosynthesis”, “alanine, aspartate and glutamate metabolism” and “retinoic acid metabolism” (Supplementary Figures 7 and 9). While there were only 4 key pathways as overlapping metabolic pathways related to FEV1 and FEV1/FVC in the two datasets, all of 10 key pathways were simultaneously associated with FEV1 and FEV1/FVC in the ECLIPSE dataset (Supplementary Figure 10). As seen above, all of 10 key pathways were seen as pathways reflecting the pulmonary function damage to perform the subsequent analyses.
Correlations of the COPD Subtypes with Immune Cell Abundance
Immune cell abundance in peripheral blood was estimated based on all genes in the gene expression profile, which reflected the systemic inflammatory state. Difference in abundance levels of 14 immune cells was significant and stable between the two subtypes in the two datasets (Figure 4A and C). C1 had higher abundance levels of neutrophils, monocytes, macrophages, dendritic cells (DCs), natural killer T (NKT) cells and follicular B helper T (Tfh) cells, and lower abundance levels of central memory T (Tcm), naive CD4+ T cells, T helper 2 (Th2) cells, naive CD8+ T cells, CD8+ T cells, type 1 regulatory T (Tr1) cells, B cells, and γδT cells (Tgd) than C2.
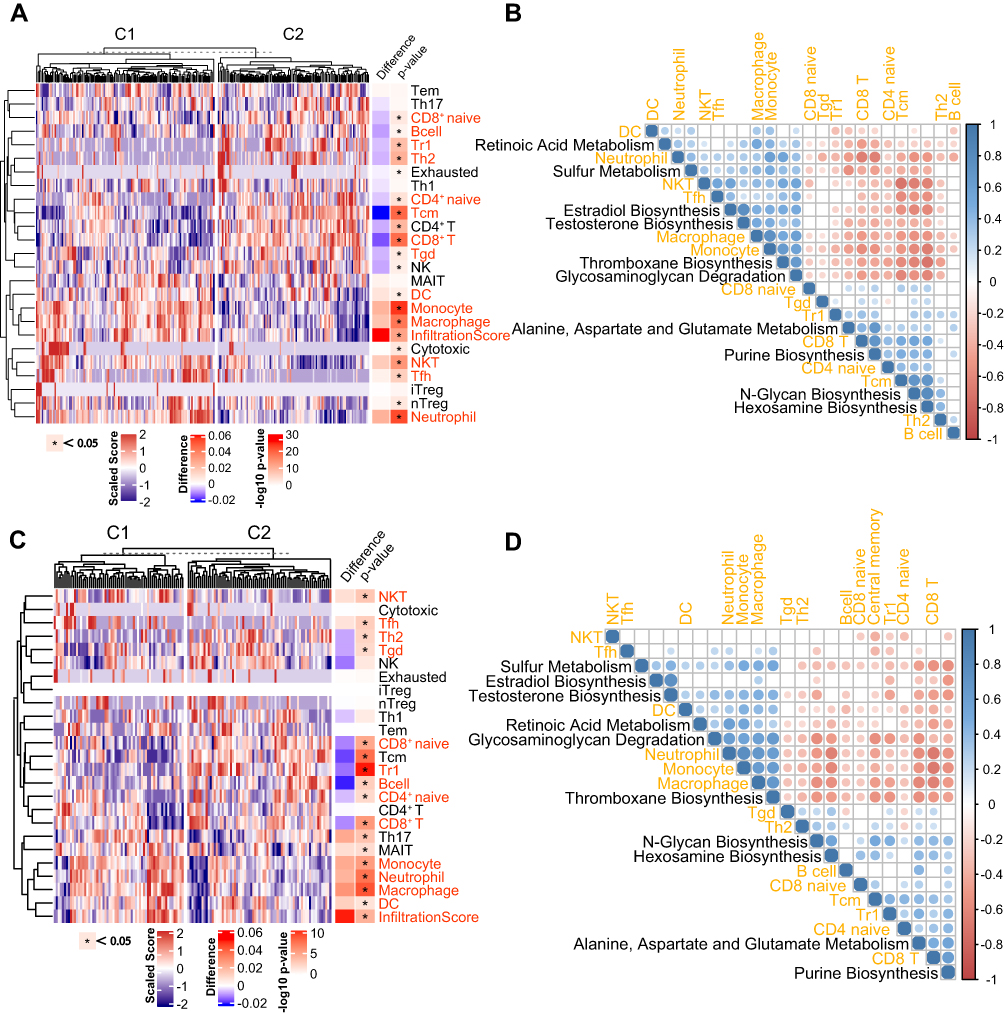 |
Figure 4 Correlations of the COPD subtypes with immune cell abundance. (A) Heatmap displaying the differences in immune cell abundance between C1 and C2 in the ECLIPSE dataset. C1 and C2 are two molecular subtypes named above. (B) Pearson correlation heatmap matrix between immune cells and metabolic pathways in the ECLIPSE dataset ordered by hierarchical clustering. (C) Heatmap displaying the differences in immune cell abundance between C1 and C2 in the COPDGene dataset. C1 and C2 are two molecular subtypes named above. (D) Pearson correlation heatmap matrix between immune cells and metabolic pathways in the COPDGene datasets ordered by hierarchical clustering. |
In addition, the relationship between key pathways and immune cells was also analyzed, and the correlation matrix of the ECLIPSE and COPDGene datasets showed similar clustering trends (Figure 4B and D). Metabolic pathways clustered into two groups based on the correlation with immune cells. The first group tended to be positively associated with the abundance of adaptive immune cells (eg, CD8+ Tn, CD4+ Tn, Tr1) and negatively associated with the abundance of innate immune cells (eg, neutrophils, monocytes, and macrophages), including “N-glycan biosynthesis”, “hexosamine biosynthesis”, “purine biosynthesis” and “alanine, aspartate and glutamate metabolism”. The second group displayed opposite tendencies to group 1, including “thromboxane biosynthesis”, “estradiol biosynthesis”, “glycosaminoglycan degradation” and “sulfur metabolism”.
Correlations of the COPD Subtypes with Transcription Features
To identify the DEGs common to the two datasets, we performed differential expression analysis between C1 and C2 in the two datasets, and the results were integrated into a list of upregulated and downregulated genes by the RRA method. The top 5 downregulated genes sorted by RRA score were ENPP5, CENPK, SLAIN1, THEMIS, and PLEKHG1, and the top 5 upregulated genes sorted by RRA score were LRG1, IL1R2, CA1, ADAMTSL4 and AHSP (Supplementary Table 8). By mapping gene expression data to the pathway, the heatmap displayed DEGs (C1 vs C2) with overlapping of two datasets in the 10 key metabolic pathways (Figure 5C and D).
 |
Figure 5 Correlations of the COPD subtypes with transcription features in the ECLIPSE dataset. (A) Volcano plot showing all differentially expressed genes (DEGs) with an RRA score<0.05 between two subtypes in the ECLIPSE dataset. The top 10 upregulated and downregulated genes ranked by RRA score are labelled in the figure. (B) Volcano plot showing all differentially expressed genes with an RRA score<0.05 between the two subtypes in the COPDGene dataset. (C) Heatmap displaying DEGs from 10 metabolic pathways in the ECLIPSE dataset. (D) Heatmap displaying DEGs from 10 metabolic pathways in the COPDGene dataset. The genes with overlapping of two datasets are highlighted by black border. |
To identify metabolism-related DEGs between healthy smokers and COPD patients in the two datasets, we applied a similar approach, as described in the previous section. The 13 DEGs sorted by RRA score from small to large (Supplementary Figure 11, Supplementary Table 9), including 5 upregulated genes (ADCY4, PFKFB4, TBXAS1, GAA and OPLAH) and 8 downregulated genes (B3GALT2, ST8SIA1, HS3ST3B1, PDE7A, B3GLCT, NT5E, AGL and INPP4B).
Besides, GSEA results of two datasets (C1 vs C2) supported the results of the immune cell abundance analysis (Supplementary Figure 12, Supplementary Tables 10 and 11).
Discussion
Clustering algorithms are most useful and commonly used method in exploratory analyses of COPD subtypes; however, they also face a challenge, which is whether the subtypes are reproducible.40 To address this challenge, two metabolism-related subtypes were identified by consistent clustering, of which robustness and repeatability were confirmed by verification across datasets. Previous studies have screened 328 probes related to FEV1 or FEV1/FVC from the COPDGene dataset and identified 4 subtypes based on systemic inflammation state by non-negative matrix factorization (NMF) and network-based stratification (NBS).16 In this study, we identified two highly robust and repeatable subtypes by consensus clustering based on 19 selected metabolism-related genes, which underwent rigorous validation across datasets.
Systemic inflammatory network pattern is known as “inflammome”, categorized into 6 categories (innate-TNF dominant, innate-IFN dominant, innate-inflammasome dominant, adaptive-T cell centric, adaptive-B cell centric, reverse-phase immunity).41 Taking all the above results together, C1 had a higher level of innate immunity associated with TNF, IFN and inflammasome, and a lower level of adaptive immunity associated with T and B cells. The proportion of neutrophils increases and lymphocytes decreases were regarded as a marker of increased COPD severity and pulmonary function damage.42
What we were greatly interested in was the differences in the exacerbation risk and pulmonary function decline between the two subtypes of patients. Because of the lack of relevant clinical phenotype data, we could only infer indirectly. The differences in the ssGSEA scores from three gene signatures suggested that C1 had a higher exacerbation risk than C2. And, previous studies have found that lower adaptive systemic immunity might be associated with exacerbation susceptibility,43 which is consistent with our result. Furthermore, two lines of evidence suggested that C1 had a faster pulmonary function decline than C2. First, more severe emphysema,44 higher neutrophil proportions,42,45 lower lymphocyte proportions42 were associated with a rapid pulmonary function decline in COPD. Second, the higher gene expression of genes in the pathogen recognition pathways was related to faster pulmonary function decline, such as TLR5 and CCR1.39
What is curious about our results is that other metabolites in immune cells could play a prominent role in COPD, including N-glycan, hexosamine, glycosaminoglycan, sulfur, thromboxane, retinoic acid, estradiol, purine, alanine, aspartate and glutamate. In particular, N-glycan biosynthesis was seen to be the most critical pathway positively associated with FEV1/FVC by Boruta, which showed significant positive correlation with FEV1 in the ECLIPSE dataset. By mapping gene expression data to the N-glycan biosynthesis pathway, FUT8, ST6GAL1 and STT3B was found to be the downregulated gene with overlapping of two datasets, which can directly modify the N-glycan core and drive the N-glycosylation.46 N-glycosylation is important for the function of cell surface receptors. Several studies have reported that decreased FUT8 expression is associated with a decline in airflow limitation and frequent exacerbations in COPD patients and results in copious amounts of MMP-9 secretion.47,48 In addition, there is an argument that the cell surface expression of glycoproteins with a few N-glycans exhibits high association with hexosamine concentration, such as TGFBR2.49
In addition, we observed a contrary tendency to the N-glycan biosynthesis pathway that in which the thromboxane biosynthesis pathway was negatively associated with the FEV1/FVC ratio and FEV1. It is known that the biosynthesis of thromboxane is enhanced in COPD.50 The high expression of TBXAS1 in C1 suggested that the level of thromboxane A2 might be upregulated in peripheral blood of C1 patients, which could result in increased inflammatory response.51 This interpretation was supported by the relationship between the ssGSEA score of the thromboxane biosynthesis pathway and innate immune cell abundance (neutrophils, monocytes and macrophages).
We continued to explore the expression difference in metabolic genes between COPD patients and healthy smokers. Searching the GWAS Catalog (https://www.ebi.ac.uk/gwas/), we found that there were significant associations between FEV1/FVC and two SNPs at the ST8SIA1.52 ST8SIA1 is the enzyme regulating the biosynthesis of Gangliosides GD3 and GT3. Same as ST6GAL1, ST8SIA1 encodes the enzyme with sialyltransferases activity, which was downregulated in COPD patients and positively associated with FEV1 and FEV1/FVC. Interestingly, in both human and mouse autoimmune disease studies, hyposialylation is considered to be responsible for chronic inflammation.53 The hyposialylation may represent a novel mechanism of systemic inflammation and pulmonary function damage.
In this study, four limitations must be considered. Firstly, clinical samples of larger size are urgently needed to verify our subtypes. Secondly, this is a gene expression study with annotation to metabolic pathways and not a metabolomic study. An integrative approach of metabolomics and transcriptomics is important to understand the mechanism differences among the two metabolism-related subtypes in COPD. Thirdly, the lack of clinical data limits our understanding of the clinical characteristics of the subgroups. We can only infer the differences between subtypes indirectly through bioinformatics methods, such as exacerbation frequency and pulmonary function decline. But there is still some clinical information that we cannot infer, such as the inhaled medication regimens. Fourth, the ECLIPSE dataset excluded asthma patients, while the COPDGene dataset included asthma patients. This might be the reason why the results of the two datasets were slightly different.
Conclusion
In summary, our work identified the two subtypes reflecting pulmonary function damage, which furthered the understanding of the metabolic mechanism of pulmonary function damage in COPD. Future work is needed to further performed population genetics analyses, pre-clinical and clinical study to address the question of whether COPD subtypes may provide valuable insights of accurate diagnosis, and whether the key pathways may serve as potentially druggable targets.
Data Sharing Statement
Publicly available datasets were analyzed in this study. This data can be found here: GEO (https://www.ncbi.nlm.nih.gov/geo). ECLIPSE and COPDGene datasets were from GSE76705, which was from the GPL570 platform (https://www.ncbi.nlm.nih.gov/geo/query/acc.cgi?acc=GSE76705). The code of this study is available from GitHub at https://github.com/YuanlongHu/COPDSubtype.
Author Contributions
All authors made a significant contribution to the work reported, whether that is in the conception, study design, execution, acquisition of data, analysis and interpretation, or in all these areas; took part in drafting, revising or critically reviewing the article; gave final approval of the version to be published; have agreed on the journal to which the article has been submitted; and agree to be accountable for all aspects of the work.
Funding
This work is supported by Shandong Provincial Natural Science Foundation, China (ZR2020MH392) and Shandong Medical and Health Technology Development Project (2018WS193).
Disclosure
The authors declare that the research was conducted in the absence of any commercial or financial relationships that could be construed as a potential conflict of interest. Yuanlong Hu and Xiaomeng Cheng are Co-first authors.
References
1. Soriano JB, Kendrick PJ, Paulson KR, et al. Prevalence and attributable health burden of chronic respiratory diseases, 1990–2017: a systematic analysis for the Global Burden of Disease Study 2017. Lancet Respir Med. 2020;8(6):585–596. doi:10.1016/S2213-2600(20)30105-3
2. Barnes PJ. Inflammatory mechanisms in patients with chronic obstructive pulmonary disease. J Allergy Clin Immunol. 2016;138(1):16–27. doi:10.1016/j.jaci.2016.05.011
3. Thomsen M, Dahl M, Lange P, Vestbo J, Nordestgaard BG. Inflammatory biomarkers and comorbidities in chronic obstructive pulmonary disease. Am J Respir Crit Care Med. 2012;186(10):982–988. doi:10.1164/rccm.201206-1113OC
4. Gan WQ, Man SFP, Senthilselvan A, Sin DD. Association between chronic obstructive pulmonary disease and systemic inflammation: a systematic review and a meta-analysis. Thorax. 2004;59(7):574–580. doi:10.1136/thx.2003.019588
5. Vestbo J, Anderson W, Coxson HO, et al. Evaluation of COPD longitudinally to identify predictive surrogate end-points (ECLIPSE). Eur Respir J. 2008;31(4):869–873. doi:10.1183/09031936.00111707
6. Li X, Cao X, Guo M, Xie M, Liu X. Trends and risk factors of mortality and disability adjusted life years for chronic respiratory diseases from 1990 to 2017: systematic analysis for the Global Burden of Disease Study 2017. BMJ. 2020;368:m234. doi:10.1136/bmj.m234
7. Hikichi M, Mizumura K, Maruoka S, Gon Y. Pathogenesis of chronic obstructive pulmonary disease (COPD) induced by cigarette smoke. J Thorac Dis. 2019;1:1. doi:10.21037/jtd.2019.10.43
8. Barnes PJ. Cellular and molecular mechanisms of asthma and COPD. Clin Sci (Lond). 2017;131(13):1541–1558. doi:10.1042/CS20160487
9. Golpe R, Martín-Robles I, Sanjuán-López P, et al. Differences in systemic inflammation between cigarette and biomass smoke-induced COPD. Int J Chronic Obstruct Pulmon Dis. 2017;12:2639–2646. doi:10.2147/COPD.S141068
10. Hlapčić I, Belamarić D, Bosnar M, Kifer D, Vukić Dugac A, Rumora L. Combination of systemic inflammatory biomarkers in assessment of chronic obstructive pulmonary disease: diagnostic performance and identification of networks and clusters. Diagnostics (Basel). 2020;10(12):1029. doi:10.3390/diagnostics10121029
11. Selvarajah S, Todd I, Tighe PJ, et al. Multiple circulating cytokines are coelevated in chronic obstructive pulmonary disease. Mediators Inflamm. 2016;2016:3604842. doi:10.1155/2016/3604842
12. Garudadri S, Woodruff PG, Han MK, et al. Systemic markers of inflammation in smokers with symptoms despite preserved spirometry in SPIROMICS. Chest. 2019;155(5):908–917. doi:10.1016/j.chest.2018.12.022
13. Regan EA, Lynch DA, Curran-Everett D, et al. Clinical and radiologic disease in smokers with normal spirometry. JAMA Intern Med. 2015;175(9):1539–1549. doi:10.1001/jamainternmed.2015.2735
14. Han MK, Agusti A, Celli BR, et al. From GOLD 0 to pre-COPD. Am J Respir Crit Care Med. 2021;203(4):414–423. doi:10.1164/rccm.202008-3328PP
15. Lange P, Ahmed E, Lahmar ZM, Martinez FJ, Bourdin A. Natural history and mechanisms of COPD. Respirology (Carlton, Vic). 2021;26(4):298–321. doi:10.1111/resp.14007
16. Chang Y, Glass K, Liu Y-Y, et al. COPD subtypes identified by network-based clustering of blood gene expression. Genomics. 2016;107(2–3):51–58. doi:10.1016/j.ygeno.2016.01.004
17. Buck MD, Sowell RT, Kaech SM, Pearce EL. Metabolic instruction of immunity. Cell. 2017;169(4):570–586. doi:10.1016/j.cell.2017.04.004
18. Ran N, Pang Z, Gu Y, et al. An updated overview of metabolomic profile changes in chronic obstructive pulmonary disease. Metabolites. 2019;9(6):111. doi:10.3390/metabo9060111
19. Agarwal AR, Kadam S, Brahme A, et al. Systemic Immuno-metabolic alterations in chronic obstructive pulmonary disease (COPD). Respir Res. 2019;20(1):171. doi:10.1186/s12931-019-1139-2
20. Kadam S, Ghosh B, Apte K, Brahme A, Salvi S, Agarwal A. Metabolic changes in peripheral blood mononuclear cells (PBMCs) of subjects with chronic obstructive pulmonary disease (COPD). Eur Respir J. 2017;50(suppl):61. doi:10.1183/1393003.congress-2017.PA3917
21. Bruzzaniti S, Bocchino M, Santopaolo M, et al. An immunometabolic pathomechanism for chronic obstructive pulmonary disease. Proc Natl Acad Sci USA. 2019;116(31):15625–15634. doi:10.1073/pnas.1906303116
22. Silva B, Lira F, Silva R, et al. Down-regulation of immunometabolism in severe COPD. Eur Respir J. 2017;50(suppl):61. doi:10.1183/1393003.congress-2017.PA2254
23. Diao W, Labaki WW, Han MK, et al. Disruption of histidine and energy homeostasis in chronic obstructive pulmonary disease. Int J Chron Obstruct Pulmon Dis. 2019;14:2015–2025. doi:10.2147/COPD.S210598
24. Maselli DJ, Bhatt SP, Anzueto A, et al. Clinical epidemiology of COPD: insights from 10 years of the COPD Gene Study. Chest. 2019;156(2):228–238. doi:10.1016/j.chest.2019.04.135
25. Ragland MF, Benway CJ, Lutz SM, et al. Genetic advances in chronic obstructive pulmonary disease. Insights from COPDGene. Am J Respir Crit Care Med. 2019;200(6):677–690. doi:10.1164/rccm.201808-1455SO
26. Regan EA, Hokanson JE, Murphy JR, et al. Genetic epidemiology of COPD (COPDGene) study design. COPD. 2010;7(1):32–43. doi:10.3109/15412550903499522
27. Possemato R, Marks KM, Shaul YD, et al. Functional genomics reveal that the serine synthesis pathway is essential in breast cancer. Nature. 2011;476(7360):346–350. doi:10.1038/nature10350
28. Kursa MB, Rudnicki WR, Feature selection with the Boruta package. J Stat Softw. 2010;36(i11):1–13. doi:10.18637/jss.v036.i11
29. Kursa MB. Robustness of random forest-based gene selection methods. BMC Bioinform. 2014;15(1):8. doi:10.1186/1471-2105-15-8
30. Monti S, Tamayo P, Mesirov J, Golub T. Consensus clustering: a resampling-based method for class discovery and visualization of gene expression microarray data. Mach Learn. 2003;52(1):91–118. doi:10.1023/A:1023949509487
31. Gu Z, Schlesner M, Hübschmann D. cola: an R/Bioconductor package for consensus partitioning through a general framework. Nucleic Acids Res. 2020;(gkaa1146). doi:10.1093/nar/gkaa1146
32. Subramanian A, Tamayo P, Mootha VK, et al. Gene set enrichment analysis: a knowledge-based approach for interpreting genome-wide expression profiles. PNAS. 2005;102(43):15545–15550. doi:10.1073/pnas.0506580102
33. Yu G, Wang L-G, Han Y, He Q-Y. clusterProfiler: an R package for comparing biological themes among gene clusters. OMICS. 2012;16(5):284–287. doi:10.1089/omi.2011.0118
34. Yu G, He Q-Y. ReactomePA: an R/Bioconductor package for reactome pathway analysis and visualization. Mol Biosyst. 2016;12(2):477–479. doi:10.1039/c5mb00663e
35. Kolde R, Laur S, Adler P, Vilo J. Robust rank aggregation for gene list integration and meta-analysis. Bioinformatics. 2012;28(4):573–580. doi:10.1093/bioinformatics/btr709
36. Miao Y-R, Zhang Q, Lei Q, et al. ImmuCellAI: a unique method for comprehensive T-cell subsets abundance prediction and its application in cancer immunotherapy. Advan Sci. 2020;7(7):1902880. doi:10.1002/advs.201902880
37. Singh D, Fox SM, Tal-Singer R, Bates S, Riley JH, Celli B. Altered gene expression in blood and sputum in COPD frequent exacerbators in the ECLIPSE cohort. PLoS One. 2014;9(9):e107381. doi:10.1371/journal.pone.0107381
38. Morrow JD, Qiu W, Chhabra D, et al. Identifying a gene expression signature of frequent COPD exacerbations in peripheral blood using network methods. BMC Med Genomics. 2015;8(1):1. doi:10.1186/s12920-014-0072-y
39. Ramasubramanian R, Kalhan R, Jacobs DR, et al. Lung function and gene expression of pathogen recognition pathway receptors: the cardia lung study. Sci Rep. 2020;10(1):1–8. doi:10.1038/s41598-020-65923-z
40. Castaldi PJ, Boueiz A, Yun J, et al. Machine learning characterization of COPD subtypes: insights from the COPDGene study. Chest. 2020;157(5):1147–1157. doi:10.1016/j.chest.2019.11.039
41. Wright KT, Giardina C, Vella AT. Therapeutic targeting of the inflammome. Biochem Pharmacol. 2014;92(2):184–191. doi:10.1016/j.bcp.2014.08.027
42. Halper-Stromberg E, Yun JH, Parker MM, et al. Systemic markers of adaptive and innate immunity are associated with chronic obstructive pulmonary disease severity and spirometric disease progression. Am J Respir Cell Mol Biol. 2018;58(4):500–509. doi:10.1165/rcmb.2017-0373OC
43. Geerdink JX, Simons SO, Pike R, Stauss HJ, Heijdra YF, Hurst JR. Differences in systemic adaptive immunity contribute to the ‘frequent exacerbator’ COPD phenotype. Respir Res. 2016;17(1):140. doi:10.1186/s12931-016-0456-y
44. Nishimura M, Makita H, Nagai K, et al. Annual change in pulmonary function and clinical phenotype in chronic obstructive pulmonary disease. Am J Respir Crit Care Med. 2012;185(1):44–52. doi:10.1164/rccm.201106-0992OC
45. Higashimoto Y, Iwata T, Okada M, Satoh H, Fukuda K, Tohda Y. Serum biomarkers as predictors of lung function decline in chronic obstructive pulmonary disease. Respir Med. 2009;103(8):1231–1238. doi:10.1016/j.rmed.2009.01.021
46. Takahashi M, Kizuka Y, Ohtsubo K, Gu J, Taniguchi N. Disease-associated glycans on cell surface proteins. Mol Aspects Med. 2016;51:56–70. doi:10.1016/j.mam.2016.04.008
47. Kamio K, Yoshida T, Gao C, et al. α1,6-Fucosyltransferase (Fut8) is implicated in vulnerability to elastase-induced emphysema in mice and a possible non-invasive predictive marker for disease progression and exacerbations in chronic obstructive pulmonary disease (COPD). Biochem Biophys Res Commun. 2012;424(1):112–117. doi:10.1016/j.bbrc.2012.06.081
48. Kamio K, Ishii T, Gao C, et al. Correlation Between Fut8 activity and airflow limitation in patients with Chronic Obstructive Pulmonary Disease (COPD) accompanied by the emphysematous phenotype. In:
49. Lau KS, Partridge EA, Grigorian A, et al. Complex N-glycan number and degree of branching cooperate to regulate cell proliferation and differentiation. Cell. 2007;129(1):123–134. doi:10.1016/j.cell.2007.01.049
50. Fimognari FL, Scarlata S, Conte ME, Incalzi RA. Mechanisms of atherothrombosis in chronic obstructive pulmonary disease. Int J Chron Obstruct Pulmon Dis. 2008;3(1):89–96. doi:10.2147/copd.s1401
51. Dennis EA, Norris PC. Eicosanoid storm in infection and inflammation. Nat Rev Immunol. 2015;15(8):511–523. doi:10.1038/nri3859
52. Lutz SM, Cho MH, Young K, et al. A genome-wide association study identifies risk loci for spirometric measures among smokers of European and African ancestry. BMC Genet. 2015;16:138. doi:10.1186/s12863-015-0299-4
53. Bordron A, Morel M, Bagacean C, et al. Hyposialylation must be considered to develop future therapies in autoimmune diseases. Int J Mol Sci. 2021;22(7):3402. doi:10.3390/ijms22073402
 © 2021 The Author(s). This work is published and licensed by Dove Medical Press Limited. The
full terms of this license are available at https://www.dovepress.com/terms
and incorporate the Creative Commons Attribution
- Non Commercial (unported, 3.0) License.
By accessing the work you hereby accept the Terms. Non-commercial uses of the work are permitted
without any further permission from Dove Medical Press Limited, provided the work is properly
attributed. For permission for commercial use of this work, please see paragraphs 4.2 and 5 of our Terms.
© 2021 The Author(s). This work is published and licensed by Dove Medical Press Limited. The
full terms of this license are available at https://www.dovepress.com/terms
and incorporate the Creative Commons Attribution
- Non Commercial (unported, 3.0) License.
By accessing the work you hereby accept the Terms. Non-commercial uses of the work are permitted
without any further permission from Dove Medical Press Limited, provided the work is properly
attributed. For permission for commercial use of this work, please see paragraphs 4.2 and 5 of our Terms.