Back to Journals » Diabetes, Metabolic Syndrome and Obesity » Volume 11
Identification of key gene pathways and coexpression networks of islets in human type 2 diabetes
Authors Li L ![]() , Pan Z, Yang S, Shan W, Yang Y
, Pan Z, Yang S, Shan W, Yang Y
Received 2 July 2018
Accepted for publication 26 July 2018
Published 28 September 2018 Volume 2018:11 Pages 553—563
DOI https://doi.org/10.2147/DMSO.S178894
Checked for plagiarism Yes
Review by Single anonymous peer review
Peer reviewer comments 3
Editor who approved publication: Professor Ming-Hui Zou
Lu Li,1,* Zongfu Pan,2,* Si Yang,1 Wenya Shan,1 Yanyan Yang1
1Department of Pharmacy, The First Affiliated Hospital, College of Medicine, Zhejiang University, Hangzhou, Zhejiang, People’s Republic of China; 2Department of Pharmacy, Zhejiang Cancer Hospital, Hangzhou, Zhejiang, People’s Republic of China
*These authors contributed equally to this work
Purpose: The number of people with type 2 diabetes (T2D) is growing rapidly worldwide. Islet β-cell dysfunction and failure are the main causes of T2D pathological processes. The aim of this study was to elucidate the underlying pathways and coexpression networks in T2D islets.
Materials and methods: We analyzed the differentially expressed genes (DEGs) in the data set GSE41762, which contained 57 nondiabetic and 20 diabetic samples, and developed Gene Ontology (GO) and Kyoto Encyclopedia of Genes and Genomes (KEGG) pathway enrichment analyses. Protein–protein interaction (PPI) network, the modules from the PPI network, and the gene annotation enrichment of modules were analyzed as well. Moreover, a weighted correlation network analysis (WGCNA) was applied to screen critical gene modules and coexpression networks and explore the biological significance.
Results: We filtered 957 DEGs in T2D islets. Then GO and KEGG analyses identified that key pathways like inflammatory response, type B pancreatic cell differentiation, and calcium ion-dependent exocytosis were involved in human T2D. Three significant modules were filtered from the PPI network. Ribosome biogenesis, extrinsic apoptotic signaling pathway, and membrane depolarization during action potential were associated with the modules, respectively. Furthermore, coexpression network analysis by WGCNA identified 13 distinct gene modules of T2D islets and revealed four modules, which were strongly correlated with T2D and T2D biomarker hemoglobin A1c (HbA1c). Functional annotation showed that these modules mainly enriched KEGG pathways such as NF-kappa B signaling pathway, tumor necrosis factor signaling pathway, cyclic adenosine monophosphate signaling pathway, and peroxisome proliferators-activated receptor signaling pathway.
Conclusion: The results provide potential gene pathways and underlying molecular mechanisms for the prevention, diagnosis, and treatment of T2D.
Keywords: type 2 diabetes, islet β cell, bioinformatics analysis, differentially expressed genes, WGCNA
Introduction
Diabetes is a metabolic disease characterized by hyperglycemia. The International Diabetes Federation estimated that there are 415 million adults with diabetes aged 20–79 years worldwide in 2015.1 Moreover, the diabetic population increased to 425 million in 2017 and ~12% of global health expenditure was spent on diabetes in this year.2 Due to the high prevalence, mortality, and economic cost of diabetes and its serious complications, exploring the underlying molecular biomarkers and mechanisms for the prevention, diagnosis, and treatment of diabetes is becoming increasingly important.
Type 2 diabetes (T2D) is the most common type of diabetes and accounts for at least 90% of all diabetes.3–5 A growing number of medications are developed to treat the symptoms of T2D, but these drugs do not cure the diabetes. T2D results from insulin resistance and insulin secretion deficiency.6 Accumulating evidence showed that β-cell dysfunction plays a key role in the pathological processes of T2D.7,8 However, because of the inaccessibility of enough human pancreatic islets, the causes and underlying mechanisms for impaired islet function of human T2D are still not fully elucidated.
With the application of gene chips and next-generation sequencing, a great quantity of gene data has been published and stored in public databases including National Center for Biotechnology Information (NCBI) Gene Expression Omnibus (GEO) (https://www.ncbi.nlm.nih.gov/geo/),9 European Bioinformatics Institute ArrayExpress (https://www.ebi.ac.uk/arrayexpress/),10 and Genotype-Tissue Expression (http://www.gtexportal.org).11,12 Integrating and analyzing these data will provide efficient evidence for new researches of diabetes, especially for T2D pathological mechanisms and drug discovery.13 Researches showed that bioinformatics analysis such as genome-wide association studies have been applied to investigate islet molecular genetics of T2D pathogenesis.13–16 However, the interactions among the differentially expressed genes (DEGs) between T2D and nondiabetic islets, the pathways in the interaction network, and especially the coexpression networks in T2D islet genes remain to be elucidated.
In this study, we downloaded the data set GSE4176217,18 from NCBI GEO database. We screened the DEGs and conducted Gene Ontology (GO) and Kyoto Encyclopedia of Genes and Genomes (KEGG) pathway enrichment analyses for DEGs with Database for Annotation, Visualization and Integrated Discovery (DAVID).19 DEGs were analyzed for protein–protein interaction (PPI) network, and the modules of PPI network in T2D were screened as well. Moreover, a weighted correlation network analysis (WGCNA)20 was applied to screen critical gene modules and coexpression networks and to explore the biological significance in dataset GSE41762. The results provide potential gene pathways and underlying molecular mechanisms for the prevention, diagnosis, and treatment of T2D.
Materials and methods
Microarray data information
The gene expression profiles of GSE41762 were downloaded from NCBI GEO (https://www.ncbi.nlm.nih.gov/geo/query/acc.cgi?acc=GSE41762). GSE41762 submitted by Rosengren et al contained 77 samples, and the islets were obtained from 57 nondiabetic and 20 diabetic cadaver donors. The data set was based on Platforms GPL6244, and the microarray was performed using the GeneChip® Human Gene 1.0 ST whole transcript according to the Affymetrix standard protocol.
Identification of DEGs
The raw data were analyzed by interactive web tool GEO2R (https://www.ncbi.nlm.nih.gov/geo/geo2r/). GEO2R is an interactive web tool that allows users to compare two or more groups of samples in a GEO series in order to identify genes that are differentially expressed across experimental conditions. GEO2R performs comparisons using the limma R packages from the Bioconductor project. Statistically significant DEGs were defined with P<0.01 as the cutoff criterion.
GO and pathway enrichment analyses
DAVID is an online gene functional classification tool (https://david.ncifcrf.gov/). GO and KEGG pathway analyses were analyzed using the DAVID online tool to investigate the candidate genes at the functional level. P<0.05 was set as the cutoff criterion. Top 10 enriched pathways in upregulated DEGs or downregulated DEGs were listed in bubble chart, and the chart was plotted using the OmicShare tools, a free online platform for data analysis (www.omicshare.com/tools).
PPI network and module analysis
STRING database (http://string-db.org) was applied to develop DEG-encoded proteins and PPI network. Confidence score >0.4 was set as significant. The PPI network was visualized by the Cytoscape software (Version 3.6.0) (The Cytoscape Consortium, New York, NY). The Molecular Complex Detection plugin of Cytoscape was used to screen the modules of PPI network, and degree =5, node score=0.2, k-core=2, and maximum depth=100 were used as cutoff criteria. Gene functional annotation enrichment was analyzed by ClueGO, and the pathway-like visualization was created by CluePedia plugins of Cytoscape. ClueGO plugin was set as default: kappa score threshold to 0.4, the P-value to 0.05, two-sided hypergeometric test, and Bonferroni step down.
Application of WGCNA
WGCNA20 was applied to identify the coexpressed gene networks of all genes in data set GSE41762. We used “WGCNA” package in R and selected the power of b=5. Modules of highly correlated genes were summarized, and the coexpression module structure was visualized by topological overlap matrix (TOM) plot and heatmap. The name of coexpression module was named as the color. Finally, ClueGO analysis was applied for the analysis of T2D and glycosylated hemoglobin A1c (HbA1c). ClueGO plugin was set as default: kappa score threshold to 0.4, the P-value to 0.05, two-sided hypergeometric test, and Bonferroni step down.
Results
Identification of DEGs in T2D
GSE41762 was downloaded from NCBI GEO and analyzed to identify the DEGs by GEO2R. Using P<0.01 as cutoff criterion, we filtered 957 DEGs in the islets of T2D donors compared with nondiabetic donors from the expression profile data set GSE41762. A total of 467 upregulated DEGs and 490 downregulated DEGs were obtained from GSE41762. The expressions of top 20 DEGs were displayed in a heatmap (Figure 1). Top 10 upregulated DEGs were PGC, C7, SFRP4, SLC6A14, SERPINF1, IL1RL1, MEDAG, MMP10, APOD, and IL6. Top 10 downregulated DEGs were SLC2A2, GLRA1, KLHL41, FAM105A, ABCC8, IAPP, RASGRP1, PFKFB2, and ERO1B.
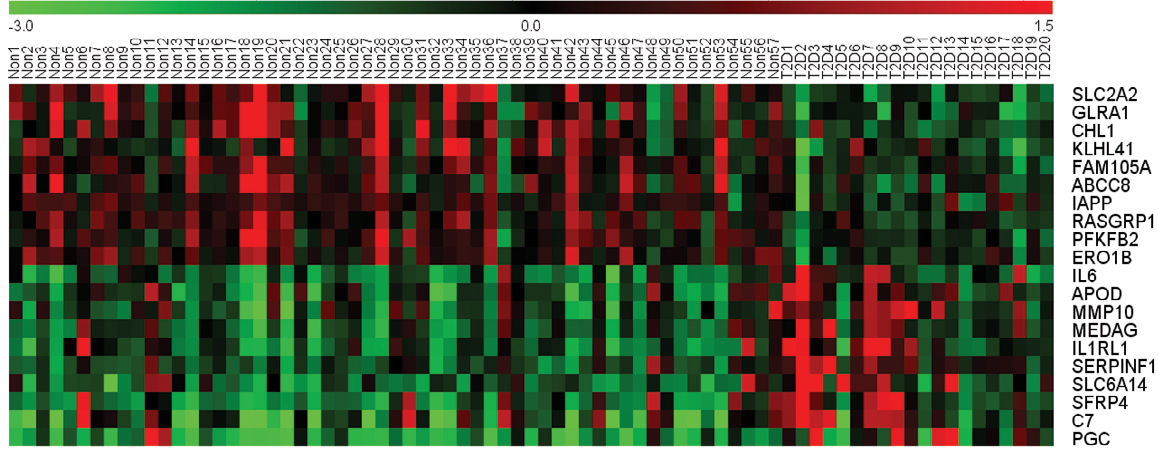 | Figure 1 A heat map of the top 10 upregulated DEGs and top 10 downregulated DEGs in 57 non-T2D islet samples and 20 T2D islet samples. Notes: Red: upregulation; green: downregulation. Abbreviations: DEGs, differentially expressed genes; T2D, type 2 diabetes. |
GO analysis and signaling pathway enrichment of DEGs in T2D
All DEGs were uploaded to the DAVID online tools to analyze the GO and pathway enrichment. The DEGs were classified into three groups including molecular function, cellular component, and biological process. In the group of molecular function, the upregulated DEGs were enriched in poly(A) RNA binding, cadherin binding involved in cell–cell adhesion, and protein binding and the downregulated DEGs were enriched in syntaxin binding, guanyl-nucleotide exchange factor activity, and clathrin binding. In the group of cellular component, the upregulated DEGs were enriched in nucleolus, preribosome, large subunit precursor, and extracellular exosome and the downregulated DEGs were enriched in synapse, dendrite, and neuron projection (Figure S1). In the group of biological process, the upregulated DEGs were enriched in rRNA processing, negative regulation of apoptotic process, cell–cell adhesion, negative regulation of cell proliferation, and osteoblast differentiation and the downregulated DEGs were enriched in the regulation of insulin secretion, glucose homeostasis, nervous system development, dendrite morphogenesis, and regulation of exocytosis (Figure 2A). DEGs’ functional enrichment and signaling pathway enrichment were conducted using the online tool of KEGG pathway (Figure 2B). The upregulated DEGs were mainly enriched in pathways in cancer, proteoglycans in cancer, MAPK signaling pathway, PI3K–Akt signaling pathway, and Ras signaling pathway and the downregulated DEGs were mainly enriched in maturity onset diabetes of the young, insulin secretion, type 2 diabetes mellitus, valine, leucine, and isoleucine degradation, and retrograde endocannabinoid signaling.
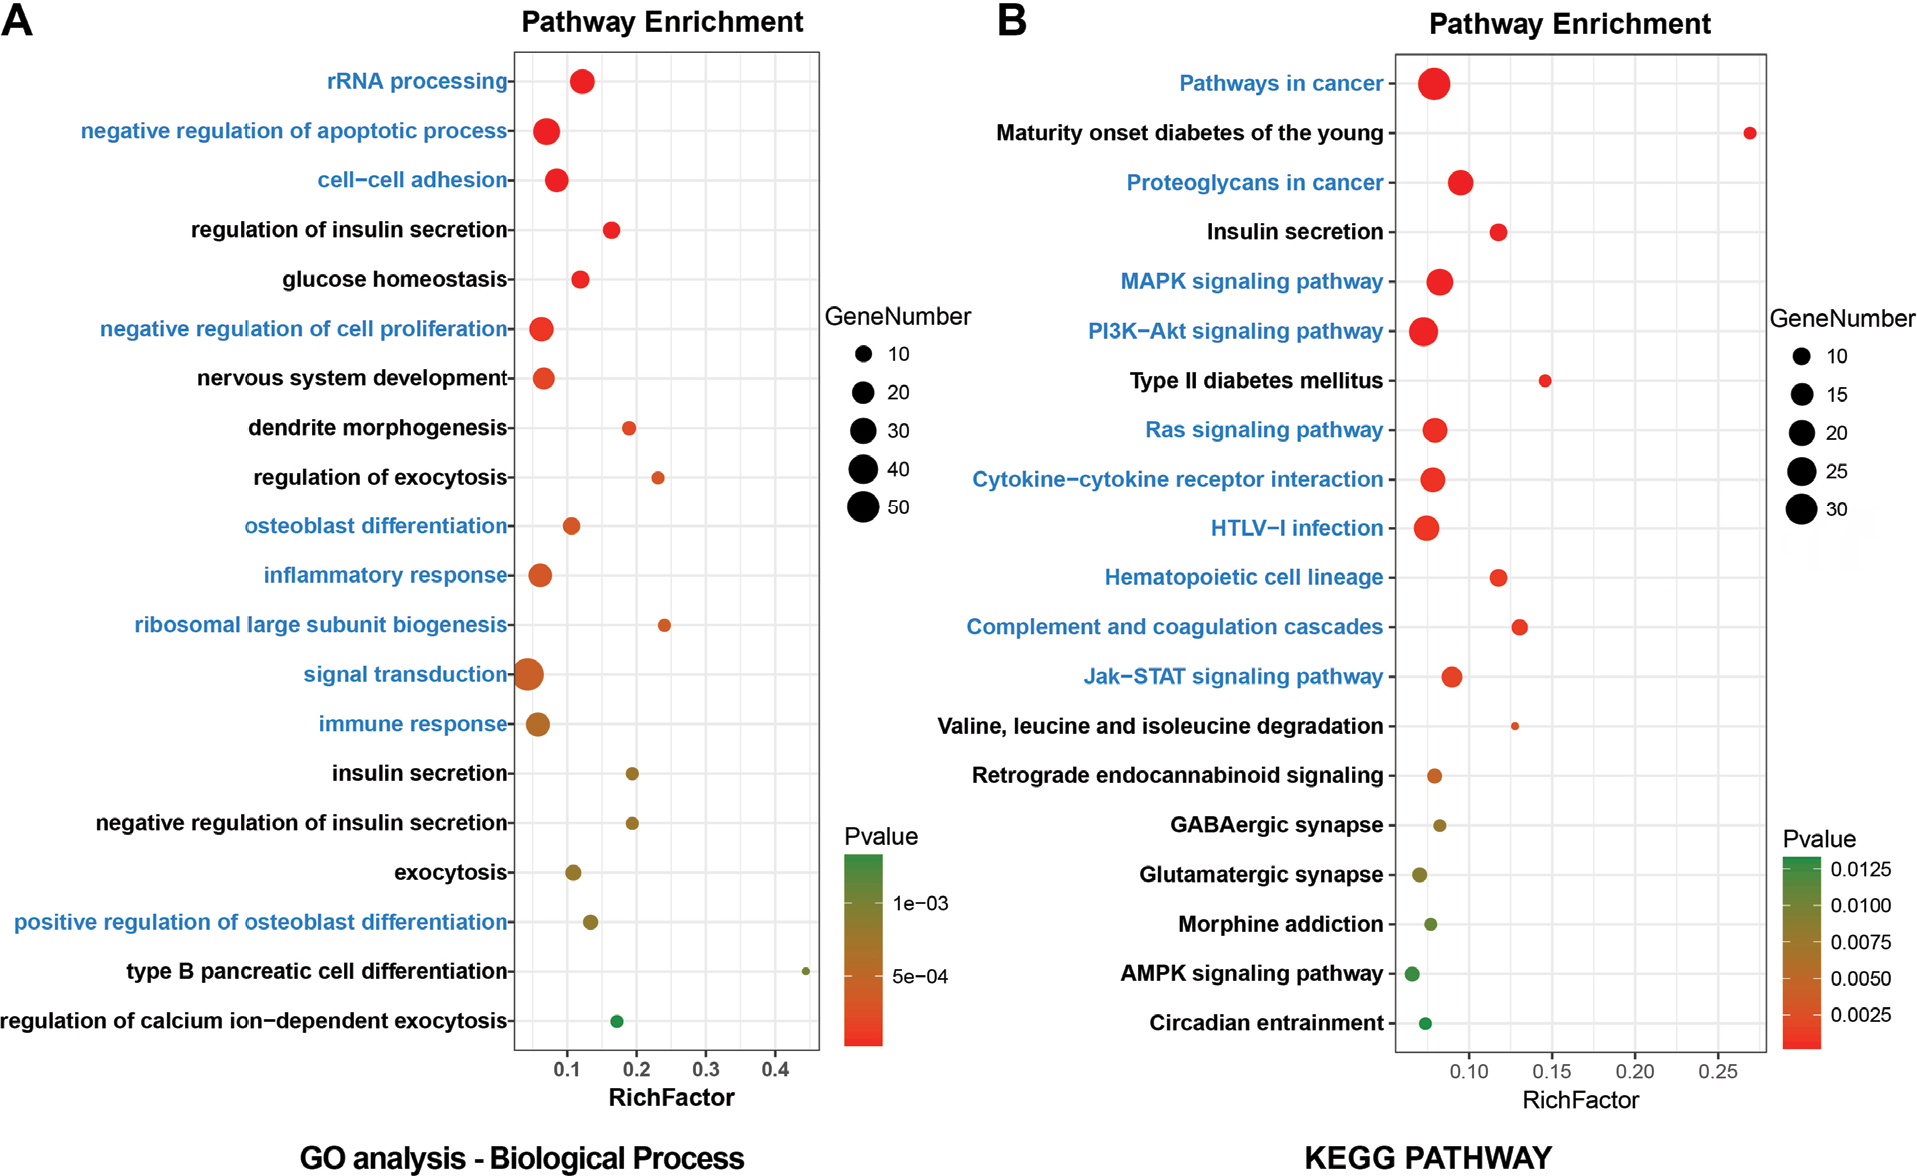 | Figure 2 Enrichment analyses for (A) GO terms (referred to as pathways) and (B) KEGG pathways of DEGs in T2D. Notes: Blue: top 10 enriched pathways of upregulated DEGs. Black: top 10 enriched pathways of downregulated DEGs. Abbreviations: DEGs, differentially expressed genes; GO, gene ontology; KEGG, Kyoto Encyclopedia of Genes and Genomes; T2D, type 2 diabetes. |
PPI network of DEGs in T2D
To verify the functional connectivity of the DEGs, we interrogated the STRING database to dissect the PPI networks. A total of 957 DEGs were analyzed by STRING database, and networks based on DEGs were also constructed by the Cytoscape software. There were 687 nodes and 3,346 edges in the PPI network, which represented proteins and interactions (Figure 3).
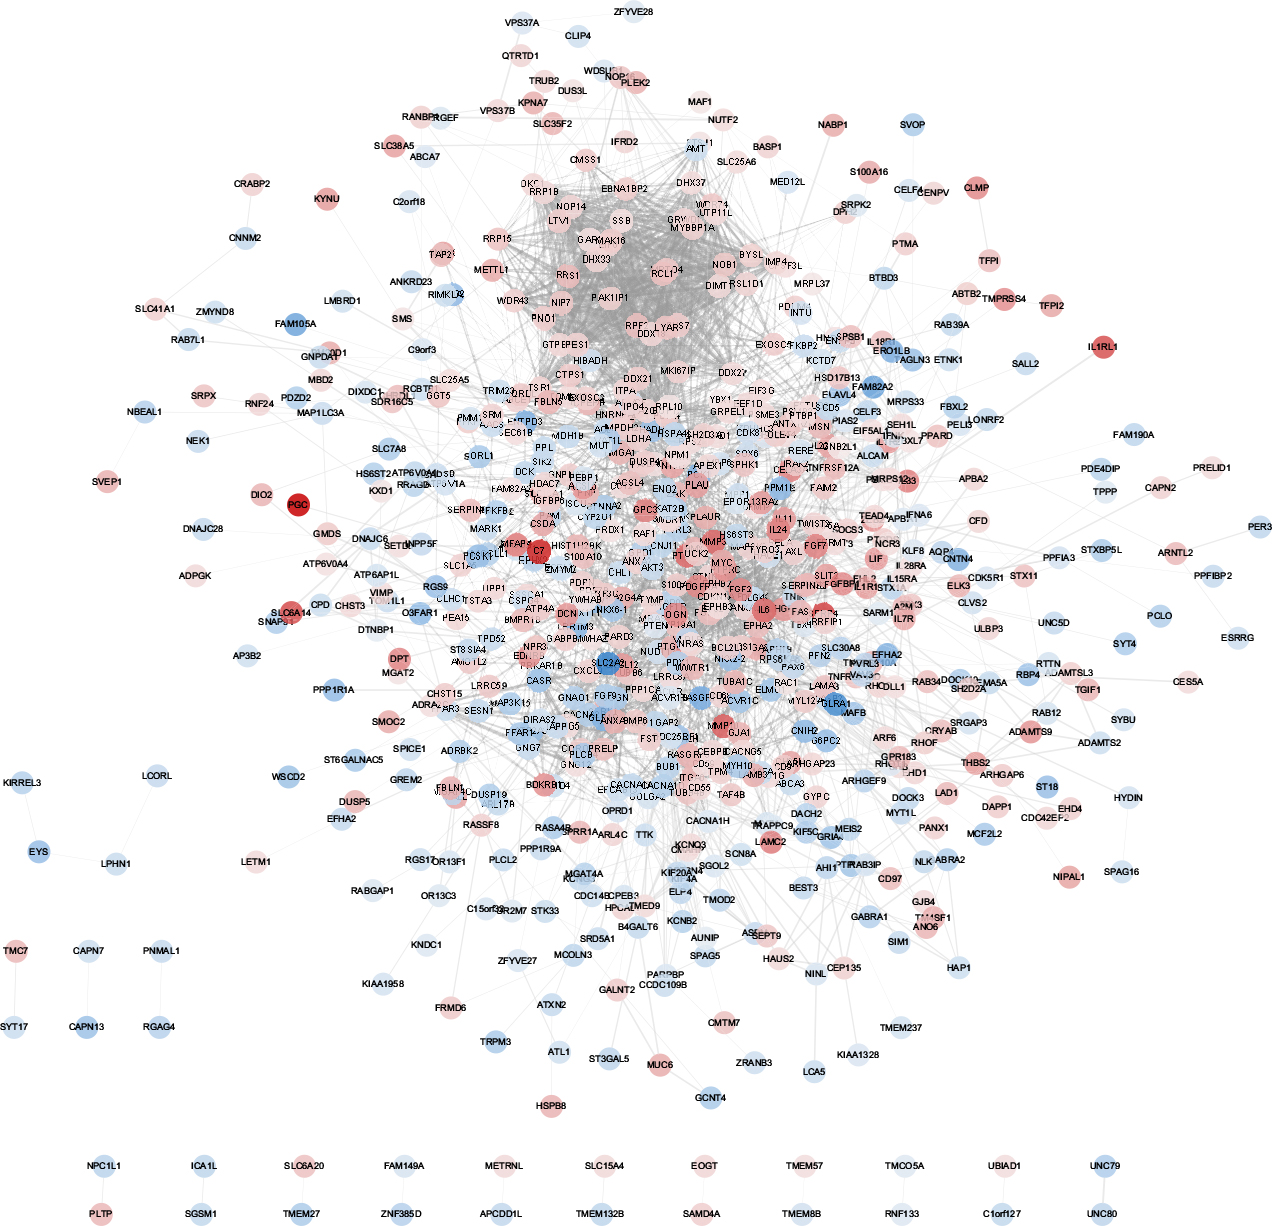 | Figure 3 A PPI network for T2D based on 957 DEGs constructed by Cytoscape. Notes: Red indicates the upregulated DEGs. Blue indicates the downregulated DEGs. Abbreviations: DEGs, differentially expressed genes; PPI, protein–protein interaction; T2D, type 2 diabetes. |
Three functional modules were identified from the PPI network of T2D islets, and the functional annotation enrichment of GO term biological process of each module was analyzed (Figure 4). The modules were generated by Molecular Complex Detection plugin (Figure 4A, C, and E), and the GO term enrichment was generated by ClueGO and CluePedia plugins (Figure 4B, D, and F). Module 1 consisted of 36 nodes and 602 edges (Figure 4A), which mainly associated with RNA secondary structure unwinding, ribosome biogenesis, ribosomal large subunit biogenesis, ribosomal small subunit biogenesis, and maturation of 5.8S rRNA (Figure 4B). Module 2 consisted of 27 nodes and 153 edges (Figure 4C), which mainly associated with the regulation of neurological system process, cellular response to glucagon stimulus, catecholamine secretion, vasodilation, regulation of extrinsic apoptotic signaling pathway via death domain receptors, and regulation of calcium ion import (Figure 4D). Module 3 consisted of seven nodes and 19 edges (Figure 4E), which mainly associated with the regulation of ion transmembrane transport, membrane depolarization during action potential, and regulation of transporter activity (Figure 4F).
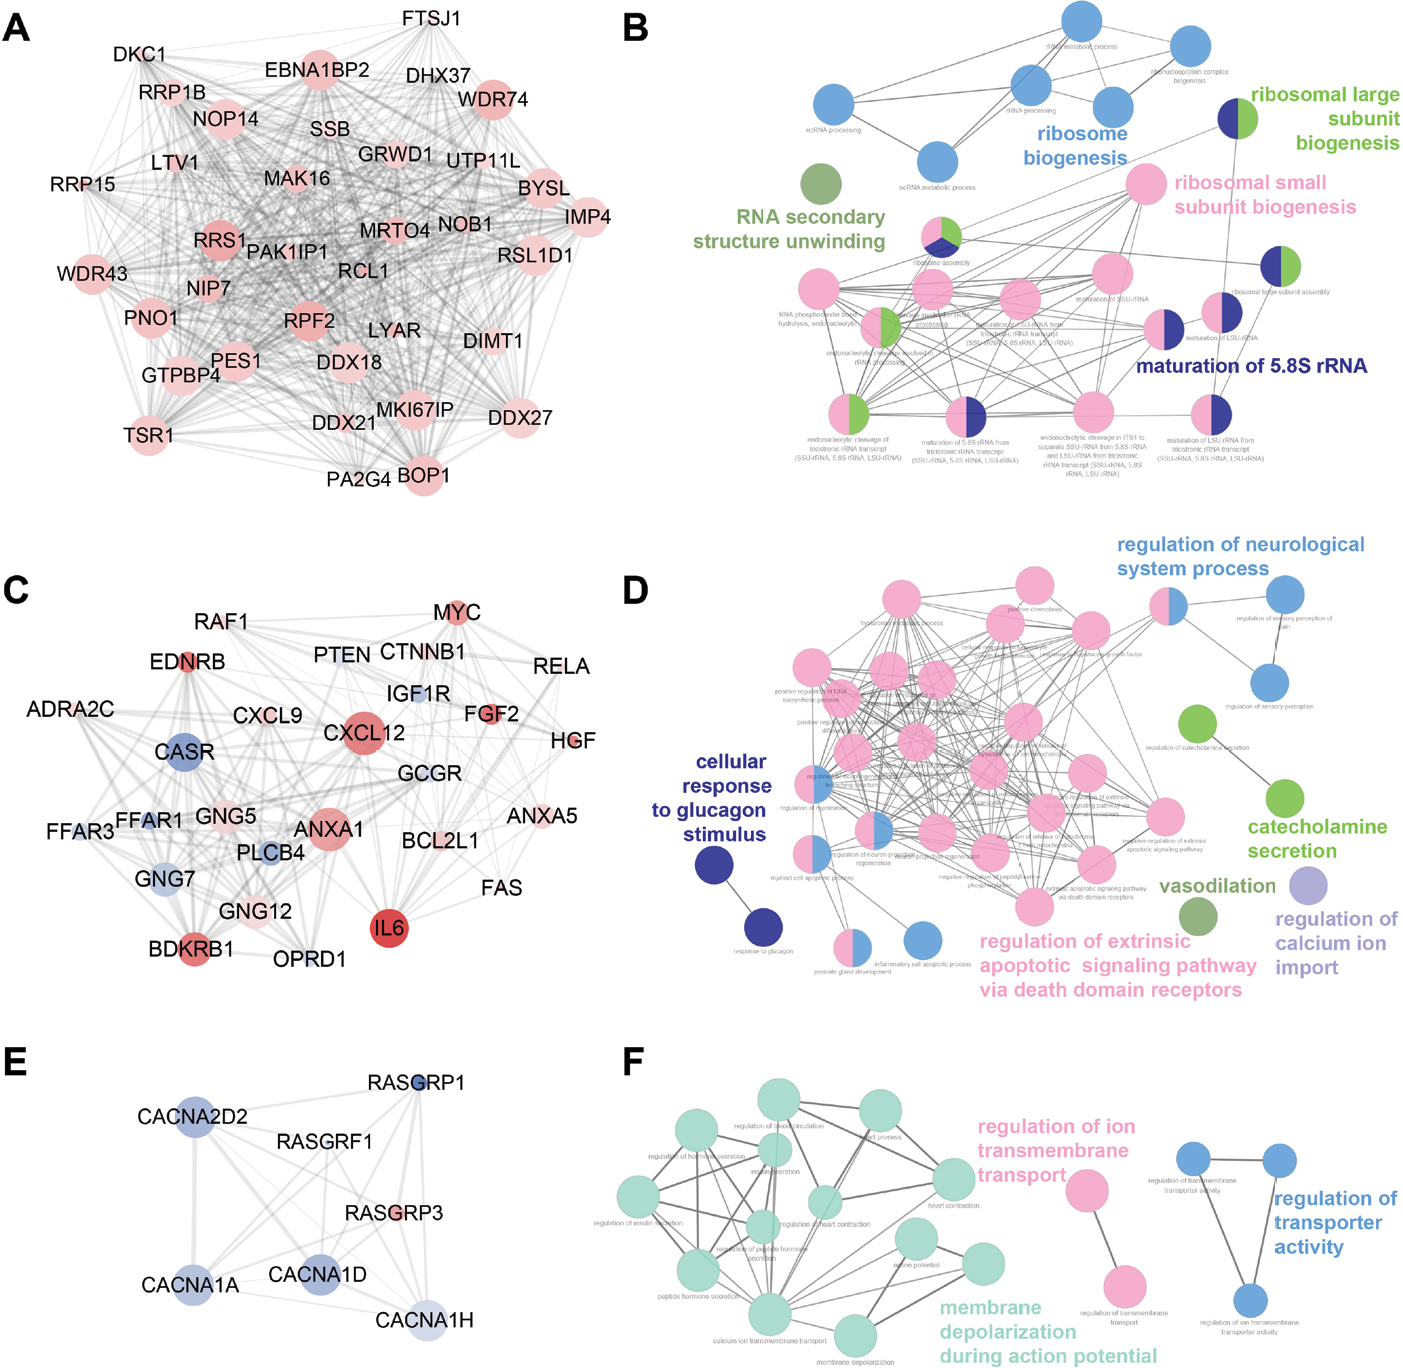 | Figure 4 Top three modules identified from the PPI network by Cytoscape (A, C, and E) and gene annotation enrichment analysis of biological process GO category for each module (B, D, and F). Abbreviations: GO, Gene Ontology; PPI, protein–protein interaction. |
Coexpression network analyzed by WGCNA in T2D islets
To identify significantly enriched gene coexpression network of T2D patients, we used WGCNA approach to reveal the highly correlated genes. All samples in data set GSE41762 were included in coexpression analysis, and four types of clinical data including sex, age, BMI, and HbA1c were found in T2D and nondiabetic patients (Figure 5A). The clustering was based on gene expression profiles in T2D and nondiabetic islets (Figure 5B). In total, the hierarchical clustering dendrogram identified 13 distinct gene modules and we generated the TOM plot of a gene network with the corresponding hierarchical clustering dendrograms and the resulting modules (Figure 5C).
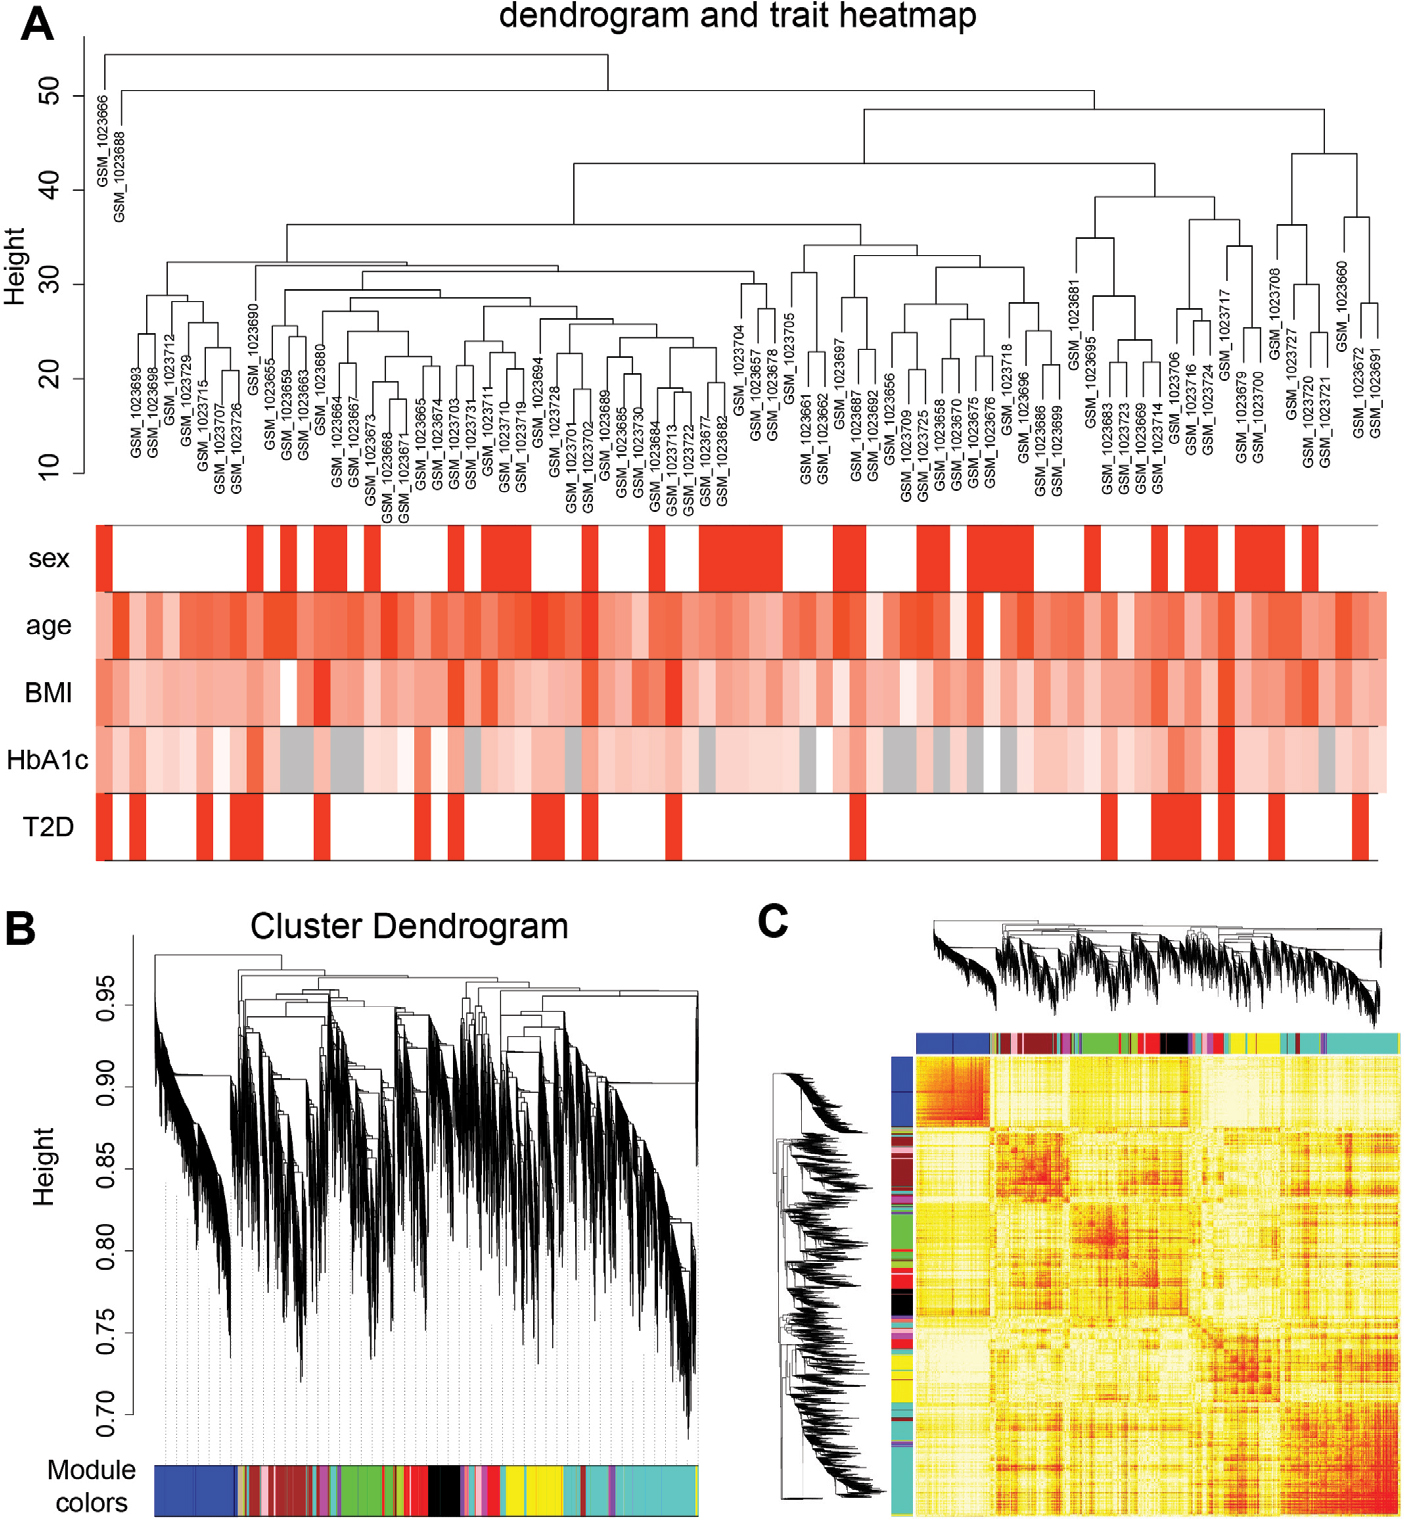 | Figure 5 Sample clustering and module detection. Notes: (A) Sample dendrogram and trait indicator. The red color represents female and T2D samples, and the gray color represents no data in HbA1c. The color intensity was proportional to older age, higher BMI, and HbA1c levels. (B) Genes were clustered based on 1-TOM. Each colored branch indicates a module of highly connected genes. (C) The TOM plot shows the modules of gene expression by WGCNA. Abbreviations: T2D, type 2 diabetes; TOM, topological overlap matrix; WGCNA, weighted correlation network analysis. |
To reveal the relationships between modules and clinical traits, we carried out a correlation analysis of the module–trait relationships (Figure 6A). We found that purple module was negatively associated with traits HbA1c and T2D, whereas turquoise module was negatively correlated with traits BMI, HbA1c, and T2D. Yellow module was found to be positively associated with traits BMI and HbA1c, whereas magenta module was found to be positively correlated with traits BMI, HbA1c, and T2D. HbA1c is one of the most important indicators of diabetes; thus, we further summarized the relationships among modules and trait T2D or HbA1c in Figure 6B and C. The hierarchical clustering dendrograms and heatmap plots indicated that the magenta module, the turquoise module, the purple module, and the yellow module were related to T2D and HbA1c.
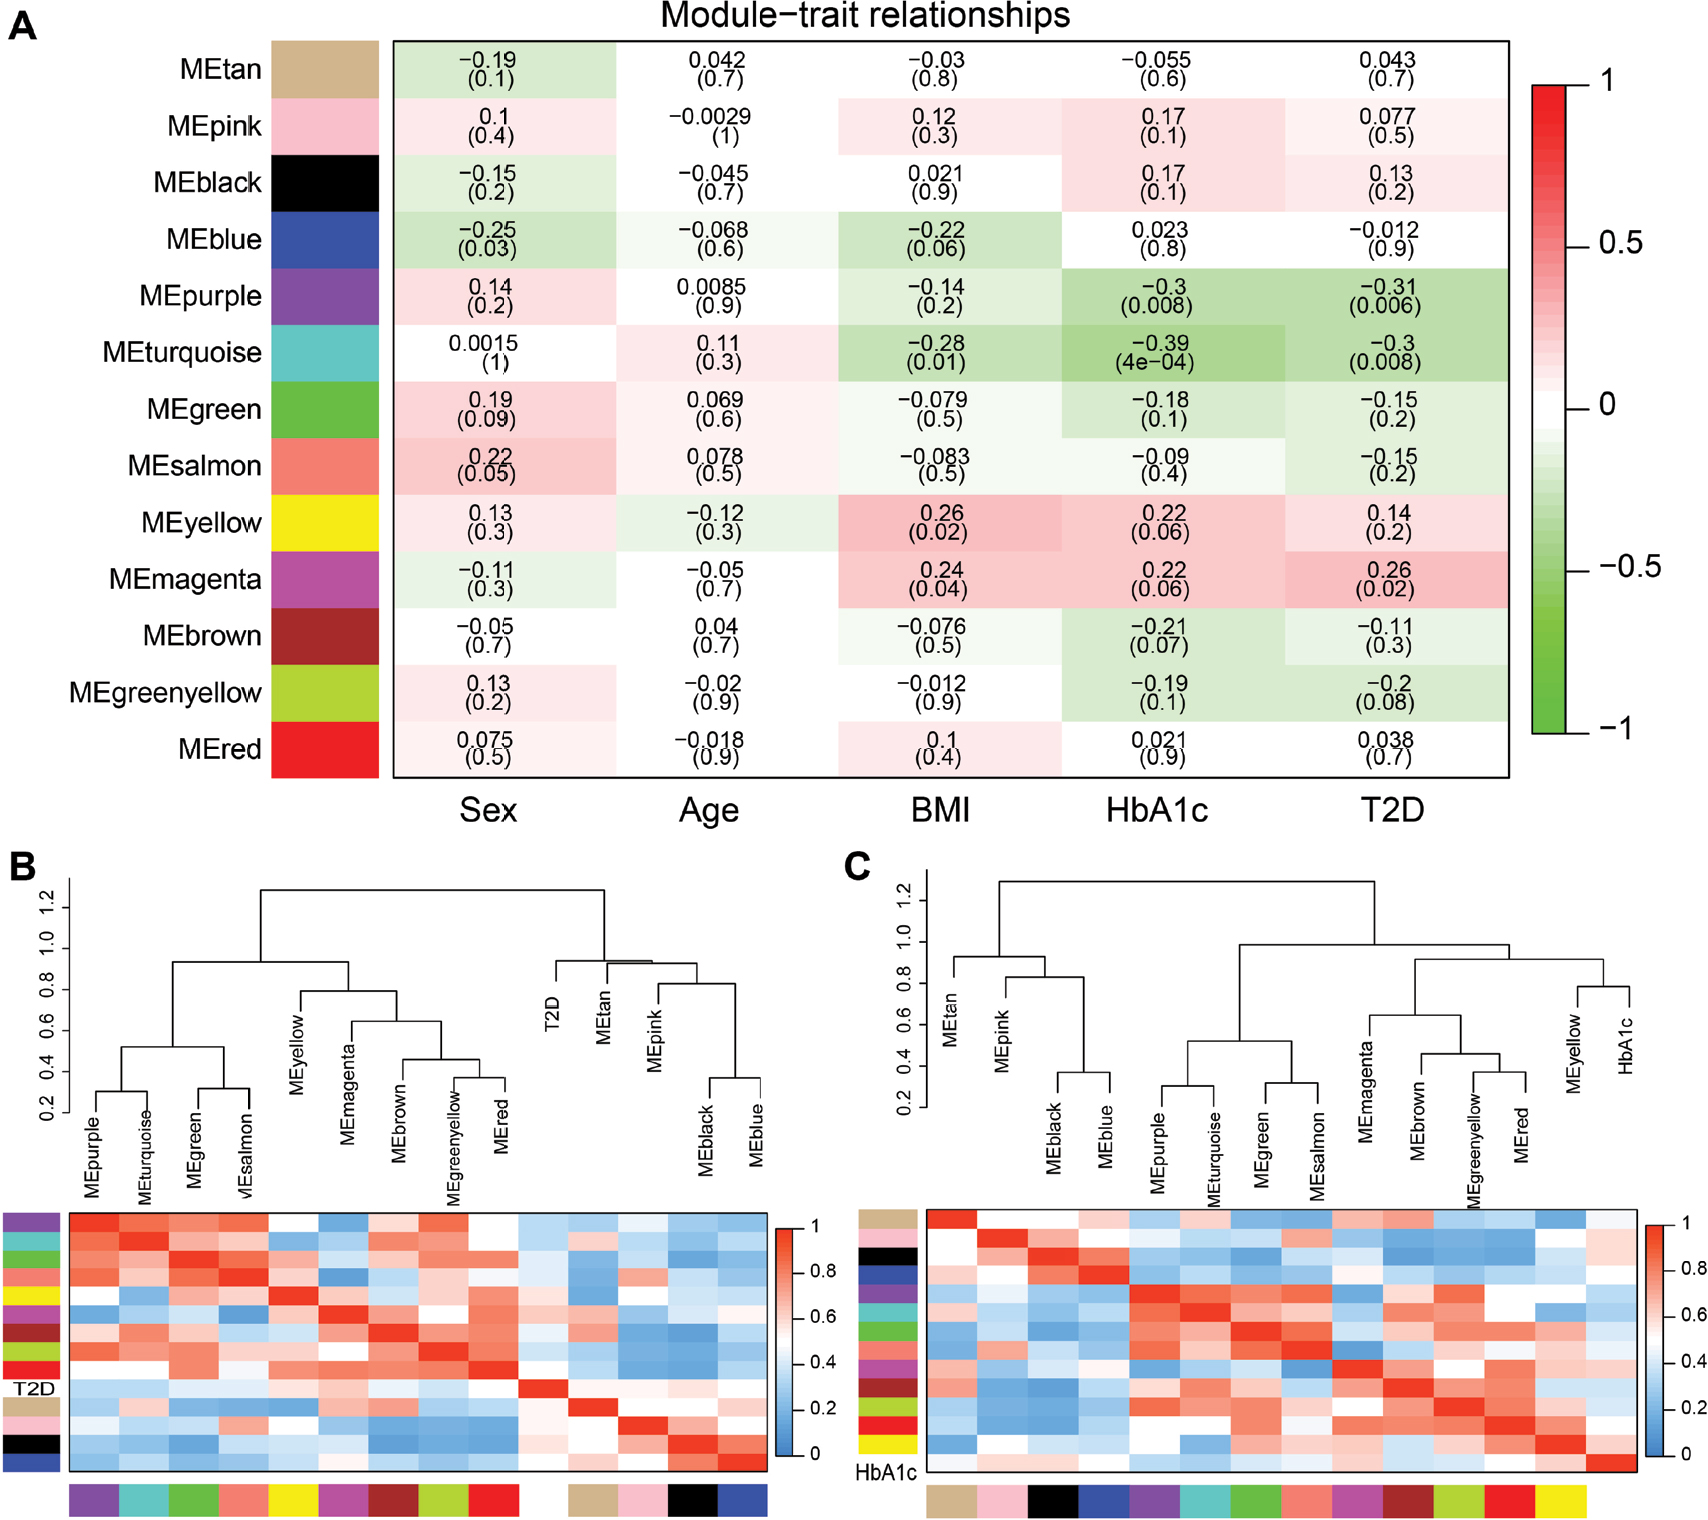 | Figure 6 Correlation between modules and T2D. Notes: (A) Heatmap of the module–trait relationships. P-values between the detected modules on the y-axis and clinical traits on the x-axis are shown in the box. Color indicates the direction of association (red means positive correlation; green means negative correlation). Hierarchical clustering dendrograms and heatmap of the trait T2D (B) or trait HbA1c (C). Each row and column in the heatmap corresponds to one module (labeled by color) or the trait (labeled by T2D or HbA1c). Red represents positive correlation, and blue represents negative correlation. Abbreviation: T2D, type 2 diabetes. |
Functional annotation of highly correlated modules
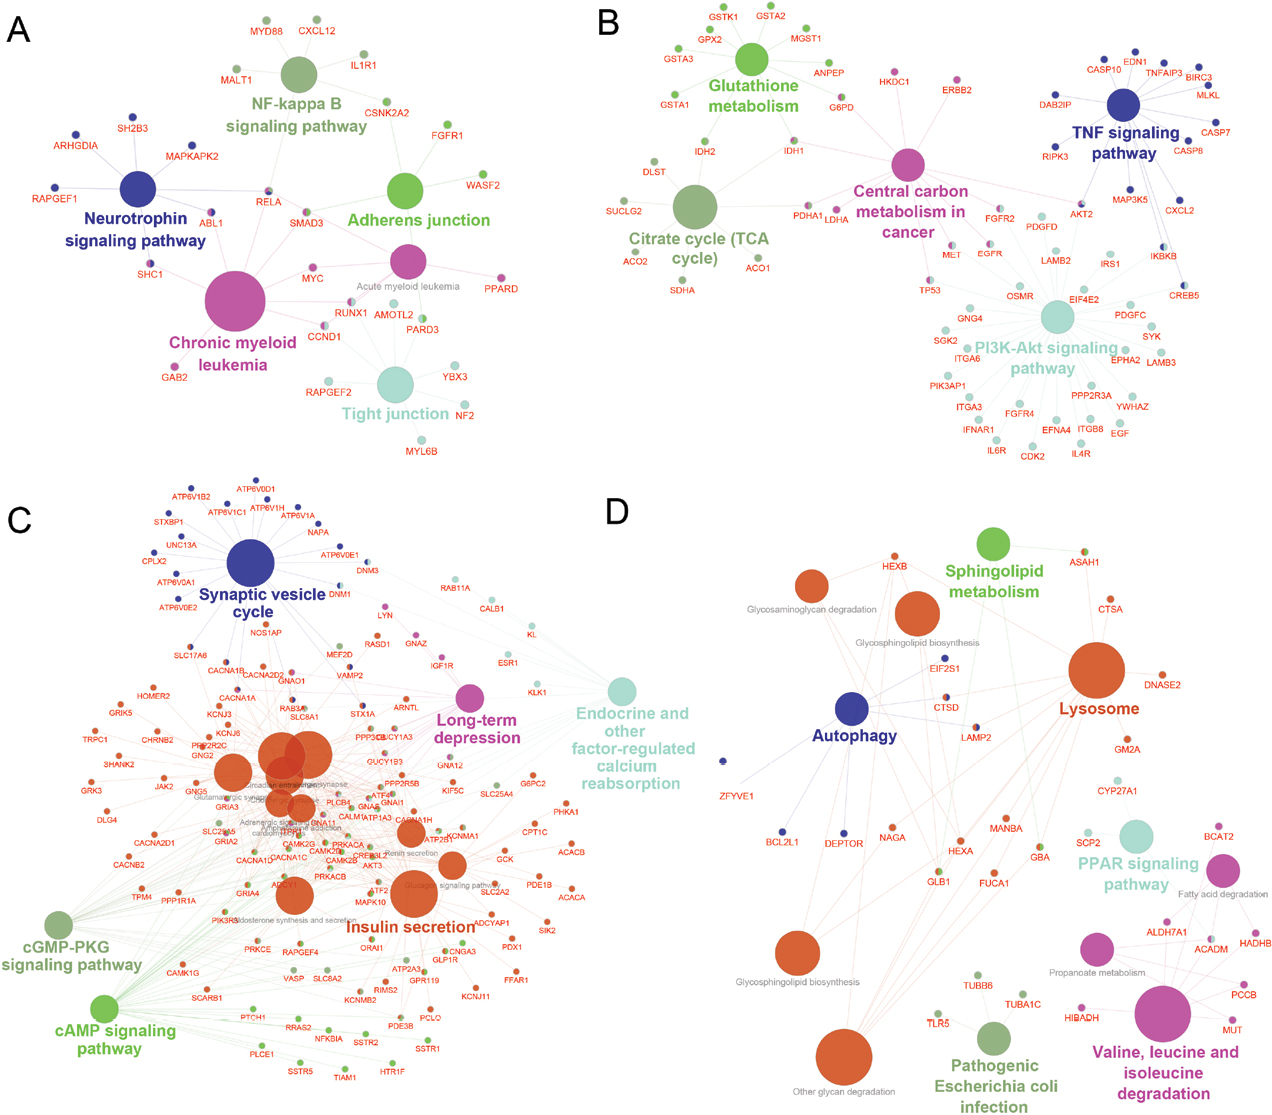
As a result, the top two positive and two negative correlation modules with T2D and HbAlc were selected for functional annotation, respectively (Figure 7). The genes in magenta module were mainly enriched in chronic myeloid leukemia, neurotrophin signaling pathway, NF-kappa B signaling pathway, tight junction, and adherens junction (Figure 7A), whereas the genes in yellow module were mainly enriched in PI3K-Akt signaling pathway, citrate cycle (TCA cycle), TNF signaling pathway, central carbon metabolism in cancer, and glutathione metabolism (Figure 7B). The genes in turquoise module were mainly enriched in insulin secretion, cAMP signaling pathway, endocrine and other factor-regulated calcium reabsorption, long-term depression, and cGMP-PKG signaling pathway (Figure 7C), whereas the genes in purple module were mainly enriched in lysosome, PPAR signaling pathway, valine, leucine, and isoleucine degradation, autophagy, sphingolipid metabolism, and pathogenic Escherichia coli infection (Figure 7D).
Discussion
Islet β-cell dysfunction plays a key role in the development of T2D. Investigating the molecular pathways and coexpression networks in T2D islets will provide new insights in the prevention, diagnosis, and treatment of T2D. Taneera et al had analyzed the global gene expression in human islets of dataset GSE38642, which contained 54 nondiabetic and nine diabetic donors,13 and PPI network was analyzed and showed the strong association with insulin secretion and HbA1c. In the present study, we selected the data set GSE41762 for bioinformatics analysis, which contained 20 T2D donors and 57 nondiabetic donors. We have checked that all 63 samples in GSE38642 were included in GSE41762; thus, we believed that it would provide more effective and credible potential gene pathways and coexpression networks involved in T2D.
In this study, we identified 467 upregulated DEGs and 490 downregulated DEGs between normal and T2D islets. A false discovery rate (FDR) of <0.05 is always applied to select DEGs for a gene expression profiling study. However, in our study, we found that only 19 DEGs were found out to meet the criterion (FDR <0.05). In order to get more useful DEGs, which may involve in T2D development, we choose a nominal P<0.01 criterion for identifying DEGs. Among the top three upregulated DEGs in our work, SFRP4 has been demonstrated to be a potential biomarker for islet dysfunction in T2D by analyzing GSE41762 as well.18 Instead of focusing on individual gene for T2D, our work explored the key pathways and candidate gene coexpression networks derived from global gene expression profile. For functional annotation, we performed GO and KEGG pathway enrichment analyses. In order to explore the function of DEGs, we analyzed the upregulated and downregulated DEGs separately. It could clarify that the enriched pathways were activation or inhibition during T2D development. As shown in Figure 2, we found that inflammatory response, immune response, and cytokine–cytokine receptor interaction were enriched in upregulated DEGs. This is consistent with the knowledge that islet inflammation inducing β-cell dysfunction involved in T2D.21–23 Islet leukocyte and proinflammatory cytokines increased in the development of T2D. Immune response within islets was demonstrated to induce the proinflammatory cytokines in T2D.21 The adaptive immune response contributed to the islet dysfunction by the alternation of immune cells, and immune cell infiltration could be observed within the islets of T2D.24,25 As a result, targeting inflammation, including immune system, showed multiple benefits in T2D treatment.26 The downregulated DEGs mainly involved in type 2 diabetes mellitus, insulin secretion, type B pancreatic cell differentiation, and calcium ion-dependent exocytosis (Figure 2). β-Cell dedifferentiation has been identified as one of the main reasons for β-cell failure in T2D.27–29 β cells loss their mature identity such as PDX1, MAFA, and NKX6.1 and transferred to undifferentiated islet progenitor cells in the development of T2D.30 Calcium ion-dependent exocytosis is critical for pancreatic β-cell function, since insulin secretion is associated with calcium influx and subsequent calcium amplification of β cells.31 Alterations in β-cell calcium homeostasis were observed in T2D as well.32,33 Our previous work has identified that decreased cytoplasm calcium concentration transient amplitude by junctional membrane complex dysfunction reduced the glucose-stimulated insulin secretion of islet β cells.34
Here, we also constructed the PPI network of DEGs (Figure 3). We combined the upregulated and downregulated DEGs together, which would elucidate more functional interactions between genes for gene networks. The most significant three modules were filtered in Figure 4. Hub genes in module 1 were mainly enriched in ribosome biogenesis (Figure 4B). High glucose caused by diabetes induced ribosomal biogenesis.35 Increased ribosomal biogenesis induced pancreatic β-cell failure in Lepr(-/-) T2D mice.36 Hub genes in module 2 were mainly enriched in the regulation of extrinsic apoptotic signaling pathway via death domain receptors (Figure 4D). The pathway indicated any process that modulates the frequency, rate, or extent of extrinsic apoptotic signaling pathway via death domain receptors. Research showed that cytokines induced the expression of several factors in diabetic β cells in the extrinsic pathway of apoptosis.37 Hub genes in module 3 were mainly enriched in membrane depolarization during action potential (Figure 4F). T2D-induced apoptosis on β cells was coupled with membrane depolarization caused by hyperglycemia.38
Coexpression network analysis by WGCNA identified 13 distinct gene modules of T2D islets. We found that the magenta module and the yellow module were positively related to T2D and HbA1c, whereas the turquoise module and the purple module were negatively associated with T2D and HbA1c (Figure 6). ClueGO analysis was carried out for the enrichment analysis of these modules. Magenta module was involved in NF-kappa B signaling pathway (Figure 7A), which acts as an important mechanism of islet β-cell death against glucolipotoxicity in T2D.39,40 Yellow module was associated with TNF signaling pathway (Figure 7B), which activated in T2D islets25 and partly contributed to the development of islet inflammation.41 Turquoise module was enriched in insulin secretion and cAMP signaling pathway (Figure 7C). Activation of cAMP signaling pathway by liraglutide improved islet β cell viability, which could contribute to T2D therapy.42 Purple module was related to PPAR signaling pathway (Figure 7D). Our previous study has demonstrated that PPAR pathway promoted β-cell generation from embryonic stem cells coupled with mitochondrial biogenesis.43 Moreover, PPAR pathway was correlated with mitochondrial function in islet insulin secretion dysfunction.34 PPARγ coactivator 1 α PGC-1α regulates HO-1 expression, mitochondrial dynamics, and biogenesis.44 Our previous work found that PGC-1α inactivation decreased the expression of mitofusin 2, which leaded to damaged mitochondrial function and impaired insulin secretion.34 In summary, we illustrated the key gene pathways and coexpression networks in T2D by applying bioinformatics analysis.
Conclusion
The results provide potential gene pathways and underlying molecular mechanisms for the prevention, diagnosis, and treatment of T2D. However, further molecular experiments are still needed to identify the function of the candidate pathways in T2D.
Acknowledgment
This work was supported by The National Natural Science Foundation of China (No 81703578).
Author contributions
All authors contributed to this work. LL designed the work and performed the data analysis. ZP performed the data analysis and drafted the manuscript. SY performed the data analysis and revised the manuscript. WS analyzed the data and revised the manuscript. YY helped to draft the manuscript. All authors contributed toward data analysis, drafting and critically revising the paper and agree to be accountable for all aspects of the work.
Disclosure
The authors report no conflicts of interest in this work.
References
Ogurtsova K, da Rocha Fernandes JD, Huang Y, et al. IDF Diabetes Atlas: Global estimates for the prevalence of diabetes for 2015 and 2040. Diabetes Res Clin Pract. 2017;128(128):40–50. | ||
International Diabetes Federation. IDF Diabetes Atlas, 8th edn. Brussels, Belgium: International Diabetes Federation, 2017. http://www.diabetesatlas.org. | ||
Tripathi BK, Srivastava AK. Diabetes mellitus: complications and therapeutics. Med Sci Monit. 2006;12(7):A130–A147. | ||
Wu Y, Ding Y, Tanaka Y, Zhang W. Risk factors contributing to type 2 diabetes and recent advances in the treatment and prevention. Int J Med Sci. 2014;11(11):1185–1200. | ||
Prasad RB, Groop L. Genetics of type 2 diabetes-pitfalls and possibilities. Genes. 2015;6(1):87–123. | ||
Druet C, Tubiana-Rufi N, Chevenne D, Rigal O, Polak M, Levy-Marchal C. Characterization of insulin secretion and resistance in type 2 diabetes of adolescents. J Clin Endocrinol Metab. 2006;91(2):401–404. | ||
Ashcroft FM, Rorsman P. Diabetes mellitus and the β cell: the last ten years. Cell. 2012;148(6):1160–1171. | ||
Rosengren AH, Braun M, Mahdi T, et al. Reduced insulin exocytosis in human pancreatic β-cells with gene variants linked to type 2 diabetes. Diabetes. 2012;61(7):1726–1733. | ||
Barrett T, Wilhite SE, Ledoux P, et al. NCBI GEO: archive for functional genomics data sets—update. Nucleic Acids Res. 2013;41(Database issue):D991–D995. | ||
Parkinson H, Kapushesky M, Shojatalab M, et al. ArrayExpress: a public database of microarray experiments and gene expression profiles. Nucleic Acids Res. 2007;35(Database issue):D747–D750. | ||
GTEx Consortium. The Genotype-Tissue Expression (GTEx) project. Nat Genet. 2013;45(6):580–585. | ||
GTEx Consortium. Human genomics. The Genotype-Tissue Expression (GTEx) pilot analysis: multitissue gene regulation in humans. Science. 2015;348(6235):648–660. | ||
Taneera J, Lang S, Sharma A, et al. A systems genetics approach identifies genes and pathways for type 2 diabetes in human islets. Cell Metab. 2012;16(1):122–134. | ||
Gaulton KJ, Ferreira T, Lee Y, et al. Genetic fine mapping and genomic annotation defines causal mechanisms at type 2 diabetes susceptibility loci. Nat Genet. 2015;47(12):1415–1425. | ||
Lawlor N, Khetan S, Ucar D, Stitzel ML. Genomics of Islet (Dys)function and Type 2 Diabetes. Trends Genet. 2017;33(4):244–255. | ||
Stitzel ML, Sethupathy P, Pearson DS, et al. Global epigenomic analysis of primary human pancreatic islets provides insights into type 2 diabetes susceptibility loci. Cell Metab. 2010;12(5):443–455. | ||
Tang Y, Axelsson AS, Spégel P, et al. Genotype-based treatment of type 2 diabetes with an α2A-adrenergic receptor antagonist. Sci Transl Med. 2014;6(257):257ra139. | ||
Mahdi T, Hänzelmann S, Salehi A, et al. Secreted frizzled-related protein 4 reduces insulin secretion and is overexpressed in type 2 diabetes. Cell Metab. 2012;16(5):625–633. | ||
Huang Daw, Sherman BT, Lempicki RA. Systematic and integrative analysis of large gene lists using DAVID bioinformatics resources. Nat Protoc. 2009;4(1):44–57. | ||
Langfelder P, Horvath S. WGCNA: an R package for weighted correlation network analysis. BMC Bioinformatics. 2008;9(9):559. | ||
Eguchi K, Nagai R. Islet inflammation in type 2 diabetes and physiology. J Clin Invest. 2017;127(1):14–23. | ||
Donath MY, Shoelson SE. Type 2 diabetes as an inflammatory disease. Nat Rev Immunol. 2011;11(2):98–107. | ||
Eguchi K, Manabe I, Oishi-Tanaka Y, et al. Saturated fatty acid and TLR signaling link β cell dysfunction and islet inflammation. Cell Metab. 2012;15(4):518–533. | ||
Subauste A, Gianani R, Chang AM, et al. Islet autoimmunity identifies a unique pattern of impaired pancreatic beta-cell function, markedly reduced pancreatic beta cell mass and insulin resistance in clinically diagnosed type 2 diabetes. PLoS One. 2014;9(9):e106537. | ||
Butcher MJ, Hallinger D, Garcia E, et al. Association of proinflammatory cytokines and islet resident leucocytes with islet dysfunction in type 2 diabetes. Diabetologia. 2014;57(3):491–501. | ||
Donath MY. Multiple benefits of targeting inflammation in the treatment of type 2 diabetes. Diabetologia. 2016;59(4):679–682. | ||
Wang Z, York NW, Nichols CG, Remedi MS. Pancreatic β cell dedifferentiation in diabetes and redifferentiation following insulin therapy. Cell Metab. 2014;19(5):872–882. | ||
Cinti F, Bouchi R, Kim-Muller JY, et al. Evidence of β-cell dedifferentiation in human type 2 diabetes. J Clin Endocrinol Metab. 2016;101(3):1044–1054. | ||
Dor Y, Glaser B. β-cell dedifferentiation and type 2 diabetes. N Engl J Med. 2013;368(6):572–573. | ||
Spijker HS, Song H, Ellenbroek JH, et al. Loss of β-cell identity occurs in type 2 diabetes and is associated with islet amyloid deposits. Diabetes. 2015;64(8):2928–2938. | ||
Henquin JC, Nenquin M, Stiernet P, Ahren B. In vivo and in vitro glucose-induced biphasic insulin secretion in the mouse: pattern and role of cytoplasmic Ca2+ and amplification signals in beta-cells. Diabetes. 2006;55(2):441–451. | ||
Gilon P, Chae HY, Rutter GA, Ravier MA. Calcium signaling in pancreatic β-cells in health and in Type 2 diabetes. Cell Calcium. 2014;56(5):340–361. | ||
Rutter GA, Hodson DJ, Chabosseau P, Haythorne E, Pullen TJ, Leclerc I. Local and regional control of calcium dynamics in the pancreatic islet. Diabetes Obes Metab. 2017;19 Suppl 1(19 Suppl 1):30–41. | ||
Li L, Pan ZF, Huang X, et al. Junctophilin 3 expresses in pancreatic beta cells and is required for glucose-stimulated insulin secretion. Cell Death Dis. 2016;7(6):e2275. | ||
Mariappan MM, D’Silva K, Lee MJ, et al. Ribosomal biogenesis induction by high glucose requires activation of upstream binding factor in kidney glomerular epithelial cells. Am J Physiol Renal Physiol. 2011;300(1): F219–F230. | ||
Asahara S, Matsuda T, Kido Y, Kasuga M. Increased ribosomal biogenesis induces pancreatic beta cell failure in mice model of type 2 diabetes. Biochem Biophys Res Commun. 2009;381(3):367–371. | ||
Anuradha R, Saraswati M, Kumar KG, Rani SH. Apoptosis of beta cells in diabetes mellitus. DNA Cell Biol. 2014;33(11):743–748. | ||
Tomita T. Apoptosis in pancreatic β-islet cells in Type 2 diabetes. Bosn J Basic Med Sci. 2016;16(3):162–179. | ||
Bagnati M, Ogunkolade BW, Marshall C, et al. Glucolipotoxicity initiates pancreatic β-cell death through TNFR5/CD40-mediated STAT1 and NF-κB activation. Cell Death Dis. 2016;7(8):e2329. | ||
Malle EK, Zammit NW, Walters SN, et al. Nuclear factor κB-inducing kinase activation as a mechanism of pancreatic β cell failure in obesity. J Exp Med. 2015;212(8):1239–1254. | ||
Wang C, Guan Y, Yang J. Cytokines in the progression of pancreatic β-cell dysfunction. Int J Endocrinol. 2010;2010(2010):515136–10. | ||
Xu X, Chen J, Hu L, et al. Liraglutide regulates the viability of pancreatic α-cells and pancreatic β-cells through cAMP-PKA signal pathway. Life Sci. 2018;195(195):87–94. | ||
Li L, Li T, Zhang Y, et al. Peroxisome proliferator-activated receptorbeta/delta activation is essential for modulating p-Foxo1/Foxo1 status in functional insulin-positive cell differentiation. Cell Death Dis. 2015;6:e1715. | ||
Singh SP, Schragenheim J, Cao J, Falck JR, Abraham NG, Bellner L. PGC-1 alpha regulates HO-1 expression, mitochondrial dynamics and biogenesis: Role of epoxyeicosatrienoic acid. Prostaglandins Other Lipid Mediat. 2016;125(125):8–18. |
Supplementary material
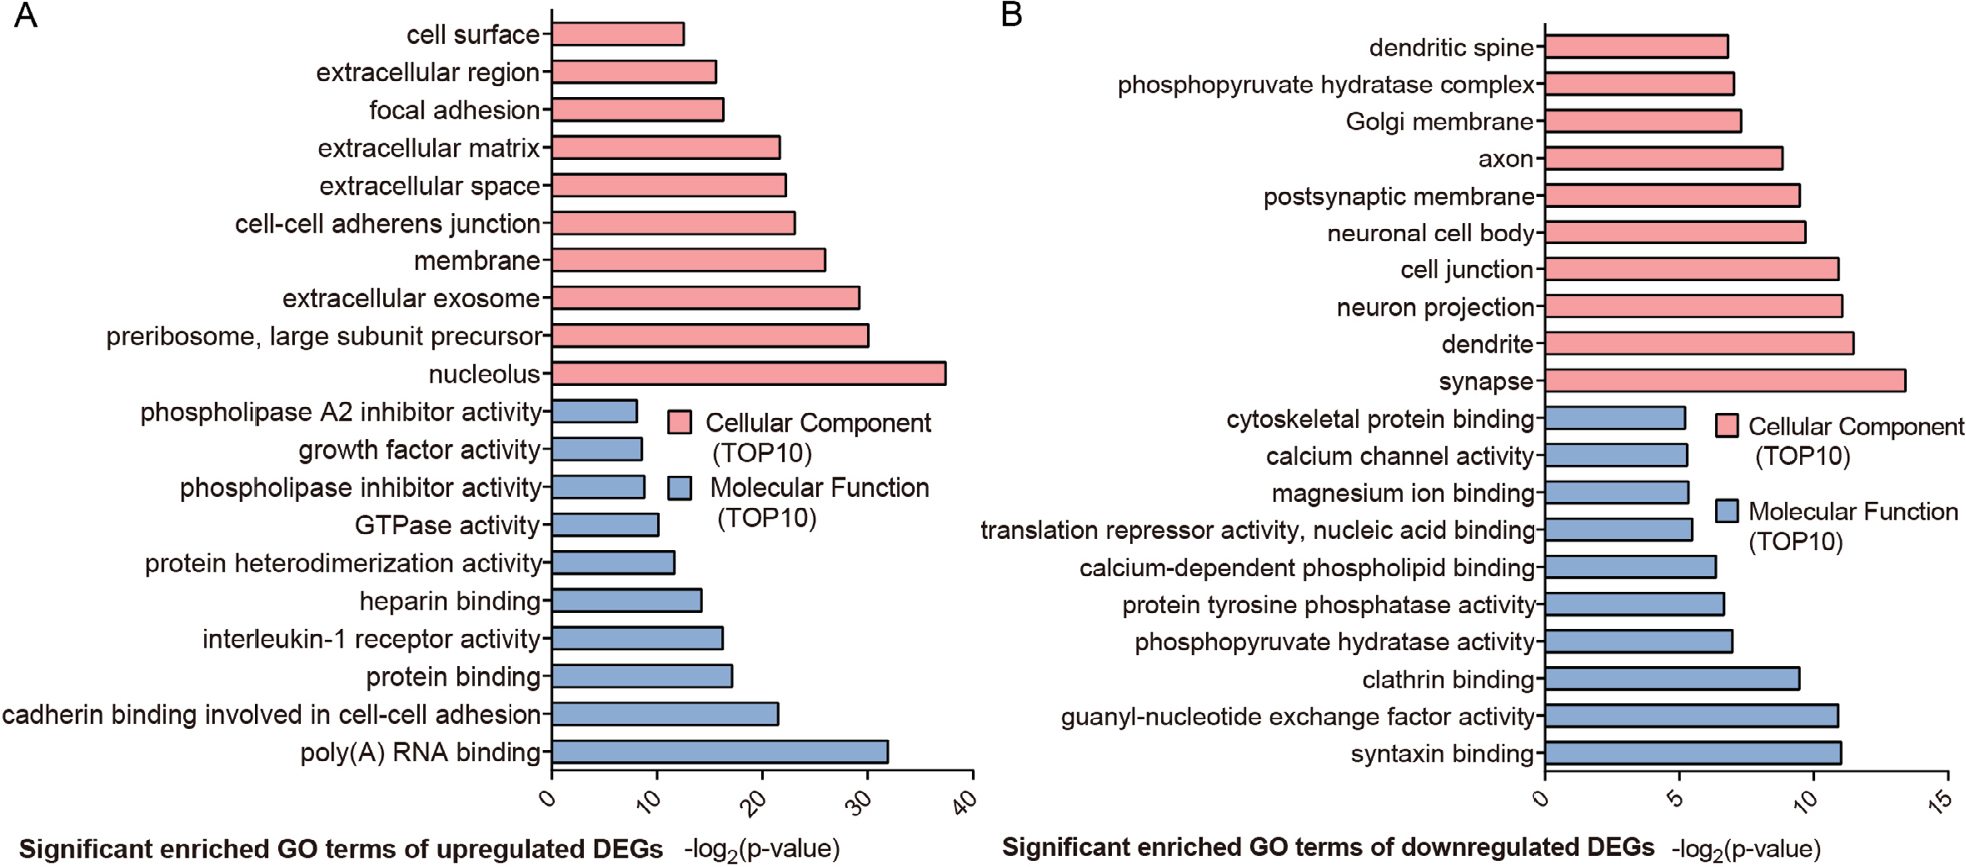 | Figure S1 GO analysis classified the DEGs ([A] upregulated DEGs and [B] downregulated DEGs) into cellular component and molecular function of T2D. Abbreviations: DEG, differentially expressed genes; GO, Gene Ontology; T2D, type 2 diabetes. |
 © 2018 The Author(s). This work is published and licensed by Dove Medical Press Limited. The
full terms of this license are available at https://www.dovepress.com/terms
and incorporate the Creative Commons Attribution
- Non Commercial (unported, 3.0) License.
By accessing the work you hereby accept the Terms. Non-commercial uses of the work are permitted
without any further permission from Dove Medical Press Limited, provided the work is properly
attributed. For permission for commercial use of this work, please see paragraphs 4.2 and 5 of our Terms.
© 2018 The Author(s). This work is published and licensed by Dove Medical Press Limited. The
full terms of this license are available at https://www.dovepress.com/terms
and incorporate the Creative Commons Attribution
- Non Commercial (unported, 3.0) License.
By accessing the work you hereby accept the Terms. Non-commercial uses of the work are permitted
without any further permission from Dove Medical Press Limited, provided the work is properly
attributed. For permission for commercial use of this work, please see paragraphs 4.2 and 5 of our Terms.