Back to Journals » Cancer Management and Research » Volume 11
Identification of hub genes and key pathways associated with angioimmunoblastic T-cell lymphoma using weighted gene co-expression network analysis
Authors Li X ![]() , Liu Z
, Liu Z ![]() , Mi M
, Mi M ![]() , Zhang C
, Zhang C ![]() , Xiao Y
, Xiao Y ![]() , Liu X, Wu G, Zhang L
, Liu X, Wu G, Zhang L ![]()
Received 23 August 2018
Accepted for publication 11 May 2019
Published 6 June 2019 Volume 2019:11 Pages 5209—5220
DOI https://doi.org/10.2147/CMAR.S185030
Checked for plagiarism Yes
Review by Single anonymous peer review
Peer reviewer comments 2
Editor who approved publication: Dr Rituraj Purohit
Xiaoqian Li,* Zijian Liu,* Mi Mi, Caijiao Zhang, Yin Xiao, Xinxiu Liu, Gang Wu, Liling Zhang
Cancer Center, Union Hospital, Tongji Medical College, Huazhong University of Science and Technology, Wuhan, People’s Republic of China
*These authors contributed equally to this work
Background: Angioimmunoblastic T-cell lymphoma (AITL) is an aggressive subtype of peripheral T-cell lymphoma (PTCL) that has a poor 5-year overall survival rate due to its lack of precise therapeutic targets. Identifying potential prognostic markers of AITL may provide information regarding the development of precision medicine.
Methods: RNA sequence data from PTCL and patient clinic traits were obtained from the Gene Expression Omnibus (GEO) database. Differentially expressed gene (DEG) analysis and weighted gene co-expression network analysis (WGCNA) were performed to identify DEGs between the different PTCL subtypes and investigate the relationship underlying co-expression modules and clinic traits. Gene ontology (GO) and protein–protein interaction (PPI) network analyses based on DAVID and the STRING website, respectively, were utilized to deeply excavate hub genes.
Results: After removing the outliers from the GSE65823, GSE58445, GSE19069, and GSE6338 datasets using the results from an unsupervised cluster heatmap, 50 AITL samples and 55 anaplastic large cell lymphoma (ALCL) samples were screened. A total of 677 upregulated DEGs and 237 downregulated DEGs were identified in AITL and used to construct a PPI network complex. Using WGCNA, 12 identified co-expression modules were constructed from the 5468 genes with the top 10% of variance, and 192 genes from the Turquoise and Brown modules were with a Gene Significance (GS) cut-off threshold >0.6. Eleven hub genes (CDH1, LAT, LPAR1, CXCL13, CD27, ICAM2, CD3E, CCL19, CTLA-4, CXCR5, and C3) were identified. Only CTLA-4 overexpressed was found to be a poor prognostic factor according to survival analysis. Gene set enrichment analysis (GSEA) identified and validated the intersection of key pathways (T cell receptor, primary immunodeficiency, and chemokine signaling pathways).
Conclusion: Our findings provide the framework for the identification of AITL co-expression gene modules and identify key pathways and driving genes that may be novel treatment targets and helpful for the development of a prognostic evaluation index.
Keywords: peripheral T-cell lymphoma, angioimmunoblastic T-cell lymphoma, bioinformatics analysis, weighted gene co-expression network analysis
Introduction
Peripheral T-cell lymphoma (PTCL) is a heterogeneous group of generally aggressive lymphoid malignancies and clinically and biologically heterogeneous lymphoproliferative disorders that develop in mature blood cells called “T cells” and natural killer (NK) cells that account for 15–20% of all non-Hodgkin lymphomas on the Asian continent.1,2 Angioimmunoblastic T-cell lymphoma (AITL) and anaplastic large cell lymphoma (ALCL) are two distinct subtypes of PTCL. AITL represents 15–20% of all PTCLs.3 The 5-year overall survival rate of AITL is only 25–41%.4 The finding of inappropriate co-stimulation and aberrant DNA methylation has resulted in a multistep tumorigenesis model for AITL that provides us with a theoretical framework for AITL oncogenesis, which may provide new therapeutic options for AITL treatment.5 ALCL refers to a group of CD30-positive T-cell non-Hodgkin lymphomas that have a better prognosis compared to AITL. Treatment with an anthracycline-containing regimen promotes different outcomes for AITL and ALCL. The 5-year failure-free survival (FFS) is 12% for AITL, 60% for ALK-positive ALCL, and 36% for ALK-negative ALCL. In contrast, the 5-year OS for AITL is 14%, but it is 70% for ALK-positive ALCL and 49% for ALK-negative ALCL.2 Given these statistics, uncovering the molecular mechanisms of the two subtypes and identifying molecular biomarkers will be helpful for the correct diagnosis.
The wealth of molecular information from genomic technologies, such as The Cancer Genome Atlas, Gene Expression Omnibus (GEO) database, and ArrayExpress, provide a remarkable opportunity for new target discovery.6 Integration and re-analysis of data deposited and stored in public databases can provide valuable clues for new research. Based on the combination of bioinformatics methods with expression profiling, we can identify tissue-specific biomarkers and key-related pathways.
In this study, we have downloaded four original microarray datasets (GSE65823, GSE58445, GSE19069, and GSE6338) from the NCBI-Gene Expression Omnibus database (NCBI-GEO). We selected 50 AITL cases and 55 ALCL cases from these 4 datasets. We used the R package to analyze the differentially expressed genes (DEGs); performed Gene Ontology (GO) and pathway enrichment analysis to screen the DEGs with the Database for Annotation, Visualization and Integrated Discovery (DAVID) website; integrated the DEGs into a protein–protein interaction (PPI) network and performed modular analysis using the STRING database and Cytoscape software to identify hub genes. Subsequently, Weighted Correlation Network Analysis (WGCNA) was performed with the WGCNA package. Eventually, gene set enrichment analysis was performed to verify the analysis of the DEGs and WGCNA described earlier, which will give us deeper understanding of AITL and ALCL.
Materials and methods
Microarray information and DEG identification
GEO is a free public functional genomics data repository containing array- and sequence-based data. We obtained four series (GSE65823, GSE58445, GSE19069, and GSE6338), which were based on the GPL570 platform ([HG-U133_Plus_2] Affymetrix Human Genome U133 Plus 2.0 Array, Santa Clara, CA, USA). A total of 55 ALCL cases and 50 AITL cases were included in these datasets. We chose these four datasets for our integrated analysis in this study because these datasets, which include both AITL and ALCL subtypes, were generated from the same sequencing platform. Thus, we could integrate these datasets in our subsequent processing steps.
The Robust Multi-array Average (RMA) algorithm in the affy Bioconductor package was utilized to analyze the raw data to construct the expression matrix profile,7 including background correction, quantile normalization, and probe summarization. The linear models for microarray data (LIMMA) package in Bioconductor were applied to mine statistically significant DEGs based on differences in their expression between the AITL and ALCL subtype samples.8 After performing the Student's t-test, we defined a P-value <0.01 and a |log2FC (fold change)| ≥1 as the cut-off criteria. Next, we removed the outliers based on the results from an unsupervised cluster heatmap to build the expression matrix profile for subsequent analysis. Principal component analysis (PCA) was performed so that we could conduct dimensional reduction analysis with the purpose of providing a visual data feature. All of the above operations were run with scripts in R.
GO terms and PPI network, key genes, and pathway analysis
The DEGs were input into the DAVID database (
The STRING (Search Tool for Retrieval of Interacting Genes/Proteins,
Weighted gene co-expression network analysis (WGCNA)
An RNA sequence data expression matrix profile processed by unified disposal was produced by several DEG screening procedures for the subsequent co-expression network construction. The clinical traits were classified into two subtypes, AITL and ALCL, with the purpose of constructing module–trait relationships. Sample clustering was used to detect outliers and match the samples with their characteristics. The soft thresholding power was set as 7 for subsequent co-expression module establishment. Module–trait associations were applied to detect the co-expression module with the highest correlation with the clinical phenotype. For each expression profile, the gene significance (GS) and module membership (MM) were defined as the correlation value for each trait and each module eigengene, respectively. All the intersection analyses were performed online and the WGCNA algorithm was screened using R.13
Gene set enrichment analysis (GSEA)
GSEA is a computational method that assesses whether an a priori defined set of genes shows statistical significance or concordant differences between two biological states.14 The method uses the GSEA framework and considers a published DEG as a pathway or gene set to quantify how well the up- and downregulated genes rank by fold change for all genes in a data. If the majority of a gene set exhibits high expression accompanied by a high risk score, the gene set will present a positive enrichment score and will be referred to as ‘enriched’.15 GSEA was downloaded from GSEA HOME and run in a Java environment. Significant gene sets with an FDR <25% and a nominal P-value <0.05 were identified. GSEA was conducted between AITL and ALCL subtypes.
Survival analysis
The key genes were identified as intersecting between the Turquoise and Brown modules from the WGCNA and DEGs. We also collected the survival time of the patients in our study based on the information provided from the GSE58445 GEO database. Then, ROC analysis was performed on continuous variables to determine optimal cut-off values. The effect of individual parameters on the OS was studied with Kaplan–Meier (KM) survival analysis using dichotomous grouping based on the ROC analysis. The data were analyzed using the SPSS software (IBM SPSS Statistics for Windows, Version 22.0.) and a P-value <0.05 was considered statistically significant.
Results
Identification of DEGs between the AITL and ALCL subtypes and DEG enrichment analysis
In total, 914 DEGs were obtained after removing the batch differences and performing data normalization, including 677 upregulated and 237 downregulated DEGs in AITL based on the cut-off criteria (P<0.05 and |logFC|>1). All the aberrantly expressed genes with log2 FC score and –log10 P-values were used to generate a Volcano plot in R, which is a visual tool for showing the overall gene expression levels of the DEGs (Figure 1A). The hierarchical cluster analysis of the post-treatment data demonstrated that the DEGs accurately distinguished the AITL samples from the ALCL samples (Figure 1B). The principal component analysis was utilized for a dimension reduction process to visualize the spatial distribution of the samples, which determined whether there were two distinct groups (Figure 1C).
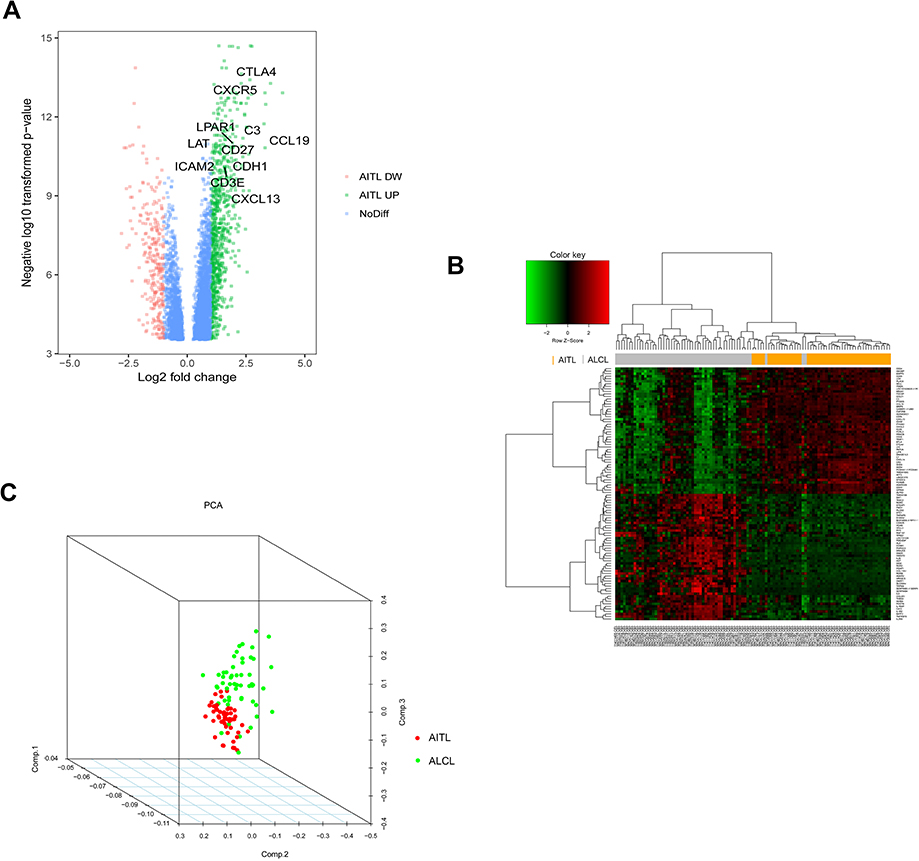 | Figure 1 DEG visualization analysis. (A) Volcano plot of the differentially expressed genes between the AITL and ALCL subtypes; the hub genes are obviously marked. (B) Heatmap of the top 100 DEGs with the highest fold change in R. (C) Dimensionality reduction analysis was performed on the data through PCA to examine the enrichment levels of different samples. Abbreviations: AITL, angioimmunoblastic T-cell lymphoma; ALCL, anaplastic large cell lymphoma; DEG, differentially expressed genes; PCA, principal component analysis; DW, down; NoDiff, no significant difference. |
In the GO analysis, the upregulated genes associated with AITL significantly enriched for protein binding, plasma membrane, and integral component of membrane. The downregulated genes significantly enriched for integral component of membrane, plasma membrane, and extracellular region (Figure 2A–C). In the KEGG analysis, the upregulated genes were mainly enriched for cytokine–cytokine receptor interaction, T-cell receptor signaling pathway, and chemokine signaling pathway (Figure 2D). Only a small fraction of the genes extracted from the downregulated AITL genes were mainly enriched for PI3K-Akt signaling pathway, focal adhesion, and ECM–receptor interaction. The significantly enriched terms and pathways may help us further investigate the role that the DEGs play in AITL.
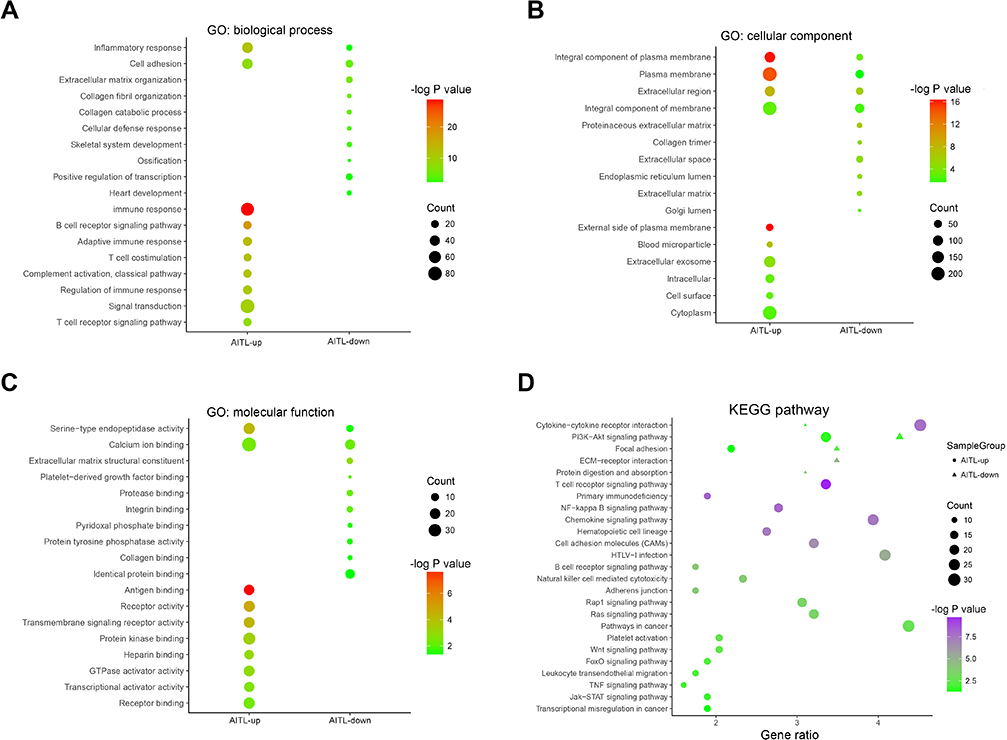 | Figure 2 DEG GO and KEGG pathway enrichment. (A) GO enrichment of Biological process with the DEGs. (B) GO enrichment of Cellular component with the DEGs. (C) GO enrichment of Molecular function with the DEGs. (D) KEGG pathway enrichment using the DEGs. Abbreviations: GO, gene ontology; DEG, differentially expressed gene; KEGG, Kyoto encyclopedia of genes and genomes. |
Co-expression network construction
After removing the batch effect, we analyzed the data with WGCNA to identify the modules containing highly correlated genes. Using sample clustering to detect outliers (Figure 3A) and setting the power at 7, 12 modules were excavated (Figure 3B). We then constructed a co-expression network to detect genes within the same module that displayed similar trends (Figure 4A). Among the modules, the Turquoise and Brown modules were the most relevant for AITL (Figure 4B); thus, 1,000 genes were selected at random for the heatmap (Figure 4C). The eigengene dendrogram and heatmap were used to identify groups of correlated eigengenes, and the dendrogram indicated the modules that were significantly associated with PTCL clinical phenotypes (Figure 4D). We next performed an intramodular analysis of the GS and MM for the genes in the 12 modules. The GS and MM showed a very significant correlation, indicating that the genes in the Turquoise module tend to be highly correlated with AITL and those in the Brown module tend to be highly correlated with ALCL (Figure 4E). The genes in these modules with a correlation cut-off ≥0.6 were then selected as hub genes. In total, there were 192 hub genes from the Turquoise and Brown modules that were chosen for further analysis.
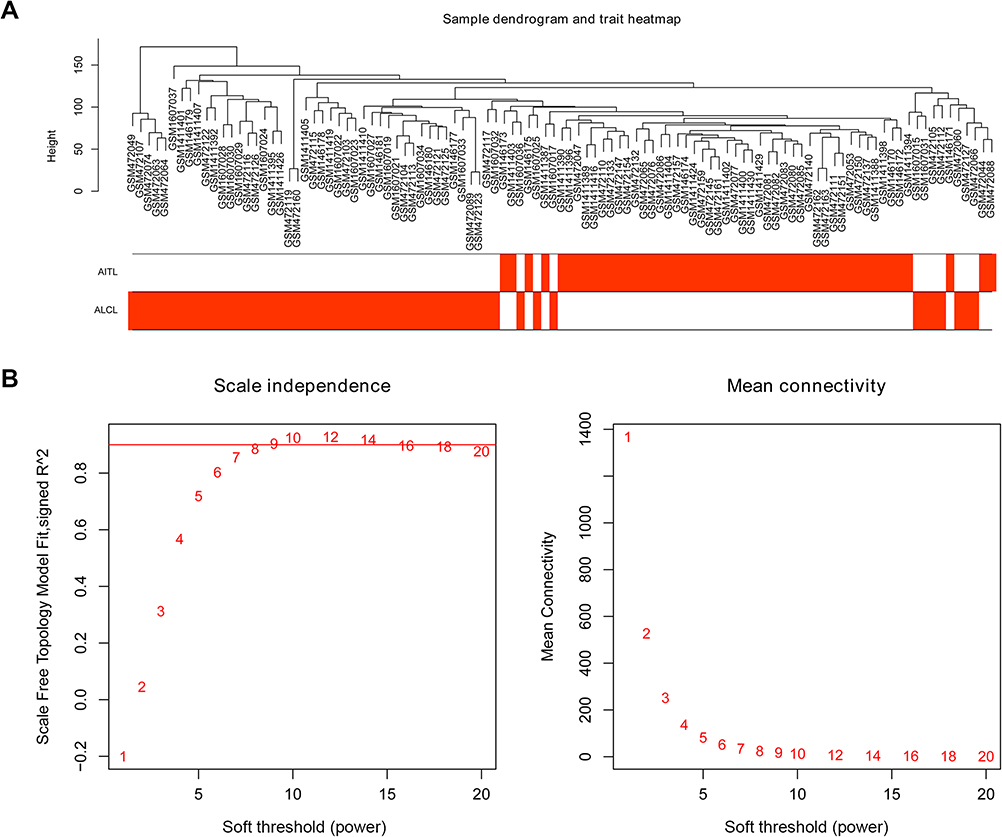 | Figure 3 Sample clustering and soft threshold screening. (A) Sample clustering to detect outliers and the trait heatmap to display the sample traits. (B) Analysis of the network topology for various soft thresholding powers. The left panel shows the scale-free fit index (y-axis) as a function of the soft-thresholding power (x-axis). The right panel displays the mean connectivity (degree, y-axis) as a function of the soft-thresholding power (x-axis). The power was set as 6 for further analysis. |
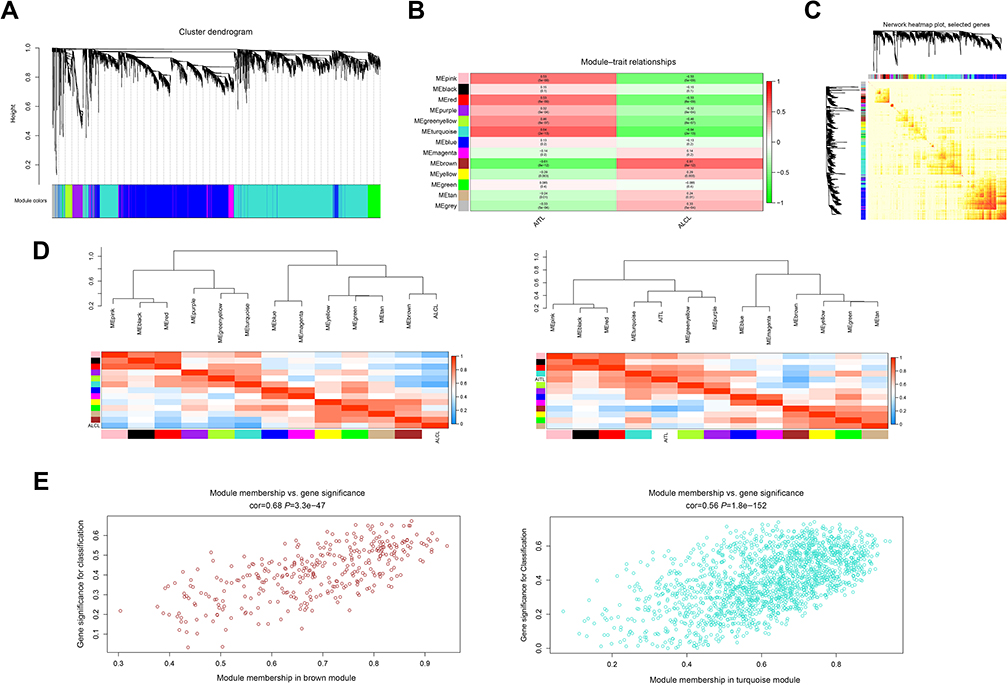 | Figure 4 WGCNA of the PTCL samples. (A) Clustering dendrograms for the 5468 genes with dissimilarity based on the topological overlap together with the assigned module colors. Twelve co-expression modules were constructed with various colors. The relationship between gene dendrogram and gene modules was up and down of the image. (B) Module–trait relationships. Each row corresponds to a module eigengene, each column corresponds to a trait, and each cell consists of the corresponding correlation and P-value, which are color-coded by correlated according to the color legend. Among them, the Brown and Turquoise modules were the most relevant modules to the PTCL clinical subtypes. (C) Visualizing 1,000 random genes from the network using a heatmap plot to depict the TOM among the genes in the analysis. The depth of the red color is positively correlated with the strength of the correlation between the pairs of modules on a linear scale. The gene dendrogram and module assignment are shown along the left side and the top. (D) The eigengene dendrogram and heatmap identify groups of correlated eigengenes termed meta-modules. The dendrogram indicated that the Turquoise module was highly related to the AITL subtype and the Brown module was highly related to the ALCL subtype. The heatmap in the panel shows the eigengene adjacency. (E) A scatter plot of the GS for the PTCL classification versus the MM in the Brown and Turquoise modules; the correlation and P-value are under the title. Abbreviations: WGCNA, weighted gene co-expression network analysis; PTCL, peripheral T-cell lymphoma; AITL, angioimmunoblastic T-cell lymphoma; ALCL, anaplastic large cell lymphoma; TOM, topological overlap matrix; GS, gene significance; MM, module membership. |
PPI network, cluster analysis, and key genes identified
Using the STRING online database, 914 DEGs were filtered into the DEG PPI network complex containing nodes and edges with parameters including a minimum required interaction score>0.4 (medium confidence) and only query proteins being displayed. The Cytoscape software was employed to analyze the interactive relationships between the candidate proteins (Figure 5A) and then two clusters containing 23 nodes and 20 nodes were selected with a cut-off k-score=12 based on the MCODE scoring system (Figure 5B and C). The data were imported into Cytoscape and the CytoHubba application was run. We observed the intersections from the five calculations methods (EPC, MCC, DMNC, MNC, and Stress) and generated a Venn plot to identify 74 significant hub genes. After running the CytoNCA application, we obtained 118 significant hub genes according to five algorithms (Subgraph, Degree, Eigenvector, Betweenness, and Closeness). The initial key genes were discovered from the top 100 genes in CytoHubba and CytoNCA. In total, 59 key genes were identified. We firmly believe that the hub genes are the intersections between the initial key genes screened from the PPI network and the two modules highly correlated with phenotypes from the WGCNA analysis (Figure 6A). We finally identified 11 hub genes (CDH1, LAT, LPAR1, CXCL13, CD27, ICAM2, CD3E, CCL19, CTLA-4, CXCR5, and C3). Pathway enrichment for these genes was performed with ClueGO, a Cytoscape plug-in (Figure 6B). Further survival analysis was performed on these key genes to evaluate their effects on PTCL survival. Following all the analyses, only CTLA-4 was clearly related to patient prognosis (P<0.05) (Figure 6C).
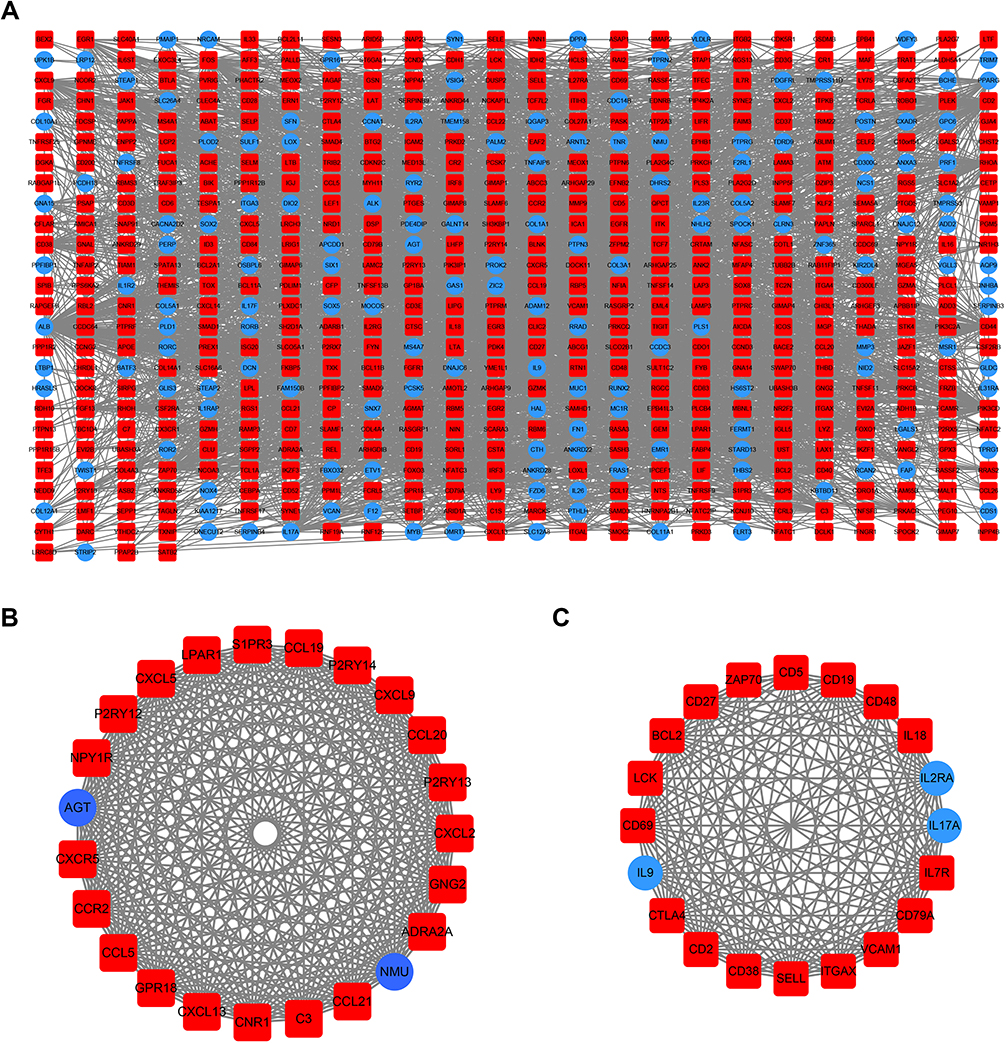 | Figure 5 PPI network cluster analysis. (A) A PPI network containing 604 nodes and 3576 edges was constructed by filtering the 914 DEGs using the STRING website. (B) Cluster 1 consists of 23 nodes and 253 edges and (C) cluster 2 consists of 20 nodes and 161 edges. These clusters had the highest scores among the clusters. The red quadrangle and blue circular nodes represent highly expressed genes in AITL and ALCL, respectively. Abbreviations: PPI, protein–protein interaction; DEG, differentially expressed gene; STRING, search tool for retrieval of interacting genes/proteins; AITL, angioimmunoblastic T-cell lymphoma; ALCL, anaplastic large cell lymphoma. |
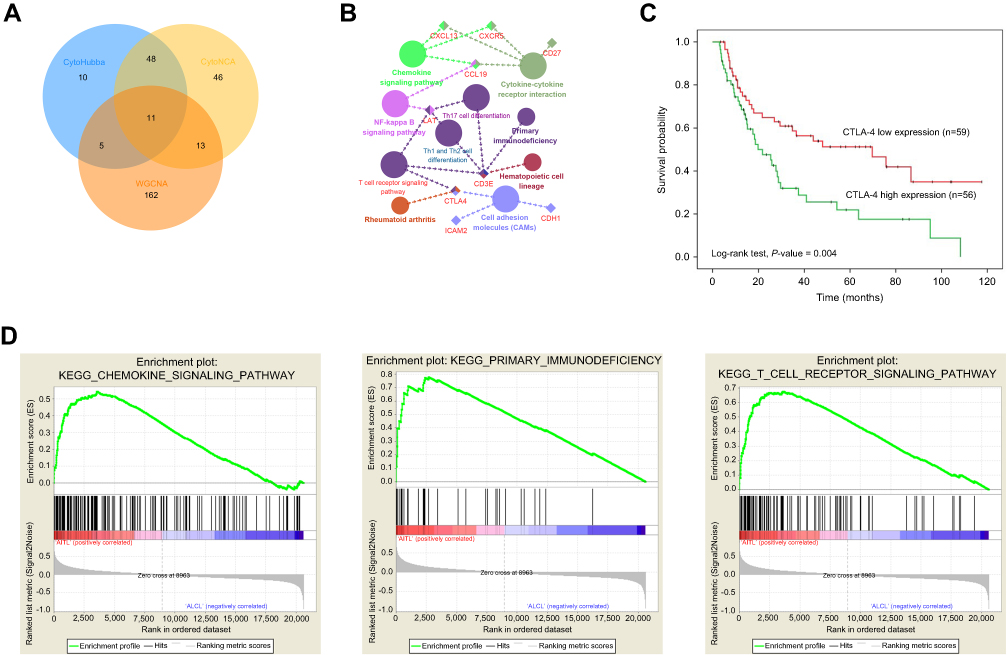 | Figure 6 Hub genes and key pathway screening and analysis. (A) A Venn diagram was utilized to screen the hub genes between the DEGs and WGCNA. (B) Enrichment analysis for pathways with the hub genes was performed in Cytoscape with the ClueGo plug-in. (C) Survival analysis indicated that CTLA-4 is a poor prognosis factor in PTCL samples. Patients with higher CTLA-4 expression have a significantly shorter overall survival compared to those with lower expression (P<0.05). (D) GSEA revealed that the T-cell receptor, primary immunodeficiency, and chemokine signaling pathways showed significant enrichment in the AITL subtype. Abbreviations: WGCNA, weighted gene co-expression network analysis; PTCL, peripheral T-cell lymphoma; GSEA, gene set enrichment analysis; AITL, angioimmunoblastic T-cell lymphoma. |
Gene set enrichment analysis
We also employed GSEA as an effective approach to identify pathways related to the differences in the AITL and ALCL subtypes. The results revealed that several pathways enriched for AITL at an FDR<25%, including T-cell receptor, primary immunodeficiency, and chemokine signaling pathway, which have been validated in the above analysis (Figure 6D). However, there was no significant enrichment for ALCL-related pathways with the same cut-off criteria. Some of the hub genes were shown in the gene sets with core enrichment for LAT, CXCL13, CD3E, and CTLA-4, which once again confirmed their importance.
Discussion
In this study, 11 hub genes and several pathways were identified by the methods of DEGs and WGCNA, all key genes were excavated and chosen for survival analysis. Interestingly, only CTLA-4 was clearly related to the prognosis of patients diagnosed with PTCL, with a P-value<0.05, which may serve as biomarker for treatment and prognosis.
As an aggressive lymphoma, PTCL represents approximately 12% of all lymphoid neoplasms. Compared with more common aggressive B-cell lymphomas, more patients with PTCL will be refractory to initial therapy, and those who achieve responses will often have a shorter progression-free survival (PFS); complete response rates of 50–70% have been previously reported.2 Five-year overall survival (OS) rates are generally below 30%.16–18 Previous studies have focused on identifying genes that could be used as prognostic factors for PTCL. ALK expression is known to greatly impact prognosis.19,20 According to the gene expression results, PTCL-NOS can be divided into two major subgroups (high GATA3 expression group and higher TBX21 (T-bet) and EOMES expression group) with significantly different outcomes. The TBX21 group [5-year OS of 38% (25–56%; 95% CI)] and GATA3 subgroup [19% (9–38%; 95% CI)] showed significant (P=0.01) differences in survival.20 According to our analysis, DEGs which cause differences in the prognosis of AITL and ALCL were filtered out. So, we could conduct prognostic evaluation of PTCL patients and even modify these DEGs to treat lymphoma in the future.
The result of GO analysis proved that the key genes mainly associated with protein binding, plasma membrane, and integral component of membrane. And after KEGG pathway analysis, the upregulated genes were also enriched for cytokine–cytokine receptor interaction, T-cell receptor signaling pathway, and chemokine signaling pathway.
Linker for activation of T cells (LAT) is a transmembrane adaptor protein that plays an essential role in linking T cell receptor (TCR) engagement to downstream signaling events, such as Ras-Erk activation and calcium mobilization.21 Upon T cell activation, LAT-mediated signaling intricately regulates CTL cytotoxicity at multiple steps.22,23 The CD3E was a T cell co-receptor complex essential for TCR signaling and T cell differentiation.24 A high complete CD3E gene copy number could block very early thymocyte and NK-cell development with or without the truncated gene that codes for the transmembrane and cytoplasmic regions.25 Both of these genes belong to T-cell receptor signaling pathway and participate in crosstalk with CTLA-4 to influence the development of T-cell lymphoma and lead to poor prognosis. In our study, these genes were highly expressed in AITL which could explain the poor prognosis of AITL.
Chemokines are a group of small, secreted molecules that signal through G protein-coupled receptors to promote cell survival and proliferation and provide directional guidance for migrating cells.26 CXCL13, CXCR5, CCL19, and CD27 were all included in cytokine–cytokine receptor interaction and chemokine signaling pathway. The chemokine CXCL13 is constitutively expressed in secondary lymphoid organs (spleen, lymph nodes, and Peyer’s patches) by FDC and macrophages.27 CXCL13 primarily acts through the G-protein-coupled CXCR5 receptor (Burkitt’s lymphoma receptor 1) expressed on mature B lymphocytes.28,29 In a previous study, CXCL13 was identified as a unique marker for AITL, as it is not expressed at significant levels in other T-cell subsets.30 Together with IL-10, these genes could be potentially important biomarkers for central nervous system lymphomas.31 High levels of CXCL13 may contribute to AIDS-NHL risk, and the levels depend on genetic variation in CXCL13 and CXCR5.32 CXCR5 is a receptor for CXCL13 and plays a role in B-cell and follicular T helper cell migration.33 A previous report indicated an association of several CXCR5 single nucleotide polymorphisms (SNPs) with NHL risk in a Chinese population. Additionally, CXCR5 has been identified as a promising target for antibody-based therapies in the treatment of B-cell malignancies.34 Several CXCR5 polymorphisms are related to a risk of NHL subtypes and prognosis in FL.35 So high levels of CXCL13 and CXCR5 might be one of the reasons for the poor prognosis of AITL. CCL19 is a CCR7 chemokine receptor ligand that is involved in the chemokine signaling pathway. Together with CCL19 and CCL21, CCR7 is involved in organizing thymic architecture and function, lymph node homing of naive and regulatory T cells via high endothelial venules, and the steady-state and inflammation-induced lymph node-bound migration of dendritic cells via afferent lymphatics.36 CD27, a member of the TNF receptor superfamily, is a type I transmembrane protein with extracellular, intramembranous, and intracellular domains.37 It could act as a tumor marker for NHL.38 These cytokines could play an important part in the chemokine signaling pathway to induce T-cells into tumorigenesis.
The expression of CDH1 was frequently absent in a variety of epithelial tumors, and loss of normal intercellular junctions results in the promotion of cancer invasion and metastasis and is correlated with several types of cancers.37,39,40 CDH1 mutations can be found in gastric cancer (GC). The cumulative lifetime risk of GC ranges from 40% to 67% and 63% to 83% in male and female carriers, respectively.41–43 CDH1 methylation is also associated with an increased risk of lung cancer and primary gastric diffused large B cell lymphoma.44,45 E-cadherin, the CDH1 gene product, is a calcium-dependent cell adhesion molecule that is essential for maintaining the integrity of cell-cell adhesions.46 CDH1 promoter hypermethylation was due to the loss of E-cadherin.47 A previous study indicated that CDH1 was remarkably correlated with and frequently methylated in human lymphomas, and its methylation could not be solely explained by DNA methyltransferase mRNA expression levels.48 ICAM2 is a member of the immunoglobulin superfamily that binds to β2 leukocyte integrin, and ICAM2/LFA1 interactions play a critical role in lymphocyte recirculation and trafficking, antigen-specific immune responses, and other cellular interactions important for immune response and surveillance.49,50 Decreased ICAM2 expression is associated with poor survival in patients with various cancers.51,52 So, high level of ICAM2 was a good factor for prognosis. Unfortunately, the survival between high expression and low expression of ICAM2 was not statistically different. Further researches were needed to determine the value of ICAM2. LPAR1 is a lysophosphatidic acid receptor. Previous studies have indicated that LPAR1 is the major mediator of LPA-induced ovarian cancer invasion and metastasis and a novel susceptibility gene for human essential hypertension, which increases the susceptibility of patients with a risk allele for essential hypertension.53 It also associated with metastatic neuroblastoma and lung fibrosis induced by irradiation.54,55 However, no research has shown that it is associated with lymphoma. It could be obtained that LPAR1 was a risk factor for AITL and could be verified in future research from our research. Many of these genes have never been investigated in PTCL or lymphoma, but all of them are key molecules for studying tumorigenesis, prognosis and the development of precise treatments.
CTLA-4, which is expressed exclusively on T-cells, acts as a negative co-stimulatory signal, inhibiting T-cell activation and proliferation to maintain self-tolerance and protect against autoimmunity.56 CTLA-4 is a particularly important immune checkpoint receptor and the first to be clinically targeted in oncology.57 CTLA-4 signaling has been implicated in tolerance induction in vivo and may also augment suppressor CD4+ T-cell activity, thereby downregulating the immune response.37,58,59 Blockade of CTLA-4 by administration of anti-CTLA-4 monoclonal antibodies has been shown to enhance T-cell responses in a variety of settings and enhance anti-tumor responses.37,60–62 In previous studies, CTLA-4 has been regarded as a candidate susceptibility gene for T-cell lymphoma.60 Additionally, polymorphisms in the CTLA-4 gene have been shown to have a role in the occurrence of NHL.63 However, the connection between CTLA-4 and AITL remains unclear. Considering our results and previous studies, we found that CTLA-4 was expressed higher in AITL than in other PTCL types; thus, CTLA-4 could be considered as a poor prognosis factor according to the survival analysis performed earlier.
In conclusion, the results obtained using four PTCL microarray datasets from GEO and WGCNA demonstrate that the Turquoise and Brown modules had the highest correlation with PTCL subtypes, and 11 hub genes (CDH1, LAT, LPAR1, CXCL13, CD27, ICAM2, CD3E, CCL19, CTLA-4, CXCR5, and C3) were identified. These genes were significantly enriched in several different signaling pathways, mainly associated with T cell receptor, primary immunodeficiency, and chemokine signaling pathways. Survival analysis reveals that CTLA-4 overexpression in AITL may be a poor prognosis marker. Although some of these genes were found before, our study could validate and explain the expression status of these genes and their impact on prognosis in AITL again. These findings provide the framework for the identification of AITL co-expression gene modules and identify key pathways and driving genes that may be novel treatment targets and helpful for the development of a prognostic evaluation index.
Acknowledgments
The study was supported by a grant from the National Natural Science Foundation of China (No. 81672940). We thank American Journal Experts (AJE) for English language editing.
Disclosure
The authors report no conflicts of interest in this work.
References
1. Lunning MA, Horwitz S. Treatment of peripheral T-cell lymphoma: are we data driven or driving the data? Curr Treat Option Oncol. 2013;14(2):212–223. doi:10.1007/s11864-013-0232-x
2. Vose J, Armitage J, Weisenburger D,
3. Federico M, Rudiger T, Bellei M, et al. Clinicopathologic characteristics of angioimmunoblastic T-cell lymphoma: analysis of the International Peripheral T-cell Lymphoma Project. J Clin Oncol. 2013;31(2):240–246. doi:10.1200/JCO.2011.37.3647
4. Xu B, Liu P. No survival improvement for patients with angioimmunoblastic T- cell lymphoma over the past two decades: a population-based study of 1207 cases. PLoS One. 2014;9(3):e92585. doi:10.1371/journal.pone.0092585
5. Willemsen M, Schouten HC. Inappropriate costimulation and aberrant DNA methylation as therapeutic targets in angioimmunoblastic T-cell lymphoma. Biomak Res. 2017;5:6.
6.
7. Irizarry RA, Hobbs B, Collin F, et al. Exploration, normalization, and summaries of high density oligonucleotide array probe level data. Biostatistics. 2003;4(2):249–264. doi:10.1093/biostatistics/4.2.249
8. Ritchie ME, Phipson B, Wu D, et al. limma powers differential expression analyses for RNA-sequencing and microarray studies. Nucleic Acids Res. 2015;43(7):e47. doi:10.1093/nar/gkv007
9. Yu G, Wang LG, Han Y, He QY. clusterProfiler: an R package for comparing biological themes among gene clusters. Omics. 2012;16(5):284–287. doi:10.1089/omi.2011.0118
10. Franceschini A, Szklarczyk D, Frankild S, et al. STRING v9.1: protein-protein interaction networks, with increased coverage and integration. Nucleic Acids Res. 2013;41(Database issue):D808–15. doi:10.1093/nar/gks1094
11. Doerks T, Copley RR, Schultz J, Ponting CP, Bork P. Systematic identification of novel protein domain families associated with nuclear functions. Genome Res. 2002;12(1):47–56. doi:10.1101/gr.203201
12. Bader GD, Hogue CW. An automated method for finding molecular complexes in large protein interaction networks. BMC Bioinformatics. 2003;4:2. doi:10.1186/1471-2105-4-2
13. Langfelder P, Horvath S. WGCNA: an R package for weighted correlation network analysis. BMC Bioinformatics. 2008;9:559. doi:10.1186/1471-2105-9-559
14. Subramanian A, Kuehn H, Gould J, Tamayo P, Mesirov JP. GSEA-P: a desktop application for gene set enrichment analysis. Bioinformatics. 2007;23(23):3251–3253. doi:10.1093/bioinformatics/btm369
15. Huang W, Tian Y, Dong S, et al. The long non-coding RNA SNHG3 functions as a competing endogenous RNA to promote malignant development of colorectal cancer. Oncol Rep. 2017;38(3):1402–1410. doi:10.3892/or.2017.5837
16. Gallamini A, Stelitano C, Calvi R, et al. Peripheral T-cell lymphoma unspecified (PTCL-U): a new prognostic model from aretrospective multicentric clinical study. Blood. 2004;103(7):2474–2479. doi:10.1182/blood-2003-09-3080
17. Weisenburger DD, Savage KJ, Harris NL, et al. Peripheral T-cell lymphoma, not otherwise specified: a report of 340 cases from the International Peripheral T-cell Lymphoma Project. Blood. 2011;117(12):3402–3408. doi:10.1182/blood-2010-09-310342
18. Schmitz N, Trumper L, Ziepert M, et al. Treatment and prognosis of mature T-cell and NK-cell lymphoma: an analysis of patients with T-cell lymphoma treated in studies of the German High-Grade Non-Hodgkin Lymphoma Study Group. Blood. 2010;116(18):3418–3425. doi:10.1182/blood-2010-02-270785
19. Savage KJ, Harris NL, Vose JM, et al. ALK- anaplastic large-cell lymphoma is clinically and immunophenotypically different from both ALK+ ALCL and peripheral T-cell lymphoma, not otherwise specified: report from the International Peripheral T-Cell Lymphoma Project. Blood. 2008;111(12):5496–5504. doi:10.1182/blood-2008-01-134270
20. Iqbal J, Wright G, Wang C, et al. Gene expression signatures delineate biological and prognostic subgroups in peripheral T-cell lymphoma. Blood. 2014;123(19):2915–2923. doi:10.1182/blood-2013-11-536359
21. Ou-Yang CW, Zhu M, Fuller DM, et al. Role of LAT in the granule-mediated cytotoxicity of CD8 T cells. Mol Cell Bio. 2012;32(14):2674–2684. doi:10.1128/MCB.00356-12
22. Liu SK, McGlade CJ. Gads is a novel SH2 and SH3 domain-containing adaptor protein that binds to tyrosine-phosphorylated Shc. Oncogene. 1998;17(24):3073–3082. doi:10.1038/sj.onc.1202337
23. Zhang W, Sloan-Lancaster J, Kichen J, Trible RP, Samelson LE. LAT: the ZAP-70 tyrosine kinase substrate that links T cell receptor to cellular activation. Cell. 1998;92(1):83–92.
24. Firtina S, Ng YY, Ng OH, et al. A novel pathogenic frameshift variant of CD3E gene in two T-B+ NK+ SCID patients from Turkey. Immunogenetics. 2017;69(10):653–659. doi:10.1007/s00251-017-1005-7
25. Wang B, Biron C, She J, et al. A block in both early T lymphocyte and natural killer cell development in transgenic mice with high-copy numbers of the human CD3E gene. Pro Natl Acad Sci U S A. 1994;91(20):9402–9406. doi:10.1073/pnas.91.20.9402
26. Wang J, Knaut H. Chemokine signaling in development and disease. Development. 2014;141(22):4199–4205. doi:10.1242/dev.101071
27. Klimatcheva E, Pandina T, Reilly C, et al. CXCL13 antibody for the treatment of autoimmune disorders. BMC Immunol. 2015;16:6. doi:10.1186/s12865-015-0068-1
28. Kim SJ, Ryu KJ, Hong M, Ko YH, Kim WS. The serum CXCL13 level is associated with the Glasgow Prognostic Score in extranodal NK/T-cell lymphoma patients. J Hematol Oncol. 2015;8:49. doi:10.1186/s13045-015-0142-4
29. Finch DK, Ettinger R, Karnell JL, Herbst R, Sleeman MA. Effects of CXCL13 inhibition on lymphoid follicles in models of autoimmune disease. Eur J Clin Invest. 2013;43(5):501–509. doi:10.1111/eci.12063
30. Yu H, Shahsafaei A, Dorfman DM. Germinal-center T-helper-cell markers PD-1 and CXCL13 are both expressed by neoplastic cells in angioimmunoblastic T-cell lymphoma. Am J Clin Pathol. 2009;131(1):33–41. doi:10.1309/AJCP62WRKERPXDRT
31. Rubenstein JL, Wong VS, Kadoch C, et al. CXCL13 plus interleukin 10 is highly specific for the diagnosis of CNS lymphoma. Blood. 2013;121(23):4740–4748. doi:10.1182/blood-2013-01-476333
32. Hussain SK, Zhu W, Chang SC, et al. Serum levels of the chemokine CXCL13, genetic variation in CXCL13 and its receptor CXCR5, and HIV-associated non-hodgkin B-cell lymphoma risk. Cancer Epidemiol Biomarkers Prev. 2013;22(2):295–307. doi:10.1158/1055-9965.EPI-12-1122
33. Widney DP, Gui D, Popoviciu LM, et al. Expression and function of the chemokine, CXCL13, and its receptor, CXCR5, in Aids-associated non-Hodgkin’s lymphoma. AIDS Res Treat. 2010;2010:1–9. doi:10.1155/2010/164586
34. Panjideh H, Müller G, Koch M, et al. Immunotherapy of B-cell non-Hodgkin lymphoma by targeting the chemokine receptor CXCR5 in a preclinical mouse model. Int J Cancer. 2014;135(11):2623–2632. doi:10.1002/ijc.28893
35. Charbonneau B, Wang AH, Maurer MJ, et al. CXCR5 polymorphisms in non-Hodgkin lymphoma risk and prognosis. Cancer Immunol Immunother. 2013;62(9):1475–1484. doi:10.1007/s00262-013-1452-4
36. Catusse J, Leick M, Groch M, Sickmann A. Role of the atypical chemoattractant receptor CRAM in regulating CCL19 induced CCR7 responses in B-cell chronic lymphocytic leukemia. Mol Cancer. 2010;9:297. doi:10.1186/1476-4598-9-254
37. Greenwald RJ, Boussiotis VA, Lorsbach RB, Abbas AK, Sharpe AH. CTLA-4 regulates induction of anergy in vivo. Immunity. 2001;14:145–155.
38. Bassig BA, Shu X-O, Koh W-P, et al. Soluble levels of CD27 and CD30 are associated with risk of non-Hodgkin lymphoma in three Chinese prospective cohorts. Int J Cancer. 2015;137(11):2688–2695. doi:10.1002/ijc.29637
39. Oka H, Shiozaki H, Kobayashi K, et al. Expression of E-cadherin cell adhesion molecules in human breast cancer tissues and its relationship to metastasis. Cancer Res. 1993;53(7):1696–1701.
40. Karayiannakis AJ, Syrigos KN, Chatzigianni E, et al. Aberrant E-Cadherin Expression Associated with loss of differentiation and advanced stage in human pancreatic cancer. Anticancer Res. 1998;18(6A):4177–4180.
41. Pharoah PDP, Guilford P, Caldas C. Incidence of gastric cancer and breast cancer in CDH1 (E-cadherin) mutation carriers from hereditary diffuse gastric cancer families. Gastroenterology. 2001;121(6):1348–1353.
42. Kaurah P, MacMillan A, Boyd N, et al. Founder and recurrent CDH1 mutations in families with hereditary diffuse gastric cancer. JAMA. 2007;297(21):2360–2372. doi:10.1001/jama.297.21.2360
43. Hansford S, Kaurah P, Li-Chang H, et al. Hereditary diffuse gastric cancer syndrome: CDH1 mutations and beyond. JAMA Oncol. 2015;1(1):23–32. doi:10.1001/jamaoncol.2014.168
44. Yu Q, Guo Q, Chen L, Liu S. Clinicopathological significance and potential drug targeting of CDH1 in lung cancer: a meta-analysis and literature review. Drug Des Devel Ther. 2015;9:2171–2178. doi:10.2147/DDDT.S78537
45. Jacobs G, Hellmig S, Huse K, et al. Polymorphisms in the 3ʹ-untranslated region of the CDH1 gene are a risk factor for primary gastric diffuse large B-cell lymphoma. Haematologica. 2011;96(7):987–995. doi:10.3324/haematol.2010.033126
46. Strathdee G. Epigenetic versus genetic alterations in the inactivation of E-cadherin. Semin Cancer Biol. 2002;12(5):373–379.
47. Rodriguez FJ, Lewis-Tuffin LJ, Anastasiadis PZ. E-cadherin’s dark side: possible role in tumor progression. Biochim Biophys Acta. 2012;1826(1):23–31. doi:10.1016/j.bbcan.2012.03.002
48. Alkebsi L, Handa H, Yokohama A, Saitoh T, Tsukamoto N, Murakami H. Chromosome 16q genes CDH1, CDH13 and ADAMTS18 are correlated and frequently methylated in human lymphoma. Oncol Lett. 2016;12(5):3523–3530. doi:10.3892/ol.2016.5116
49. Lyck R, Enzmann G. The physiological roles of ICAM-1 and ICAM-2 in neutrophil migration into tissues. Curr Opin Hematol. 2015;22(1):53–59. doi:10.1097/MOH.0000000000000103
50. Yoon KJ, Miller AL, Kreitzburg KM. The role of ICAM-2 in neuroblastoma. Oncoscience. 2015;2(11):915–916. doi:10.18632/oncoscience.273
51. Ishigami T, Uzawa K, Fushimi K, et al. Inhibition of ICAM2 induces radiosensitisation in oral squamous cell carcinoma cells. Br J Cancer. 2008;98(8):1357–1365. doi:10.1038/sj.bjc.6604290
52. Hiraoka N, Yamazaki-Itoh R, Ino Y, et al. CXCL17 and ICAM2 are associated with a potential anti-tumor immune response in early intraepithelial stages of human pancreatic carcinogenesis. Gastroenterology. 2011;140(1):310–321. doi:10.1053/j.gastro.2010.10.009
53. Xu K, Ma L, Li Y, et al. Genetic and functional evidence supports LPAR1 as a susceptibility gene for hypertension. Hypertension. 2015;66(3):641–646. doi:10.1161/HYPERTENSIONAHA.115.05515
54. Gan L, Xue JX, Li X, et al. Blockade of lysophosphatidic acid receptors LPAR1/3 ameliorates lung fibrosis induced by irradiation. Biochem Biophys Res Commun. 2011;409(1):7–13. doi:10.1016/j.bbrc.2011.04.084
55. Wei JS, Johansson P, Chen L, et al. Massively parallel sequencing reveals an accumulation of de novo mutations and an activating mutation of LPAR1 in a patient with metastatic neuroblastoma. PLoS One. 2013;8(10):e77731. doi:10.1371/journal.pone.0077731
56. Avogadri F, Yuan J, Yang A, Schaer D, Wolchok JD. Modulation of CTLA-4 and GITR for cancer immunotherapy. Curr Top Microbiol Immunol. 2011;344:211–244. doi:10.1007/82_2010_49
57. Bertrand A, Kostine M, Barnetche T, Truchetet ME, Schaeverbeke T. Immune related adverse events associated with anti-CTLA-4 antibodies: systematic review and meta-analysis. BMC Med. 2015;13:211. doi:10.1186/s12916-015-0455-8
58. McCoy KD, Le Gros G. The role of CTLA-4 in the regulation of T cell immune responses. Immunol Cell Biol. 1999;77(1):1–10. doi:10.1046/j.1440-1711.1999.00795.x
59. Eager TN, Karandikar NJ, Bluestone JA, et al. The role of CTLA-4 in induction and maintenance of peripheral T cell tolerance. Eur J Immunol. 2002;32(4):972–981. doi:10.1002/1521-4141(200204)32:4<972::AID-IMMU972>3.0.CO;2-M
60. Leach DR, Krummel MF, Allison JP. Enhancement of antitumor immunity by CTLA-4 blockade. Science. 1996;271(5256):1734–1736.
61. Yang YF, Zou JP, Mu J, et al. Enhanced induction of antitumor T-Cell Responses by cytotoxic T lymphocyte associated molecule-4 blockade: the effect is manifested only at the restricted tumor-bearing stages. Cancer Res. 1997;57(18):4036–4041.
62. Sotomayor EM, Borrello I, Tubb E, Allison JP, Levitsky HI. In vivo blockade of CTLA-4 enhances the priming of responsive T cells but fails to prevent the induction of tumor antigen-specific tolerance. Proc Natl Acad Sci U S A. 1999;96(20):11476–11481. doi:10.1073/pnas.96.20.11476
63. Monne M, Piras G, Palmas A, et al. Cytotoxic T-lymphocyte antigen-4 (CTLA-4) gene polymorphism and susceptibility to non-Hodgkin’s lymphoma. Am J Hematol. 2004;76(1):14–18. doi:10.1002/ajh.20045
 © 2019 The Author(s). This work is published and licensed by Dove Medical Press Limited. The
full terms of this license are available at https://www.dovepress.com/terms
and incorporate the Creative Commons Attribution
- Non Commercial (unported, 3.0) License.
By accessing the work you hereby accept the Terms. Non-commercial uses of the work are permitted
without any further permission from Dove Medical Press Limited, provided the work is properly
attributed. For permission for commercial use of this work, please see paragraphs 4.2 and 5 of our Terms.
© 2019 The Author(s). This work is published and licensed by Dove Medical Press Limited. The
full terms of this license are available at https://www.dovepress.com/terms
and incorporate the Creative Commons Attribution
- Non Commercial (unported, 3.0) License.
By accessing the work you hereby accept the Terms. Non-commercial uses of the work are permitted
without any further permission from Dove Medical Press Limited, provided the work is properly
attributed. For permission for commercial use of this work, please see paragraphs 4.2 and 5 of our Terms.