Back to Journals » OncoTargets and Therapy » Volume 11
Identification of genomic expression differences between right-sided and left-sided colon cancer based on bioinformatics analysis
Authors Peng Q ![]() , Lin K, Chang T, Zou L, Xing P, Shen Y, Zhu Y
, Lin K, Chang T, Zou L, Xing P, Shen Y, Zhu Y
Received 16 October 2017
Accepted for publication 4 January 2018
Published 31 January 2018 Volume 2018:11 Pages 609—618
DOI https://doi.org/10.2147/OTT.S154207
Checked for plagiarism Yes
Review by Single anonymous peer review
Peer reviewer comments 3
Editor who approved publication: Dr Yao Dai
Qiliang Peng,1–3,* Kaisu Lin,4,* Tao Chang,5 Li Zou,1–3 Pengfei Xing,1–3 Yuntian Shen,1–3 Yaqun Zhu1–3
1Department of Radiotherapy & Oncology, The Second Affiliated Hospital of Soochow University, Suzhou, 2Institute of Radiotherapy & Oncology, Soochow University, Suzhou, 3Suzhou Key Laboratory for Radiation Oncology, Suzhou, 4Department of Oncology, Nantong Rich Hospital, Nantong, 5Department of General Surgery, The Sixth People’s Hospital of Kunshan, Kunshan, People’s Republic of China
*These authors contributed equally to this work
Introduction: More and more findings have demonstrated that right-sided colon cancers (RCC) and left-sided colon cancers (LCC) are distinct clinical and biological entities and suggest that they should be treated as different diseases. However, the reasons why RCC and LCC harbor different clinical and biological features remain unclear.
Materials and methods: To identify the genomic expression differences between RCC and LCC and uncover the mechanisms underlying these differences, we chose the gene expression profiles of GSE14333 from the Gene Expression Omnibus (GEO) database as an object of study. Then, a systematic and integrative bioinformatics analysis was performed to research the possible mechanism of the differentially expressed (DE) genes from the Gene Expression Omnibus dataset including gene ontology (GO) analysis, pathway enrichment analysis, protein–protein interaction (PPI) network construction, and module analysis. Totally, we extracted 3,793 DE genes from samples of colon cancer including 1,961 genes upregulated in RCC and 1,832 genes upregulated in LCC from the selected dataset.
Results: The results of GO and pathway enrichment analysis indicated that RCC and LCC could predispose to different pathways regulated by different genes. Based on the PPI network, PCNA, TP53, HSP90AA1, CSNK2A1, UBB, LRRK2, ABL1, PRKACA, CAV1, and JUN were identified as the key hub genes. Also, significant modules were screened from the PPI network.
Conclusion: In conclusion, the present study indicated that the identified genes and pathways may promote new insights into the underlying molecular mechanisms contributing to the difference between RCC and LCC and might be used as specific therapeutic targets and prognostic markers for the personalized treatment of RCC and LCC.
Keywords: colon cancer, location, differentially expressed genes, bioinformatics analysis
Introduction
Colon cancer is one of the most commonly diagnosed malignancies and a major cause of cancer-related death all around the world.1 Despite great achievements in the diagnosis and treatment techniques in recent years, the mortality of colon cancer remains high.2 Up to date, accumulating evidence has demonstrated that right-sided colon cancers (RCC) and left-sided colon cancers (LCC) differ in terms of embryological origins, physiology, and pathology.3 It has previously been proposed that RCC and LCC should be treated as different diseases for different drug sensitivities, different therapeutic efficacies, and thus different prognoses.4 Therefore, consideration of the location of colon cancer would help in proceeding with improved diagnosis, prognosis, treatment adjustment, as well as therapeutic assessment.
While extensive research has been conducted on the clinical features regarding RCC and LCC, there has been little progress in uncovering the precise mechanisms at the molecular level underlying RCC and LCC progression, which may limit the ability of therapeutic strategy adjustment. Recent evidence suggests that the mechanism underlying the different clinical outcomes between RCC and LCC may be associated with genomic determinants. Previous studies have identified that several genes play a vital role in the occurrence and development of RCC and LCC, respectively, and are involved in some important pathways.5 A study evaluating relevant altered genes in colon cancer has identified different pathways accounting for relapse in RCC and LCC.6 Despite the progress achieved, the potential molecular mechanism is still poorly understood. Consequently, there is a great need to explore the distinct molecular subtypes of colon cancer including the key mRNA biomarkers and corresponding pathways.
In our study, we aimed to explore and predict the potential mechanism in RCC and LCC with the use of several bioinformatic approaches. By way of analyzing the gene expression microarray data and constructing the protein–protein interaction (PPI) network, we would like to explore some candidate genes with a differential expression between RCC and LCC and provide potential biomarkers for RCC and LCC regarding the diagnosis, prognosis, and drug targets. After the biological functions and the related signaling pathways were evaluated by an integrated bioinformatic analysis, the findings from our analysis may provide further insight into the establishment and progression of RCC and LCC.
Materials and methods
Data collection
The microarray data (GSE14333) were retrieved from the public database National Center for Biotechnology Information Gene Expression Omnibus.7 GSE14333 was based on the GPL570 platform, which is determined by Affymetrix Human Genome U133Plus 2.0 arrays. We only evaluated the genome expression data with clinical data of the patients provided by the submitter. Finally, we selected the data consist of 101 RCC patients and 93 LCC patients, which were part of GSE14333.
Differential expression analysis
Normalized gene expression data were downloaded as the direct form for further analysis, and the dataset contained the expression information of 23,495 mRNAs. The differential expression analysis was carried out on the basis of Student’s t-test in the Limma R package. The P-value of <0.05 was regarded as the cutoff value of statistical significance.
Gene ontology (GO) and pathway enrichment analysis
The GO analysis was conducted to assess the differentially expressed (DE) genes between RCC and LCC at the functional level.8 The Kyoto Encyclopedia of Genes and Genomes (KEGG) pathway enrichment analysis was carried out to explore the further cellular function and molecular function (MF) of the DE genes.9 In this study, we mapped the DE genes between RCC and LCC to the Database for Annotation, Visualization and Integrated Discovery (DAVID) and accomplished the enrichment analysis including GO and KEGG analyses.10 We selected the top significantly enriched items and confirmed their correlations with the genomic differences by a thorough search in PubMed.
PPI network construction and module analysis
Search Tool for the Retrieval of Interacting Genes (STRING) database is one of the most powerful tools for the PPI investigation.11 This online tool has been updated to Version 10.0 with 9,643,763 proteins from 2,031 organisms. STRING is a database of experimentally validated and computationally predicted PPI information. Based on STRING, only the known interactions proved by biological experiments with a combined score of >0.4 were retrieved as significant items for further analysis. The Cytoscape software is a powerful tool for providing a unified conceptual framework by the integration of biomolecular interaction networks.12 In the study, we used the plug-in Molecular Complex Detection (MCODE) of Cytoscape to identify the most significant module in the PPI network. Then, the function and pathway enrichment analyses were conducted with the DE genes in the selected module. In the present analysis, P-value <0.05 was considered as statistically significant.
Results
Patient characteristics
As mentioned earlier, we concentrated on the RCC and LCC samples with the clinical data available in GSE14333. The data we used contained information of 101 RCC patients and 93 LCC patients. The detailed information for the patients included in our study is listed in Table 1.
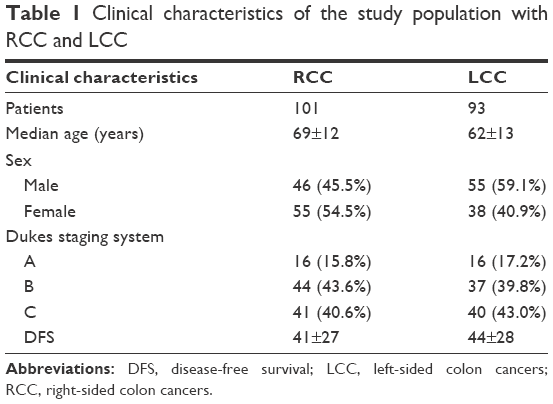 | Table 1 Clinical characteristics of the study population with RCC and LCC |
As shown in Table 1, it was revealed that tumor location may be related to age (P<0.001). Meanwhile, there does not seem to be any prognosis differences between LCC patients and RCC patients as far as disease-free survival (DFS) as the P-value was calculated at 0.23 (>0.05).
Identification of DE genes
Based on the Limma R package, a total of 3,793 genes were identified to differentially express between RCC and LCC patients (P-value <0.05), of which 1,961 genes were upregulated and 1,832 genes were downregulated in RCC compared with LCC. The top 50 upregulated DE genes in RCC and LCC are presented at Table 2.
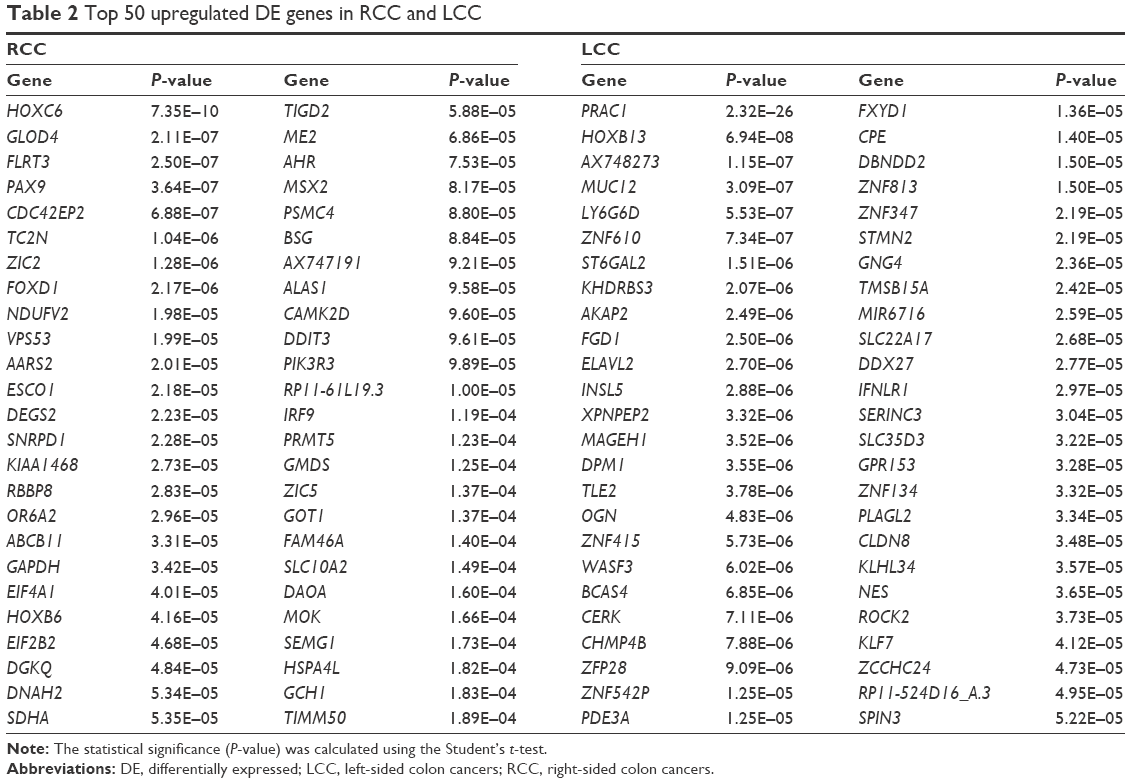 | Table 2 Top 50 upregulated DE genes in RCC and LCC |
GO enrichment analysis
GO analysis is a common useful annotating method for systematically evaluating the characteristic biological attributes of genes and gene products from all organisms. We performed the GO analysis by separately mapping the DE genes in RCC and LCC to the online software DAVID at the following three different GO levels: MF, cell component (CC), and biological processes (BP). The top 10 items that were significantly enriched by the DE genes at each of the above GO levels are outlined in Figure 1.
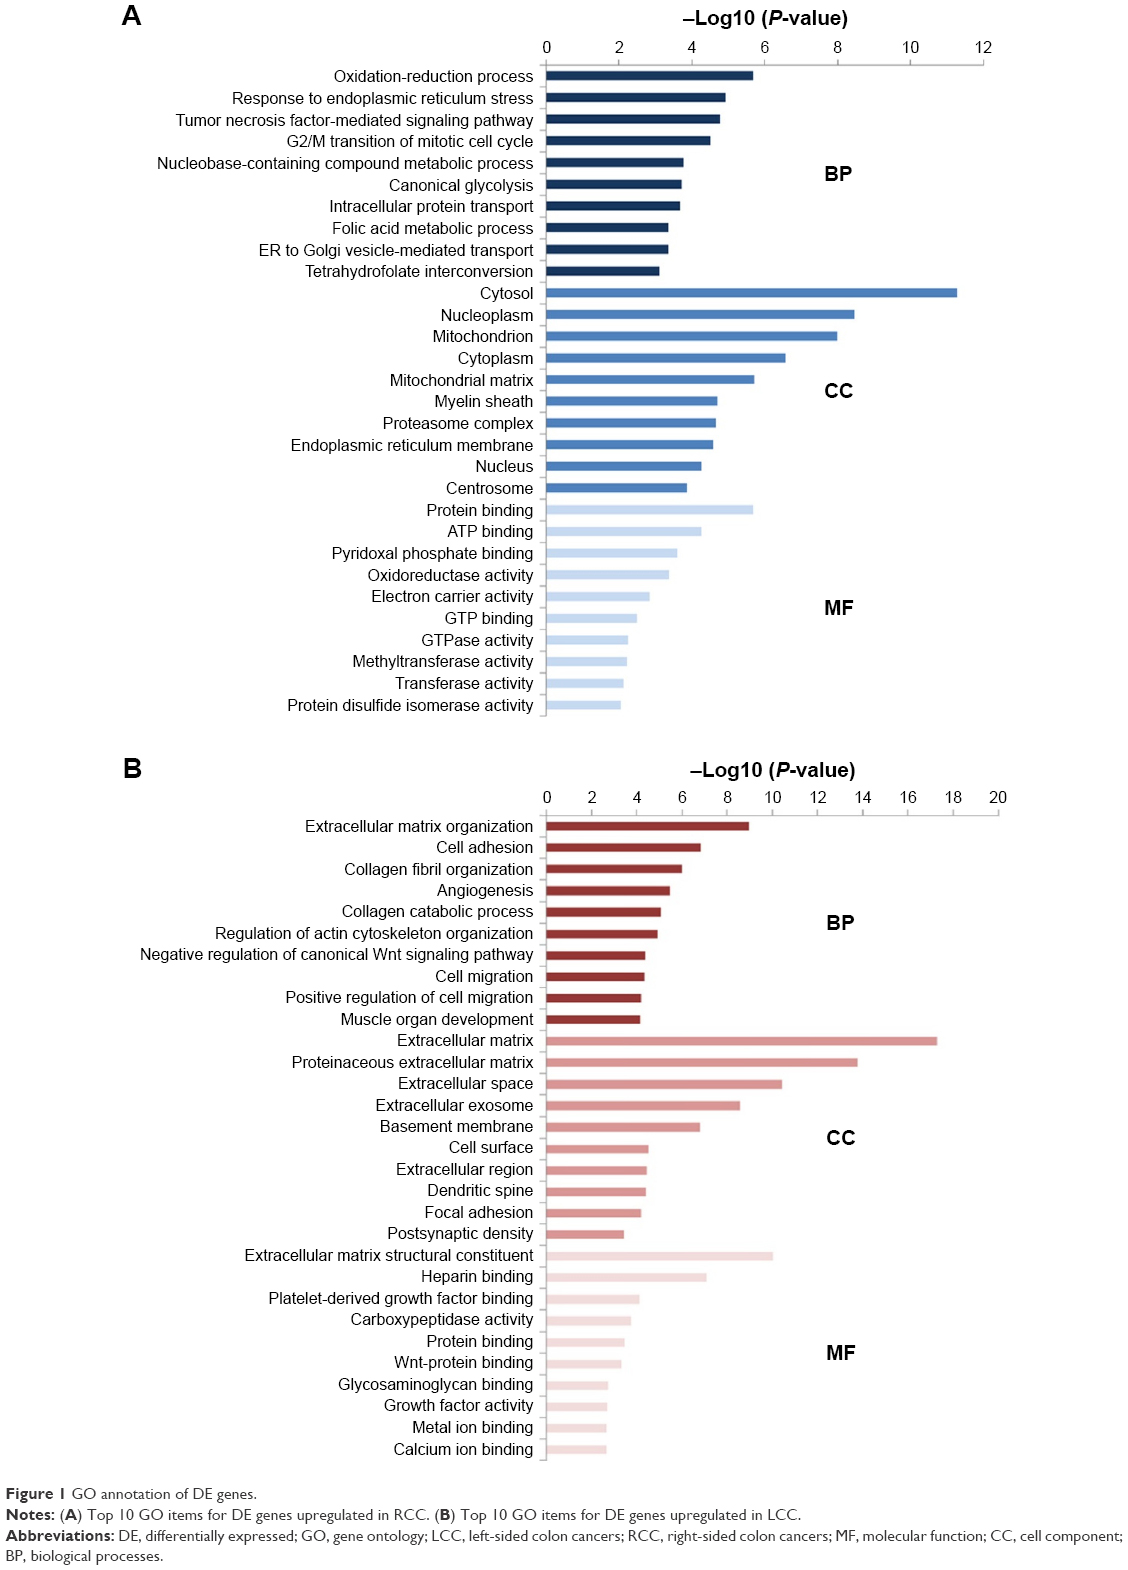 | Figure 1 GO annotation of DE genes. |
The enriched GO terms in BP for RCC mainly included the process of biosynthesis and metabolism, while the enriched GO terms in BP for LCC were associated with cell adhesion, angiogenesis, collagen catabolic process, and regulation of canonical Wnt signaling pathway. For the CC items, the upregulated DE genes in RCC were enriched in the hallmarks of a cell such as cytosol, nucleoplasm, cytoplasm, and nucleus and the upregulated DE genes in LCC were enriched in extracellular components including extracellular matrix, proteinaceous extracellular matrix, extracellular space, and extracellular exosome. Most GO MF items for RCC converged on the enzymes’ metabolic processes and energy metabolism such as protein binding, ATP binding, oxidoreductase activity, electron carrier activity, GTP binding, and GTPase activity, while most GO MF items for LCC were related to biological combination processes, for instance, heparin binding, protein binding, Wnt–protein binding, and calcium ion binding. The GO annotation results revealed the differences between LCC and RCC to a certain extent.
KEGG pathway enrichment analysis
KEGG pathway analyses were conducted by DAVID on the whole upregulated DE genes of RCC and LCC, respectively. The top 15 significantly enriched signaling pathways of RCC and LCC are illustrated in Figure 2. The upregulated DE genes in RCC were enriched in biosynthesis and metabolism pathways (glycolysis/gluconeogenesis, fructose and mannose metabolism, carbon metabolism, biosynthesis of amino acids, and so on), proteasomes, cell cycle, and RNA transport, while the upregulated DE genes in LCC were enriched in protein digestion and absorption, pathways in cancer, ECM–receptor interaction, vascular smooth muscle contraction, and several important signaling pathways including PI3K–Akt, Ras, Wnt, cGMP–PKG, calcium, and cAMP signaling pathways.
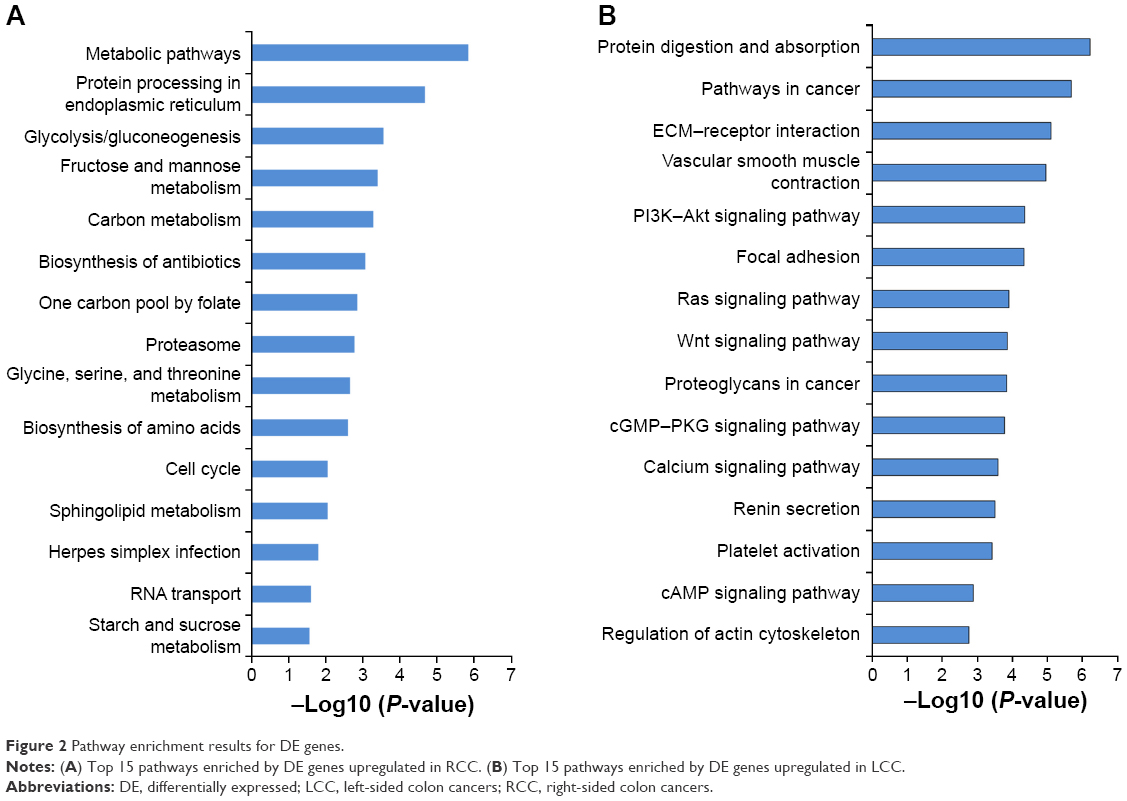 | Figure 2 Pathway enrichment results for DE genes. |
PPI network construction
The information provided by the STRING database was integrated and used to construct the PPI network. A PPI network with statistical significance made up of 804 nodes was screened with the set of 1,961 upregulated DE genes in RCC. Meanwhile, with the set of 1,832 upregulated DE genes in LCC, a statistically significant network consisting of 589 nodes was discovered (Table 3). The degree distributions of the network nodes are illustrated in Figure 3. In the PPI network set up by the upregulated genes in RCC, the top five hub nodes with higher degrees were detected including PCNA, TP53, HSP90AA1, CSNK2A1, and UBB, while the top five nodes with higher degrees were screened in the PPI network constructed by the upregulated genes in LCC, namely LRRK2, ABL1, PRKACA, CAV1, and JUN. The detailed information of the selected hub genes from the PPI network is listed in Table 4. The sub-network was reconstructed with the selected hub nodes and their first neighbor genes, as plotted in Figure 4.
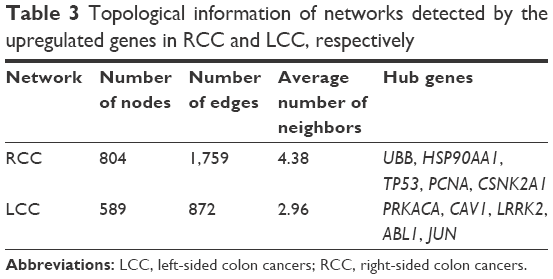 | Table 3 Topological information of networks detected by the upregulated genes in RCC and LCC, respectively |
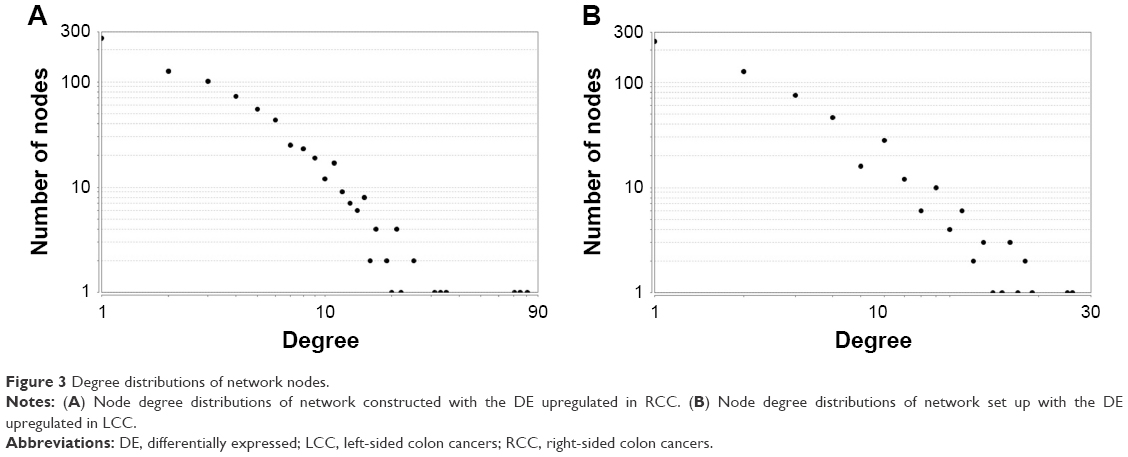 | Figure 3 Degree distributions of network nodes. |
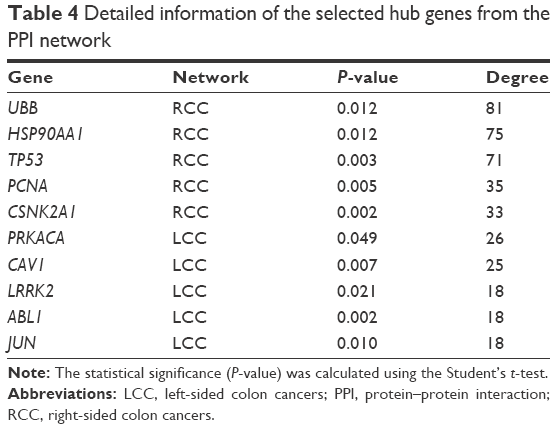 | Table 4 Detailed information of the selected hub genes from the PPI network |
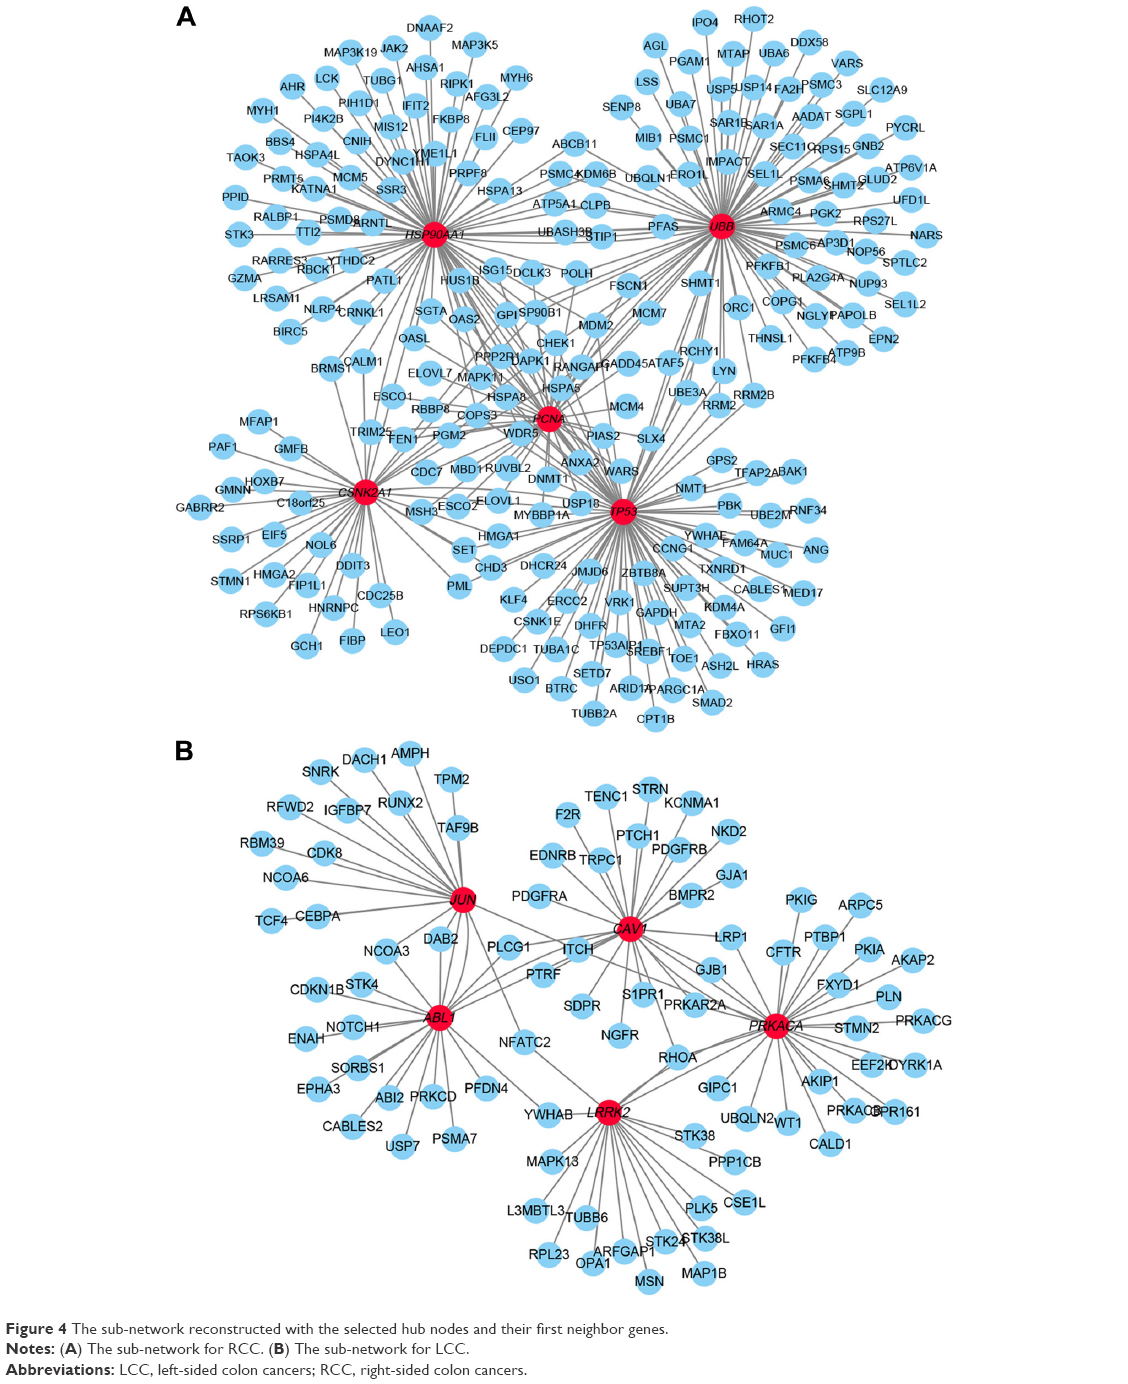 | Figure 4 The sub-network reconstructed with the selected hub nodes and their first neighbor genes. |
Module analysis of the PPI network
Using the MCODE package, the most significant modules in the PPI network with the highest score for RCC and LCC were detected. The enrichment analysis of the DE genes involved in the modules was also carried out with DAVID, and the results displayed that these genes were mainly enriched in proteasomes, cell cycle, DNA replication, and ribosomes (Figure 5).
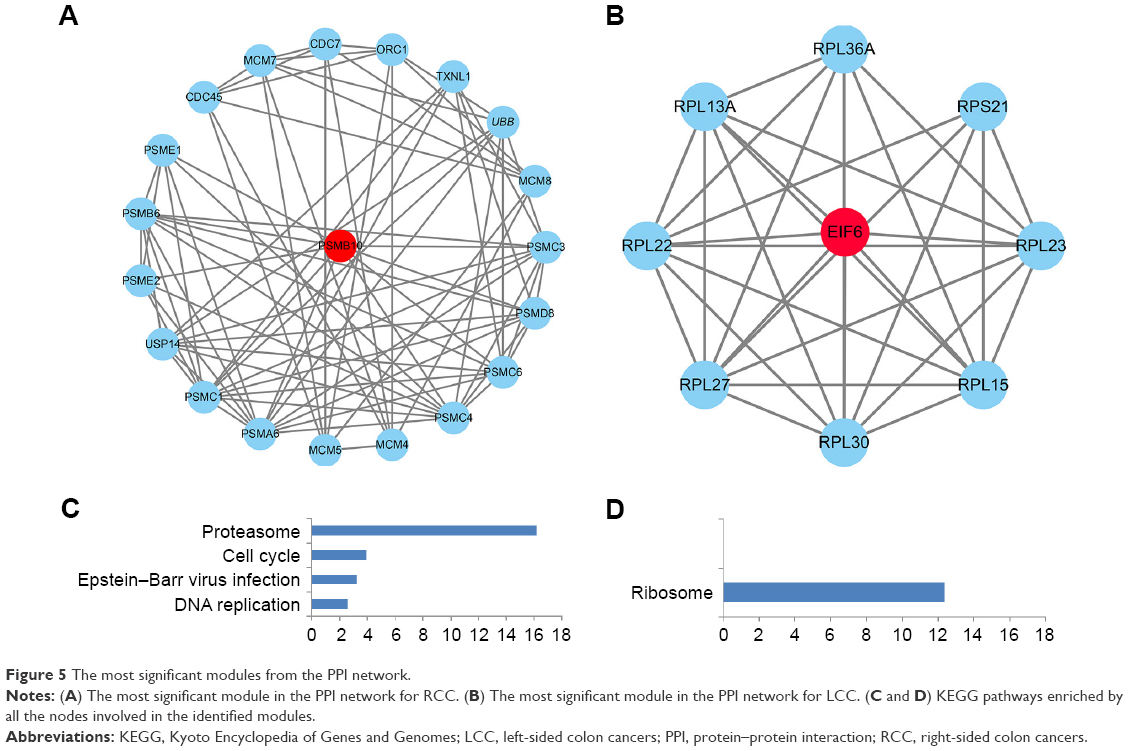 | Figure 5 The most significant modules from the PPI network. |
Discussion
Considering that precision medicine emphasizes the importance of personalized and precise treatment, researchers have paid more attention to the impact of tumor location on the diagnosis, prognosis, treatment selection, and therapeutic assessment.13 RCC and LCC have been elucidated to be different clinically, pathologically, and genetically and could predispose to different clinical assumptions regarding tumorigenesis as well as survival. However, the precise mechanisms have not been fully understood. In this study, the potential genomic determinants that contribute to the difference between RCC and LCC were evaluated by employing a series of bioinformatic approaches.
Recent studies have demonstrated the clinical differences between RCC and LCC, showing that patients suffering from LCC were more likely to be younger than RCC patients, while RCC was more often diagnosed in women than men compared to LCC.14 In the present study, we also analyzed the clinicopathological differences between RCC and LCC patients included in our evaluation, which was in accordance with the age and gender differences of previous evidence. Our results indicated that patients suffering from RCC had worse outcome than patients with LCC, although this was not significant perhaps because of the small sample size, which has been confirmed in an integrated meta-analysis based on 1,437,846 patients.15
Gene expression profile containing 101 RCC and 93 LCC samples was used in our study, and 1,961 DE genes upregulated in RCC and 1,832 DE genes upregulated in LCC were identified. By setting up the PPI network, we identified some key genes with high degrees in the network: PCNA, TP53, HSP90AA1, CSNK2A1, UBB, LRRK2, ABL1, PRKACA, CAV1, and JUN. PCNA was identified as one of the most important molecular biomarkers for proliferation with its powerful role in replication, cancer cell growth, death, and maintenance.16 As an indispensable modulator of DNA synthesis, PCNA is involved in the regulation of various essential functions including the repair of DNA damage, avoidance of DNA damage, control of cell cycle, survival of cells, assembly of chromatin, and transcription of gene.17 TP53, a well-studied tumor suppressor gene that encodes p53, frequently mutates in a majority of human tumors including colon cancer.18 The HSP90AA1 gene that encodes the heat shock protein 90α (Hsp90α), has been shown to regulate the stability of several proteins that are important for tumor progression and is identified as a promising target for cancer treatment.19 CSNK2A1 has been reported to participate in tumorigenesis by way of phosphorylating multiple important proteins and the inhibition of CSNK2A1 could decrease the proliferation and invasiveness of cancer cells.20 The polyubiquitin gene UBB is a regulatory protein involved in ubiquitin, and the knockdown of UBB could effectively downregulate the level of ubiquitin, which is essential for the growth of cancer cells, and thus may be a potential anticancer treatment.21 LRRK2 was associated with formidable antitumor activity such as suppression of proliferation, migration and invasion of tumor cells, and induction of apoptosis along with arrest of cell cycle.22 ABL1, which is a nonreceptor tyrosine kinase, has been indicated to dysregulate several cancers. Recent studies have proposed that the activation of ABL1 may be responsible for the tumorigenesis by interacting with the downstream targets and the corresponding signaling pathways.23 It has been found that the mutation of PRKACA was identified in the pathogenesis of several tumors and involved in some signaling pathways.24 CAV1 has been demonstrated to be an essential structural and signaling protein, having a role in the formation, maintenance, and function of membrane caveolae. Recently, growing evidence has indicated that the elevated expression of CAV1 contributes to the malignant progression of various human cancers including colon cancer due to the aberrant promoter CpG site hypomethylation.25 The information gathered so far indicates that the JUN gene could play vital roles in apoptotic responses to DNA damage, cell stress, as well as to cytotoxic drugs.26 In short, all the above genes have been proved by the published literature to be involved in tumorigenesis and progression, which may provide new ideas for therapeutic studies in RCC and LCC.
We supposed that if RCC is homogeneous with LCC, the DE genes may fall into similar functional pathways, modules, or networks and then reach a more consistent state when uploaded to higher functional levels in spite of the inconsistent gene lists. So we performed functional analysis including GO and pathway enrichment analyses. Most GO terms enriched by the upregulated DE genes in RCC were significantly associated with the process of biosynthesis and metabolism at the BP level, basic cell structure at CC level along with the enzymes metabolic processes, and energy metabolism at MF level. The GO term analysis showed that DE genes upregulated in LCC were mainly involved in cell adhesion, angiogenesis, collagen catabolic process, and regulation of canonical Wnt signaling pathway at the BP level, extracellular components at the CC level, and biological combination processes at the MF level. The GO analysis revealed the differences between RCC and LCC at three different functional levels.
Furthermore, the enriched KEGG pathways of upregulated DE genes in RCC included biosynthesis and metabolism pathways, proteasome, cell cycle, and RNA transport. The biosynthesis and metabolism pathways consist of many important processes including glycolysis, gluconeogenesis, carbon metabolism, amino acids’ biosynthesis, and changes in cell metabolism, which may result in transformation and tumor progression.27 The proteasome is a well-studied signaling molecule that is involved in cell survival and proliferation, the inhibitors of which may be used in cancer therapy for their ability in shifting the fine intracellular homeostasis equilibrium toward cell death.28 Extensive studies have critically reviewed the role of the cell cycle in the occurrence and development of various tumors, meanwhile cell cycle regulators are considered attractive targets in cancer therapy.29 RNA transport has been proved to be essential for the initiation and progression of cancers.30 Our research showed that DE genes in upregulated LCC were related to protein digestion and absorption, pathways in cancer, ECM–receptor interaction, vascular smooth muscle contraction, and several important signaling pathways including PI3K–Akt, Ras, Wnt, cGMP–PKG, calcium, and cAMP signaling pathways. Recent evidence indicates that ECM–receptor plays a crucial role in cancer cell biology and tumorigenesis.31 The PI3K–Akt signaling pathway has an important impact on the initiation and progress in tumorigenesis and regulates critical cellular functions including cell proliferation, differentiation, and apoptosis.32 Ras is a membrane-anchored protein, which takes part in the generation of multiple intracellular signaling cascades including the above PI3K–Akt signaling.33 The other signaling pathways also play a pivotal part in cancer development including survival, proliferation, and metabolism.34–38 The above analysis indicated that these DE genes could not reach a consensus at the function level, which contribute to the difference of RCC and LCC.
Module analysis was used to seek the most remarkable module of the constructed PPI network. It was revealed from the results that the DE genes of RCC in the most significant module participate in proteasome, cell cycle, and DNA replication signaling pathways, while the DE genes of LCC in the selected module were associated with ribosomes. The proteasome and cell cycle signaling pathways were enriched again, and the results demonstrated their crucial roles in the initiation and progress of RCC. DNA replication stress has been regarded to be a hallmark of cancer as it likely promotes the development of cancer and is very prevalent.39 Ribosome biogenesis in tumorgenesis has been demonstrated for a long time, and the selective inhibition of ribosomes could lead to selective damage to neoplastic cells.40 One seed gene PSMB10 is an immunoproteasome gene with a high expression in most cancer types, and it is associated with the predisposition and recurrence of several tumors.41 The other seed gene EIF6 has been identified to play an important role in cell proliferation, and EIF6 overexpression could enhance the motility and invasiveness of cancer cells.42 These findings demonstrate that RCC and LCC could predispose to different pathways showing the differences of RCC and LCC once again.
Taken together, our study provides a comprehensive bioinformatic analysis of the DE genes and pathways involved in RCC and LCC, which may be used as specific therapeutic targets in the treatment of RCC and LCC. Our results may provide new insights into the underlying molecular mechanisms contributing to the differences between RCC and LCC. However, further molecular biological experiments will be needed in the future in order to determine the function of the identified genes in RCC and LCC.
Acknowledgment
This study was supported by the Second Affiliated Hospital of Soochow University Preponderant Clinic Discipline Group Project funding (XKQ2015005), Suzhou Science and Technology Development Program (SZS201509), Suzhou Clinical Medical Center Construction Project (Szzxj201503), and Jiangsu Medical Innovation Team (CXDT-37).
Disclosure
The authors report no conflicts of interest in this work.
References
Siegel RL, Miller KD, Jemal A. Cancer statistics, 2017. CA Cancer J Clin. 2017;67(1):7–30. | ||
Siegel RL, Miller KD, Fedewa SA, et al. Colorectal cancer statistics, 2017. CA Cancer J Clin. 2017;67(3):177–193. | ||
Lee MS, Menter DG, Kopetz S. Right versus left colon cancer biology: integrating the consensus molecular subtypes. J Natl Compr Canc Netw. 2017;15(3):411–419. | ||
Loupakis F, Yang D, Yau L, et al. Primary tumor location as a prognostic factor in metastatic colorectal cancer. J Natl Cancer Inst. 2015;107(3):dju427. | ||
Kuramochi H, Nakamura A, Nakajima G, et al. PTEN mRNA expression is less pronounced in left- than right-sided colon cancer: a retrospective observational study. BMC Cancer. 2016;16:366. | ||
Bauer KM, Hummon AB, Buechler S. Right-side and left-side colon cancer follow different pathways to relapse. Mol Carcinog. 2012;51(5):411–421. | ||
Jorissen RN, Gibbs P, Christie M, et al. Metastasis-associated gene expression changes predict poor outcomes in patients with dukes stage B and C colorectal cancer. Clin Cancer Res. 2009;15(24):7642–7651. | ||
Gene Ontology Consortium. The gene ontology (GO) project in 2006. Nucleic Acids Res. 2006;34(Database Issue):D322–D326. | ||
Kanehisa M, Goto S. KEGG: kyoto encyclopedia of genes and genomes. Nucleic Acids Res. 2000;28(1):27–30. | ||
Huang da W, Sherman BT, Lempicki RA. Systematic and integrative analysis of large gene lists using DAVID bioinformatics resources. Nat Protoc. 2009;4(1):44–57. | ||
Szklarczyk D, Morris JH, Cook H, et al. The STRING database in 2017: quality-controlled protein-protein association networks, made broadly accessible. Nucleic Acids Res. 2017;45(D1):D362–D368. | ||
Shannon P, Markiel A, Ozier O, et al. Cytoscape: a software environment for integrated models of biomolecular interaction networks. Genome Res. 2003;13(11):2498–2504. | ||
Lewis R. Mutation and location important in cancer treatment. Lancet Oncol. 2015;16(13):e482. | ||
Weiss JM, Pfau PR, O’Connor ES, et al. Mortality by stage for right- versus left-sided colon cancer: analysis of surveillance, epidemiology, and end results – Medicare data. J Clin Oncol. 2011;29(33):4401–4409. | ||
Petrelli F, Tomasello G, Borgonovo K, et al. Prognostic survival associated with left-sided vs right-sided colon cancer: a systematic review and meta-analysis. JAMA Oncol. Epub 2016 Oct 27. | ||
Wang SC. PCNA: a silent housekeeper or a potential therapeutic target? Trends Pharmacol Sci. 2014;35(4):178–186. | ||
Moldovan GL, Pfander B, Jentsch S. PCNA, the maestro of the replication fork. Cell. 2007;129(4):665–679. | ||
Liu Y, Zhang X, Han C, et al. TP53 loss creates therapeutic vulnerability in colorectal cancer. Nature. 2015;520(7549):697–701. | ||
Hu B, Zhang Y, Jia L, et al. Binding of the pathogen receptor HSP90AA1 to avibirnavirus VP2 induces autophagy by inactivating the AKT-MTOR pathway. Autophagy. 2015;11(3):503–515. | ||
Bae JS, Park SH, Jamiyandorj U, et al. CK2alpha/CSNK2A1 phosphorylates SIRT6 and is involved in the progression of breast carcinoma and predicts shorter survival of diagnosed patients. Am J Pathol. 2016;186(12):3297–3315. | ||
Oh C, Park S, Lee EK, Yoo YJ. Downregulation of ubiquitin level via knockdown of polyubiquitin gene Ubb as potential cancer therapeutic intervention. Sci Rep. 2013;3:2623. | ||
Weygant N, Qu D, Berry WL, et al. Small molecule kinase inhibitor LRRK2-IN-1 demonstrates potent activity against colorectal and pancreatic cancer through inhibition of doublecortin-like kinase 1. Mol Cancer. 2014;13:103. | ||
Sourbier C, Ricketts CJ, Matsumoto S, et al. Targeting ABL1-mediated oxidative stress adaptation in fumarate hydratase-deficient cancer. Cancer Cell. 2014;26(6):840–850. | ||
Goh G, Scholl UI, Healy JM, et al. Recurrent activating mutation in PRKACA in cortisol-producing adrenal tumors. Nat Genet. 2014;46(6):613–617. | ||
Ha TK, Chi SG. CAV1/caveolin 1 enhances aerobic glycolysis in colon cancer cells via activation of SLC2A3/GLUT3 transcription. Autophagy. 2012;8(11):1684–1685. | ||
Shaulian E. AP-1 – The Jun proteins: Oncogenes or tumor suppressors in disguise? Cell Signal. 2010;22(6):894–899. | ||
Vander Heiden MG, DeBerardinis RJ. Understanding the intersections between metabolism and cancer biology. Cell. 2017;168(4):657–669. | ||
Manasanch EE, Orlowski RZ. Proteasome inhibitors in cancer therapy. Nat Rev Clin Oncol. 2017;14(7):417–433. | ||
Otto T, Sicinski P. Cell cycle proteins as promising targets in cancer therapy. Nat Rev Cancer. 2017;17(2):93–115. | ||
Tang Y, Cheung BB, Atmadibrata B, et al. The regulatory role of long noncoding RNAs in cancer. Cancer Lett. 2017;391:12–19. | ||
Jang M, Koh I, Lee SJ, Cheong JH, Kim P. Droplet-based microtumor model to assess cell–ECM interactions and drug resistance of gastric cancer cells. Sci Rep. 2017;7:41541. | ||
Dey N, De P, Leyland-Jones B. PI3K-AKT-mTOR inhibitors in breast cancers: From tumor cell signaling to clinical trials. Pharmacol Ther. 2017;175:91–106. | ||
Schmukler E, Kloog Y, Pinkas-Kramarski R. Ras and autophagy in cancer development and therapy. Oncotarget. 2014;5(3):577–586. | ||
Brozovich FV, Nicholson CJ, Degen CV, Gao YZ, Aggarwal M, Morgan KG. Mechanisms of vascular smooth muscle contraction and the basis for pharmacologic treatment of smooth muscle disorders. Pharmacol Rev. 2016;68(2):476–532. | ||
Zhan T, Rindtorff N, Boutros M. Wnt signaling in cancer. Oncogene. 2017;36(11):1461–1473. | ||
Li N, Xi Y, Tinsley HN, et al. Sulindac selectively inhibits colon tumor cell growth by activating the cGMP/PKG pathway to suppress Wnt/beta-catenin signaling. Mol Cancer Ther. 2013;12(9):1848–1859. | ||
Chen Z, Li JL, Lin S, et al. cAMP/CREB-regulated LINC00473 marks LKB1-inactivated lung cancer and mediates tumor growth. J Clin Invest. 2016;126(6):2267–2279. | ||
Logan CV, Szabadkai G, Sharpe JA, et al. Loss-of-function mutations in MICU1 cause a brain and muscle disorder linked to primary alterations in mitochondrial calcium signaling. Nat Genet. 2014;46(2):188–193. | ||
Macheret M, Halazonetis TD. DNA replication stress as a hallmark of cancer. Annu Rev Pathol. 2015;10:425–448. | ||
Brighenti E, Trere D, Derenzini M. Targeted cancer therapy with ribosome biogenesis inhibitors: a real possibility? Oncotarget. 2015;6(36):38617–38627. | ||
Rouette A, Trofimov A, Haberl D, et al. Expression of immunoproteasome genes is regulated by cell-intrinsic and -extrinsic factors in human cancers. Sci Rep. 2016;6:34019. | ||
Gatza ML, Silva GO, Parker JS, Fan C, Perou CM. An integrated genomics approach identifies drivers of proliferation in luminal-subtype human breast cancer. Nat Genet. 2014;46(10):1051–1059. |
 © 2018 The Author(s). This work is published and licensed by Dove Medical Press Limited. The
full terms of this license are available at https://www.dovepress.com/terms
and incorporate the Creative Commons Attribution
- Non Commercial (unported, 3.0) License.
By accessing the work you hereby accept the Terms. Non-commercial uses of the work are permitted
without any further permission from Dove Medical Press Limited, provided the work is properly
attributed. For permission for commercial use of this work, please see paragraphs 4.2 and 5 of our Terms.
© 2018 The Author(s). This work is published and licensed by Dove Medical Press Limited. The
full terms of this license are available at https://www.dovepress.com/terms
and incorporate the Creative Commons Attribution
- Non Commercial (unported, 3.0) License.
By accessing the work you hereby accept the Terms. Non-commercial uses of the work are permitted
without any further permission from Dove Medical Press Limited, provided the work is properly
attributed. For permission for commercial use of this work, please see paragraphs 4.2 and 5 of our Terms.