Back to Journals » OncoTargets and Therapy » Volume 11
Identification of driver genes associated with chemotherapy resistance of Ewing’s sarcoma
Authors Liao H, Xie X, Xu Y, Huang G
Received 25 April 2018
Accepted for publication 3 August 2018
Published 15 October 2018 Volume 2018:11 Pages 6947—6956
DOI https://doi.org/10.2147/OTT.S172190
Checked for plagiarism Yes
Review by Single anonymous peer review
Peer reviewer comments 2
Editor who approved publication: Dr Carlos E Vigil
Hongyi Liao,1,* Xianbiao Xie,2,* Yuanyuan Xu,3 Gang Huang2
1Department of Orthopedic Surgery, The Seventh Affiliated Hospital of Sun Yat-sen University, Shenzhen, People’s Republic of China; 2Department of Orthopedic Oncology, The First Affiliated Hospital of Sun Yat-sen University, Guangzhou, People’s Republic of China; 3Department of Pediatrics, The First Affiliated Hospital of Sun Yat-sen University, Guangzhou, People’s Republic of China
*These authors contributed equally to this work
Background: The aim of this study was to identify the driver genes associated with chemotherapy resistance of Ewing’s sarcoma and potential targets for Ewing’s sarcoma treatment.
Methods: Two mRNA microarray datasets, GSE12102 and GSE17679, were downloaded from the Gene Expression Omnibus database, which contain 94 human Ewing’s sarcoma samples, including 65 from those who experienced a relapse and 29 from those with no evidence of disease. The differentially expressed genes (DEGs) were identified using LIMMA package R. Subsequently, Gene Ontology and Kyoto Encyclopedia of Genes and Genomes pathway enrichment analyses were performed for DEGs using Database for Annotation, Visualization and Integrated Analysis. The protein–protein interaction network was constructed using Cytoscape software, and module analysis was performed using Molecular Complex Detection.
Results: A total of 206 upregulated DEGs and 141 downregulated DEGs were identified. Upregulated DEGs were primarily enriched in DNA replication, nucleoplasm and protein kinase binding for biological processes, cellular component and molecular functions, respectively. Downregulated DEGs were predominantly involved in receptor clustering, membrane raft, and ligand-dependent nuclear receptor binding. The protein–protein interaction network of DEGs consisted of 150 nodes and 304 interactions. Thirteen hub genes were identified, and biological analysis revealed that these genes were primarily enriched in cell division, cell cycle, and mitosis. Furthermore, based on closeness centrality, betweenness centrality, and degree centrality, the three most significant genes were identified as GAPDH, AURKA, and EHMT2. Furthermore, the significant network module was composed of nine genes. These genes were primarily enriched in mitotic nuclear division, mitotic chromosome condensation, and nucleoplasm.
Conclusion: These hub genes, especially GAPDH, AURKA, and EHMT2, may be closely associated with the progression of Ewing’s sarcoma chemotherapy resistance, and further experiments are needed for confirmation.
Keywords: Ewing’s sarcoma, chemotherapy resistance, differentially expressed gene, enrichment analysis, network
Introduction
Ewing’s sarcoma is a small, round, blue cell tumor and the second most common primary bone cancer in children, adolescents, and young adults.1 The annual incidence of Ewing’s sarcoma is approximately 3 per million in the population.2 The most common primary sites include the long bones (47%), pelvis (26%), chest wall (16%), and spine (6%).2 Ewing’s sarcoma is characterized by a chromosomal translocation involving the EWS gene (EWSR1) on chromosome 22q12 and a member of the ETS transcription factor family. In 85% of patients, the FLI1 gene on chromosome 11q24 is involved, leading to an aberrant EWS–ETS transcription factor.3 Over the last four decades, survival of this disease has improved from 10% with radiotherapy alone to nearly 70% in localized disease with a combination of chemotherapy and local therapy (surgery, radiation therapy, or both).4 Despite the multidisciplinary therapeutic strategies, the treatment of Ewing’s sarcoma has reached a clinical therapeutic plateau. The survival rate of Ewing’s sarcoma has not improved in recent years, and the outcome in some subgroups of patients still remains poor.5 In patients with localized disease, poor histological response or resistance to chemotherapy is associated with poor prognosis.6 Thus, there is an urgent need to identify crucial genes related to chemotherapy resistance of Ewing’s sarcoma and to further develop prognostic biomarkers and novel therapeutic targets.
The current standard-of-care for Ewing’s sarcoma is cytotoxic chemotherapy with vincristine, adriamycin, and cyclophosphamide, alternating with ifosfamide and etoposide.6 However, these agents do not benefit approximately 30% of patients with Ewing’s sarcoma who present with localized disease.7 In addition, those who bear clinically detectable metastases at diagnosis and those who experience local and/or distant recurrent disease still present a low overall survival rate.8,9 Despite multiple efforts to identify new potent therapeutic drugs, there is still a high percentage of tumors that do not respond to treatment. The mechanisms by which Ewing’s sarcoma becomes resistant to chemotherapy are varied and may involve cancer stem cells, proliferative intracellular pathways, and new mutations that allow tumor cells to escape the effect of chemotherapy.10 Therefore, it is imperative to identify prognostic factors to detect chemotherapy-resistant tumors at diagnosis and to develop more individualized treatment regimens.
During the last decades, microarray technology and bioinformatics analysis have been widely used to screen genetic alterations at the genome level, which have helped us identify the differentially expressed genes (DEGs) and functional pathways involved in the chemotherapy resistance of Ewing’s sarcoma. In the present study, two mRNA microarray datasets, GSE12102 and GSE17679, were downloaded from the Gene Expression Omnibus (GEO) database, and a total of 94 human Ewing’s sarcoma samples were selected from these two datasets.11,12 Then, we used LIMMA package R to analyze and obtain DEGs between tissues from patients who experienced a relapse (REL) and from those with no evidence of disease (NED). Subsequently, Gene Ontology (GO) and Kyoto Encyclopedia of Genes and Genomes (KEGG) pathway enrichment analyses and protein–protein interaction (PPI) network analyses were performed to elucidate the molecular mechanisms underlying chemotherapy resistance. In conclusion, a total of 347 DEGs and 13 hub genes were identified, and three significant genes were found. These three genes may be crucial in Ewing’s sarcoma resistance to chemotherapy and candidate biomarkers to predict the prognosis of Ewing’s sarcoma.
Methods
Affymetrix microarray data
The mRNA expression profiles of GSE12102 and GSE17679 were downloaded from the public functional genomics data repository GEO (http://www.ncbi.nlm.nih.gov/geo/).11,12 These datasets were obtained on the Affymetrix GPL570 platform (Affymetrix Human Genome U133 Plus 2.0 Array, Affymetrix, Santa Clara, CA, USA). A total of 94 human Ewing’s sarcoma samples were included in these two datasets, and we defined the patients who had tumor progression within 3 years from diagnosis as the REL group and those who did not experience recurrence as the NED group. We then compared the gene expression profiles of 65 tumors from the REL group with 29 tumors from the NED group.
Identification of DEGs
Background correction, quantile normalization, and probe summarization of the raw data in the CEL files were performed using the robust multiarray average algorithm in the affy package of Bioconductor (http://www.bioconductor.org/). The DEGs between REL group samples and NED group samples were identified by the linear models for microarray data (LIMMA, http://www.bioconductor.org/packages/release/bioc/html/limma.html) package. The corresponding P-value of the genes after independent t-tests was defined as the adjusted P-value, and an adjusted P-value <0.01 and |log2FC (fold change)| ≥1 were selected as the cut-off criteria.
KEGG and GO enrichment analyses of DEGs
Database for Annotation, Visualization and Integrated Discovery (DAVID; http://david.abcc.ncifcrf.gov/) is an online biological information database that integrates biological data and analysis tools, and it provides comprehensive functional annotation information for genes and proteins for users to extract biological information. GO function and KEGG pathway enrichment analyses of DEGs were performed based on DAVID. P-values <0.05 and counts ≥2 were considered the cut-off criteria.
PPI network construction and module analysis
The PPI network was predicted using Search Tool for the Retrieval of Interacting Genes (STRING; http://string-db.org/). In the present study, the PPI network of DEGs was constructed based on the STRING database and was selected based on a score (median confidence) >0.4. The plug-in Molecular Complex Detection (MCODE) (version 1.4.2) of Cytoscape is an APP for clustering a given network based on topology to find densely connected regions. The network was then visualized by Cytoscape (http://www.cytoscape.org/), and the most significant module in the PPI networks was identified using MCODE. The criteria for selection were as follows: MCODE scores >5, degree cut-off =2, node score cut-off =0.2, max depth =100, and k-score =2. Subsequently, the KEGG and GO analyses for genes in this module were performed using DAVID.
Hub gene selection and analysis
The hub genes were selected with degrees ≥10. The biological process analysis of hub genes was performed and visualized using the Biological Networks Gene Oncology tool (version 3.0.3) plug-in of Cytoscape. To describe the importance of nodes in the PPI network, three methods, including degree centrality, betweenness centrality, and closeness centrality, were used in the present study.
Results
Identification of DEGs
After standardization of the microarray results, a total of 206 upregulated DEGs and 141 downregulated DEGs were obtained from REL samples compared with the NED samples. The hierarchical cluster analysis of the data revealed that the DEGs can be used to accurately distinguish REL samples from NED samples (Figure 1).
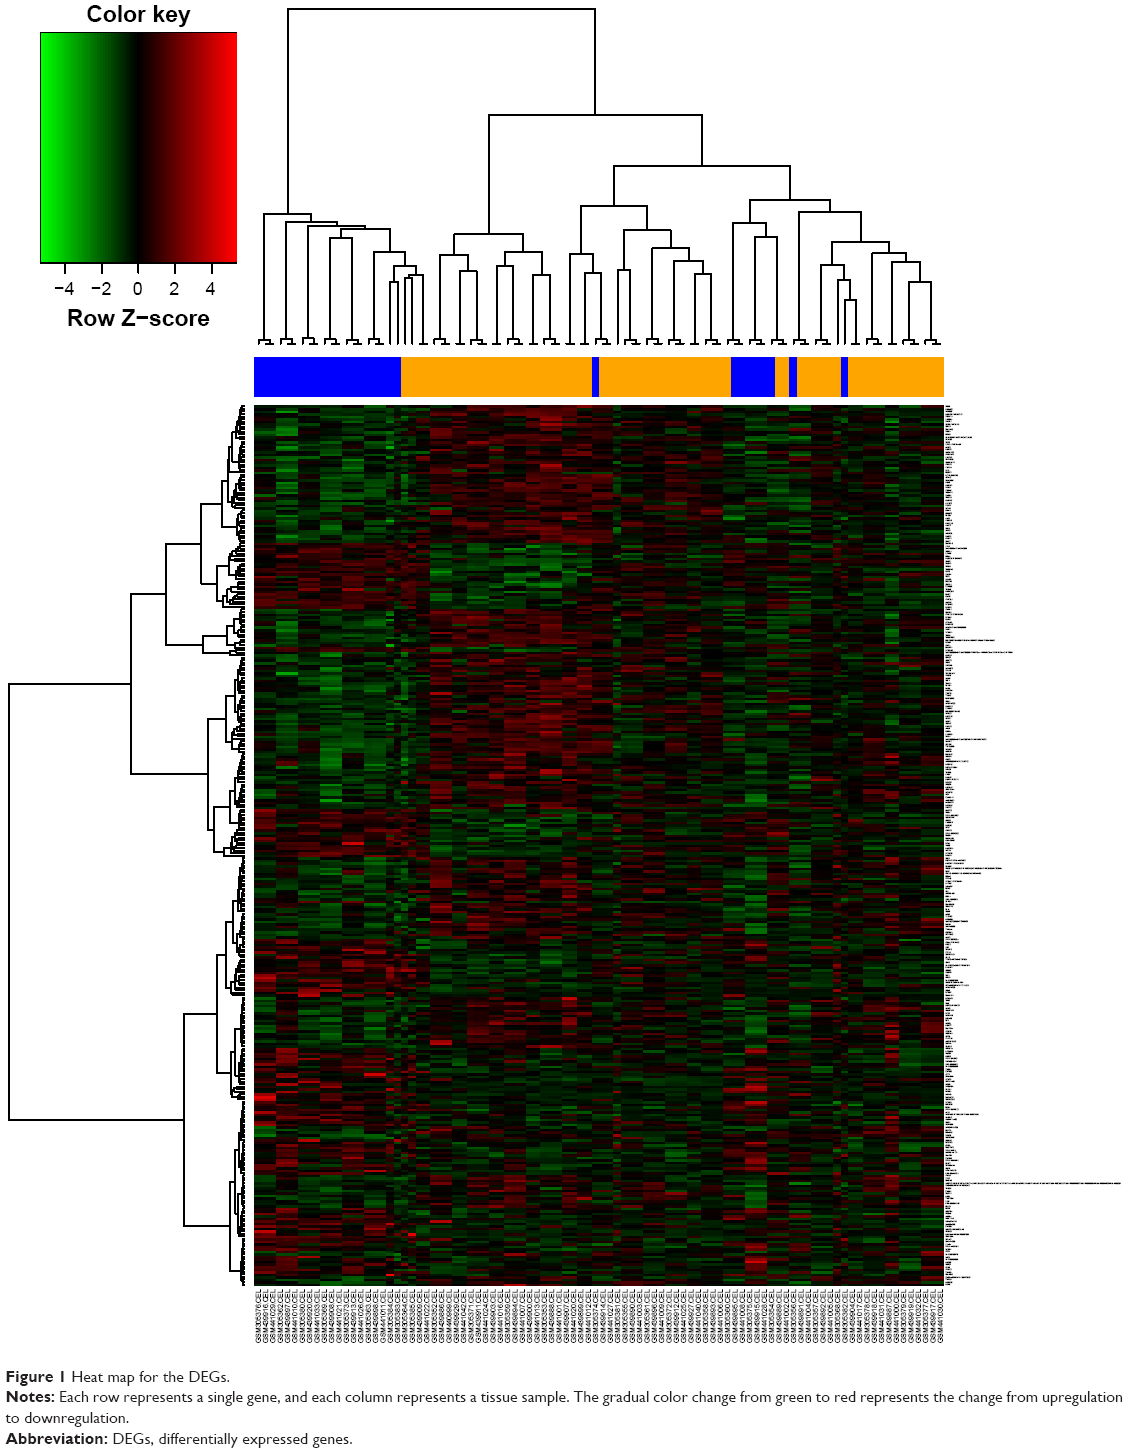 | Figure 1 Heat map for the DEGs. |
Enrichment analyses of DEGs
GO functional enrichment analysis showed that upregulated DEGs were primarily enriched in DNA replication, nucleoplasm and protein kinase binding for biological processes, cellular component and molecular functions, respectively (Table 1). The downregulated DEGs were predominantly involved in receptor clustering, membrane raft, and ligand-dependent nuclear receptor binding (Table 2). According to KEGG pathway enrichment analysis, the upregulated DEGs were primarily enriched in pathways, such as antigen processing and presentation, and there was no pathway enrichment in the downregulated DEGs (Table 3).
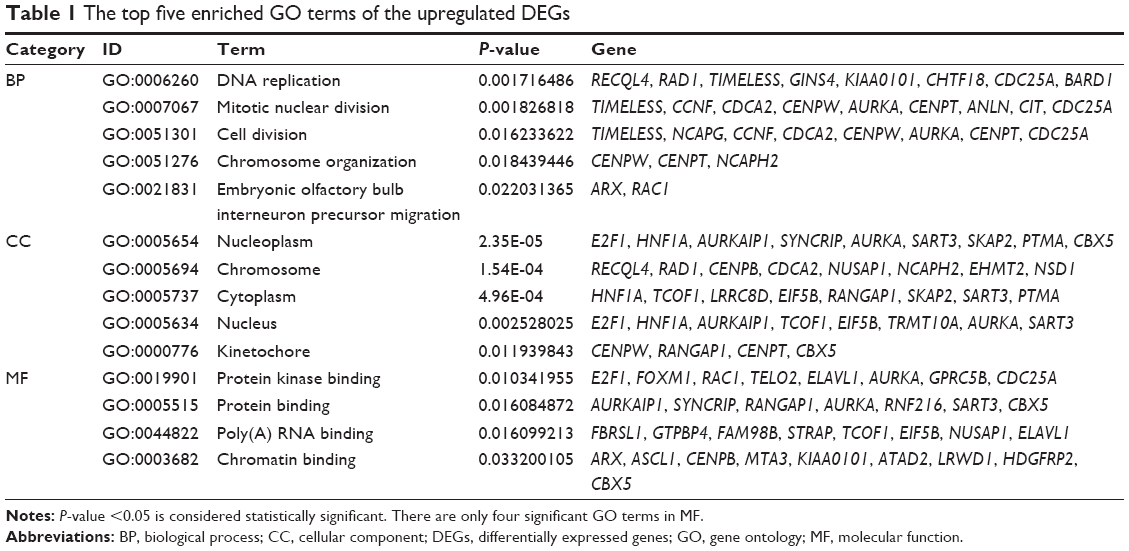 | Table 1 The top five enriched GO terms of the upregulated DEGs |
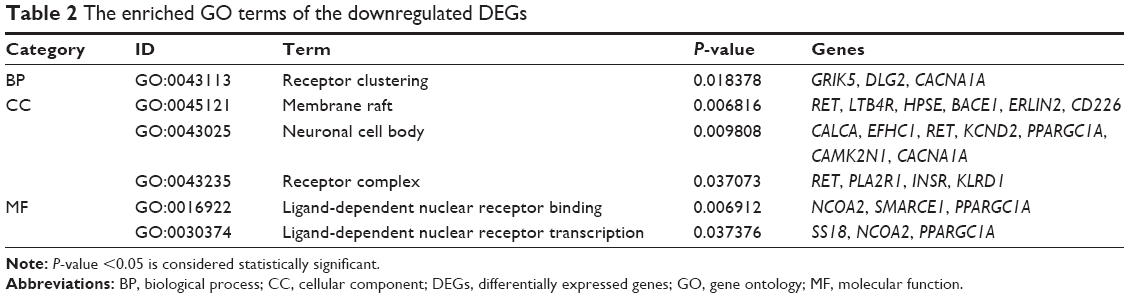 | Table 2 The enriched GO terms of the downregulated DEGs |
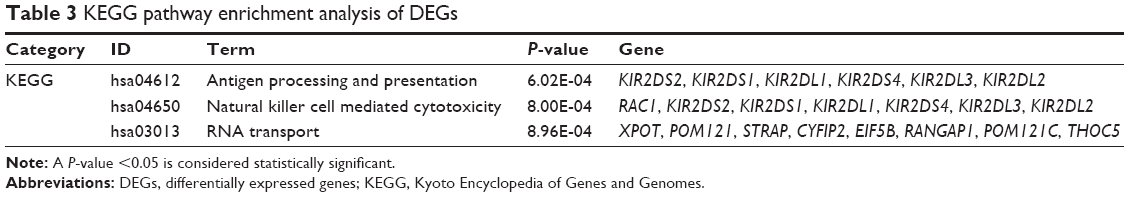 | Table 3 KEGG pathway enrichment analysis of DEGs |
The PPI network consisted of 150 nodes and 304 interactions (Figure 2). A significant network module was obtained from the PPI network (Figure 3). Strikingly, all the genes in this module were the upregulated DEGs in Ewing’s sarcoma samples. The functional analysis of genes involved in this module was performed using DAVID. The results showed that these DEGs were primarily involved in mitotic nuclear division, mitotic chromosome condensation, and nucleoplasm (Table 4).
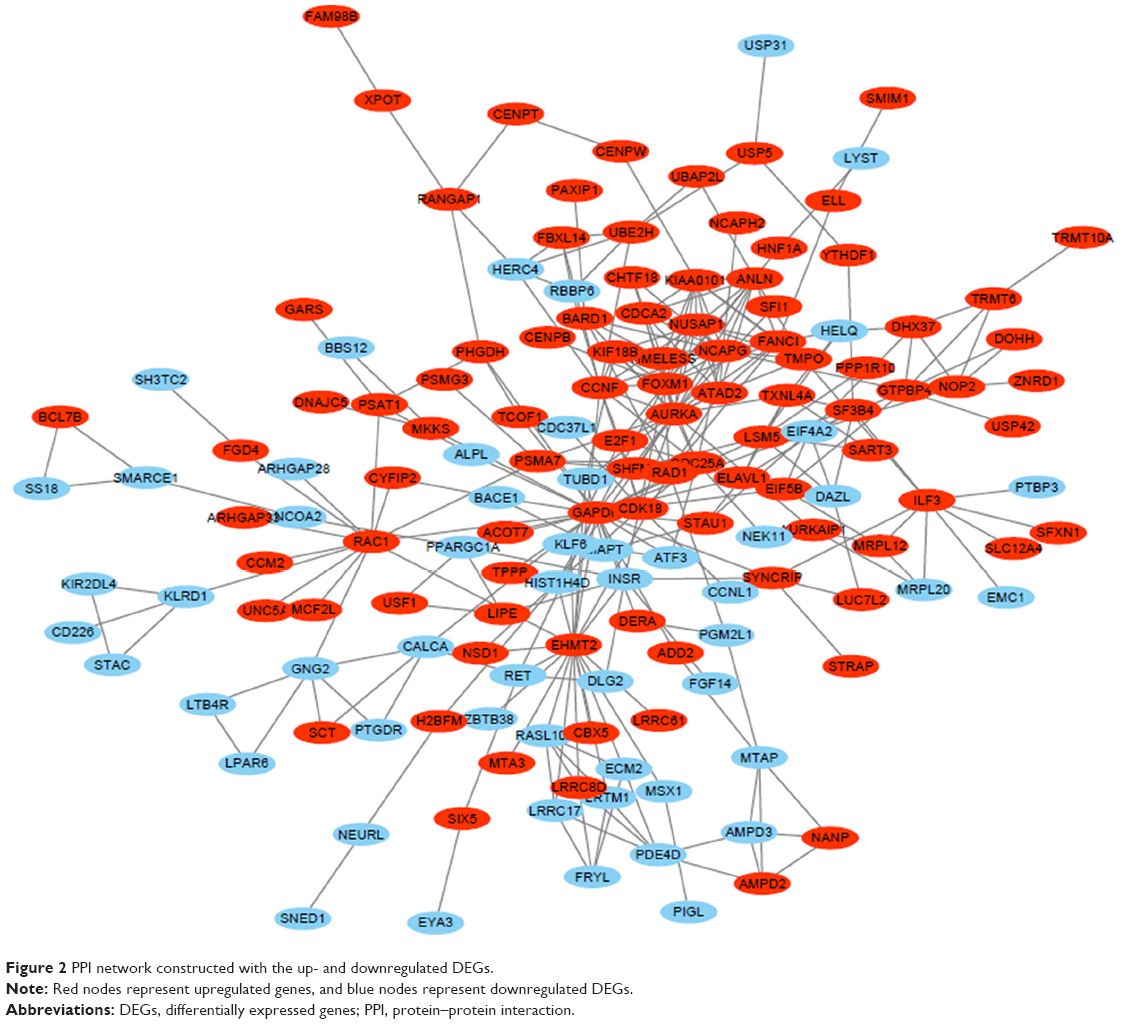 | Figure 2 PPI network constructed with the up- and downregulated DEGs. |
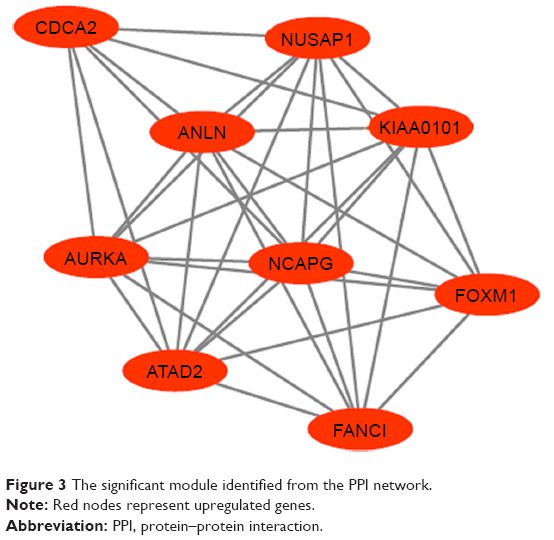 | Figure 3 The significant module identified from the PPI network. |
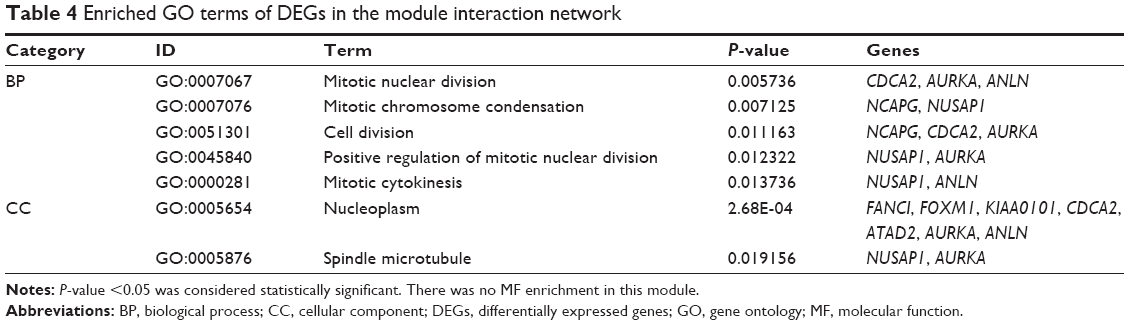 | Table 4 Enriched GO terms of DEGs in the module interaction network |
Hub gene selection and analysis
A total of 13 genes were identified as hub genes with degrees ≥10. The names, abbreviations and functions for these hub genes are shown in Table 5. Biological analysis showed that these hub genes were enriched in cell division, cell cycle and mitosis (Figure 4). Furthermore, betweenness centrality, degree centrality and closeness centrality were used to evaluate the top 15 significant genes in the PPI network (Table 6). We compared the top four genes and found that GAPHD, AUPKA and EHMT2 are the most important genes. These three genes were upregulated DEGs and among the selected hub genes. Thus, we speculated that GAPHD, AUPKA and EHMT2 play a significant role in the chemotherapy resistance of Ewing’s sarcoma.
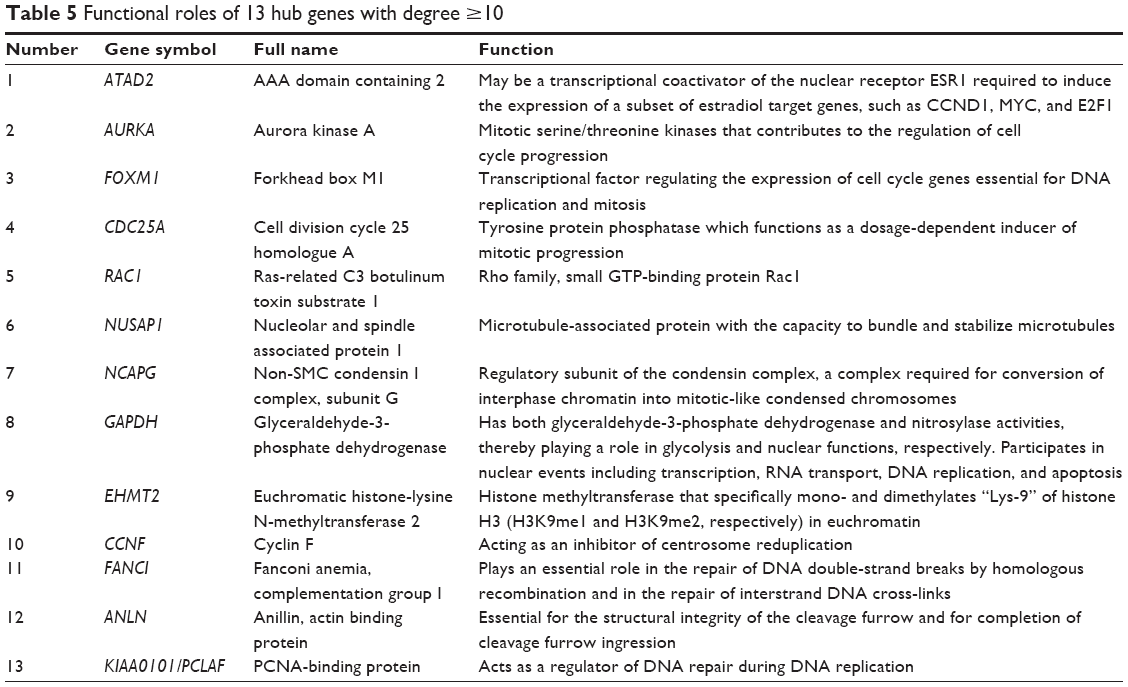 | Table 5 Functional roles of 13 hub genes with degree ≥10 |
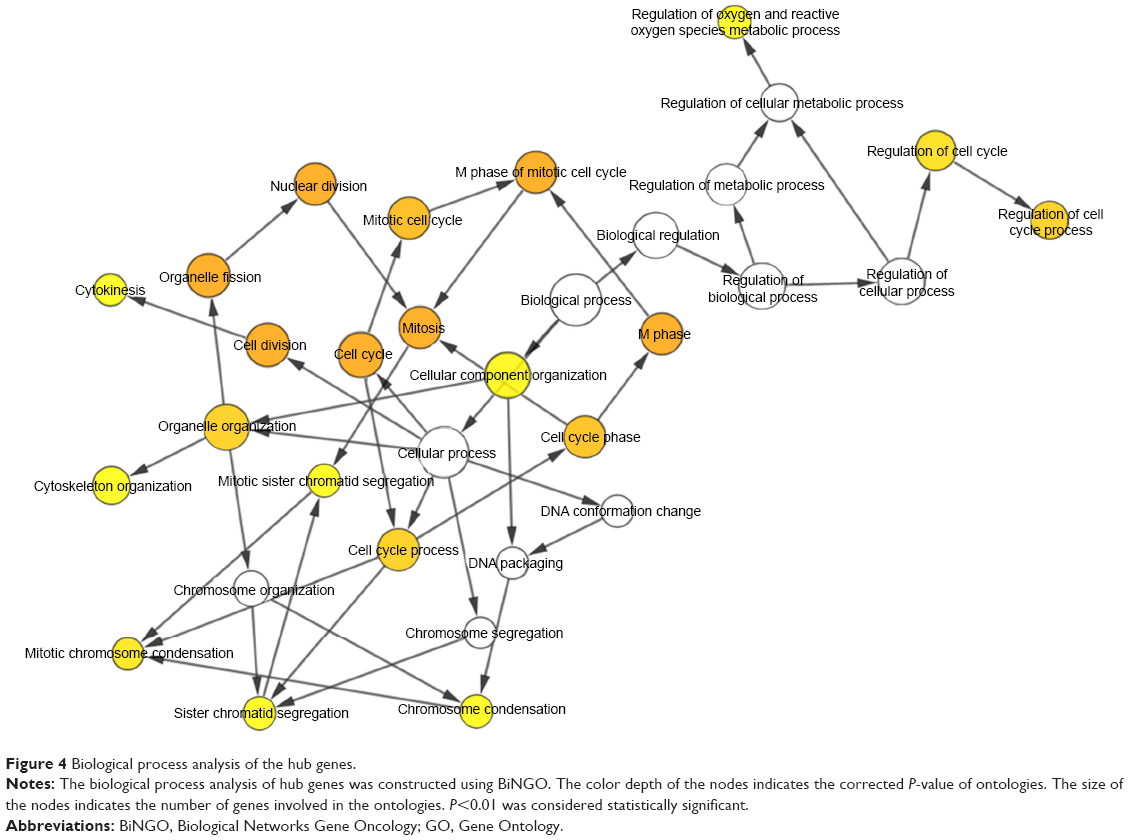 | Figure 4 Biological process analysis of the hub genes. |
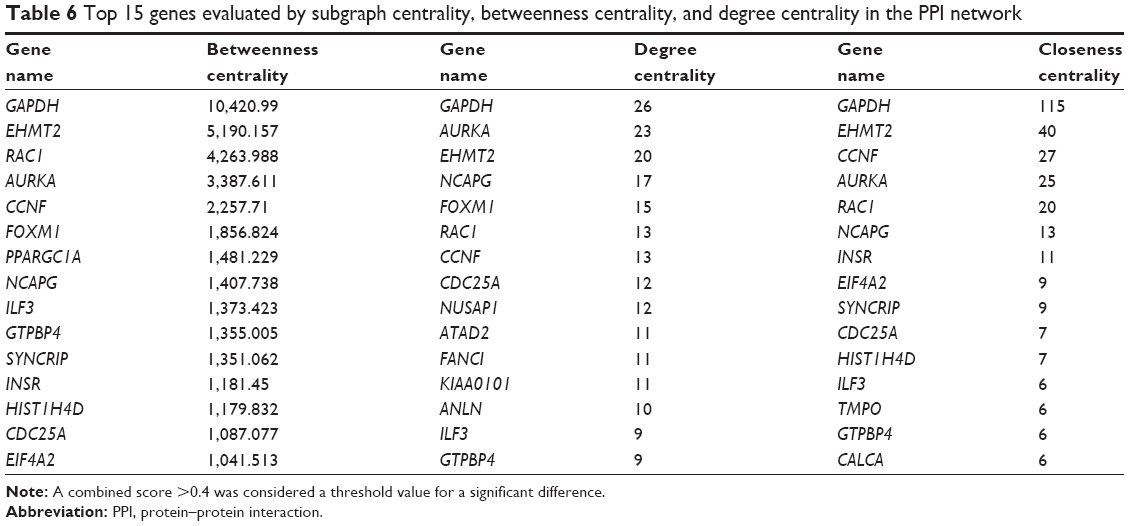 | Table 6 Top 15 genes evaluated by subgraph centrality, betweenness centrality, and degree centrality in the PPI network |
Discussion
Ewing’s sarcoma is the second most common malignant bone tumor affecting children and adolescents worldwide. Patients with Ewing’s sarcoma are commonly treated with aggressive cytotoxic chemotherapy and local surgery, and the prognosis for patients is poor. In addition, the 5-year survival rate is poor. Although chemotherapy has been used to treat patients since the 1970s,4 35% of the patients undergoing treatment show chemotherapy resistance. Therefore, there is an urgent need to explore the crucial genes and mechanisms of chemotherapy resistance, which would help develop effective diagnostic and treatment strategies.
In the present study, two mRNA microarray datasets were analyzed to obtain DEGs between REL tissues and NED tissues. A total of 273 DEGs were identified among the two datasets, including 206 upregulated DEGs and 141 downregulated DEGs. The upregulated genes were primarily enriched in DNA replication, mitotic nuclear division, and cell division, while the downregulated genes were predominantly enriched in receptor clustering. GO enrichment analysis revealed that changes in the most significant modules were primarily enriched in mitotic nuclear division, mitotic chromosome condensation, and cell division.
Most cytotoxic cancer therapies and radiotherapies can damage DNA or disrupt mitosis to induce cell death in highly proliferating tumor cells. In the present study, the upregulated genes were primarily enriched in DNA replication (RECQL4, RAD1, TIMELESS, GINS4, and KIAA0101), mitotic nuclear division (TIMELESS, CCNF, CDCA2, CENPW, and AURKA), and cell division (TIMELESS, CCNF, CDCA2, CENPW, and AURKA). We hypothesized that these genes may be involved in the progression of chemotherapy resistance in Ewing’s sarcoma by disturbing DNA replication, mitosis, and division of cancer cells. The TIMELESS gene is highly conserved and is involved in cell survival after damage or stress, increased DNA polymerase epsilon activity, maintenance of telomere length, and epithelial cell morphogenesis.13 Changes in the TIMELESS gene or its expression may promote the development of various cancers.14–19 TIMELESS contributes to the progression of breast cancer through activation of MYC.20 TIMELESS forms a complex with PARP1 and plays a role in the DNA damage response.21 One study has reported that overexpression of TIMELESS in NPC cell lines results in resistance to cisplatin-induced apoptosis in vitro and in vivo via the Wnt/β-catenin pathway and downstream gene transcription.22 Another study has reported that TIMELESS knockout sensitizes HCT116 colon cancer cells to doxorubicin.23 In our study, TIMELESS was overexpressed in REL Ewing’s sarcoma tissue. In addition, this gene was enriched in the DNA replication, mitotic nuclear division, and cell division categories. Accordingly, we hypothesized that TIMELESS may be involved in the progress of Ewing’s sarcoma chemotherapy resistance via the DNA replication process.
Furthermore, in the PPI network module, 13 DEGs were selected as hub genes with degrees ≥10. Biological analysis showed that these hub genes were enriched in cell division, cell cycle, and mitosis, indicating that chemotherapy resistance of Ewing’s sarcoma is associated with these processes. We then used betweenness centrality, degree centrality, and closeness centrality to evaluate the most significant genes in the PPI network, and we compared the top four genes and found that GAPHD, AUPKA, and EHMT2 were the most important genes. GAPDH is commonly known as a glycolytic enzyme,24 and is frequently used as a loading control in gene expression and protein studies. However, recent reports have identified some new roles for GAPDH in a diverse range of cellular processes, particularly its roles in the nucleus and in the regulation of cell proliferation.25,26 In the nucleus, GAPDH participates in the transcription of genes involved in antiapoptotic pathways and cell proliferation through its direct interaction with DNA and/or proteins.27–29 GAPDH also plays a role in the regulation of telomere length, and one report has shown that GAPDH protects against telomere shortening induced by the chemotherapeutic agents gemcitabine and doxorubicin.30 Several anticancer therapies, such as structural analogs of nitrogen bases and nucleosides, can disturb the structure and function of nucleic acids, which leads to tumor cell death. These damages can be recognized by different DNA repair systems. One report has shown that GAPDH can interact with proteins that recognize these damages and participate in DNA repair.31 Therefore, we concluded that in Ewing’s sarcoma, GAPDH is involved in DNA repair and plays a role in chemotherapy resistance. In this study, AURKA was enriched in mitotic nuclear division and cell division as well as in the MCODE module. AURKA is a serine/threonine kinase associated with cell cycle maintenance of stemness and regulation of mitotic spindle formation.32,33 Many studies have reported that AURKA overexpression induces centrosome amplification, chromosomal instability, and oncogenic transformation.34–36 In ovarian cancer, esophageal squamous cell carcinoma, breast cancer, and urinary tract urothelial cancer, increased AURKA is correlated with tumourigenesis, clinical aggressiveness, and tumor progression.37–40 Bioinformatics analysis has shown that AURKA is a potential biomarker for non-small-cell lung cancer (NSCLC) and can predict the prognosis of NSCLC patients.41 Upregulation of AURKA induces NSCLC initiation and progression through the LKB1/AMPK signaling pathway.42 In breast cancer, AURKA has been reported to be a possible marker for endocrine resistance.40 Thus, we speculated that AURKA may play an important role in Ewing’s sarcoma chemotherapy resistance and may act as a potential biomarker for prognosis. G9A/EHMT2 is a histone lysine methyltransferase that specifically affects the mono- and dimethylation of Lys9 of histone H3.3–5. Studies have shown that EHMT2 overexpression is correlated with clinicopathological parameters and poor survival in various cancers.43–46 Elevated EHMT2 induces development and progression of various cancers by regulating cancer metabolism, metastasis, cell survival, and response to hypoxia.47–50 In colon cancer-initiating cells, one report has found that EHMT2 mandates self-renewal, chemotherapy resistance, and metastatic abilities by activating the K-RAS/β-catenin pathway.51 Another study has shown that EHMT2 controls colon cancer stem cell phenotype and chemoradioresistance through the PP2A2-RPA axis-mediated DNA damage response.52 In the present study, EHMT2 was an upregulated DEG in Ewing’s sarcoma. Thus, we hypothesized that EHMT2 may play an important role in Ewing’s sarcoma chemotherapy resistance and may act as a potential biomarker of prognosis.
In conclusion, the present study was designed to identify DEGs that may be involved in the chemotherapy resistance of Ewing’s sarcoma. A total of 347 DEGs and 13 hub genes were identified. Among the hub genes, GAPDH, AURKA, and EHMT2 may be highly correlated with chemotherapy resistance and may be diagnostic biomarkers for Ewing’s sarcoma. However, there were certain limitations in this study, and further experiments are needed to validate the expression levels of these genes and their functions.
Acknowledgments
This study was supported by the National Natural Science Foundation of People’s Republic of China (grant no 81772760 and no 81572638) and the Natural Science Foundation of Guangdong Province, People’s Republic of China (grant no 2014A030313219). The study did not receive any specific grant from funding agencies in the public, commercial, or not-for-profit sectors.
Disclosure
The authors report no conflicts of interest in this work.
References
Obata H, Ueda T, Kawai A, et al. Clinical outcome of patients with Ewing sarcoma family of tumors of bone in Japan: the Japanese Musculoskeletal Oncology Group cooperative study. Cancer. 2007;109(4):767–775. | ||
Bölling T, Hardes J, Dirksen U. Management of bone tumours in paediatric oncology. Clin Oncol. 2013;25(1):19–26. | ||
Schaefer KL, Eisenacher M, Braun Y, et al. Microarray analysis of Ewing’s sarcoma family of tumours reveals characteristic gene expression signatures associated with metastasis and resistance to chemotherapy. Eur J Cancer. 2008;44(5):699–709. | ||
Biswas B, Bakhshi S. Management of Ewing sarcoma family of tumors: Current scenario and unmet need. World J Orthop. 2016;7(9):527–538. | ||
Hayashi M, Chu D, Meyer CF, et al. Highly personalized detection of minimal Ewing sarcoma disease burden from plasma tumor DNA. Cancer. 2016;122(19):3015–3023. | ||
Gaspar N, Hawkins DS, Dirksen U, et al. Ewing Sarcoma: Current Management and Future Approaches Through Collaboration. J Clin Oncol. 2015;33(27):3036–3046. | ||
Subbiah V, Kurzrock R. Ewing’s sarcoma: overcoming the therapeutic plateau. Discov Med. 2012;13(73):405–415. | ||
Paulussen M, Ahrens S, Craft AW, et al. Ewing’s tumors with primary lung metastases: survival analysis of 114 (European Intergroup) Cooperative Ewing’s Sarcoma Studies patients. J Clin Oncol. 1998;16(9):3044–3052. | ||
Bacci G, Ferrari S, Longhi A, et al. Therapy and survival after recurrence of Ewing’s tumors: the Rizzoli experience in 195 patients treated with adjuvant and neoadjuvant chemotherapy from 1979 to 1997. Ann Oncol. 2003;14(11):1654–1659. | ||
Fu J, Jiang H, Wu C, Jiang Y, Xiao L, Tian Y. Overcoming cetuximab resistance in Ewing’s sarcoma by inhibiting lactate dehydrogenase-A. Mol Med Rep. 2016;14(1):995–1001. | ||
Scotlandi K, Remondini D, Castellani G, et al. Overcoming resistance to conventional drugs in Ewing sarcoma and identification of molecular predictors of outcome. J Clin Oncol. 2009;27(13):2209–2216. | ||
Savola S, Klami A, Myllykangas S, et al. High Expression of Complement Component 5 (C5) at Tumor Site Associates with Superior Survival in Ewing’s Sarcoma Family of Tumour Patients. ISRN Oncol. 2011;2011:168712. | ||
Gotter AL, Suppa C, Emanuel BS. Mammalian TIMELESS and Tipin are evolutionarily conserved replication fork-associated factors. J Mol Biol. 2007;366(1):36–52. | ||
Fu A, Leaderer D, Zheng T, Hoffman AE, Stevens RG, Zhu Y. Genetic and epigenetic associations of circadian gene TIMELESS and breast cancer risk. Mol Carcinog. 2012;51(12):923–929. | ||
Dong H, Claffey KP, Brocke S, Epstein PM. Expression of phosphodiesterase 6 (PDE6) in human breast cancer cells. Springerplus. 2013;2:680. | ||
Yoshida K, Sato M, Hase T, et al. TIMELESS is overexpressed in lung cancer and its expression correlates with poor patient survival. Cancer Sci. 2013;104(2):171–177. | ||
Chiang YT, Gout PW, Collins CC, Wang Y. Prostate cancer metastasis-driving genes: hurdles and potential approaches in their identification. Asian J Androl. 2014;16(4):545–548. | ||
Elgohary N, Pellegrino R, Neumann O, et al. Protumorigenic role of Timeless in hepatocellular carcinoma. Int J Oncol. 2015;46(2):597–606. | ||
Schepeler T, Lamy P, Hvidberg V, et al. A high resolution genomic portrait of bladder cancer: correlation between genomic aberrations and the DNA damage response. Oncogene. 2013;32(31):3577–3586. | ||
Chi L, Zou Y, Qin L, et al. TIMELESS contributes to the progression of breast cancer through activation of MYC. Breast Cancer Res. 2017;19(1):53. | ||
Young LM, Marzio A, Perez-Duran P, et al. TIMELESS Forms a Complex with PARP1 Distinct from Its Complex with TIPIN and Plays a Role in the DNA Damage Response. Cell Rep. 2015;13(3):451–459. | ||
Liu SL, Lin HX, Lin CY, et al. TIMELESS confers cisplatin resistance in nasopharyngeal carcinoma by activating the Wnt/β-catenin signaling pathway and promoting the epithelial mesenchymal transition. Cancer Lett. 2017;402:117–130. | ||
Yang X, Wood PA, Hrushesky WJ. Mammalian TIMELESS is required for ATM-dependent CHK2 activation and G2/M checkpoint control. J Biol Chem. 2010;285(5):3030–3034. | ||
Kosova AA, Khodyreva SN, Lavrik OI. Role of Glyceraldehyde-3-Phosphate Dehydrogenase (GAPDH) in DNA Repair. Biochemistry. 2017;82(6):643–654. | ||
Colell A, Green DR, Ricci JE. Novel roles for GAPDH in cell death and carcinogenesis. Cell Death Differ. 2009;16(12):1573–1581. | ||
Sheokand N, Malhotra H, Kumar S, et al. Moonlighting cell-surface GAPDH recruits apotransferrin to effect iron egress from mammalian cells. J Cell Sci. 2014;127(Pt 19):4279–4291. | ||
Zheng L, Roeder RG, Luo Y. S phase activation of the histone H2B promoter by OCA-S, a coactivator complex that contains GAPDH as a key component. Cell. 2003;114(2):255–266. | ||
Kim S, Lee J, Kim J. Regulation of oncogenic transcription factor hTAF(II)68-TEC activity by human glyceraldehyde-3-phosphate dehydrogenase (GAPDH). Biochem J. 2007;404(2):197–206. | ||
Harada N, Yasunaga R, Higashimura Y, et al. Glyceraldehyde-3-phosphate dehydrogenase enhances transcriptional activity of androgen receptor in prostate cancer cells. J Biol Chem. 2007;282(31):22651–22661. | ||
Demarse NA, Ponnusamy S, Spicer EK, et al. Direct binding of glyceraldehyde 3-phosphate dehydrogenase to telomeric DNA protects telomeres against chemotherapy-induced rapid degradation. J Mol Biol. 2009;394(4):789–803. | ||
Krynetski EY, Krynetskaia NF, Gallo AE, Murti KG, Evans WE. A novel protein complex distinct from mismatch repair binds thioguanylated DNA. Mol Pharmacol. 2001;59(2):367–374. | ||
Asteriti IA, Giubettini M, Lavia P, Guarguaglini G. Aurora-A inactivation causes mitotic spindle pole fragmentation by unbalancing microtubule-generated forces. Mol Cancer. 2011;10:131. | ||
Barr AR, Gergely F. Aurora-A: the maker and breaker of spindle poles. J Cell Sci. 2007;120(Pt 17):2987–2996. | ||
Marumoto T, Zhang D, Saya H. Aurora-A – a guardian of poles. Nat Rev Cancer. 2005;5(1):42–50. | ||
Fu J, Bian M, Jiang Q, Zhang C. Roles of Aurora kinases in mitosis and tumorigenesis. Mol Cancer Res. 2007;5(1):1–10. | ||
Schvartzman JM, Sotillo R, Benezra R. Mitotic chromosomal instability and cancer: mouse modelling of the human disease. Nat Rev Cancer. 2010;10(2):102–115. | ||
Tong T, Zhong Y, Kong J, et al. Overexpression of Aurora-A contributes to malignant development of human esophageal squamous cell carcinoma. Clin Cancer Res. 2004;10(21):7304–7310. | ||
Landen CN, Lin YG, Immaneni A, et al. Overexpression of the centrosomal protein Aurora-A kinase is associated with poor prognosis in epithelial ovarian cancer patients. Clin Cancer Res. 2007;13(14):4098–4104. | ||
Lin Y-C, Hour T-C, Tsai Y-C, et al. Preliminary evidence of polymorphisms of cell cycle regulatory genes and their roles in urinary tract urothelial cancer susceptibility and prognosis in a Taiwan population. Urol Oncol. 2017;35(9):543.e7–543.e16. | ||
Royce ME, Xia W, Sahin AA, et al. STK15/Aurora-A expression in primary breast tumors is correlated with nuclear grade but not with prognosis. Cancer. 2004;100(1):12–19. | ||
Ummanni R, Mannsperger HA, Sonntag J, et al. Evaluation of reverse phase protein array (RPPA)-based pathway-activation profiling in 84 non-small cell lung cancer (NSCLC) cell lines as platform for cancer proteomics and biomarker discovery. Biochim Biophys Acta. 2014;1844(5):950–959. | ||
Zheng X, Chi J, Zhi J, et al. Aurora-A-mediated phosphorylation of LKB1 compromises LKB1/AMPK signaling axis to facilitate NSCLC growth and migration. Oncogene. 2018;37(4):502–511. | ||
Chen MW, Hua KT, Kao HJ, et al. H3K9 histone methyltransferase G9a promotes lung cancer invasion and metastasis by silencing the cell adhesion molecule Ep-CAM. Cancer Res. 2010;70(20):7830–7840. | ||
Hsiao SM, Chen MW, Chen CA, et al. The H3K9 Methyltransferase G9a Represses E-cadherin and is Associated with Myometrial Invasion in Endometrial Cancer. Ann Surg Oncol. 2015;22(Suppl 3):1556–1565. | ||
Wei L, Chiu DK, Tsang FH, et al. Histone methyltransferase G9a promotes liver cancer development by epigenetic silencing of tumor suppressor gene RARRES3. J Hepatol. 2017;67(4):758–769. | ||
Zhong X, Chen X, Guan X, et al. Overexpression of G9a and MCM7 in oesophageal squamous cell carcinoma is associated with poor prognosis. Histopathology. 2015;66(2):192–200. | ||
Chen MW, Hua KT, Kao HJ, et al. H3K9 histone methyltransferase G9a promotes lung cancer invasion and metastasis by silencing the cell adhesion molecule Ep-CAM. Cancer Res. 2010;70(20):7830–7840. | ||
Kim Y, Kim YS, Kim DE, et al. BIX-01294 induces autophagy-associated cell death via EHMT2/G9a dysfunction and intracellular reactive oxygen species production. Autophagy. 2013;9(12):2126–2139. | ||
Casciello F, Windloch K, Gannon F, Lee JS. Functional Role of G9a Histone Methyltransferase in Cancer. Front Immunol. 2015;6:487. | ||
Lin X, Huang Y, Zou Y, Chen X, Ma X. Depletion of G9a gene induces cell apoptosis in human gastric carcinoma. Oncol Rep. 2016;35(5):3041–3049. | ||
Cha ST, Tan CT, Chang CC, et al. G9a/RelB regulates self-renewal and function of colon-cancer-initiating cells by silencing Let-7b and activating the K-RAS/β-catenin pathway. Nat Cell Biol. 2016;18(9):993–1005. | ||
Luo CW, Wang JY, Hung WC, et al. G9a governs colon cancer stem cell phenotype and chemoradioresistance through PP2A-RPA axis-mediated DNA damage response. Radiother Oncol. 2017;124(3):395–402. |
 © 2018 The Author(s). This work is published and licensed by Dove Medical Press Limited. The
full terms of this license are available at https://www.dovepress.com/terms
and incorporate the Creative Commons Attribution
- Non Commercial (unported, 3.0) License.
By accessing the work you hereby accept the Terms. Non-commercial uses of the work are permitted
without any further permission from Dove Medical Press Limited, provided the work is properly
attributed. For permission for commercial use of this work, please see paragraphs 4.2 and 5 of our Terms.
© 2018 The Author(s). This work is published and licensed by Dove Medical Press Limited. The
full terms of this license are available at https://www.dovepress.com/terms
and incorporate the Creative Commons Attribution
- Non Commercial (unported, 3.0) License.
By accessing the work you hereby accept the Terms. Non-commercial uses of the work are permitted
without any further permission from Dove Medical Press Limited, provided the work is properly
attributed. For permission for commercial use of this work, please see paragraphs 4.2 and 5 of our Terms.