")
Back to Journals » Clinical, Cosmetic and Investigational Dermatology » Volume 16
Identification of Dopachrome Tautomerase (DCT) and Kinesin Family Member 1A (KIF1A) as Related Biomarkers and Immune Infiltration Characteristics of Vitiligo Based on Lasso-SVM Algorithms
Authors Zhao Y , Ge K, Zhang R
Received 26 October 2023
Accepted for publication 28 November 2023
Published 6 December 2023 Volume 2023:16 Pages 3509—3520
DOI https://doi.org/10.2147/CCID.S443165
Checked for plagiarism Yes
Review by Single anonymous peer review
Peer reviewer comments 2
Editor who approved publication: Dr Jeffrey Weinberg
Yilu Zhao,1,2,* Kang Ge,3,* Ruzhi Zhang4
1Department of Dermatology, the First Affiliated Hospital of Bengbu Medical University, Bengbu Medical University, Bengbu, Anhui, People’s Republic of China; 2Department of Dermatology, the Third Affiliated Hospital of Soochow University, Changzhou, Jiangsu, People’s Republic of China; 3Department of Dermatology, the Affiliated Hospital of Jiaxing University, the First Hospital of Jiaxing, Jiaxing, Zhejiang, People’s Republic of China; 4Department of Dermatology and STD, the Second Affiliated Hospital of Wannan Medical College, Wuhu, Anhui, People’s Republic of China
*These authors contributed equally to this work
Correspondence: Ruzhi Zhang, Department of Dermatology and STD, the Second Affiliated Hospital of Wannan Medical College, Wuhu, Anhui, 241001, People’s Republic of China, Tel +8618761161826, Email [email protected]
Objective: To identify potential diagnostic markers for vitiligo and determine the significance of immune cell infiltration in pathology.
Methods: Three publicly available gene expression profiles (GSE53146, GSE75819 and GSE65127 datasets) from human vitiligo and control samples were downloaded from the GEO database. Differentially expressed genes (DEGs) were screened between 20 vitiligo and 20 control samples. Logical regression of the selection operator (LASSO) model and support vector machine recursive feature elimination (SVM-RFE) analysis were performed to identify candidate biomarkers. The area under the receiver operating characteristic curve (AUC) value was obtained and was used to evaluate the discriminatory ability. The expression level and diagnostic value of the biomarkers in vitiligo were further validated in the GSE65127 dataset (10 vitiligo patients and 10 healthy controls). Finally, the immune cell infiltration of vitiligo was evaluated by CIBERSORT, and the correlation between biomarkers and infiltrating immune cells was analyzed. The compositional patterns of the 22 types of immune cell fractions in vitiligo were estimated from the pooled cohorts using CIBERSORT. In addition, we established a mouse model of vitiligo with monobenzone and validated the screened biomarkers.
Results: A total of 23 associated DEGs were identified, including 9 up-regulated and 14 down-regulated genes. Subsequently, 17 genes meeting prognostic criteria and 2 common genes (DCT and KIF1A) were obtained by SVM and Venn diagram screening. Immunodifferential analysis showed that microenvironment of vitiligo patients was altered. Finally, the different expression was verified by polymerase chain reaction (PCR).
Conclusion: Biomarkers associated with vitiligo can be screened by comprehensive strategies, and immune cell infiltration plays a key role in the development of vitiligo.
Keywords: vitiligo, predictive biomarker, Lasso-SVM algorithms
Introduction
Considerable progress has been made in understanding of the pathogenesis of vitiligo, which is now classified as an autoimmune disease and is associated with genetic and environmental factors together as well as abnormalities in metabolism, oxidative stress and cell desquamation.1 Histological examination, immunohistochemical studies and biopsy specimens with a wide panel of antibodies generally show an absence or reduction of melanocytes and the presence of a lymphocytic infiltrate in the lesional skin. In addition, large-scale genome-wide association studies performed in Caucasians of European descent and in Chinese have identified nearly 50 different genetic loci that confer a risk of vitiligo.2
As vitiligo is an autoimmune disease with a genetic background, no cure or way of limiting the spread of vitiligo have been reported. Current treatment outcomes vary between individuals and are often unsatisfactory.3 In general, treatment is more effective in newly developed lesions than in older lesions, arguing for early therapeutic intervention.4 In this study, the GEO database was used to screen for biomarkers associated with vitiligo and to analyze the pathological role of immune cell infiltration in the disease, in order to better understand the molecular immune mechanisms involved in vitiligo, and the role of these biomarkers was verified by animal models of vitiligo.
Materials and Methods
Data Acquisition and Preprocessing
Based on the platform of GPL14951 (Illumina Human HT-12 WG-DASL V4.0 R2 expression bead chip), GPL6884 (Illumina Human WG-6 v3.0 expression bead chip) and the GPL570 (Affymetrix Human Genome U133 Plus 2.0 Array), the series of matrix files of the GSE53146, GSE75819 and GSE65127 datasets were obtained from the Gene Expression Omnibus (GEO) database. The GSE53146, GSE75819 and GSE65127 included skin samples from 5 vitiligo patients (VP) and 5 healthy volunteers (HV) in the USA, from 15 VP in India, and from 10 VP and 10 HV in the USA, respectively. The probes in each dataset were converted to gene symbols according to their probe annotation files. For multiple probes corresponding to the same gene symbol, their average was calculated as the final value of the corresponding gene. In addition, the datasets of GSE53146 and GSE75819 were merged into a metadata cohort, as they are significant for combining data from different datasets. The combat function of the “SVA” package of the R software was used to remove the batch effect.
Differentially Expressed Analysis
The limma package of R (http://www.bioconductor.org/) was used for background correction, normalization between arrays, and differential expression analysis in samples of 30 VP and 30 HV. Genes with P-value < 0.05 and absolute log2FC > 0.585 were considered as differentially expressed genes (DEGs). The volcano plots and heat maps were generated using the “heatmap” and “ggplot2” packages of the R software.
Gene Set Enrichment Analysis
Gene ontology (GO) and Kyoto Encyclopedia of Genes and Genomes (KEGG) pathway enrichment analysis was performed using the cluster Profiler package in R to identify the biological functions of DEGs. Disease Ontology (DO) enrichment analyses were performed on the DEGs using the “cluster Profiler” and DOSE packages in R. Gene set enrichment analysis (GSEA) was used to identify the most significant functional differences between the two groups of samples. Gene clusters were considered significant if P<0.05 or the false discovery rate was less than 0.025.
Candidate Diagnostic Biomarker Screening
Three machine learning methods were used to predict patients’ conditions by identifying key prognostic variables. The Least Absolute Compression and Selection Operation (LASSO) is a new method to improve prediction accuracy through regularization methods. In R, the LASSO regression algorithm uses “glmnet” grouping to identify genetic factors that are significantly associated with vitiligo and common samples. Support vector machine (SVM) is one of the most widely used supervised machine learning methods. RFE methods were used to optimize the metadata sequences to avoid repetitive screening. For this purpose, suitable features were screened using SVM- RFE (SVM-RFE) to identify the set of gene banks with the highest recognition capability. The random tree algorithm was implemented using the R software “randomForest”. Finally, the intersection points were obtained using the Venn diagram package.
Dataset Validation
The receiver operating characteristic curve is often used to diagnose disease, predict tumor recurrence and predict treatment response. By comparing the area under the curve (AUC), the best diagnostic value can be determined. In this study, the hub genes were verified using the GSE65127 dataset. The pROC package of R was used for calculation and mapping, and genes with an AUC > 0.8 were selected.
Discovery of Immune Cell Subtypes
To quantify the invasive rate of immune cells in vitiligo, a bioinformatics algorithm called CIBERSORT (https://cibersortx.stanford.edu/) was used. The number of immune cells was estimated using a reference system of 22 isoforms (LM22) for 1000 permutations. Twenty-two infiltrating immune cells were correlated using the R software “corrplot”. The graphs show the infiltration of immune cells in vitiligo and control samples.
Analysis of the Correlation Between Identified Genes and Infiltrating Immune Cells
The R software Spearman’s hierarchical correlation was used to investigate the relationship between identified genetic markers and invading immune cells. Correlations were generated using the graphical technique in the “ggplot2” suite.
Establishment of Mouse Vitiligo Model and Experimental Design
Male C57 mice, 22–24 g, 4 weeks old, were purchased from Ltd. in Jiangsu, China. After 1 week of acclimatization, they were randomly divided into experimental and control groups (n= 6 per group). To induce vitiligo models, 40% monobenzyl ether of hydroquinone (MBEH) cream was topically applied to the shaved dorsal skin of the mice, while the control group was treated with petrolatum. The backs of the mice were shaved every 2–3 days so that MBEH was applied to skin other than the fur. Most of the mice in the experimental group began to develop depigmentation from day 20, and all developed overt vitiligo by 30 days.
HE Staining
Mouse skin tissues were fixed in 4% methylal solution overnight, then embedded in paraffin and cut into approximately 3 mm thick slices, which subjected to dewaxing, dehydration, HE staining, dehydration, transparency and sealing with neutral gum. Inflammatory cell infiltration in the skin tissues was observed and recorded under light l microscopy.
Real-Time Quantitative PCR (qPCR)
Total RNA from skin tissues of vitiligo lesions in mice was extracted using the Trizol (Sigma-Aldrich) method, reverse transcribed into cDNA using the Takara kit, and fluorescence quantitative detection of related gene expression was performed using the Roche LightCycler 480qPCR system. The forward and reverse primer sequences were as follows: DCT forward sequence: GCAAGATTGCCTGTCTCTCCAG, DCT Reverse Sequence: CTTGAGAGTCCAGTGTTCCGTC; KIF1A Forward Sequence: CGCTGACATCTTCTGCCAGTTC, KIF1A Reverse Sequence: CGATGAAGGACTTGGTCACCTC. Data analysis was calculated using the 2−∆∆Ct method.
Statistical Analysis
All values are presented as mean ± standard error and analyzed by Student’s t-test and one-way Wilcoxon rank sum test. All experiments were performed at least three times.
Results
Identification of DEGs in Vitiligo
Data from 30 VP and 30 HV from three GEO datasets (GSE53146, GSE75819, andGSE65127) were analyzed. DEGs from the metadata were analyzed using the limma package after removing batch effects. A total of 23 DEGs were obtained, including 9 up-regulated and 14 down-regulated genes. (Figure 1).
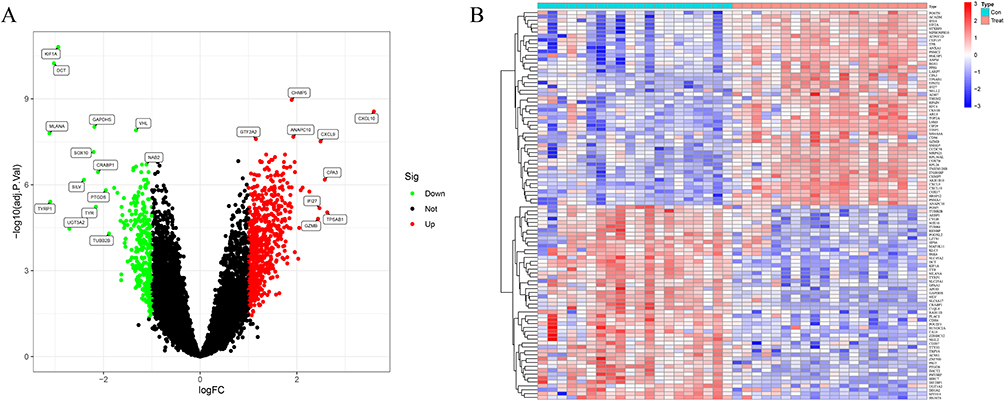 |
Figure 1 Differentially expressed genes in normal and vitiligo samples. (A) Volcano plot of the differentially expressed genes. The red dots represent the significantly upregulated genes and the green dots represent the significantly downregulated genes. (B) Heatmap of the DEGs. |
Functional Correlation Analysis
Vitiligo-related DEGs (VRDEGs) were first analyzed by GO enrichment, KEGG and DO pathway enrichment. As a result, 205 biological processes, 10 signalling pathways, and 127 diseases were significantly enriched. The biological processes were enriched for proteasomal protein catabolic process, ribonucleoprotein complex biogenesis and viral process. The matrix, inner membrane, protein-containing complex of mitochondria and ribosome were enriched. In addition, significant enrichment was observed in cadherin binding, ribosome structural components and transcriptional co-regulator activity in molecular function (Figure 2A). KEGG analysis revealed enrichment of pathways in neurodegenerative multiple diseases, Alzheimer’s disease and amyotrophic lateral sclerosis (Figure 2B). Vitiligo, female reproductive organ carcinoma, hepatitis and renal cell carcinoma were significantly enriched in DO analysis (Figure 2C). In addition, the enrichment difference between the vitiligo and control groups was further investigated using gene set enrichment analysis (GSEA). Cell cycle, oxidative phosphorylation, parkinsons disease, proteasome and ribosome were significantly enriched in the vitiligo group. Acute myeloid leukaemia, axon guidance, basal cell carcinoma, lysosome and melanogenesis were significantly enriched in the control group (Figure 2D and E).
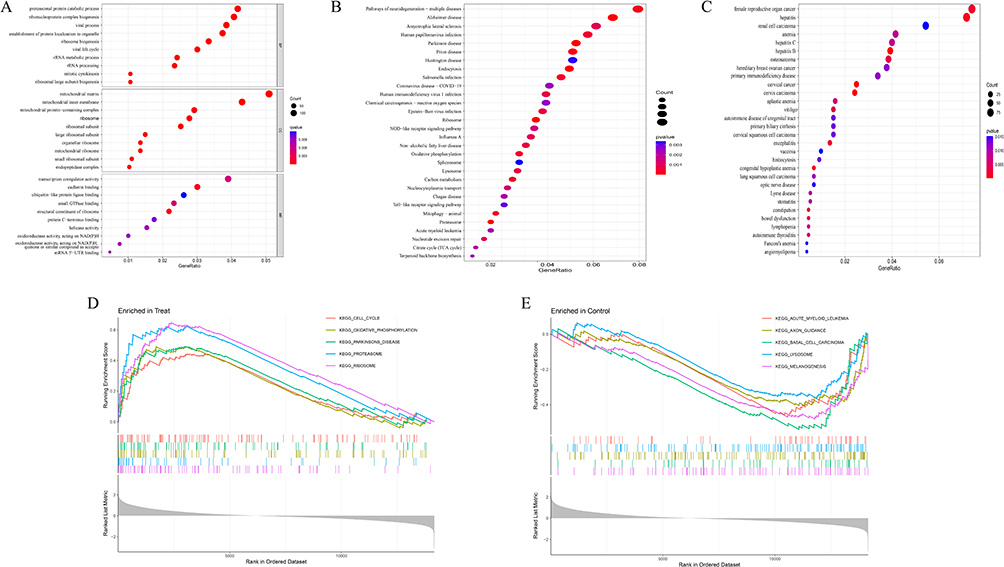 |
Figure 2 Enrichment analysis of differentially expressed genes (A) GO enrichment analysis; (B) KEGG enrichment analysis; (C) Disease Ontology enrichment analysis; (D and E) GSEA enrichment analysis. |
Identification and Validation of Diagnostic Feature Biomarkers
Two methods were used to identify possible biological markers of vitiligo. LASSO regression was used to study the application of VRDEGs, and 17 biochemical indicators that could be used in the diagnosis of vitiligo were identified (Figure 3A). VRDEGs were identified using the SVM-RFE method for four feature points (Figure 3B). Finally, an intersection of the two algorithms and two related metalloproteinases (Figure 3C), DCT and KIF1A were obtained. We then evaluated the accuracy of the related genes selected by machine learning as disease diagnostic genes by ROC curve (Figure 3D and E). The AUC values of the two related genes were 0.998 (95% CI 0.985–1.000), indicating high sensitivity and specificity.
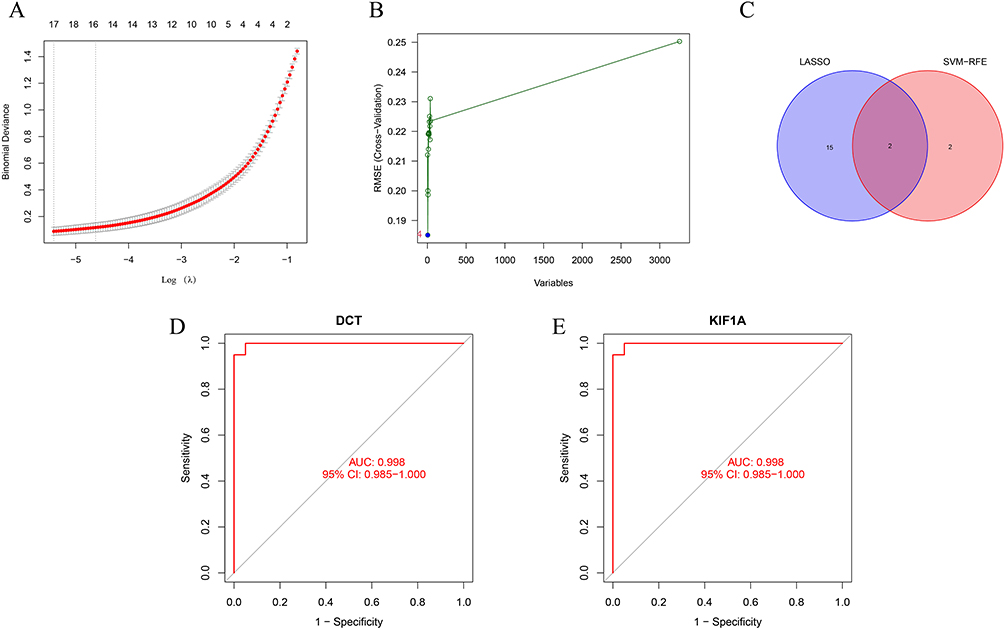 |
Figure 3 Two algorithms were used for feature selection: Lasso (A) and SVM-RFE (B) algorithms. (A) LASSO coefficient profiles of the 17 genes that initially met the prognostic criteria; (B) A plot of biomarkers selection by support vector machine recursive feature elimination (SVM-RFE) algorithm; (C) Venn diagram showing two diagnostic markers shared by LASSO and SVM-RFE algorithms: DCT and KIF1A; (D–E) The receiver operating characteristic curve of the diagnostic efficacy of the two diagnostic markers. ROC curve of DCT and KIF1A after fitting to a variable in the metadata cohort. |
Identification and Validation of Diagnostic Biomarkers
The GSE65127 dataset was used to evaluate the accuracy and reliability of the generated results, which showed that the expression levels of DCT and KIF1A in vitiligo tissues were significantly higher than those in the control group (Figures 4A and B; all P < 0.05). The AUC representing diagnostic ability of the two biomarkers combined, was 1.000 (95% CI 1.000–1.000; Figures 4C and D), suggesting that DCT and KIF1A had a high value for diagnosis of vitiligo.
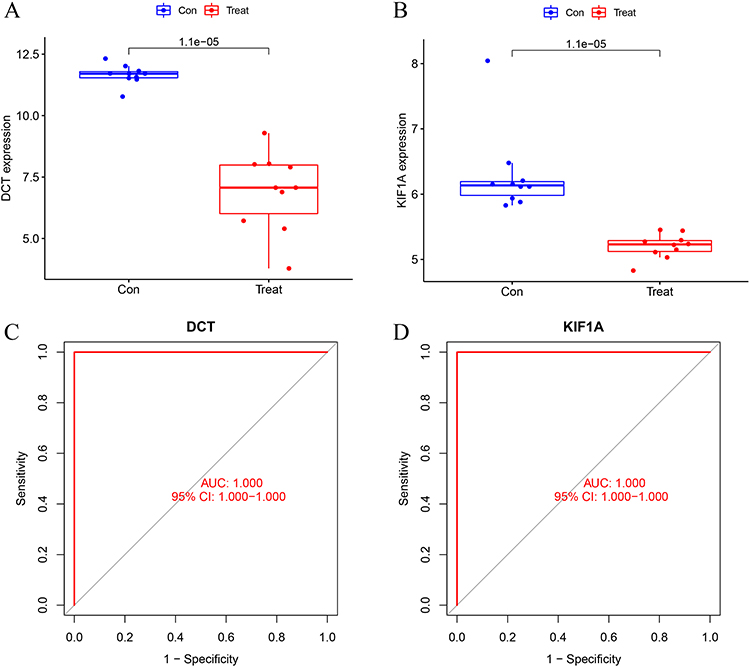 |
Figure 4 Validation of diagnostic biomarker expression in the GSE65127 dataset. (A) DCT; (B) KIF1A. (C and D) ROC curve of DCT and KIF1A after fitting to a variable in the GSE65127 dataset. |
Immune Cell Infiltration
The analyzed results were mapped to show the distribution of immune cells in the tissues (Figure 5A) and correlation analysis was performed to investigate the correlation between the immune cells and vitiligo (Figure 5C). The proportions of regulatory T cells (Tregs) (P < 0.001), macrophages (P = 0.045) and activated dendritic cells (P = 0.011) were significantly lower, and of CD4 memory T cells (P < 0.001), γδ T cells (P = 0.011), macrophages M1 (P < 0.001), mastocytes (P = 0.006) were significantly higher in the vitiligo tissues than those in the normal tissues (Figure 5B).
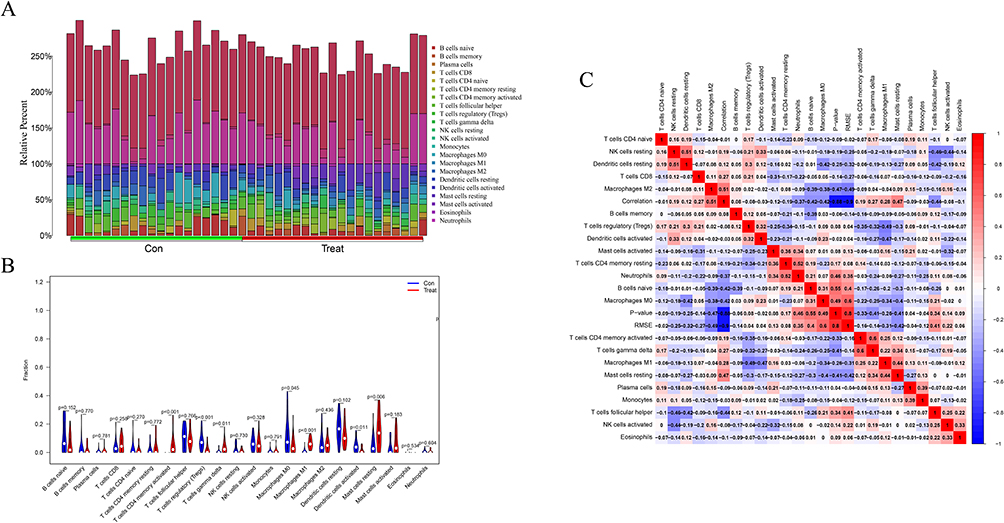 |
Figure 5 Analysis of immune infiltration. (A) Immune cell distribution map; (B) Expression of immune cells between vitiligo and normal patients; (C) Correlation of immune cells between vitiligo and normal patients. |
Correlation Analysis Between Identified Genes and Infiltrating Immune Cells
The correlation between the two biological markers and each immune cell was further investigated (Figure 6A-F, Figure 7A-G). That all significantly correlated positively with T cells regulatory and activated dendritic cells, and negatively with macrophages M1, T cells CD4 memory activated and T cells gamma delta (Figure 8A and B).
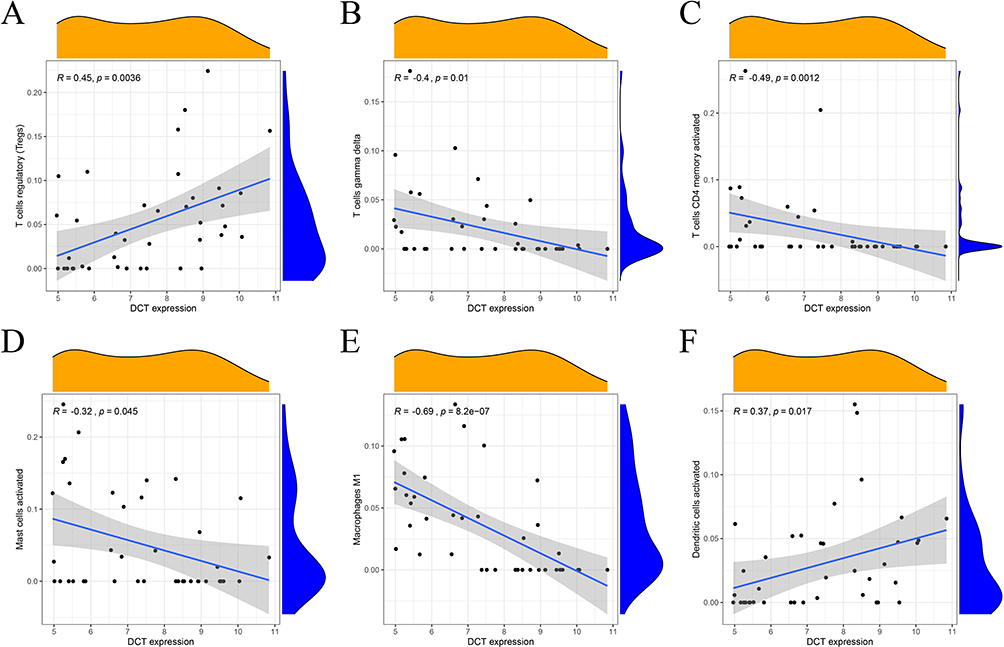 |
Figure 6 Correlation between DCT and immune cells (A) regulatory T cells; (B) gamma delta T cells; (C) CD4 memory activated T cells; (D) activated mast cells; (E) macrophages M; (F) activated dendritic cells. |
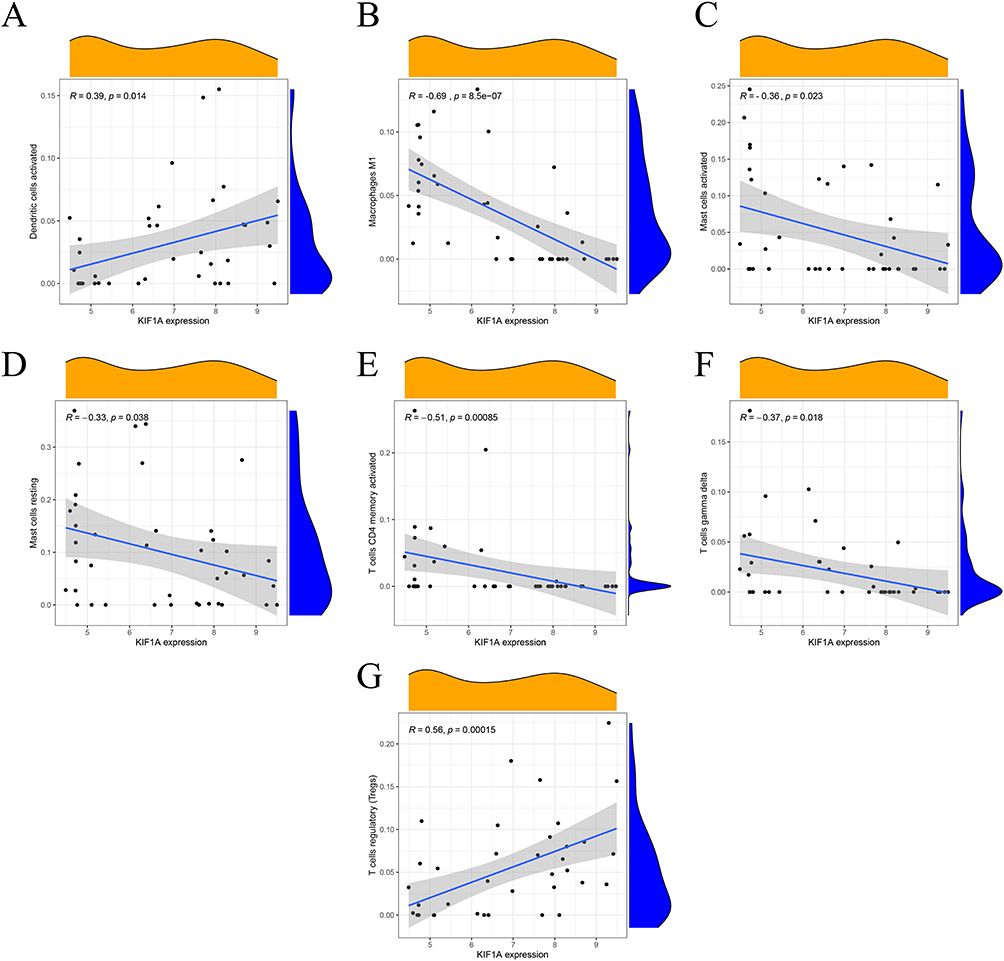 |
Figure 7 Correlation between KIF1A and immune cells (A) activated dendritic cells; (B) M1 macrophages; (C) activated mast cells; (D) resting mast cells; (E) CD4 memory activated T cells; (F) gamma delta T cells; (G) regulatory T cells. |
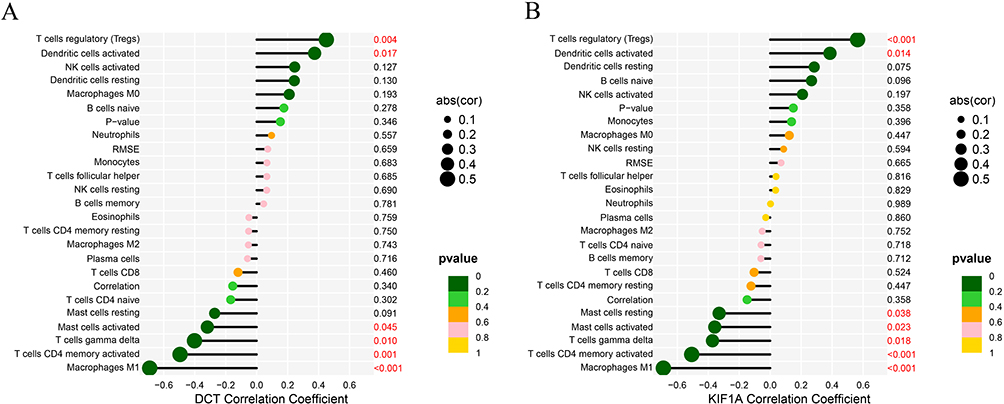 |
Figure 8 Correlation between DCT(A), KIF1A (B) and infiltrating immune cells in vitiligo. |
Vitiligo Model Evaluation and Histological Identification
After topical application of monobenzone, white spots appeared first at the drug exposure site, mainly manifested as white hairs, and the white patches gradually expanded with time. Finally, white spots were observed in some non-drug sites of the mice (Figure 9A). The results of HE staining under light microscope showed that the epidermis of the monobenzone-induced vitiligo model group of mice showed local epidermis thickening, more inflammatory cell infiltration in the superficial dermis, some hair follicles were abnormal and dysplasia, and the number of melanin-containing hair follicles was significantly reduced (Figure 9B). These results demonstrate that we have successfully established a monobenzone-induced vitiligo mouse model.
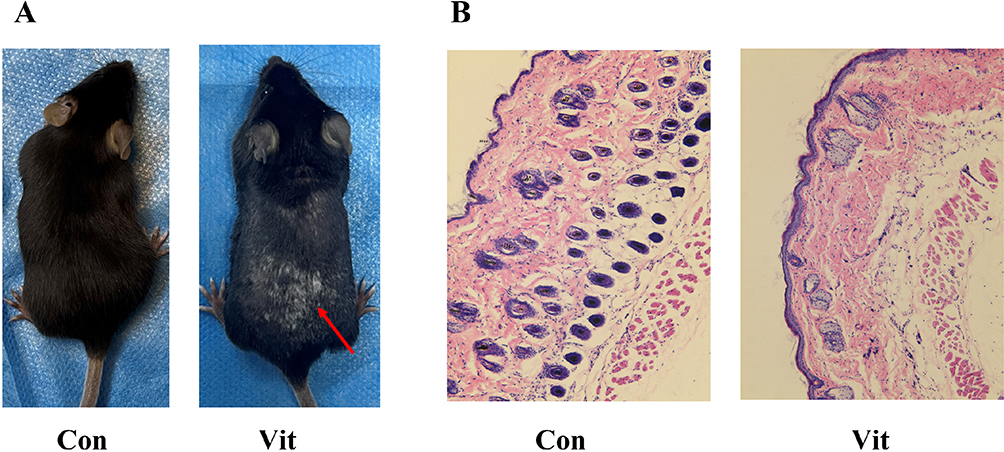 |
Figure 9 (A) Vitiligo mouse models: the red arrows indicate the MBEH application site, where the hair is significantly whitened. (B) HE staining results: the number of hair follicles in the control group was significantly higher than that in the vitiligo group; the distribution of melanin around the hair follicle was obvious. |
Validation of Diagnostic Feature Biomarkers
We also identified changes in the levels of KIF1A and DCT genes in vitiligo models. Compared with the control group, the protein expression levels of KIF1A and DCT were significantly increased in the monobenzone group, suggesting that these KIF1A and DCT play a role in the construction of the vitiligo mouse model by monobenzone (Figure 10).
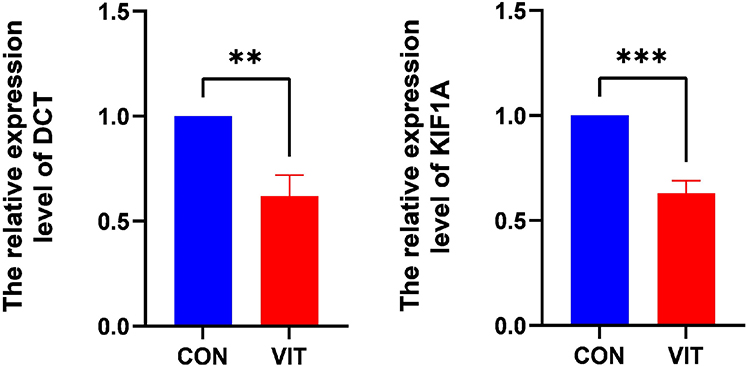 |
Figure 10 Validation of the differential expression of DCT and KIF1A. ** P < 0.01; *** P < 0.001. |
Discussion
Vitiligo is a common immune-mediated depigmented disease, characterized by chalky-white macules or patches.5,6 In clinical practice, vitiligo can be classified as active or stable and is divided into three types based on the distribution of the lesions, namely generalized, segmental and localized patterns, and it is easy to diagnose but with a long treatment cycle and unpredictable course.1,3 Although vitiligo has little impact on physical health, it seriously affects the quality of life of individuals life in terms of physical, social, psychological and occupational aspects. Therefore, it is necessary to identify new and accurate biomarkers of vitiligo. To achieve this goal, this study used bioinformatics to scientifically analyze the sequencing information of patients, screen out the core genes, identify markers that are predictive of disease onset and progression, and provide a theoretical basis for understanding pathogenesis and molecular targeted therapies.
Dopachrome tautomerase (DCT), another name for TRRP2, is part of the tyrosinase complex, and mutations in TRP-2 cause changes in melanin.7 Much literature has shown that DCT plays an important role in altering the structure and composition of melanin.8 Kinesin, the smallest molecular motor known, catalyzes the hydrolysis of adenosine triphosphate (ATP), efficiently converting the chemical energy carried by ATP molecules into mechanical energy, resulting in a continuous step along the microtubules and the transport of the organelles and intracellular material they carry.9 Kinesins are a large superfamily of motor proteins (KIF superfamily). Kinesin family member 1A (KIF1A) belongs to the kinesin-3 family and is commonly found as a monomer in the body, whose function is to transport different types of cargo from the neuronal soma to the synapses, moving them in an anterograde direction along microtubules.10 KIF1A is a potential diagnostic marker for Hereditary spastic paraplegia (HSP), head and neck squamous cell carcinoma (HNSCC), oral squamous cell carcinomas (OSCC), breast cancer (BC), nasopharyngeal carcinoma (NPC), etc.11–13 However, the function of KIF1A has not been established in vitiligo.
In this study, we used LASSO regression and SVM-RFE method to identify possible biological markers, 17 vitiligo-related predictors from VRDEGs were detected by LASSO regression and 4 biochemical indicators were identified by SVM-RFE method. The intersection of the genes obtained by the two methods was then performed to obtain DCT and KIF1A. The ROC curve and AUC area further indicated their high reliability as biomarkers.
For this reason, the CIBERSORT program was used in the current study to analyze the immune infiltration process that occurs in vitiligo and to study the correlation between these two biometric factors and immune cells. The results showed that macrophage infiltration is present in vitiligo lesions and surrounding skin, and that macrophages are involved in melanocyte clearance. In addition, Treg cells belong to a subgroup of CD4+ T cells, and the impaired number and function of Treg cells are closely related to the immune tolerance of vitiligo patients.4,14
Local inflammation in vitiligo lesions can activate NK cells and drive an adaptive immune response by releasing pro-inflammatory cytokines. NK cells are cytotoxic and can affect the antigen presentation of dendritic cells and promote their function and maturation.15 In addition, the results showed that DCT and KIF1A were significantly correlated with a variety of changes in immune cell infiltration, and the correlation trend of DCT and KIF1A with these immune cells was the same. This led us to speculate that DCT and KIF1A may be involved in the development of vitiligo through an immune response. Although KIF1A has not been extensively studies in vitiligo, it has the potential to serve as an effective new diagnostic indicator, predictor or therapeutic target after further validation.
However, there are still some limitations to this study. The sample size we used was small and the results may have limitations, although we used another dataset for validation. Secondly, this study is based on bioinformatics, the CIBERSORT analysis is based on limited genetic data, and the analysis of immune cell infiltration is still limited. Although the results of some previous studies are consistent with our analysis, the reliability of the research results needs to be verified by further experiments.
Conclusion
In summary, our investigation has identified DCT and KIF1A as biomarkers associated with vitiligo in the cohort studied. In addition, we have identified a correlation between the manifestation of vitiligo and immune cell types including CD4 T cells, CD8 T cells, Tregs, NK cells, dendritic cells, and macrophages. These immune cell populations appear to have a notable influence on the progression of vitiligo. However, it is important to acknowledge the limitations of our study, which are largely due to the bioinformatics methodology and the limited genetic data included in the CIBERSORT analysis. Consequently, the conclusions drawn require careful interpretation, and future investigations should delve deeper into unraveling the intricate interactions between infiltrating immune cells. This more in-depth investigation promises to make significant contribution to delineating precise immunotherapy targets for vitiligo and improving immunomodulatory strategies for people living with this condition.
Data Sharing Statement
The datasets presented in this study can be found in online repositories.
Ethics Statement
The study was approved by the Ethics Committee of the Third Affiliated Hospital of Soochow University and followed the Soochow University Experimental Animal Management Guidelines (Approval No. 2023-046).
Acknowledgments
We are grateful to the GEO database for providing its platforms and to contributors for uploading their powerful datasets.
Author Contributions
All authors have made a substantial contribution to the work reported, be it in conception, design, conduct, acquisition of data, analysis and interpretation, or all of these; have been involved in drafting, revising, or critically reviewing the article; have given final approval for the version to be published; have agreed on the journal to which the article will be submitted; and agree to accept responsibility for all aspects of the work.
Funding
This work was supported by the Frontier Technology of Cell Therapy Foundation of Changzhou Xitaihu, Grant/Award Number: 2022-P-014, and by the Graduate Research Innovation Programme of Bengbu Medical College (Byycx21088) and the Postgraduate Academic Innovation Project in Anhui Province (2022xscx123).
Disclosure
The authors declare that the research was conducted in the absence of any commercial or financial relationship that could be construed as a potential conflict of interest.
References
1. Bergqvist C, Ezzedine K. Vitiligo: a Review. Dermatology. 2020;236(6):571–592. doi:10.1159/000506103
2. Bibeau K, Pandya AG, Ezzedine K, et al. Vitiligo prevalence and quality of life among adults in Europe, Japan and the USA. J Eur Acad Dermatol Venereol. 2022;36(10):1831–1844. doi:10.1111/jdv.18257
3. Ezzedine K, Eleftheriadou V, Whitton M, van Geel N. Vitiligo. Lancet. 2015;386(9988):74–84. doi:10.1016/S0140-6736(14)60763-7
4. Frisoli ML, Essien K, Harris JE. Vitiligo: mechanisms of Pathogenesis and Treatment. Annu Rev Immunol. 2020;38(1):621–648. doi:10.1146/annurev-immunol-100919-023531
5. Hamzavi IH, Bibeau K, Grimes P, et al. Exploring the natural and treatment history of vitiligo: patient and healthcare professional perceptions from the global VALIANT study. Br J Dermatol. 2023;189(5):569–577. doi:10.1093/bjd/ljad245
6. LeWitt TM, Kundu RV. Vitiligo. JAMA Dermatol. 2021;157(9):1136. doi:10.1001/jamadermatol.2021.1688
7. Avogadri F, Gnjatic S, Tassello J, et al. Protein Expression Analysis of Melanocyte Differentiation Antigen TRP-2. Am J Dermatopathol. 2016;38(3):201–207. doi:10.1097/DAD.0000000000000362
8. Salinas-Santander M, Trevino V, De la Rosa-Moreno E, et al. CAPN3, DCT, MLANA and TYRP1 are overexpressed in skin of vitiligo vulgaris Mexican patients. Exp Ther Med. 2018;15(3):2804–2811. doi:10.3892/etm.2018.5764
9. Lo KY, Kuzmin A, Unger SM, Petersen JD, Silverman MA. KIF1A is the primary anterograde motor protein required for the axonal transport of dense-core vesicles in cultured hippocampal neurons. Neurosci Lett. 2011;491(3):168–173. doi:10.1016/j.neulet.2011.01.018
10. Hammond JW, Cai D, Blasius TL, et al. Mammalian Kinesin-3 motors are dimeric in vivo and move by processive motility upon release of autoinhibition. PLoS Biol. 2009;7(3):e1000072. doi:10.1371/journal.pbio.1000072
11. Lu X, Li G, Liu S, Wang H, Zhang Z, Chen B. Bioinformatics Analysis of KIF1A Expression and Gene Regulation Network in Ovarian Carcinoma. Int J Gen Med. 2021;14:3707–3717. doi:10.2147/IJGM.S323591
12. Vale RD. The molecular motor toolbox for intracellular transport. Cell. 2003;112(4):467–480. doi:10.1016/S0092-8674(03)00111-9
13. Montenegro-Garreaud X, Hansen AW, Khayat MM, et al. Phenotypic expansion in KIF1A-related dominant disorders: a description of novel variants and review of published cases. Hum Mutat. 2020;41(12):2094–2104. doi:10.1002/humu.24118
14. Bergqvist C, Ezzedine K. Vitiligo: a focus on pathogenesis and its therapeutic implications. J Dermatol. 2021;48(3):252–270. doi:10.1111/1346-8138.15743
15. Zloza A, Lyons GE, Chlewicki LK, et al. Engagement of NK receptor NKG2D, but not 2B4, results in self-reactive CD8+ T cells and autoimmune vitiligo. Autoimmunity. 2011;44(8):599–606. doi:10.3109/08916934.2011.593599
 © 2023 The Author(s). This work is published and licensed by Dove Medical Press Limited. The full terms of this license are available at https://www.dovepress.com/terms.php and incorporate the Creative Commons Attribution - Non Commercial (unported, v3.0) License.
By accessing the work you hereby accept the Terms. Non-commercial uses of the work are permitted without any further permission from Dove Medical Press Limited, provided the work is properly attributed. For permission for commercial use of this work, please see paragraphs 4.2 and 5 of our Terms.
© 2023 The Author(s). This work is published and licensed by Dove Medical Press Limited. The full terms of this license are available at https://www.dovepress.com/terms.php and incorporate the Creative Commons Attribution - Non Commercial (unported, v3.0) License.
By accessing the work you hereby accept the Terms. Non-commercial uses of the work are permitted without any further permission from Dove Medical Press Limited, provided the work is properly attributed. For permission for commercial use of this work, please see paragraphs 4.2 and 5 of our Terms.