
Back to Journals » Breast Cancer: Targets and Therapy » Volume 18
Identification of circRNA/lncRNA-miRNA-Transcription Factor-mRNA Networks to Identify Potential Biomarkers in Response to Neoadjuvant Therapy for Breast Cancer
Authors Li D, Zhang Z, Chen Y, Zhao X, He K, Zhang R
Received 7 May 2025
Accepted for publication 16 December 2025
Published 17 January 2026 Volume 2026:18 538948
DOI https://doi.org/10.2147/BCTT.S538948
Checked for plagiarism Yes
Review by Single anonymous peer review
Peer reviewer comments 2
Editor who approved publication: Professor Robert Clarke
Donghai Li,* Zhiying Zhang,* Yibo Chen, Xueyu Zhao, Kunyuan He, Rui Zhang
Department of Thyroid and Breast Surgery, Affiliated Hospital of Inner Mongolia Medical University, Hohhot, Inner Mongolia Autonomous Region, People′s Republic of China
*These authors contributed equally to this work
Correspondence: Rui Zhang, Department of Thyroid and Breast Surgery, Affiliated Hospital of Inner Mongolia Medical University, No. 1 Tongdao North Street, Huiming District, Hohhot, Inner Mongolia Autonomous Region, 010050, People′s Republic of China, Email [email protected]
Background: Neoadjuvant therapy (NAT) is the standard treatment option for locally advanced breast cancer (BC). Noncoding RNAs are known to play a significant role in cancer development. However, the involvement of the circular RNA (circRNA)/long non-coding RNA (lncRNA)–(miRNA)–mRNA competitive endogenous RNA (ceRNA) network in the antitumor effects of NAT in BC remains unclear.
Methods: Ribosomal RNA (rRNA)-depleted RNA sequencing (RNA-seq) was performed to identify differentially expressed lncRNAs (DElncRNAs), circRNAs (DEcircRNAs), mRNAs (DEmRNAs) and transcription factors (DE-TFs) between pre-therapy tumor tissues and adjacent normal tissues, as well as between post-NAT tumor tissues and pre-therapy tumor tissues. The changes in gene expression in the ceRNA network were confirmed by RT-qPCR.
Results: We identified dysregulated RNAs associated with NAT, including 2693 DEcircRNAs, 25 DElncRNAs, 58 DE-TFs, and 878 DEmRNAs. Three core ceRNA networks were constructed bioinformatically, centered on the key DE-TFs, including HOXC11, NKX2-2, and PRAME. RT-qPCR results confirmed a significant increase in the levels of circRNA_31003, circRNA_42276, MIAT, HOXC11, NKX2-2, PRAME, CCL5, NEK2, and RAD54L in tumor tissues before therapy when compared to normal tissues, but these levels decreased in post-NAT tumor group compared to pre-therapy tumor group. In contrast, the expression of miR-1225-3p, miR-661, and miR-143-5p showed a notable decline in pre-therapy tumors in comparison to normal tissues; however, these expressions elevated significantly in post-NAT tumor group compared to pre-therapy tumor group.
Conclusion: Associated regulatory networks were constructed to explore candidate biomarkers that may respond to NAT treatment in BC.
Keywords: breast cancer, neoadjuvant therapy, rRNA-depleted RNA-seq, transcription factors, network
Introduction
Breast cancer (BC) is the most frequently diagnosed malignancy in among women globally.1,2 Recent studies indicate a significant increase in the incidence of BC.3 BC can be classified into several subtypes depending on the expression levels of estrogen receptor (ER), progesterone receptor (PR), and human epidermal growth factor receptor 2 (HER2) in tumor cells: luminal A (ER+, PR+, HER2-), luminal B (ER+, PR±, HER2 +), HER2+ (ER-, PR-, HER2+), and triple-negative breast cancer (TNBC) (ER-, PR-, HER2-).4,5
Traditionally, therapeutic options for treating BC include surgery, chemotherapy, radiation therapy, targeted therapy, and endocrine therapy.3 In recent years, neoadjuvant therapy (NAT), followed by definitive surgery, has become the standard option for early-stage or locally advanced BC, as it enhances the likelihood of breast-conserving surgery.6,7 NAT, also known as preoperative therapy, offers several potential benefits for BC patients: first, it can facilitate tumor downstaging, enabling previously inoperable patients to meet surgical criteria; second, for patients who initially require total mastectomy, NAT enables the possibility of breast-sparing surgery, thereby enhancing surgical outcomes and improving the patient′s quality of life.8 However, it is important to note that not all patients may benefit from NAT. Consequently, identifying biomarkers that may predict responsiveness to NAT is crucial for guiding treatment decisions.
Non-coding RNAs (ncRNAs) comprise a category of RNA molecules that typically do not encode proteins but play crucial roles in regulating cellular signal transduction and biological processes.9 NcRNAs, including long noncoding RNA (lncRNAs), circular RNA (circRNAs), and microRNAs (miRNA), are pivotal in cancer progression.10–12 Yuan et al indicated that BC patients with low circRNA CDR1-AS expression exhibited increased sensitivity to paclitaxel-cisplatin-based neoadjuvant chemotherapy.13 Meanwhile, Sha et al reported a significant association between the expression level of lncRNA LOC100505851 and a higher pathological complete response rate after NAT as well as improved relapse-free survival and overall survival in BC patients.14 These findings suggest a potential relationship between circRNA/lncRNAs and the response to NAT treatment in BC patients.
Mechanistically, both lncRNAs and circRNAs can function as competitive endogenous RNAs (ceRNAs) by binding to miRNAs, thus influencing the effects of miRNAs on target genes.15 Nevertheless, the involvement of circRNA/lncRNA-miRNA axes in the antitumor efficacy of NAT for BC is still unknown. Therefore, this study aims to identify and validate circRNA/lncRNA–miRNA–mRNA ceRNA networks associated with the response to NAT in BC, thereby providing a novel perspective for BC research.
Materials and Methods
Clinical Samples
Eighteen paired tumor tissues (pre-therapy tumor tissues) and adjacent normal tissues were obtained from eighteen patients with BC who underwent surgery at the Affiliated Hospital of Inner Mongolia Medical University. The inclusion criteria were as follows: (1) all participants met the diagnostic criteria for BC, which was confirmed through pathological examination; (2) complete patient clinicopathological information was provided; (3) complete clinical and imaging data were available; and (4) no patient had a history of other malignant tumors. The exclusion criteria were as follows: (1) patients who were clinically diagnosed with BC without biopsy for pathological diagnosis, and (2) patients who had undergone treatment for cancer.
Furthermore, eighteen tumor samples (post-NAT tumor tissues) were collected from three BC patients who received neoadjuvant therapy before tissue resection. The inclusion criteria were as follows: (1) patients diagnosed clinically and pathologically as locally advanced (American Joint Committee on Cancer [AJCC] Stage III) (except T3N1M0); (2) patients who could undergo surgery but did not meet the requirements for preservation of the breast and armpit; (3) patients with clinically positive lymph nodes and tumor size > 2 cm; and (4) no family history of malignant tumors and no organ failure. The exclusion criteria were as follows: (1) inability to tolerate chemotherapy, (2) patients who had uncontrollable and serious infections, and (3) patients who had serious underlying disease. This study was approved by the Ethics Committee of the Affiliated Hospital of Inner Mongolia Medical University (approval number: YJS2024055), in accordance with the Declaration of Helsinki. Written informed consent was obtained from all patients.
NAT Plan
HER2 negative/ER positive BC patient received 8 cycles (21 days/cycle) of chemotherapy consisting of cyclophosphamide, epirubicin, paclitaxel, and docetaxel. During the first four cycles of chemotherapy, patients received chemotherapy with epirubicin (100 mg/m2) and cyclophosphamide (600 mg/m2). During the final four chemotherapy treatment cycles, patients received docetaxel (100 mg/m2) or paclitaxel (80 mg/m2). After 8 cycles of neoadjuvant chemotherapy, the patients underwent surgery.
HER2 positive BC patient received 6 cycles of chemotherapy consisting of paclitaxel (80 mg/m2) or docetaxel (100 mg/m2), carboplatin (carboplatin dose was based on the area under the plasma concentration–time curve of 6), trastuzumab (8 mg/kg for the first time and 6 mg/kg for the subsequent time points), and pertuzumab (840 mg for the first time and 420 mg for the subsequent time points). After receiving 6 cycles of neoadjuvant chemotherapy, the patients underwent surgery.
Patient with TNBC received eight cycles (21 days/cycle) of chemotherapy consisting of docetaxel, paclitaxel, epirubicin, and cyclophosphamide. During the first four cycles of chemotherapy, patients received chemotherapy with epirubicin (100 mg/m2) and cyclophosphamide (600 mg/m2). During the final four chemotherapy treatment cycles, patients received docetaxel (100 mg/m2) or paclitaxel (80 mg/m2). After 8 cycles of neoadjuvant chemotherapy, the patients underwent surgery.
Ribosomal RNA (rRNA)-Depleted RNA Sequencing (RNA-Seq)
Total RNA was extracted from the tumor tissues using the mirVana™ miRNA ISOlation Kit (Ambion-1561, ThermoFisher Scientific). RNA integrity was determined using an Agilent 2100 Bioanalyzer. Next, TruSeq Stranded Total RNA with Ribo-Zero Gold (RS-122-2301, Illumina) was used to construct libraries according to the manufacturer′s instructions. Subsequently, libraries were sequenced on the Illumina sequencing platform.
Trimmomatic software was initially employed to remove adapters, low-quality bases, N-bases, and low-quality reads, resulting in high-quality clean reads.16 The clean reads were then aligned to the reference genome of the experimental species using the hisat2.17
For linear RNAs, including lncRNAs and mRNAs, sequencing reads from each sample were aligned with the mRNA transcript sequences, known lncRNA sequences, and predicted lncRNA sequences using bowtie2. Subsequently, eXpress was used to perform quantitative gene analysis, resulting in the acquisition of FPKM values and counts (the number of reads for each gene in each sample). For circRNA prediction, we utilized BWA software (version 0.7.5a) to align the sequencing reads of each sample with the reference genome, which facilitated the generation of SAM files. The default parameters of CIRI software (version v2.0.3) was employed to detect paired chiastic clipping signals, allowing for the prediction of circRNA sequences based on junction reads and GT-AG cleavage signals.18
To identify differentially expressed mRNAs (DEmRNAs), differentially expressed lncRNAs (DElncRNAs) and differentially expressed circRNAs (DEcircRNAs), the estimateSizeFactors function in the DESeq (version 1.42.1) R package were employed to normalize the counts.19 Subsequently, p values and fold-change values were calculated using the nbinomTest function. The False Discovery Rate (FDR) method was used to correct for multiple hypothesis testing. Genes with |log2FoldChange|>1 and FDR<0.05, were considered differentially expressed.
The Cancer Genome Atlas (TCGA)-BC Dataset
The mRNA expression profiles, which included 1077 breast cancer (BC) tissues and 106 normal tissues, along with the clinical information of BC patients, were obtained from the TCGA-BC dataset. The Wilcoxon rank-sum test was used to examine the differences in gene expression between the normal and BC groups. R package “survival” (https://CRAN.R-project.org/package=survival) and R package “survminer” (https://CRAN.R-project.org/package=survminer) were used to assess the overall survival in different groups. Differences in survival rates were evaluated using the Log rank test.
Construction of the Co-Expression Network for lncRNA/circRNA/mRNA
Using the assembled sequences of circRNAs and lncRNAs, along with miRNA sequences obtained from the miRBase database, miRanda software was used to predict the degree of complementary matching (total score) and free energy (total energy) of the composite structure formed by their interactions.20
Functional Analysis
The “clusterProfiler” (version 4.8.3) package in R language was employed for Gene ontology [GO, including biological process (BP), molecular function (MF), cellular component (CC)] and Kyoto Encyclopedia of Genes and Genomes (KEGG) enrichment analyses.21 The threshold for significance was set at p-adjust < 0.05.
Real-Time Quantitative Reverse-Transcription PCR (RT-qPCR)
Total RNA was extracted from tissue samples using the Redzol reagent (FTR-50, SBS Genetech Co., Ltd). Complementary DNA (cDNA) was synthesized from the extracted RNA using the Reverse Transcription kit (QP056, GeneCopeia). The cDNA was subsequently amplified by quantitative PCR using the 2× SYBR Green qPCR Master Mix (None ROX) (MPC2203026, Servicebio) on an iQ5Real-TimePCR system. The relative gene expression was calculated using the 2–ΔΔCt method by normalization to U6 or GAPDH. The primers used in this study were listed in Table 1.
 |
Table 1 Primers Used in This Study |
Statistical Analysis
The Pearson correlation method was used for correlation analysis. Statistical significance was set at p < 0.05. All statistical analyses were performed using the R software version 4.3.3.
For the analysis of the experimental data, the Student′s t-test was employed to assess differences between the groups. Data were presented as mean ± SD, with p values < 0.05 considered statistically significant.
Results
Identification of DElncRNAs Between Groups
R language was used to identify DElncRNAs between pre-therapy tumor and adjacent normal groups, and between post-NAT tumor and pre-therapy tumor groups. Compared to the adjacent normal group, 134 lncRNAs were downregulated and 128 lncRNAs were upregulated in the pre-therapy tumor group (Figure 1A, B and Table S1). Compared with the pre-therapy tumor group, 82 lncRNAs were downregulated and 105 lncRNAs were upregulated in the post-NAT tumor group (Figure 1C, D and Table S1). Next, a Venn diagram was used to distinguish the common lncRNAs between the two comparison groups (pre-therapy tumor vs adjacent normal and post-NAT tumor vs pre-therapy tumor). A total of 25 DElncRNAs were found to be dysregulated across these two comparison groups (Figure 1E and F). As shown in Figure 1E, compared to the adjacent normal group, the levels of 15 lncRNAs were remarkably elevated in the pre-therapy tumor group; however, these levels were notably reduced in the post-NAT tumor group compared to the pre-therapy tumor group. As shown in Figure 1F, the levels of 10 lncRNAs in the pre-therapy tumor group were considerably lower than those in the adjacent normal group, whereas these levels were significantly higher in the post-NAT tumor group than in the pre-therapy tumor group.
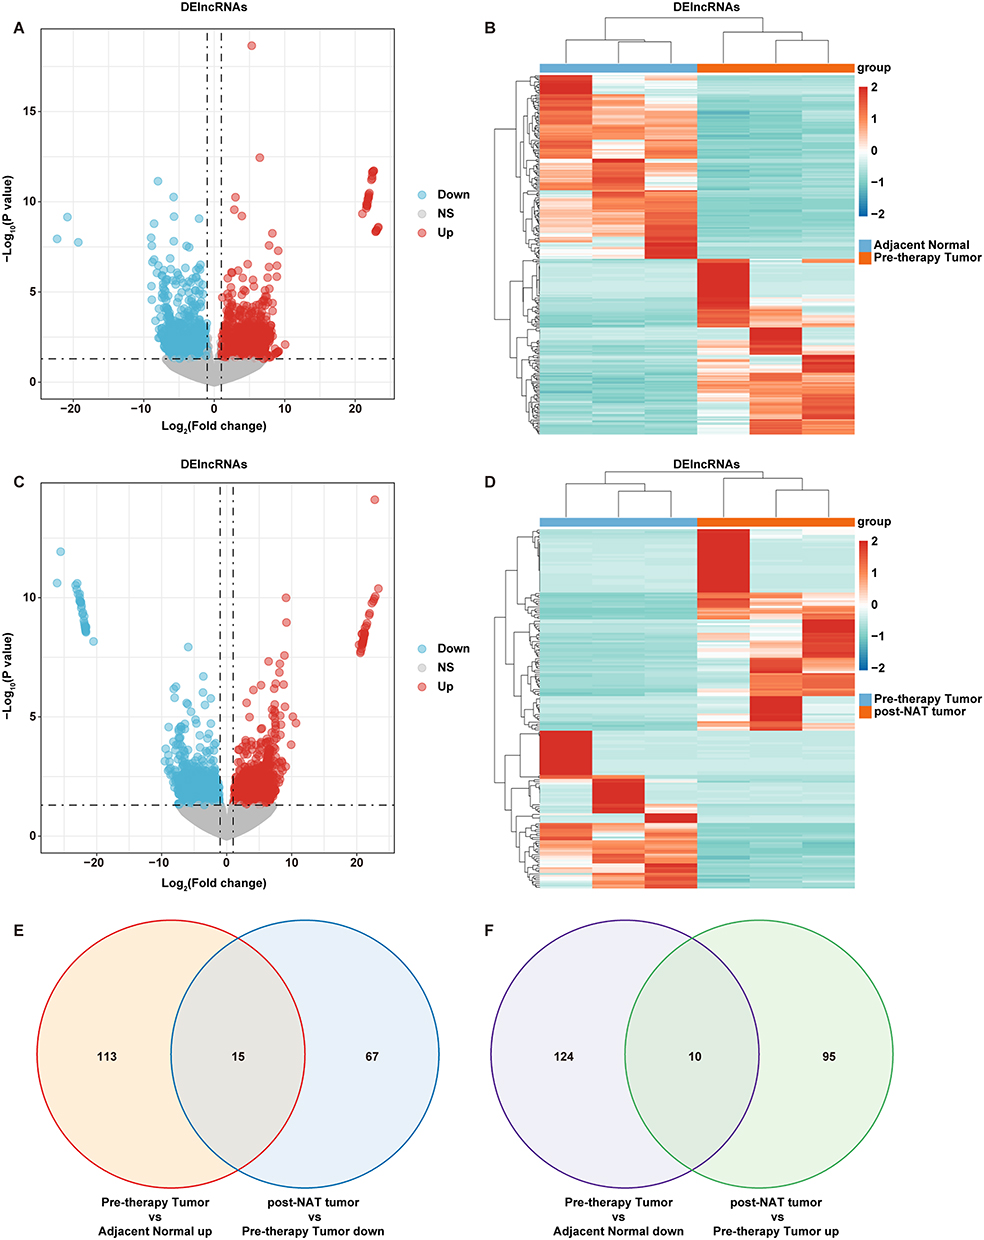 |
Figure 1 Identification of DElncRNAs between groups. (A and B) Volcano and heatmap of DElncRNAs between pre-therapy tumor (n=3) and tumor adjacent normal (n=3) samples. Blue color, downregulated lncRNAs; red color, upregulated lncRNAs. (C and D) Volcano and heatmap of DElncRNAs between post-NAT (n=3) and pre-therapy tumor (n=3) samples. Blue color, downregulated lncRNAs; red color, upregulated lncRNAs. (E) Venn diagram of 15 common DElncRNAs between the upregulated genes in the pre-therapy tumor vs adjacent normal comparison group and the downregulated genes in the post-NAT vs pre-therapy group. (F) Venn diagram of 10 common DElncRNAs between the downregulated genes in the pre-therapy tumor vs adjacent normal comparison group and the upregulated genes in the post-NAT vs pre-therapy group. |
Of these 25 DElncRNAs, 20 were detected across all samples in the three groups (Table S1). Next, the miRanda database was used to screen for miRNAs targeted by these 20 DElncRNAs. As shown in Figure S1, six lncRNAs (ADAMTS9-AS2, MIAT, LINC0067, LINC02884, LOC105372310, and LOC10099662) and 149 potential miRNAs were identified using the miRanda database.
Identification of DEcircRNAs Between Groups
Next, we screened DEcircRNAs between adjacent normal and pre-therapy tumor groups, and between pre-therapy tumor and post-NAT tumor groups. Compared to the adjacent normal group, 1384 circRNAs were notably increased and 3782 circRNAs were notably decreased in the pre-therapy tumor group (Figure 2A, B and Table S2). Compared to the pre-therapy tumor group, 1582 circRNAs were significantly reduced, and 3732 circRNAs were remarkably elevated in the post-NAT tumor group (Figure 2C, D and Table S2). Next, a Venn diagram was used to distinguish the common circRNAs between the two comparison groups (pre-therapy tumor vs adjacent normal and post-NAT tumor vs pre-therapy tumor). A total of 2693 DEcircRNAs were dysregulated across these two comparison groups (Figure 2E and F). As shown in Figure 2E, compared to the adjacent normal group, the levels of 1047 circRNAs increased in the pre-therapy tumor group; however, compared to the pre-therapy tumor group, these levels decreased in the post-NAT tumor group. As shown in Figure 2F, the levels of 1646 circRNAs in the pre-therapy tumor group were notably lower than those in the adjacent normal group, whereas these levels were significantly higher in the post-NAT tumor group than in the pre-therapy tumor group.
 |
Figure 2 Identification of DEcircRNAs between groups. (A and B) Volcano and heatmap of DEcircRNAs between pre-therapy tumor (n=3) and tumor adjacent normal (n=3) samples. Blue color, downregulated circRNAs; red color, upregulated circRNAs. (C and D) Volcano and heatmap of DEcircRNAs between post-NAT (n=3) and pre-therapy tumor (n=3) samples. Blue color, downregulated circRNAs; red color, upregulated circRNAs. (E) Venn diagram of 1047 common DEcircRNAs between the upregulated genes in the pre-therapy vs adjacent normal comparison group and the downregulated genes in the post-NAT and pre-therapy group. (F) Venn diagram of 1646 common DEcircRNAs between the downregulated genes in the pre-therapy vs adjacent normal comparison group and the upregulated genes in the post-NAT and pre-therapy group. |
In these 2693 DEcircRNAs, a total of 104 circRNAs were detected across all samples in the three groups (Table S2), and the target miRNAs of these DEcircRNAs were predicted using the miRanda database. Based on sequence complementarity (total score>200) and free energy of formation (total energy<80), 77 miRNAs that putatively targeted by eight DEcircRNAs (circRNA_31003, circRNA_34064, circRNA_42934, circRNA_40273, circRNA_15026, circRNA_42276, circRNA_50033, and circRNA_46221) were identified using the miRanda database, and the miRNA-circRNA pairs were constructed (Figure S2 and Table S3).
Identification of Common miRNAs Targeted by 6 DElncRNA and 8 circRNAs
Next, the common miRNAs targeted by the six DElncRNAs and eight circRNAs were screened using Venn diagrams. As shown in Figure 3A, 39 miRNAs that potentially interact with both circRNAs and lncRNAs were identified. Subsequently, a circRNA/lncRNA-miRNA network was constructed, containing eight circRNAs, six lncRNAs, and 39 miRNAs (Figure 3B).
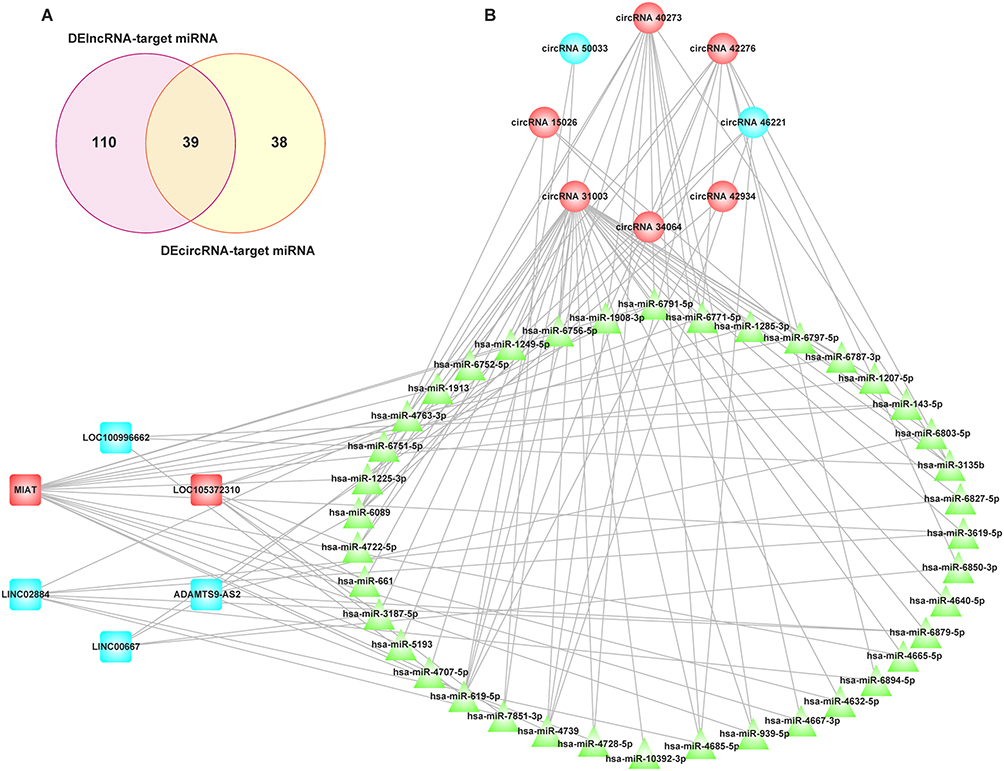 |
Figure 3 Identification of common miRNAs targeted by 6 DElncRNA and 8 circRNAs. (A) Venn diagram of 39 common miRNAs between DElncRNA-target miRNAs and DEcircRNA-target miRNAs. (B) The circRNA/lncRNA-miRNA network. Blue color represent lncRNAs/circRNAs that were downregulated in the pre-therapy tumor vs adjacent normal comparison but upregulated in the post-NAT vs pre-therapy tumor comparison; red color represents lncRNAs/circRNAs that were upregulated in the pre-therapy tumor vs adjacent normal comparison but downregulated in the post-NAT vs pre-therapy tumor comparison; green color, miRNAs. |
Identification of DEmRNAs Between Groups
DEmRNAs were then identified between the adjacent normal and pre-therapy tumor groups, as well as between the pre-therapy tumor and post-NAT tumor groups. In comparison to the adjacent normal group, 1373 genes exhibited a significant increase, while 1014 genes demonstrated a notable decrease in expression within the pre-therapy tumor group (Figure 4A, B and Table S4). When comparing the post-NAT tumor group to the pre-therapy tumor group, 794 genes were significantly reduced, and 454 genes were remarkably elevated in the post-NAT tumor group (Figure 4C, D and Table S4). Furthermore, a Venn diagram was used to distinguish the common DEmRNAs between the two comparison groups (pre-therapy tumor vs adjacent normal and post-NAT tumor vs pre-therapy tumor). A total of 936 DEmRNAs were found to be dysregulated across these two comparison groups (Figure 4E and F).
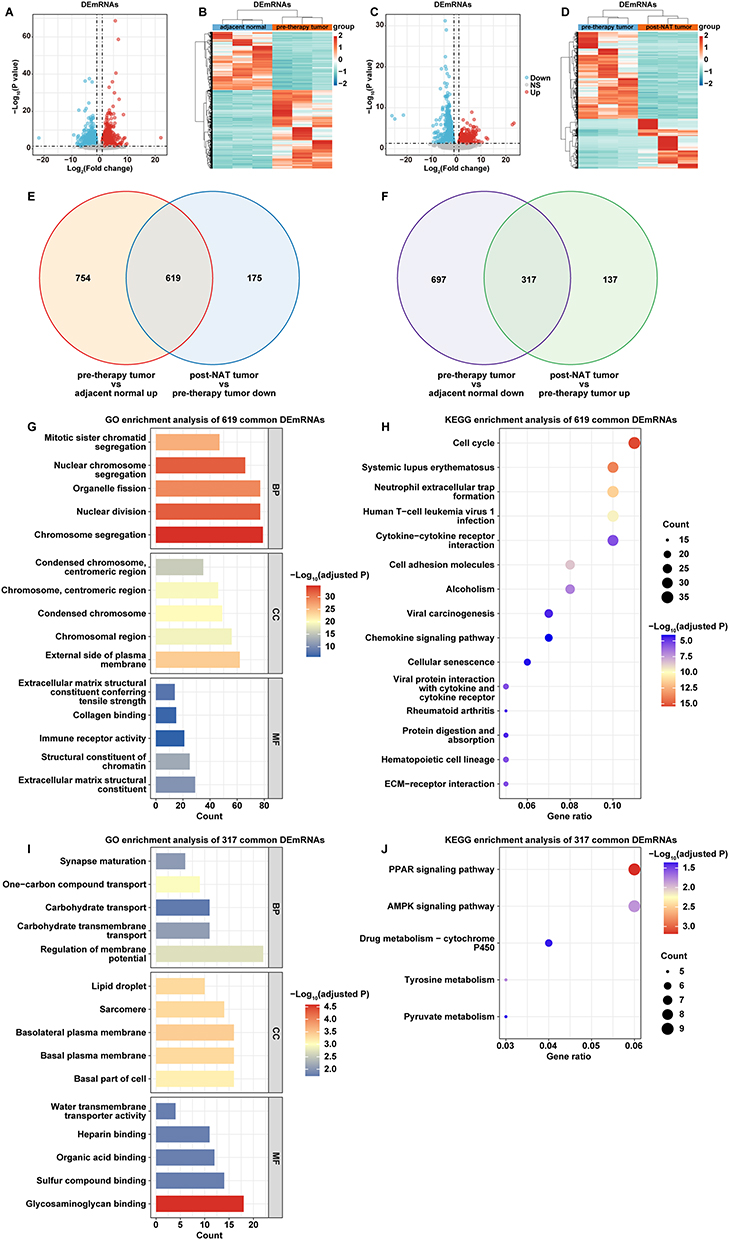 |
Figure 4 Identification of DEmRNAs between groups. (A and B) Volcano and heatmap of DEmRNAs between pre-therapy tumor (n=3) and adjacent normal (n=3) samples. Blue color, downregulated mRNAs; red color, upregulated mRNAs. (C and D) Volcano and heatmap of DEmRNAs between post-NAT (n=3) and pre-therapy tumor (n=3) samples. Blue color, downregulated mRNAs; red color, upregulated mRNAs. (E) Venn diagram of 619 common DEmRNAs between the upregulated genes in the pre-therapy vs adjacent normal comparison group and the downregulated genes in the post-NAT vs pre-therapy comparison group. (F) Venn diagram of 317 common DEmRNAs between the downregulated genes in the pre-therapy vs adjacent normal comparison group and the upregulated genes in the post-NAT vs pre-therapy comparison group. (G and H) GO and KEGG analyses were performed on 619 common DEmRNAs screened in (E). (I and J) GO and KEGG analyses were performed on 317 common DEmRNAs screened in (F). |
As illustrated in Figure 4E, compared to the adjacent normal group, the levels of 619 genes were found to be elevated in the pre-therapy tumor group; however, when compared to the pre-therapy tumor group, these levels decreased in the post-NAT tumor group. The results of GO and KEGG analyses showed that these 619 DEmRNAs were significantly enriched in 754 GO-BP terms (eg “Chromosome segregation”), 69 GO-CC terms (eg “External side of plasma membrane”) and 49 GO-MF terms (eg “Extracellular matrix structural constituent”), and 52 KEGG pathways (eg “Cell cycle”) (Figure 4G, H and Table S5).
As shown in Figure 4F, the levels of 317 genes in the pre-therapy tumor group were notably lower than those in the adjacent normal group. In contrast, these levels were significantly elevated in the post-NAT tumor group when compared to the pre-therapy tumor group (Figure 4F). The results of GO and KEGG analyses indicated that these 317 DEmRNAs were significantly enriched in 20 GO-BP terms (eg “Regulation of membrane potential”), 35 GO-CC terms (eg “Basolateral plasma membrane”) and 24 GO-MF terms (eg “Glycosaminoglycan binding”), and 5 KEGG pathways (eg “PPAR signaling pathway”, “AMPK signaling pathway”) (Figure 4I, J and Table S6).
Screening Hub Differential Expressed-Transcription Factors (DE-TFs)
To investigate the potential TFs involved in the regulation of these DEmRNAs, Venn diagrams were employed to analyze the overlap between 1562 TFs and 936 DEmRNAs. This analysis led to the identification of 58 DE-TFs (Figure 5A and Table S7). To further refine the selection of candidate DE-TFs, the top five DE-TFs (HOXC11, HOXD11, PITX1, NKX2-2, and PRAME), which exhibited the most significant log2 fold change (log2 FC) in comparisons between pre-therapy tumor and adjacent normal tissue samples, were selected for subsequent analysis (Table S7).
 |
Figure 5 Screening hub differential expressed-transcription factors (DE-TFs). (A) Venn diagram of 58 common DE-TFs between the 1562 TFs and 936 DEmRNAs. (B) Heatmap of expression levels of HOXC11 and its five target DEmRNAs among adjacent normal, pre-therapy and post-NAT groups. The color gradient from blue to red represents that the gene expression level ranges from low to high. (C) Heatmap of expression levels of NKX2-2 and its five target DEmRNAs among adjacent normal, pre-therapy and post-NAT groups. The color gradient from blue to red represents that the gene expression level ranges from low to high. (D) Heatmap of expression levels of PRAME and its five target DEmRNAs among adjacent normal, pre-therapy and post-NAT groups. The color gradient from blue to red represents that the gene expression level ranges from low to high. |
Next, the ChIp-seq data for these five TFs were downloaded from the Cistrome Data Browser (http://cistrome.org/db/) to predict their target genes. Of the 936 DEmRNAs analyzed, 58 represented DE-TFs and were excluded from downstream targeting analysis. The remaining 878 DEmRNAs were thus considered potential targets. Utilizing ChIP-seq data from the Cistrome database, we identified three DE-TFs (HOXC11, NKX2-2, and PRAME) with potential downstream targets (Table S7).
To predict the target DEmRNAs of HOXC11, we interrogated its ChIP-seq data (GEO: GSM1306052) with a screening threshold greater than 0.1.22 As presented in Table 2, the binding sites and binding strengths between five target DEmRNAs (CCL5, HBA2, HBA1, HOXC12, and ELAVL4) and HOXC11 were predicted. Specifically, HOXC11 was found to have one binding region with HBA2, HBA1, CCL5, and HOXC12, whereas HOXC11 and ELAVL4 had three binding regions (Table 2). The expression levels of HOXC11 and its five target genes across the three groups were illustrated in a heatmap (Figure 5B).
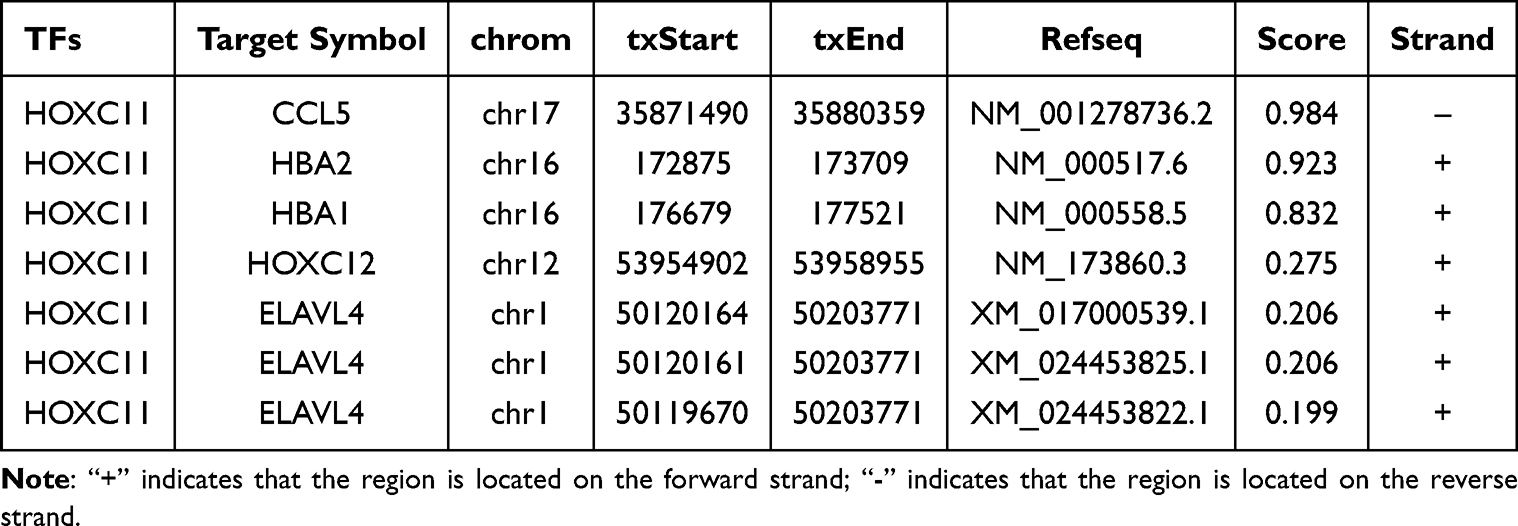 |
Table 2 The Binding Regions and Binding Score Between HOXC11 and Its Target Genes |
The ChIp-seq data for NKX2-2 (GEO: GSM1208780) were analyzed to identify its target DEmRNAs using a screening threshold set to greater than 1.23 As presented in Table 3, the binding sites and binding strengths between five target DEmRNAs (NEK2, KIF20A, SPC24, LRRC49, and CDC45) and NKX2-2 were predicted. Specifically, NKX2-2 interacts with KIF20A and CDC45 through one binding region each, and with LRRC49 through three binding regions. For NEK2, NKX2-2 binds to each canonical transcript through one binding region and also interacts with one protein-coding sequence. Additionally, NKX2-2 binds to six canonical transcripts of SPC24. The expression levels of NKX2-2 and its five target genes across the three groups were displayed in a heatmap (Figure 5C).
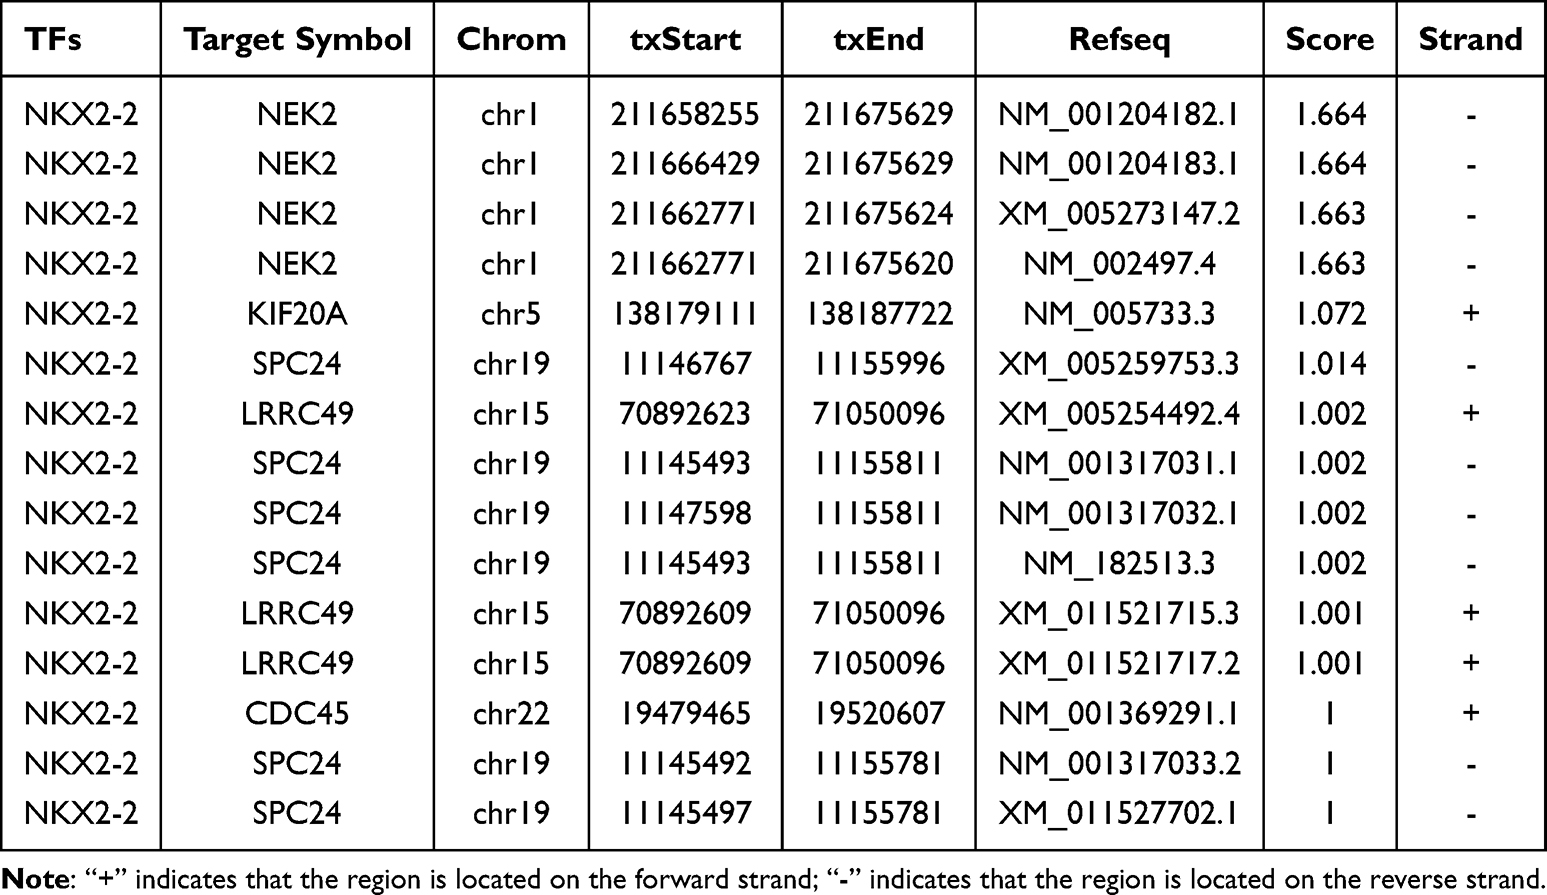 |
Table 3 The Binding Regions and Binding Score Between NKX2-2 and Its Target Genes |
Chip-seq data for PRAME (GEO: GSM648586) were used to predict the targeted DEmRNAs of PRAME, with a screening threshold set to greater than 1.24 As shown in Table S7, 281 target DEmRNAs of PRAME were predicted, encompassing 1373 predicted binding regions. Thus, to further refine hub target genes of PRAME, these 281 candidates were subjected to survival and differential expression analyses based on data from the TCGA-BC cohort. Among them, the levels of RAD54L, PGM2L1, and RPGRIP1L exhibited significantly higher expression in tumor tissues compared to controls, and their high expression was associated with poor prognosis in BC patients (Figure S3A–S3F). Conversely, FBXO2 and FAM181B showed significantly lower expression in tumor tissues, and their reduced expression was also associated with poor prognosis in patients with BC (Figure S3G–S3J). The predicted binding sites and strengths between these five genes and PRAME are detailed in Table 4. PRAME interacts with FBXO2 and FAM181B through one binding region each. For RAD54L, PRAME binds to each of its three canonical transcripts via one binding region and also interacts with two protein-coding sequences. In the case of PGM2L1, PRAME binds to one canonical transcript and one protein-coding sequence. For RPGRIP1L, PRAME interacts with six canonical transcripts and nine protein-coding sequences. The expression levels of PRAME and its five target genes across the three groups were illustrated in a heatmap (Figure 5D).
 |
Table 4 The Binding Regions and Binding Score Between PRAME and Its Target Genes |
Construction of circRNA/lncRNA–miRNA–TF-mRNA Network
Furthermore, the miRWalk database was conducted to predict the interactions between 39 miRNAs and 3 hub TFs (HOXC11, NKX2-2, and PRAME), and miRNAs with a binding prediction score exceeding 0.9 were designated as hub miRNAs (Table S8).
Finally, based on the identified circRNA/lncRNA-miRNA pairs (Figure 3B) and miRNA-TF-mRNA pairs (Tables 2–4, Table S8), circRNA/lncRNA-miRNA-TF-mRNA ceRNA networks were constructed (Figure S4A–S4C).
According to the ceRNA mechanism, circRNAs and lncRNAs are positively correlated with target gene expression.25,26 Given that the expression levels of three TFs (HOXC11, NKX2-2, and PRAME) were potentially elevated in the pre-therapy tumor group compared to the adjacent normal group, we mainly focused on the upregulated circRNAs/lncRNAs in pre-therapy tumor samples (Figure 6A–C).
 |
Figure 6 Construction of upregulated circRNA/upregulated lncRNA–miRNA–TF-mRNA network. (A) The upregulated circRNA/upregulated lncRNA–miRNA–HOXC11-mRNA network. (B) The upregulated circRNA/upregulated lncRNA–miRNA–NKX2-2-mRNA network. (C) The upregulated circRNA/upregulated lncRNA–miRNA–PRAME-mRNA network. Blue color represent mRNAs that were downregulated in the pre-therapy tumor vs adjacent normal comparison but upregulated in the post-NAT vs pre-therapy tumor comparison; pink color represents lncRNAs/circRNAs/TFs/mRNAs that were upregulated in the pre-therapy tumor vs adjacent normal comparison but downregulated in the post-NAT vs pre-therapy tumor comparison; green color, miRNAs. |
As shown in Figure 6A–C, circRNA_31003 and MIAT may indirectly regulate all three TFs, suggesting that circRNA_31003 or MIAT may be the hub circRNA or lncRNA in BC. Additionally, circRNA_40273, circRNA_42276, and LOC105372310 may indirectly regulate two TFs (HOXC11 and NKX2-2), suggesting that these genes may play a significant role in BC.
Validation of Expression Levels of Key circRNAs/lncRNAs, miRNAs, TFs and mRNAs Among Adjacent Normal, Pre-Therapy Tumor and Post-NAT Tumor Groups
RT-qPCR was performed to validate the expression levels of key circRNAs, lncRNAs, miRNAs, TFs, and mRNAs across the adjacent normal, pre-therapy tumor, and post-NAT tumor groups in the circRNA/lncRNA-miRNA-TF-mRNA ceRNA networks (Figure 7A-L). The results indicated that the expression levels of circRNA_31003, circRNA_42276, MIAT, HOXC11, NKX2-2, PRAME, CCL5, NEK2, and RAD54L were significantly upregulated in pre-therapy tumor tissues compared with adjacent normal tissues; however, these levels were decreased in the post-NAT tumor group compared to pre-therapy tumor group (Figure 7A–C, G–L). In contrast, the expression levels of miR-1225-3p, miR-661, and miR-143-5p were markedly downregulated in pre-therapy tumors relative to adjacent normal tissues; however, these levels were significantly elevated in the post-NAT tumor group compared to pre-therapy tumor group (Figure 7D–F).
 |
Figure 7 Validation of expression levels of key circRNAs/lncRNAs, miRNAs, TFs and mRNAs among adjacent normal, pre-therapy tumor and post-NAT tumor groups. (A–L) RT-qPCR was employed to assess the expression levels of key molecules, including two circRNAs (circRNA_31003, circRNA_42276), one lncRNA (MIAT), three miRNAs (miR-1225-3p, miR-661, miR-143-5p), three TFs (HOXC11, NKX2-2, PRAME), and three mRNAs (CCL5, NEK2, RAD54L) across adjacent normal, pre-treatment tumor, and post-NAT tumor tissues. ***P<0.001, n=15. |
Discussion
In this study, we conducted rRNA-depleted RNA-seq to identify DElncRNAs, DEcircRNAs, and DEmRNAs across adjacent normal tissues, pre-therapy tumor tissues and post-NAT tumor tissues with the aim of constructing lncRNA-miRNA-mRNA networks that respond to NAT in BC. A total of six DElncRNAs (ADAMTS9-AS2, MIAT, LINC0067, LINC02884, LOC105372310, and LOC10099662) and eight DEcircRNAs (circRNA_31003, circRNA_34064, circRNA_42934, circRNA_40273, circRNA_15026, circRNA_42276, circRNA_50033, and circRNA_46221) were identified between the adjacent normal and pre-therapy tumor groups and between the pre-therapy and post-NAT tumor groups. We also explored their downstream miRNA targets to construct the DE circRNA/DE lncRNA-miRNA axis. These lncRNAs and circRNAs may serve as candidate biomarkers for the response of BC patients to NAT treatment. Previous studies have highlighted the roles of ADAMTS9-AS2 and MIAT in BC.27,28 For instance, Ni et al found that DAMTS9-AS2 levels were decreased in TNBC tissues, and that DAMTS9-AS2 overexpression suppressed TNBC progression.27 Conversely, MIAT is overexpressed in BC and its overexpression has been shown to promote BC progression.28,29 These findings suggest that ADAMTS9-AS2 may function as a tumor suppressor and MIAT may act as an oncogene in BC. Our results showed that ADAMTS9-AS2 levels were reduced, whereas MIAT levels were elevated in pre-therapy tumor tissues compared with those in adjacent normal tissues, which is consistent with previous research. Conversely, in post-NAT tumor tissues, ADAMTS9-AS2 levels were found to be increased, whereas MIAT levels were decreased when compared to the pre-therapy tumor group. These results implied that ADAMTS9-AS2 and MIAT may serve as potential biomarkers for identifying BC patients who respond to NAT treatment. However, the roles of other 4 lncRNAs and eight circRNAs in BC progression have not yet been investigated, warranting further studies.
TFs regulate the expression of downstream genes by binding to specific DNA sequences, thereby promoting or inhibiting transcription.30 They play dual roles in tumorigenesis, functioning as both tumor suppressor genes and oncogenes, which underscores their significant importance in cancer development.31,32 In this study, we identified 58 common TFs between the adjacent normal and pre-therapy tumor groups, as well as between the pre-therapy tumor and post-NAT tumor groups. To focus on these genes, we selected the top five based on their expression ratios, identifying three DE-TFs (HOXC11, NKX2-2, and PRAME) that have potential downstream targets. These three DE-TFs (HOXC11, NKX2-2, and PRAME) were all found to be elevated in pre-therapy tumor tissues compared with adjacent normal tissues. In contrast, the levels of HOXC11, NKX2-2, and PRAME were reduced in post-NAT tumor tissues when compared to the pre-therapy tumor group. Consequently, we further examined their upstream miRNA targets and downstream DEmRNA targets to construct the DEcircRNA/DElncRNA-miRNA-DE-TF-DEmRNA axis.
HOXC11 has been identified as an oncogene in various cancers, such as colon adenocarcinoma and pancreatic adenocarcinoma, with elevated levels of HOXC11 correlating with poor overall survival in cancer patients.33 Furthermore, nuclear HOXC11 has been associated with poor disease-free survival in patients with BC,34 suggesting its relevance to BC prognosis. Furthermore, evidence has shown that HOXC11 may serve as a transcriptional activator and repressor,35,36 acting as a dual transcriptional regulator in tumorigenesis. Using the Cistrome Data Browser database, we predicted that CCL5, HOXC12, ELAVL4, HBA1, and HBA2 are potential downstream targets of HOXC11. Meanwhile, the levels of CCL5, HOXC12, and ELAVL4 were elevated, and HBA1 and HBA2 levels were reduced in pre-therapy tumor tissues compared with those in adjacent normal tissues. Evidence has shown that CCL5 and ELAVL4 may play oncogenic roles, whereas HBA1 may serve as a potential tumor suppressor gene in different cancers.37,38 Additionally, BC patients exhibiting high CCL5 expression had poorer disease-free survival.39 Thus, we speculated that HOXC11 might promote BC progression by potentially promoting the transcription of oncogenes (CCL5 and ELAVL4) and suppressing the transcription of the tumor-suppressor gene (HBA1). However, this assumption requires further investigation in future studies.
NKX2.2 plays a dual role in cancer progression.40,41 Several studies have indicated that NKX2.2 is reduced in several malignancies, such as colorectal cancer and osteosarcoma, where it functions as a tumor suppressor.40,42 Conversely, a study by Lawson et al revealed that overexpression of NKX2.2 can accelerate cell survival in small cell lung cancer, implying a potential oncogenic role for NKX2.2.41 Using the Cistrome Data Browser database, we predicted that SPC24, KIF20A, NEK2, and CDC45 are potential downstream targets of NKX2.2. Evidence has shown that these four target genes are upregulated in various tumor tissues, and their elevated levels correlate with poor prognosis.43–46 Notably, SPC24, KIF20A, and NEK2 were upregulated in BC tissues when compared to normal controls,47–49 aligning with our findings. NKX2.2 possesses both transcriptional activation and transcriptional repression capabilities.50 Thus, we speculate that NKX2.2 may promote BC progression by activating the expression of its downstream genes; nevertheless, these hypotheses warrant further investigation in future studies.
Al-Khadairi et al discovered that PRAME can facilitate TNBC progression by enhancing epithelial-to-mesenchymal transition.51 Additionally, high PRAME expression has been correlated with unfavorable outcomes in patients with BC.52,53 A previous study demonstrated that PRAME suppresses the expression of its downstream targets.54 In contrast, PRAME activates meiotic genes in uveal melanoma.55 These findings indicate that PRAME may play a dual role in regulating the expression of downstream genes. Our results showed that RPGRIP1L, RAD54L, and PGM2L1 are potential targets of PRAME. These three genes have been identified as oncogenes in cancers.56–58 Consistent with prior studies, our results showed that PRAME, RPGRIP1L, RAD54L, and PGM2L1 levels were elevated in pre-therapy tumor tissues compared to those in adjacent normal tissues. Thus, we speculate that PRAME may promote BC progression through upregulation of these three genes; however, these assumptions warrant further investigation in future studies.
LncRNAs or circRNAs can function as ceRNAs by competitively occupying the shared binding sequences of miRNAs. This interaction diminishes the capacity of miRNAs to interact with target genes, thereby altering their expression.59–61 Luan et al demonstrated that lncRNA MIAT acts as a ceRNA by sponging miR-155-5p, thereby enhancing the expression of DUSP7 in breast cancer.29 Zhang et al reported that MIAT competitively binds to miR-411-5p, leading to the restoration of STAT3 (a TF) expression, which subsequently upregulates the levels of its downstream target, PD-L1, in hepatocellular carcinoma cells.62 Additionally, Cao et al indicated that circRNA circRNF20 plays a role in BC progression via the miR-487a/HIF-1α/HK2 axis.60 These findings suggest that lncRNAs and circRNAs may influence tumor progression by sponging miRNAs, thereby modulating the TF-mRNA axis. In this study, our results indicated that circRNA_31003 and MIAT may indirectly regulate the expression of these three TFs (HOXC11, NKX2-2, and PRAME) via sponging miRNAs, and circRNA_40273, circRNA_42276, and LOC105372310 may indirectly regulate two TFs (HOXC11 and NKX2-2) via similar mechanisms, suggesting that these three circRNAs and two lncRNAs may play significant roles in BC. Furthermore, all these three TFs, three circRNAs and two lncRNAs were all found to be elevated in pre-therapy tumor tissues compared to adjacent normal tissues. In contrast, these levels were reduced in the post-NAT tumor group compared to the pre-therapy tumor group, suggesting that these genes may be potential factors in the response to NAT in BC.
In general, as illustrated in Figure 6A–C, circRNA_31003, circRNA_40273, circRNA_42276, LOC105372310, and MIAT may affect HOXC11 expression by sponging miRNAs (such as miR-1285-5p, miR-1225-3p, or miR-4739), which in turn affects the levels of CCL5, ELAVL4, and HBA1. These circRNAs and lncRNAs may also modulate HKX2-2 expression by sponging miRNAs (such as miR-939-5p, miR-6797-3p, or miR-661), thereby affecting the levels of SPC24, KIF20A, NEK2, and CDC45. Additionally, circRNA_31003 and MIAT may regulate PRAME expression by sponging miR-143-5p, which subsequently influences the RPGRIP1L, RAD54L, and PGM2L1 levels. These circRNA/lncRNA-miRNA-TF mRNA regulatory networks may play a potential role in the response to NAT in BC.
In this study, we employed RT-qPCR to assess the expression levels of key molecules, including two circRNAs (circRNA_31003, circRNA_42276), one lncRNA (MIAT), three miRNAs (miR-1225-3p, miR-661, miR-143-5p), three TFs (HOXC11, NKX2-2, PRAME), and three mRNAs (CCL5, NEK2, RAD54L), within proposed circRNA/lncRNA-miRNA-TF-mRNA regulatory networks across adjacent normal, pre-therapy tumor, and post-NAT tumor tissues. The RT-qPCR results revealed that, compared with adjacent normal tissues, the expression levels of circRNA_31003, circRNA_42276, MIAT, HOXC11, NKX2-2, PRAME, CCL5, NEK2, and RAD54L were significantly upregulated in pre-therapy tumor samples. However, these levels were downregulated in the post-NAT tumor group compared to the pre-therapy tumor group. Conversely, the levels of miR-1225-3p, miR-661, and miR-143-5p were markedly downregulated in pre-therapy tumors relative to normal tissues, but showed a significant increase after NAT. Based on the data presented in Figure 6, we constructed three regulatory axes: circRNA_42276/MIAT-miR-1225-3p-HOXC11-CCL5 axis, circRNA_31003-miR-661-NKX2-2-NEK2 axis, circRNA_31003/MIAT-miR-143-5p-PRAME-RAD54L axis. These axes may play potential roles in BC pathogenesis. Previous studies have identified CCL5, NEK2, and RAD54L as oncogenic factors in various cancers.39,57,63,64 Inhibition of the CCL5-mediated Akt/NF-κB pathway has been shown to induce apoptosis in ovarian cancer cells.65 Similarly, downregulation of NEK2 has been found to inhibit BC cell proliferation and induce apoptosis through the modulation of ERK/MAPK signaling.64 Additionally, Wang et al reported that Rad54L facilitates the progression of bladder cancer by influencing cell cycle and senescence.57 Our findings suggest that circRNA_31003, circRNA_42276, and MIAT may contribute to BC development via their roles within a ceRNA network. By acting to modulate the expression of CCL5, NEK2, and RAD54L, these circRNAs/lncRNAs may subsequently influence key cellular processes including apoptosis, cell cycle progression, and senescence. Thus, it is plausible that these three axes may contribute to tumorigenesis in BC. Their disruption following NAT may consequently impede key molecular mechanisms essential for tumor development. Targeting these pathways may represent a promising therapeutic strategy to enhance the efficacy of NAT in BC.
A limitation of this study is that the ceRNA network construction was based on bioinformatic analyses utilizing only three samples per group, which may limit statistical power and introduce bias. While the expression of potential key biomarkers has been validated by RT-qPCR in an independent cohort of 15 samples per group, it remains necessary to validate these preliminary observations in future studies involving larger and more diverse cohorts. In addition, the predicted interactions within the ceRNA networks, such as those between circRNAs/lncRNAs and miRNAs, as well as miRNAs and TFs, require experimental confirmation in future studies. Furthermore, although our current findings have identified potential biomarkers that may respond to NAT treatment in BC, it remains to be validated in future large-scale clinical studies with long-term follow-up whether these molecules can serve as independent predictors of patient outcomes. Additionally, functional investigations using cellular and animal models are imperative to definitively confirm the mechanistic roles of these molecules in tumorigenesis and treatment responsiveness in the future.
Conclusion
Our study identified several potential DElncRNAs, DEcircRNAs, DE-TFs, and DEmRNAs that may respond to NAT. Additionally, we constructed associated regulatory networks to explore potential biomarkers that may indicate the response of BC to NAT treatment. These results may have important clinical implications for guiding personalized treatment strategies in the neoadjuvant setting.
Data Sharing Statement
The original contributions of this study are included in the article/supplementary material, and further inquiries can be directed to the corresponding author. Meanwhile, the raw Ribosomal RNA (rRNA)-depleted RNA sequencing data from this study have been deposited in the NCBI database under the BioProject accession number PRJNA1344446.
Ethical Approval and Consent to Participate
This study was approved by the Ethics Committee of the Affiliated Hospital of Inner Mongolia Medical University (approval number: YJS2024055), in accordance with the Declaration of Helsinki. Written informed consent was obtained from all patients.
Author Contributions
All authors made a significant contribution to the work reported, whether that is in the conception, study design, execution, acquisition of data, analysis and interpretation, or in all these areas; took part in drafting, revising or critically reviewing the article. All authors gave final approval of the version to be published, have agreed on the journal to which the article has been submitted and agree to be accountable for all aspects of the work.
Funding
This study was supported by the Inner Mongolia Autonomous Region Key Research and Development and Achievement Transformation Plan Project (2023YFSH0039) and Nature Science Foundation of the Inner Mongolia Autonomous Region (2022MS08010).
Disclosure
The authors declare no conflicts of interest regarding the publication of this article.
References
1. Bray F, Laversanne M, Sung H, et al. Global cancer statistics 2022: GLOBOCAN estimates of incidence and mortality worldwide for 36 cancers in 185 countries. CA Cancer J Clin. 2024;74(3):229–19. doi:10.3322/caac.21834
2. Qian L, Li L, Li Y, et al. LncRNA HOTAIR as a ceRNA is related to breast cancer risk and prognosis. Breast Cancer Res Treat. 2023;200(3):375–390. doi:10.1007/s10549-023-06982-4
3. Xu C, Chen Y, Yu Q, Song J, Jin Y, Gao X. Compounds targeting ferroptosis in breast cancer: progress and their therapeutic potential. Front Pharmacol. 2023;14:1243286. doi:10.3389/fphar.2023.1243286
4. Park HS, Lee KS, Seo BK, et al. Machine learning models that integrate tumor texture and perfusion characteristics using low-dose breast computed tomography are promising for predicting histological biomarkers and treatment failure in breast cancer patients. Cancers. 2021;13(23):6013. doi:10.3390/cancers13236013
5. Xin X, Wen T, Gong LB, et al. Inhibition of FEN1 increases arsenic trioxide-induced ROS accumulation and cell death: novel therapeutic potential for triple negative breast cancer. Front Oncol. 2020;10:425. doi:10.3389/fonc.2020.00425
6. Fang Z, Hu Y, Hong X, et al. Simultaneous Determination of Methylated Nucleosides by HILIC-MS/MS Revealed Their Alterations in Urine from Breast Cancer Patients. Metabolites. 2022;12(10):973. doi:10.3390/metabo12100973
7. Wang RX, Chen S, Huang L, Zhou Y, Shao ZM. Monitoring serum VEGF in neoadjuvant chemotherapy for patients with triple-negative breast cancer: a new strategy for early prediction of treatment response and patient survival. Oncologist. 2019;24(6):753–761. doi:10.1634/theoncologist.2017-0602
8. Takada M, Toi M. Neoadjuvant treatment for HER2-positive breast cancer. Chin clin oncol. 2020;9(3):32. doi:10.21037/cco-20-123
9. Lu C, Li Z, Hu S, Cai Y, Peng K. LncRNA PART-1 targets TGFBR2/Smad3 to regulate cell viability and apoptosis of chondrocytes via acting as miR-590-3p sponge in osteoarthritis. J Cell Mol Med. 2019;23(12):8196–8205. doi:10.1111/jcmm.14690
10. Qian L, Fei Q, Zhang H, et al. lncRNA HOTAIR promotes DNA repair and radioresistance of breast cancer via EZH2. DNA Cell Biol. 2020;39(12):2166–2173. doi:10.1089/dna.2020.5771
11. Ai Y, Wu S, Zou C, Wei H. LINC00941 promotes oral squamous cell carcinoma progression via activating CAPRIN2 and canonical WNT/beta-catenin signaling pathway. J Cell Mol Med. 2020;24(18):10512–10524. doi:10.1111/jcmm.15667
12. Hou S, Tan J, Yang B, He L, Zhu Y. Effect of alkylglycerone phosphate synthase on the expression profile of circRNAs in the human thyroid cancer cell line FRO. Oncol Lett. 2018;15(5):7889–7899. doi:10.3892/ol.2018.8356
13. Yuan C, Xu Y, Zhou L, et al. Value of CDR1-AS as a predictive and prognostic biomarker for patients with breast cancer receiving neoadjuvant chemotherapy in a prospective Chinese cohort. Eur J Med Res. 2024;29(1):454. doi:10.1186/s40001-024-02015-y
14. Sha R, Wu Z, Xu Y, et al. Predictive value of lncRNA LOC100505851 in breast cancer in the neoadjuvant setting. Gland Surg. 2021;10(6):1899–1909. doi:10.21037/gs-21-3
15. Li X, Xie B, Lu Y, et al. Transcriptomic analysis of long non-coding RNA-MicroRNA-mRNA interactions in the nucleus accumbens related to morphine addiction in mice. Front Psychiatry. 2022;13:915398. doi:10.3389/fpsyt.2022.915398
16. Bolger AM, Lohse M, Usadel B. Trimmomatic: a flexible trimmer for Illumina sequence data. Bioinformatics. 2014;30(15):2114–2120. doi:10.1093/bioinformatics/btu170
17. Kim D, Langmead B, Salzberg SL. HISAT: a fast spliced aligner with low memory requirements. Nat Methods. 2015;12(4):357–360. doi:10.1038/nmeth.3317
18. Gao Y, Wang J, Zhao F. CIRI: an efficient and unbiased algorithm for de novo circular RNA identification. Genome Biol. 2015;16(1):4. doi:10.1186/s13059-014-0571-3
19. Anders S, Huber W. Differential expression analysis for sequence count data. Genome Biol. 2010;11(10):R106. doi:10.1186/gb-2010-11-10-r106
20. John B, Enright AJ, Aravin A, Tuschl T, Sander C, Marks DS. Human MicroRNA targets. PLoS Biol. 2004;2(11):e363. doi:10.1371/journal.pbio.0020363
21. Yu G, Wang LG, Han Y, He QY. clusterProfiler: an R package for comparing biological themes among gene clusters. Omics. 2012;16(5):284–287. doi:10.1089/omi.2011.0118
22. Walsh CA, Bolger JC, Byrne C, et al. Global gene repression by the steroid receptor coactivator SRC-1 promotes oncogenesis. Cancer Res. 2014;74(9):2533–2544. doi:10.1158/0008-5472.CAN-13-2133
23. Yan J, Enge M, Whitington T, et al. Transcription factor binding in human cells occurs in dense clusters formed around cohesin anchor sites. Cell. 2013;154(4):801–813. doi:10.1016/j.cell.2013.07.034
24. Costessi A, Mahrour N, Tijchon E, et al. The tumour antigen PRAME is a subunit of a Cul2 ubiquitin ligase and associates with active NFY promoters. EMBO J. 2011;30(18):3786–3798. doi:10.1038/emboj.2011.262
25. Chen T, Zhang S, Zhou D, et al. Screening of co-pathogenic genes of non-alcoholic fatty liver disease and hepatocellular carcinoma. Front Oncol. 2022;12:911808. doi:10.3389/fonc.2022.911808
26. Ding B, Yao M, Fan W, Lou W. Whole-transcriptome analysis reveals a potential hsa_circ_0001955/hsa_circ_0000977-mediated miRNA-mRNA regulatory sub-network in colorectal cancer. Aging. 2020;12(6):5259–5279. doi:10.18632/aging.102945
27. Ni K, Huang Z, Zhu Y, et al. The lncRNA ADAMTS9-AS2 regulates RPL22 to modulate TNBC progression via controlling the TGF-beta signaling pathway. Front Oncol. 2021;11:654472. doi:10.3389/fonc.2021.654472
28. Alipoor FJ, Asadi MH, Torkzadeh-Mahani M. MIAT lncRNA is overexpressed in breast cancer and its inhibition triggers senescence and G1 arrest in MCF7 cell line. J Cell Biochem. 2018;119(8):6470–6481. doi:10.1002/jcb.26678
29. Luan T, Zhang X, Wang S, et al. Long non-coding RNA MIAT promotes breast cancer progression and functions as ceRNA to regulate DUSP7 expression by sponging miR-155-5p. Oncotarget. 2017;8(44):76153–76164. doi:10.18632/oncotarget.19190
30. Vaquerizas JM, Kummerfeld SK, Teichmann SA, Luscombe NM. A census of human transcription factors: function, expression and evolution. Nat Rev Genet. 2009;10(4):252–263. doi:10.1038/nrg2538
31. Zhang Y, Tang Y, Guo C, Li G. Integrative analysis identifies key mRNA biomarkers for diagnosis, prognosis, and therapeutic targets of HCV-associated hepatocellular carcinoma. Aging. 2021;13(9):12865–12895. doi:10.18632/aging.202957
32. Shah N, Sukumar S. The Hox genes and their roles in oncogenesis. Nat Rev Cancer. 2010;10(5):361–371. doi:10.1038/nrc2826
33. Cui Y, Zhang C, Wang Y, Ma S, Cao W, Guan F. HOXC11 functions as a novel oncogene in human colon adenocarcinoma and kidney renal clear cell carcinoma. Life Sci. 2020;243:117230. doi:10.1016/j.lfs.2019.117230
34. McIlroy M, McCartan D, Early S, et al. Interaction of developmental transcription factor HOXC11 with steroid receptor coactivator SRC-1 mediates resistance to endocrine therapy in breast cancer [corrected]. Cancer Res. 2010;70(4):1585–1594. doi:10.1158/0008-5472.CAN-09-3713
35. Peng X, Liu X, Hu W, et al. HOXC11 drives lung adenocarcinoma progression through transcriptional regulation of SPHK1. Cell Death Dis. 2023;14(2):153. doi:10.1038/s41419-023-05673-8
36. Sur IP, Toftgard R. Repression of transcription by HoxC11 upon phorbol ester stimulation. Mol Cell Biol Res Commun. 2000;3(6):367–373. doi:10.1006/mcbr.2000.0240
37. Li S, Lv J, Zhang X, et al. ELAVL4 promotes the tumorigenesis of small cell lung cancer by stabilizing LncRNA LYPLAL1-DT and enhancing profilin 2 activation. FASEB J. 2023;37(10):e23170. doi:10.1096/fj.202300314RR
38. Luo P, Liu X, Tang Z, Xiong B. Decreased expression of HBA1 and HBB genes in acute myeloid leukemia patients and their inhibitory effects on growth of K562 cells. Hematology. 2022;27(1):1003–1009. doi:10.1080/16078454.2022.2117186
39. Qiu J, Xu L, Zeng X, et al. CCL5 mediates breast cancer metastasis and prognosis through CCR5/Treg cells. Front Oncol. 2022;12:972383. doi:10.3389/fonc.2022.972383
40. He Y, Liu XY, Gong R, Peng KW, Liu RB, Wang F. NK homeobox 2.2 functions as tumor suppressor in colorectal cancer due to DNA methylation. J Cancer. 2020;11(16):4791–4800. doi:10.7150/jca.43665
41. Lawson MH, Cummings NM, Rassl DM, et al. Two novel determinants of etoposide resistance in small cell lung cancer. Cancer Res. 2011;71(14):4877–4887. doi:10.1158/0008-5472.CAN-11-0080
42. Chen H, Liu W, Zhong L, et al. NKX2-2 suppresses osteosarcoma metastasis and proliferation by downregulating multiple target genes. J Cancer. 2018;9(17):3067–3077. doi:10.7150/jca.26382
43. Wu L, Gao G, Mi H, et al. Validation of CDC45 as a novel biomarker for diagnosis and prognosis of gastric cancer. PeerJ. 2024;12:e17130.
44. Sheng Y, Wang W, Hong B, et al. Upregulation of KIF20A correlates with poor prognosis in gastric cancer. Cancer Manag Res. 2018;10:6205–6216. doi:10.2147/CMAR.S176147
45. Zhu P, Jin J, Liao Y, et al. A novel prognostic biomarker SPC24 up-regulated in hepatocellular carcinoma. Oncotarget. 2015;6(38):41383–41397. doi:10.18632/oncotarget.5510
46. Takahashi Y, Iwaya T, Sawada G, et al. Up-regulation of NEK2 by microRNA-128 methylation is associated with poor prognosis in colorectal cancer. Ann Surg Oncol. 2014;21(1):205–212. doi:10.1245/s10434-013-3264-3
47. Naro C, Barbagallo F, Caggiano C, et al. Functional interaction between the oncogenic kinase NEK2 and Sam68 promotes a splicing program involved in migration and invasion in triple-negative breast cancer. Front Oncol. 2022;12:880654. doi:10.3389/fonc.2022.880654
48. Nakamura M, Takano A, Thang PM, et al. Characterization of KIF20A as a prognostic biomarker and therapeutic target for different subtypes of breast cancer. Int J Oncol. 2020;57(1):277–288. doi:10.3892/ijo.2020.5060
49. Zhou J, Pei Y, Chen G, et al. SPC24 Regulates breast cancer progression by PI3K/AKT signaling. Gene. 2018;675:272–277. doi:10.1016/j.gene.2018.07.017
50. Owen LA, Kowalewski AA, Lessnick SL. EWS/FLI mediates transcriptional repression via NKX2.2 during oncogenic transformation in Ewing′s sarcoma. PLoS One. 2008;3(4):e1965. doi:10.1371/journal.pone.0001965
51. Al-Khadairi G, Naik A, Thomas R, Al-Sulaiti B, Rizly S, Decock J. PRAME promotes epithelial-to-mesenchymal transition in triple negative breast cancer. J Transl Med. 2019;17(1):9. doi:10.1186/s12967-018-1757-3
52. Epping MT, Hart AA, Glas AM, Krijgsman O, Bernards R. PRAME expression and clinical outcome of breast cancer. Br J Cancer. 2008;99(3):398–403. doi:10.1038/sj.bjc.6604494
53. Doolan P, Clynes M, Kennedy S, Mehta JP, Crown J, O′Driscoll L. Prevalence and prognostic and predictive relevance of PRAME in breast cancer. Breast Cancer Res Treat. 2008;109(2):359–365. doi:10.1007/s10549-007-9643-3
54. Epping MT, Wang L, Edel MJ, Carlee L, Hernandez M, Bernards R. The human tumor antigen PRAME is a dominant repressor of retinoic acid receptor signaling. Cell. 2005;122(6):835–847. doi:10.1016/j.cell.2005.07.003
55. Kurtenbach S, Sanchez MI, Kuznetsoff J, et al. PRAME induces genomic instability in uveal melanoma. Oncogene. 2024;43(8):555–565. doi:10.1038/s41388-023-02887-0
56. Yi J, Liu L, Chen Y, et al. RPGRIP1L as a new biomarker for prognosis and tumor immune of breast cancer. FASEB J. 2024;38(9):e23624. doi:10.1096/fj.202302523R
57. Wang Y, Zhou T, Chen H, Wen S, Dao P, Chen M. Rad54L promotes bladder cancer progression by regulating cell cycle and cell senescence. Med Oncol. 2022;39(12):185. doi:10.1007/s12032-022-01751-7
58. Guo K, Lai C, Shi J, et al. A novel risk factor model based on glycolysis-associated genes for predicting the prognosis of patients with prostate cancer. Front Oncol. 2021;11:605810. doi:10.3389/fonc.2021.605810
59. Kamali MJ, Salehi M, Mostafavi M, et al. Hijacking and rewiring of host CircRNA/miRNA/mRNA competitive endogenous RNA (ceRNA) regulatory networks by oncoviruses during development of viral cancers. Rev Med Virol. 2024;34(2):e2530. doi:10.1002/rmv.2530
60. Cao L, Wang M, Dong Y, et al. Circular RNA circRNF20 promotes breast cancer tumorigenesis and Warburg effect through miR-487a/HIF-1alpha/HK2. Cell Death Dis. 2020;11(2):145. doi:10.1038/s41419-020-2336-0
61. Wang L, Cho KB, Li Y, Tao G, Xie Z, Guo B. Long noncoding RNA (lncRNA)-mediated competing endogenous RNA networks provide novel potential biomarkers and therapeutic targets for colorectal cancer. Int J Mol Sci. 2019;20(22).
62. Zhang X, Pan B, Qiu J, et al. lncRNA MIAT targets miR-411-5p/STAT3/PD-L1 axis mediating hepatocellular carcinoma immune response. Int J Exp Pathol. 2022;103(3):102–111. doi:10.1111/iep.12440
63. Zhou Y, Qiu C, Fu Q, et al. Pan-cancer analysis of oncogenic role of RAD54L and experimental validation in hepatocellular carcinoma. J Inflamm Res. 2023;16:3997–4017. doi:10.2147/JIR.S426558
64. Xing Z, Zhang M, Wang X, et al. Silencing of Nek2 suppresses the proliferation, migration and invasion and induces apoptosis of breast cancer cells by regulating ERK/MAPK signaling. J Mol Histol. 2021;52(4):809–821. doi:10.1007/s10735-021-09979-9
65. Cui ZY, Park SJ, Jo E, et al. Cordycepin induces apoptosis of human ovarian cancer cells by inhibiting CCL5-mediated Akt/NF-kappaB signaling pathway. Cell Death Discov. 2018;4:62. doi:10.1038/s41420-018-0063-4
 © 2026 The Author(s). This work is published and licensed by Dove Medical Press Limited. The
full terms of this license are available at https://www.dovepress.com/terms
and incorporate the Creative Commons Attribution
- Non Commercial (unported, 4.0) License.
By accessing the work you hereby accept the Terms. Non-commercial uses of the work are permitted
without any further permission from Dove Medical Press Limited, provided the work is properly
attributed. For permission for commercial use of this work, please see paragraphs 4.2 and 5 of our Terms.
© 2026 The Author(s). This work is published and licensed by Dove Medical Press Limited. The
full terms of this license are available at https://www.dovepress.com/terms
and incorporate the Creative Commons Attribution
- Non Commercial (unported, 4.0) License.
By accessing the work you hereby accept the Terms. Non-commercial uses of the work are permitted
without any further permission from Dove Medical Press Limited, provided the work is properly
attributed. For permission for commercial use of this work, please see paragraphs 4.2 and 5 of our Terms.